- Molecular Cardiac Physiology Group, Department of Biomedical Physiology and Kinesiology, Simon Fraser University, Burnaby, BC, Canada
NaV channels play a crucial role in neuronal and muscle excitability. Using whole-cell recordings we studied effects of low extracellular pH on the biophysical properties of NaV1.2, NaV1.4, and NaV1.5, expressed in cultured mammalian cells. Low pH produced different effects on different channel subtypes. Whereas NaV1.4 exhibited very low sensitivity to acidosis, primarily limited to partial block of macroscopic currents, the effects of low pH on gating in NaV1.2 and NaV1.5 were profound. In NaV1.2 low pH reduced apparent valence of steady-state fast inactivation, shifted the τ(V) to depolarizing potentials and decreased channels availability during onset to slow and use-dependent inactivation (UDI). In contrast, low pH delayed open-state inactivation in NaV1.5, right-shifted the voltage-dependence of window current, and increased channel availability during onset to slow and UDI. These results suggest that protons affect channel availability in an isoform-specific manner. A computer model incorporating these results demonstrates their effects on membrane excitability.
Introduction
Extracellular pH is a major factor that controls activity of many physiological processes. Under normal physiological conditions, pH is maintained at approximately 7.4. Previous studies in vivo and in situ demonstrated that pathological conditions, such as hypoxia and/or ischemia considerably decrease extracellular pH. During focal ischemia in rabbit brain, extracellular pH drops to as low as 6.0 (Meyer, 1990). Physical exercise of medium-to-maximum intensity may decrease pH in human skeletal muscle to 6.4 (Hermansen and Osnes, 1972). Myocardial ischemia, including regional and global ischemia, can lower pH from 7.4 to 6.13 (Maruki et al., 1993). Acidification decreases peak conductance of voltage-gated sodium channels (NaV) by two mechanisms; protonation of outer vestibule carboxylates (Mozhayeva et al., 1984; Khan et al., 2002, 2006) and depolarizing the voltage-dependence of gating by surface charge screening (Hille, 1968; Benitah et al., 1997). Unlike neuronal (NaV1.2) and skeletal muscle (NaV1.4) subtypes, the cardiac sodium channel subtype (NaV1.5) may exhibit persistent Na currents (INaP) in response to low extracellular pH, which is considered to be a predisposing factor for cardiac arrhythmias (Amin et al., 2010). The INaP induced by low pH in only NaV1.5 raises a question regarding the possible specificity of pH effects on different NaV subtypes.
In this study we report differential effects of low pH on kinetic properties of fast, slow, and UDI in NaV1.2, NaV1.4, and NaV1.5 channels. Using whole-cell patch-clamp recordings, we found that low pH modified properties of NaV1.2 inactivation resulting in decreased maximum availability during prolonged depolarization trains. Under similar conditions, NaV1.5 demonstrated enhanced maximum availability. NaV1.4 was relatively unaffected by low pH. Using computer modeling, we found that low pH produces opposing effects on action potential (AP) generation: inhibitory for neuronal APs and excitatory for cardiac APs.
Some of these data have been presented previously in abstract form (Vilin and Ruben, 2010).
Materials and Methods
Chinese hamster ovary (CHO) cells stably expressing the rat NaV1.2 channel (a gift from W. A. Catterall) were grown in filtered sterile DMEM (Gibco) with glutamine, supplemented with 2 g/L NaCHO3, 100 units/ml penicillin, 0.01 mg/ml streptomycin, 50 mg/ml G418 at pH 7.4, 5% FBS and maintained in a humidified environment at 37°C with 5% CO2. Human Embryonic Kidney (HEK293; Cedarlanes) were transiently transfected with DNA encoding NaV1.4 and NaV1.5 α-subunits using the PolyFect kit (Qiagen). Channel expression was confirmed with EGFP. HEK293 cells were maintained under the same conditions with the exclusion of G418 from media. Twenty-four hours prior to electrophysiology experiments, cells were dissociated with 0.25% trypsin-EDTA (Gibco) and then plated on sterile cover slips at a density conducive to patch-clamp experiments. Whole-cell recordings were performed in a chamber containing (in mM): 140 NaCl, 4 KCl, 2 CaCl2, 1 MgCl2, 10 HEPES, pH 7.4, using pipettes fabricated with a P-1000 puller using borosilicate glass (Sutter Instruments, CA, USA), dipped in dental wax to reduce capacitance, then thermally polished to a resistance of 1.1–1.2 MΩ. Pipettes were filled with intracellular solution, containing (in mM): 120 CsF, 20 CsCl, 10 NaCl, 10 HEPES, pH 7.4.
All recordings were made using an EPC-9 patch-clamp amplifier (HEKA, Lambrecht, Germany) digitized at 20 kHz via an ITC-16 interface (Instrutech, Great Neck, NY, USA). Voltage clamping and data acquisition was controlled and low-pass-filtered (5 kHz) using PatchMaster/FitMaster software (HEKA Elektronik, Lambrecht, Germany) running on Apple iMac. Leak subtraction was performed automatically by software using a P/4 procedure following the test pulse. Leak subtraction was performed off-line in slow inactivation experiments. Bath solution was maintained at 22.0 + 0.2°C using a Peltier device controlled by an HCC-100A temperature controller (Dagan, Minneapolis, MN, USA). Giga-seals were allowed to stabilize in the on-cell configuration for 1 min prior to establishing the whole-cell configuration. All data were acquired >5 min after attaining the whole-cell configuration. Holding potential between protocols was −60 mV.
Fitting and graphing were done using FitMaster software (HEKA Elektronik, Lambrecht, Germany) and Igor Pro (Wavemetrics, Lake Oswego, OR, USA) with statistical information derived using InStat (Graphpad Software Inc., San Diego, CA, USA). All data acquisition programs were run on an Apple iMac computer (Apple Computer, Cupertino, CA, USA).
Conductance [G(V)] curves were calculated from the equation:
where G is conductance, Imax represents peak test pulse current, Vm is the test pulse voltage, and ENa is the measured equilibrium potential. The midpoint and apparent valence of activation were derived by fitting the G(V) curves with a Boltzmann equation:
where the normalized conductance G/Gmax is derived from Eq. 1, VM is the test potential, z is the apparent valence, e0 is the elementary charge, V1/2 is the midpoint voltage, k is the Boltzmann constant, and T is temperature in °K.
Descriptions of test pulse inactivation rates given as time constants (t) were derived using monoexponential or double exponential fits with following the equations:
where I(t) is current amplitude as function of time, Offset is the amplitude plateau (asymptote), a1 and a2 are the components for the corresponding time constants (τ) τ1 and τ2 is the time constant (in s or ms). Steady-state FI (SS-FI) probability between activated and non-inactivated states were fit using the Boltzmann equation:
where Imax is the maximum normalized current amplitude, z is apparent valence, e0 is the elementary charge, Vm is the prepulse potential, V1/2 is the midpoint voltage of the SS-FI curve, k is the Boltzmann constant, and T is absolute temperature. Steady-state slow inactivation (SS-SI) curves were fit with the following modified Boltzmann equation that takes into account changes in the steady-state probability of slow inactivation:
where I/Imax is the maximum probability, I1 and I2 are maximum and minimum values in the fit, respectively, z is apparent valence, e0 is the elementary charge, Vm is the prepulse potential, V1/2 is the midpoint voltage of the SS-SI curve, k is the Boltzmann constant, and T is degrees Kelvin.
Window current areas were analyzed by converting activation and inactivation curves to percents (Wang et al., 1996) and calculating the area under both curves by integration using MS Excel; the position of area peak was estimated in Igor Pro.
The descriptions of first-order, two-state reaction kinetics were derived by fitting τ vs. voltage curves according to the following equation:
where τ(Vm) represents the time constant of progression to equilibrium as a function of membrane potential; kf is the rate of the forward reaction (not inactivated:inactivated), and kb is the rate of the backward reaction (inactivated:not inactivated).
where A = 1/2 rate at V0, e = total reaction valence (in electronic charge); d = fractional barrier distance; Vm = membrane potential (in mV); V1/2 = midpoint potential (in mV); k = Boltzmann constant, and T = temperature in degrees Kelvin.
Neuronal Action Potential Model
The neuronal AP model was programmed using Python operating language and the module NumPy (Enthought). The sodium current was modeled following the formulas of Hodgkin and Huxley(1952; Eq. 10), with 0 mV defined as an absolute value, instead of the resting membrane potential.
where INa is the fast sodium current, GNa is the maximal sodium conductance value, m is the conductance gate, h is the FI gate, j is the slow inactivation gate, V is the membrane potential, and ENa is the Nernst potential for sodium.
The conductance (m) gate and FI (h) gate steady-states (see Eqs A4 and A5 in Appendix) were fit to the experimental data using Eqs 2 and 5, respectively. The steady-state of the slow inactivation (j) gate (see Eq. A7 in Appendix) was fit to Eq. 6. Activation time constants were chosen to be constant following previously published reports (Spampanato et al., 2001, 2003). The time constant vs. voltage curve of FI (see Eq. A6 in Appendix) was fit to an asymmetric inverse hyperbolic cosine function (Eq. 11).
where τ is the time constant, Tmax is the maximum time constant, V1/2 is the membrane potential at which the maximal time constant occurs, and k1 and k2 are the slopes of the left and right halves of the curve.
Slow inactivation time constants (see Eq. A8 in Appendix) were fit in the same method as (Spampanato et al., 2001, 2003) with a Gaussian distribution (Eq. 12).
where τ is the time constant, Tmax is the maximum time constant, V1/2 is the membrane potential at which the maximal time constant occurs, and k1 is the slope factor of the curve.
A non-inactivating potassium current (Eqs A9–A13 in Appendix) and maximal conductance, Nernst potential, and cell capacitance parameters were used based on previously published formulas (Yuen and Durand, 1991; Spampanato et al., 2001, 2003). Stimulation protocols were done with a continuous stimulation over 105 ms at amplitudes ranging from −1 to −20 pA/pF.
Cardiac Action Potential Model
The original ten Tusscher model (Ten Tusscher et al., 2004) was programmed into Python code making use of the module NumPy (Enthought). The code was then updated to include calcium current and slow delayed potassium current equations (Ten Tusscher and Panfilov, 2006). A late persistent sodium current was added (Eqs A24–A29 in Appendix; Hund and Rudy, 2004). The maximal sodium conductance value was replaced with the Luo–Rudy passive model value to better reflect our experimental data (Luo and Rudy, 1991). The slow delayed rectifier potassium conductance (GKs; Eq. A30 in Appendix) was changed to incorporate the role of internal calcium concentrations on gKs (Terrenoire et al., 2005). The late sodium maximal conductance value was changed to reflect the data collected by (Zygmunt et al., 2001). The sodium current was modeled using Eq. 10. Our sodium channel conductance steady-states at both pH 7.4 and pH 6.0 (Eq. A14 in Appendix) were fit with Eq. 2 with the conductance value multiplied by the proton block in the pH 6.0 model. FI steady-state curves at both pH values (Eq. A18 in Appendix) were fit with Eq. 5. Slow inactivation steady-states curves at both pH values (Eq. A20 in Appendix) were fit with Eq. 6. Time constants of FI at both pH values (Eq. A19 in Appendix) were fit to an asymmetric inverse hyperbolic cosine function, Eq. 11. Activation and slow inactivation time constants (Eqs A15–A17 and A21–A23 in Appendix) were as described by the ten Tusscher model. The sodium channel parameters were then Q10 adjusted following the methods used in the model (Ten Tusscher and Panfilov, 2003) which used the work of Nagatomo et al. (1998). The simulation was run as an endocardial ventricular myocyte with a 1-ms stimulus pulse of amplitude −60 pA/pF. The stimulus protocol had a cycle length of 400 ms for the first 15 APs, 350 ms for the next 15, 325 ms for the next 10, and 300 ms for all subsequent APs. This was done to step the stimulus rate up to 3.33 Hz gradually and allow AP shortening. AP parameters were measured at both 2.5 Hz (150 beats per minute) and 3.33 Hz (200 beats per minute) to study the AP properties that acidosis of the cardiac voltage-gated sodium channel modulates at high heart rates. Measurements of APD were obtained from the time of stimulus to the time at which the membrane potential reaches a value of −70 mV. Maximal depolarization rise rates were measured as the maximum slope between two sequential membrane potentials after the stimulus current was ended. Equations modified from the original Tusscher model are listed in the Appendix.
All statistical values, both in the text and in the figures, are given as means ± standard error of the mean (SEM). Statistical differences were derived from Student’s t-test using the Instat software package (GraphPad Software, Inc., San Diego, CA, USA).
Results
Effects of Low pH on Activation and Steady-State FI in NaV1.2, NaV1.4, NaV1.5
Previous studies demonstrated that acidic pH decreases the amplitude of macroscopic sodium currents. Figures 1A,D,G show typical families of NaV1.2, NaV1.4, and NaV1.5 recorded at control pH 7.4 in response to a depolarizing pulse protocol shown in insets of Figure 1. The current amplitude decreased in all three channel isoforms when pH was lowered to 6.0 (Figure 1, compare Figures 1A,Ai,D,Di,G,Gi). Amplitudes decreased by 32 ± 5, 35 ± 4.3, and 53 ± 7% for NaV1.2, NaV1.4, and NaV1.5, respectively. In contrast to NaV1.2 and NaV1.4, the decay of macroscopic currents in NaV1.5 at pH 6.0 was slower (denoted with the arrow in Figure 1Gi) compared to the control family of currents at pH 7.4 (Figure 1G). These results suggest that low pH alters properties of open-state inactivation.
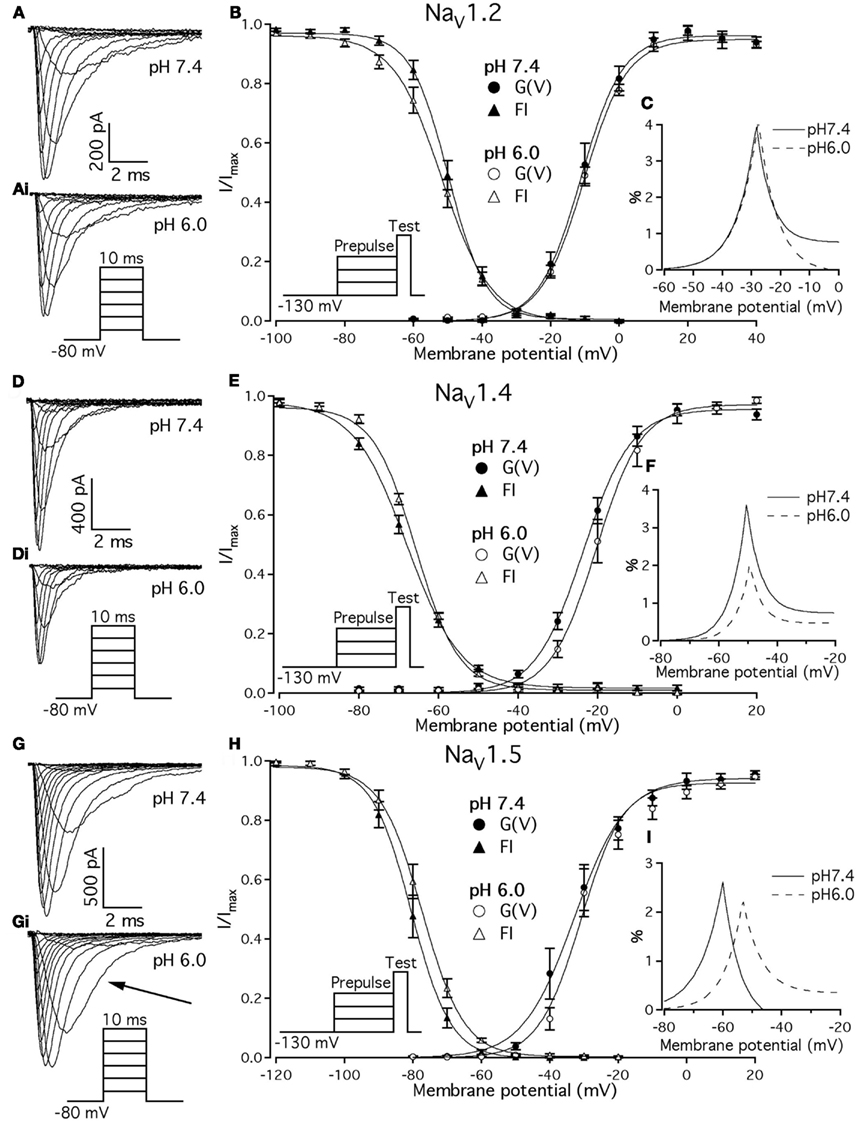
Figure 1. Effects of pH on macroscopic ionic currents and window currents in NaV1.2, NaV1.4, and NaV1.5. (A,Ai) Families of NaV1.2 currents in response to the pulse protocol (Ai, inset) at pH 7.4 (A) and pH 6.0 (Ai). (B) NaV1.2 G(V) curves (triangles) and steady-state FI curves (circles) are plotted as a function of membrane potential at pH 7.4 (filled symbols) and at pH 6.0 (open symbols). (C) Shows magnified window current area at pH 7.4 (solid lines) and at pH 6.0 (dotted lines). Values in (C) were converted to percents. (D,Di) Show families of NaV1.4 currents in response to the pulse protocol (Di, inset) at pH 7.4 (D) and pH 6.0 (Di). (E) NaV1.4 G(V) curves (triangles) and steady-state FI curves (circles) are plotted vs. membrane potential at pH 7.4 (filled symbols) and at pH 6.0 (open symbols). (F) Shows magnified window current area at pH = 7.4 (solid lines) and at pH 6.0 (dotted lines). Values in (F) are in percents. (G) Gi show families of NaV1.5 currents in response to the pulse protocol (Gi, inset) at pH 7.4 (G) and pH 6.0 (Gi). (H) NaV1.5 G(V) curves (triangles) and steady-state FI curves (circles) are plotted vs. membrane potential at pH 7.4 (filled symbols) and at pH 6.0 (open symbols). (I) Shows magnified window current area at pH 7.4 (solid lines) and at pH 6.0 (dotted lines). Values in (I) are in percents. Solid lines in (B,E,H) are Boltzmann fits to corresponding datapoints in (B,E,H) (Eq. 2 in Materials and Methods). Data represent mean ± SEM (n = 9–12).
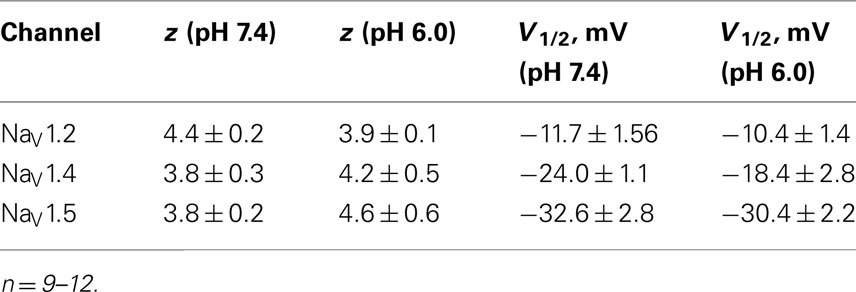
We examined the effects of low pH on activation in NaV1.2, NaV1.4, and NaV1.5. Data in Figures 1B,E,H represent normalized control maximum conductance derived from I(V) relationships at pH 7.4 (filled circles) and pH 6.0 (open circles). Normalized conductance was plotted as a function of membrane potential and fit with the Boltzmann function (Eq. 1, Materials and Methods) to obtain values for V1/2 and apparent valence (z). The G(V) parameters we measured are shown in Table 1. At pH 6.0 the apparent valence of activation in NaV1.5 was significantly increased (p < 0.05). The V1/2 of activation in NaV1.5 was unaffected by low pH. In contrast, neither apparent valence nor the V1/2 in NaV1.2 and NaV1.4 were altered by low pH (p > 0.05, Figures 1B,E, respectively).
To quantify the effects of low pH on voltage-dependent steady-state channel availability in fast-inactivated state, we compared the apparent valence (z) and V1/2 from Boltzmann fits (Eq. 5, Materials and Methods) to steady-state FI data for NaV1.2 (Figure 1B), NaV1.4 (Figure 1E), and NaV1.5 (Figure 1H) at pH 7.4 (filled triangles) and at pH 6.0 (open triangles). These data represent averaged, normalized current amplitudes obtained with a test pulse to 0 mV following a 500-ms prepulse (pulse protocol is shown in insets). Normalized current amplitudes were plotted as a function of prepulse potential. At pH 6.0 the apparent valence of steady-state FI in NaV1.2 was reduced from that at pH 7.4 to the value measured at pH 6.0 (n = 11). The V1/2 of inactivation was not affected by low pH (Table 2). Low pH had no effect on steady-state FI in NaV1.4 (Table 2). In NaV1.5 the apparent valence was not altered at pH 6.0, but the V1/2 was depolarized compared to the V1/2 at pH 7.4.
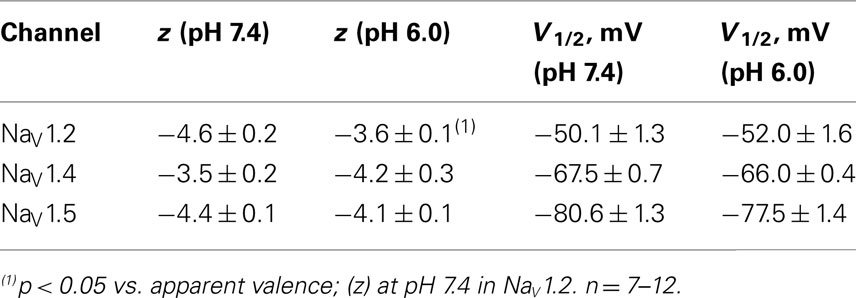
Table 2. Parameters of steady-state fast inactivation in NaV1.2, NaV1.4, and NaV1.5 at pH 7.4 and 6.0.
Changes in activation and steady-state inactivation slope and V1/2 may alter the area of overlap between activation and steady-state FI curves, known as “window current.” We studied this possibility by comparing this area at both pH 7.4 and 6.0 for NaV1.2, NaV1.4, and NaV1.5. Figures 1C,F,I shows window current at pH 7.4 (solid line) and at pH 6.0 (dotted line) of NaV1.2, NaV1.4, and NaV1.5, respectively. Data in these graphs were converted to percents (Wang et al., 1996) and plotted as a function of membrane potential. To compare the effects of pH on window currents, window currents were analyzed as described in Materials and Methods to find the area and peak position relative to membrane potential on the horizontal axis. Low pH had no significant effect on window currents in NaV1.2 (Figure 1C, p > 0.05). Window current area in NaV1.4 (Figure 1E) was reduced at pH 6.0 by 47 ± 4.5% (p < 0.05), however peak position was not changed: −51 ± 1.3 mV at pH 7.4 vs. −49 ± 1.0 mV at pH 6.0. Window current area in NaV1.5 was not significantly altered by low pH, but the peak was shifted from −60.4 ± 0.7 mV (pH 7.4) to −53 ± 0.8 mV (1I, p < 0.05). The latter finding indicates a possible destabilization of FI gating in NaV1.5 at low pH.
Open-State Fast Inactivation in NaV1.5 is Decelerated at pH 6.0
As shown above, the decay of NaV1.5 macroscopic currents was decelerated at pH 6.0. We asked whether this effect is specific to NaV1.5. Figure 2 compares the effects of pH on open-state FI (FI) in NaV1.2, NaV1.4, and NaV1.5. Data in Figures 2A–C represent time constants of open-state FI derived from exponential fits to decay of macroscopic current recorded from NaV1.2 (Figures 2Ai,Aii), NaV1.4 (Figures 2Bi,ii), NaV1.5 (Figure 2Ci,ii) at pH 7.4 and pH 6.0. Pulse protocols are shown in Figures 2Aii,Bii,Cii insets. Time constants were plotted as a function of membrane potential and fitted with single exponential for visual guidance. Figure 2A shows that time course of open-state inactivation in NaV1.2 at pH 7.4 (filled circles) is statistically identical (p > 0.05) to that at pH 6.0 (open circles). Similarly to NaV1.2, the open-state inactivation in NaV1.4 (Figure 2B) at pH 7.4 (filled circles) was not affected (p > 0.05) by low pH (open circles). However, the time course of open-state inactivation in NaV1.5 at pH 6.0 (Figure 2C, open circles) was significantly slower than that recorded at pH 7.4 (Figure 2C, filled circles, asterisks denote p < 0.05), also see Figures 2Ci,ii arrow. Thus, data in Figure 2 suggest that deceleration of rate of open-state FI due to low pH is specific to NaV1.5, and is not seen in NaV1.2 or NaV1.4.
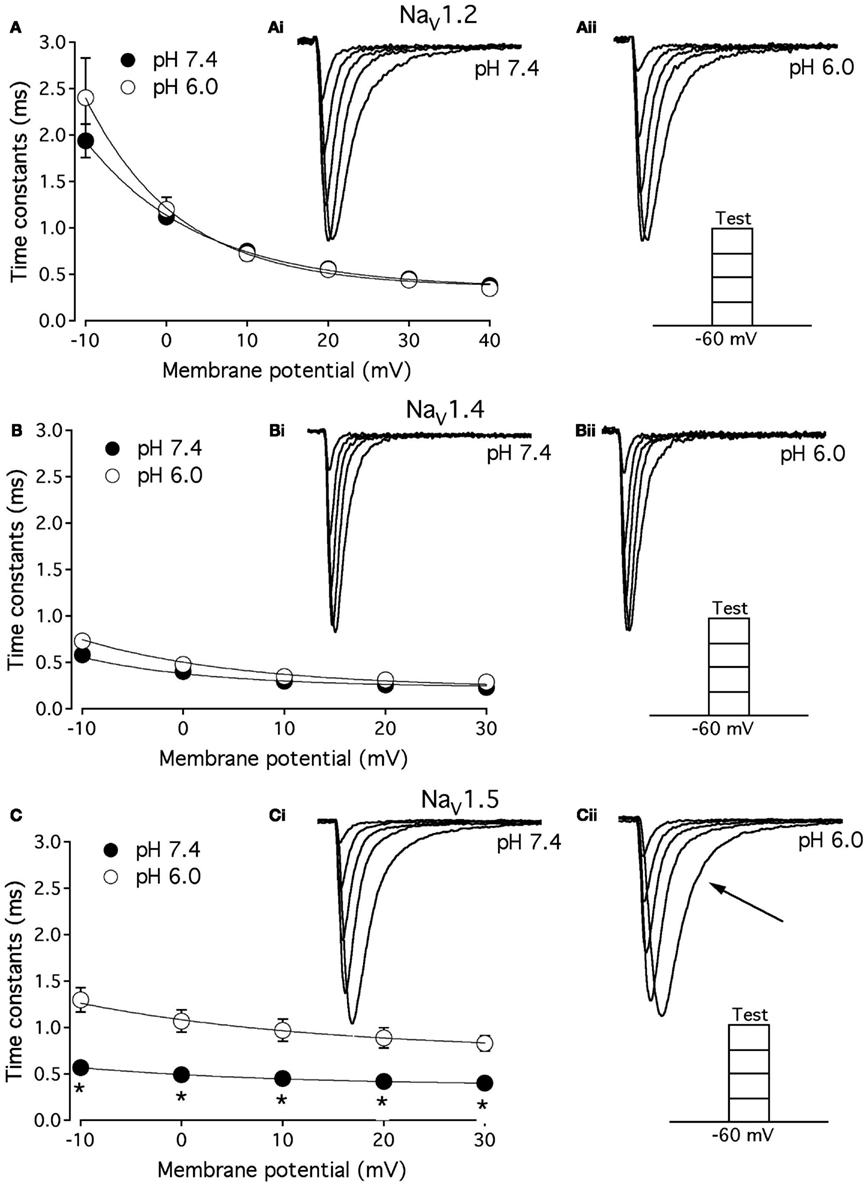
Figure 2. Low pH decelerates kinetics of open-state inactivation in hNaV1.5. (A) Open-state inactivation time constants in NaV1.2 at pH 7.4 (filled circles) and pH 6.0 (open circles) are derived from single exponential fits (not shown) to the decay of currents in (Ai,Aii). (B) Open-state inactivation time constants in NaV1.4 at pH 7.4 (filled circles) and pH 6.0 (open circles) are derived from single exponential fits (not shown) to the decay of currents in (Bi,Bii). (C) Open-state inactivation time constants in NaV1.5 at pH 7.4 (filled circles) and pH 6.0 (open circles) are derived from single exponential fits (not shown) to the decay of currents in (Ci,Cii). Arrow in Cii denotes deceleration of current decay in NaV1.5 at pH 6.0. Asterisks denote p < 0.05 between open states FI at pH 7.4 (filled circles) and pH 6.0 (open circles). Data in (A–C) are fitted with single exponential for visual guidance. Data represent mean ± SEM (n = 15).
Low pH Alters Voltage-Dependence of Fast Inactivation Time Constants in NaV1.2, NaV1.4, and NaV1.5
We studied effects of pH on the time course of recovery from fast-inactivated state (Figure 3), onset to FI (Figure 4), and consequently, the τ(V) dependence of FI (Figure 5). The rate of recovery from FI was studied using a double-pulse protocol (shown in Figure 3, inset). The fraction of recovered channels was measured from the peak current during a 0-mV test pulse. The current amplitude following recovery was normalized to the current amplitude during a pulse to 0 mV from −130 mV, a voltage at which all channels should be available (not inactivated). Recovery from FI in NaV1.2, NaV1.4, and NaV1.5 was recorded with interpulse voltages from −120 to −80 mV. The rate of recovery from fast inactivation was greater in all three channel isoforms at low pH. Figure 3 shows the time course of recovery from fast inactivation at pH 7.4 (filled circles) and at pH 6.0 (open circles) in NaV1.2 (Figure 3A), NaV1.4 (Figure 3B), and NaV1.5 (Figure 3C). Data represent averaged and normalized current amplitudes recorded in response to test pulse following a −80-mV interpulse (see pulse protocol diagram in Figure 3 inset), plotted as a function of interpulse duration (ms). For clarity, recovery data for other interpulse voltages are not shown. Solid lines are single exponential fits (Eq. 3), used to extract time constants to compare recovery at pH 7.4 and pH 6.0. We also found that more NaV1.4 channels are available for recovery at the beginning (t = 0) of interpulse (Figure 3B, filled circles, arrow) at pH = 7.4 compared to pH = 6.0 (open circles, Figure 3B).
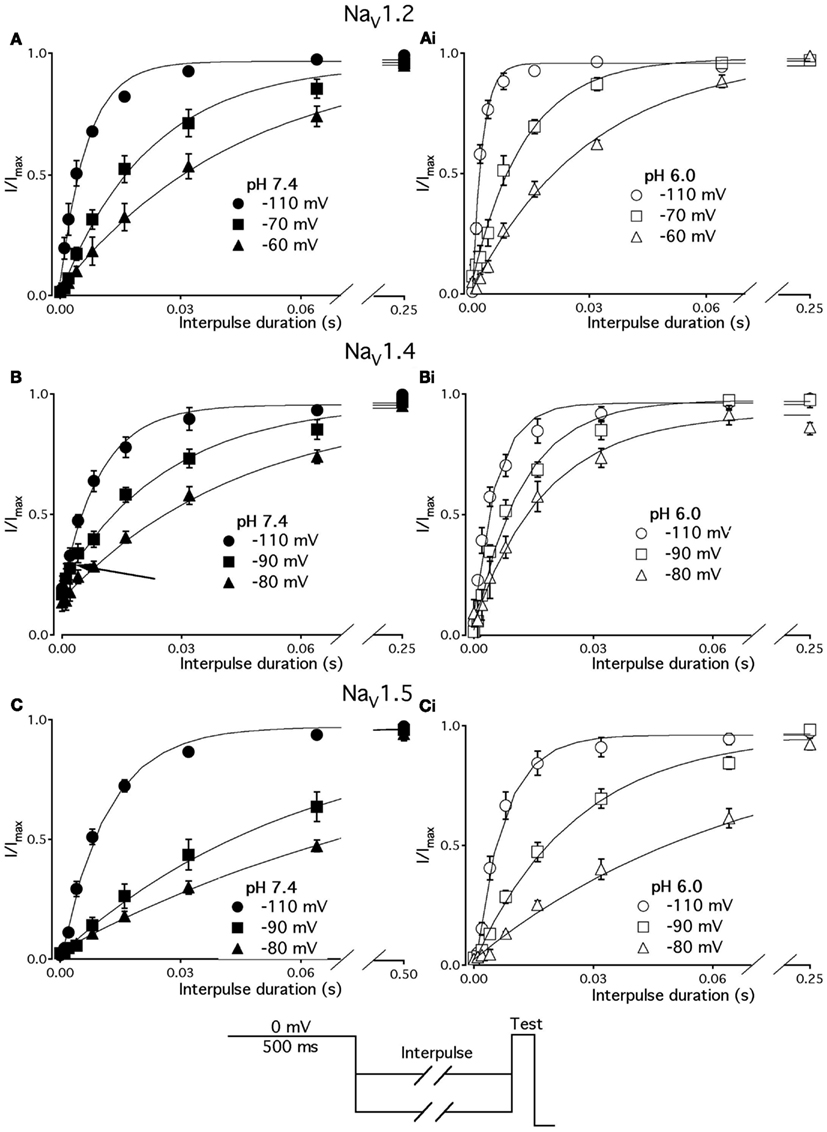
Figure 3. Low pH accelerates recovery from FI. (A–C) The time course of recovery from FI at pH 7.4 (filled circles) and at pH 6.0 (open circles) for NaV1.2, NaV1.4, and NaV1.5, respectively. The averaged, normalized currents obtained during 0 mV test pulse, following an interpulse of increasing duration over a range of potentials (−130 to −80 mV, pulse protocol is shown at the bottom) are plotted vs. interpulse duration and fit with single exponential. Solid lines are single exponential fits to datapoints (Equation, Materials and Methods). Data for only −80 mV prepulse are shown. Data represent mean ± SEM (n = 10–12).
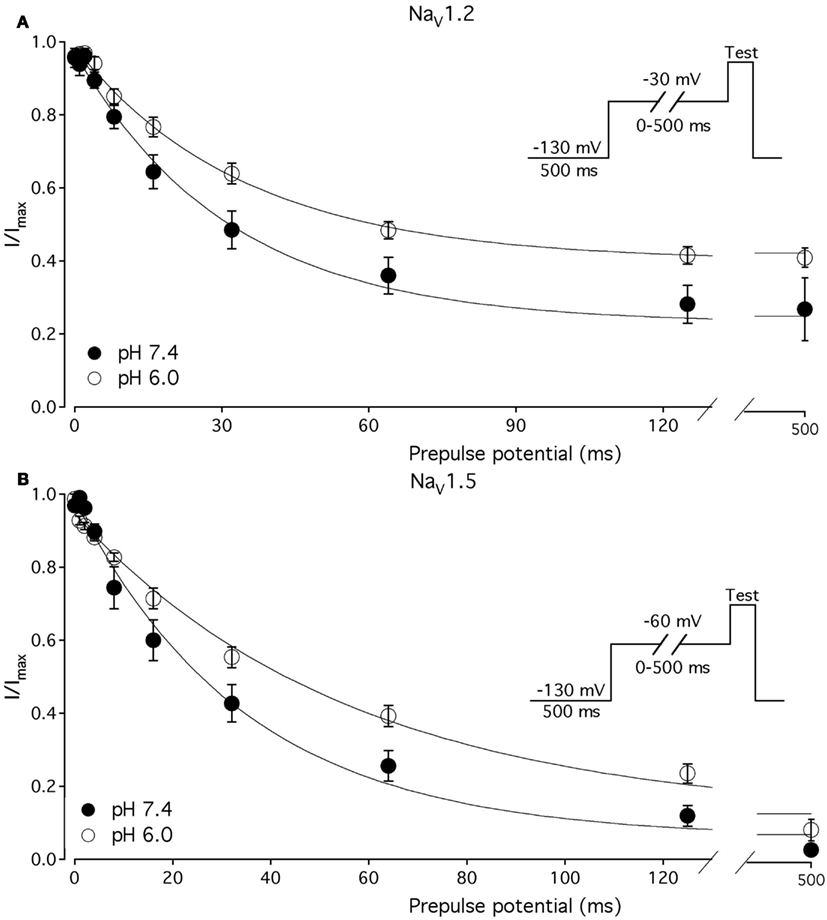
Figure 4. Low pH slows the rate of onset to FI in NaV1.2 and NaV1.5. (A) The time course of onset to FI in NaV1.2 at pH 7.4 (filled circles) and at pH 6.0 (open circles). Data represent averaged and normalized current peaks recorded during test potential following the −30 mV prepulse of variable duration (0–500 ms) plotted vs. prepulse potential. Diagram of used pulse protocols shown in (A), inset. (B) The time course of onset to FI in NaV1.5 at pH 7.4 (filled circles) and at pH 6.0 (open circles). Data represent averaged and normalized current peaks recorded during test potential following the −60-mV prepulse of variable duration (0–500 ms) plotted vs. prepulse potential. Diagram of used pulse protocols shown in (B), inset. Solid lines are single exponential fits (Eq. 3, Materials and Methods). Data represent mean ± SEM (n = 10–12)
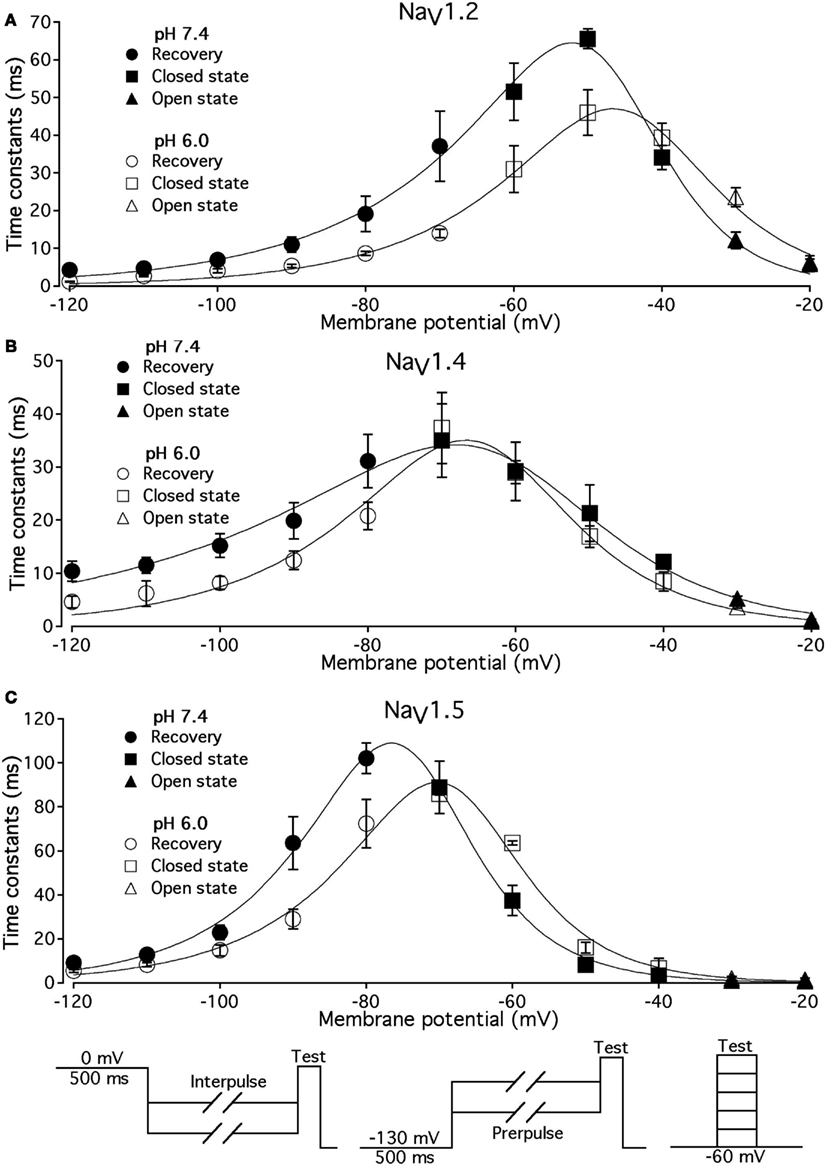
Figure 5. Low pH alters the voltage dependency of FI time constants in NaV1.2, NaV1.4, and NaV1.5. Time constants of FI in NaV1.2 (A), NaV1.4 (B), and NaV1.5 (C) were derived from single exponential fits to recovery, onset, and decay of macroscopic currents in response to pulse protocols shown at the bottom (also see Materials and Methods) and plotted vs. membrane voltage. Circles represent recovery time constants, squires represent time constants of closed-state inactivation and triangles denote time constants for the open-state inactivation. Filled symbols represent time constants obtained at pH = 7.4 and open symbols represent time constants at pH 6.0. The solid lines are predictions of a first-order reaction model (inactivated ↔ not inactivated, Materials and Methods). Diagrams at the bottom of Figure depict pulse protocols used in this series of experiments. Data represent mean ± SEM (n = 10–12).
The effects of low pH on the rate of FI onset (Figure 4) were studied by measuring the test pulse current amplitude after a 0- to 500-ms prepulse of defined voltage (see protocol diagrams in Figures 4A,B). In response to increasing duration of prepulse, the fraction of inactivated channels, assayed with 0 mV test pulse is increased, as shown in Figures 4A,B. Data in Figure 4 are normalized and averaged test pulse currents plotted as a function of prepulse duration. The rate of onset (given as a time constant) and steady-state fraction of inactivated channels (given as an asymptote) was quantified by fitting data with single exponential (Eq. 3). Onset of FI in NaV1.4 at pH 7.4 was not different (p < 0.05) from that at pH 6.0 at prepulse potentials of −70, −60, −50, and −40 mV (data not shown). However, the onset to FI in NaV1.2 (Figure 4A) and in NaV1.5 (Figure 4B) was differentially affected by low pH. A direct comparison of pH effects on FI onset between NaV1.2 and in NaV1.5 at pH = 7.4 (filled circles) and at pH = 6.0 (open circles) was confounded by an isoform- and pH-dependent difference in the peak of the τ(V) curve (shown in Figure 5). The steady-state fraction of inactivated channels in NaV1.2, NaV1.4, and NaV1.5 was not altered by low pH (p > 0.05, data not shown).
Different voltage protocols were used in NaV1.2 and NaV1.5 to assess the effects of pH on the onset of fast inactivation, as shown in Figure 4, because of a difference in τ(V) relationships between these two isoforms. As shown in Figure 5, the τ(V) for NaV1.2 is depolarized relative to NaV1.5. Had we compared −60 mV for both isoforms, we would have measured recovery from fast inactivation in NaV1.2 and onset of fast inactivation in NaV1.5. We chose to compare −30 mV in NaV1.2 with −60 mV in NaV1.5 because of their similar positions relative to the peak of their respective τ(V) curves, as seen in Figure 5.
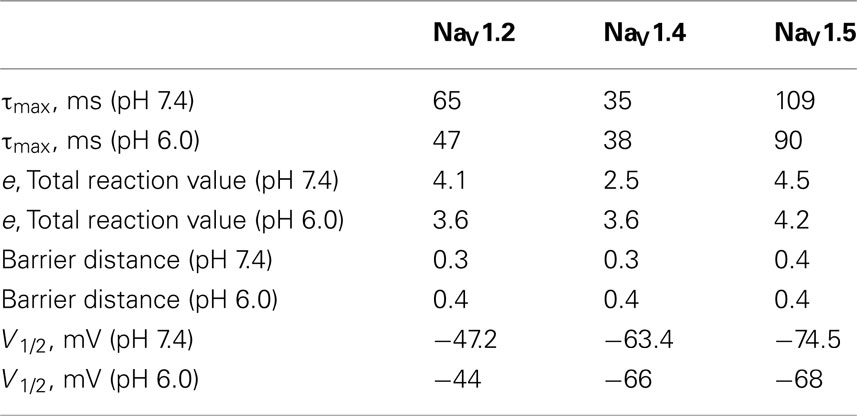
In Figure 5, the averaged time constants of FI recovery (circles), closed-state FI onset (squares), and open-state FI onset (triangles) are plotted as a function membrane (interpulse and prepulse) potential at pH 7.4 (solid symbols) and pH 6.0 (open symbols). The averaged time constants were fit using a two-state (not inactivated ↔ inactivated) Eyring first-order reaction model (solid lines, Eqs 7–9, Materials and Methods). The coefficients of fits to FI time constants are summarized in Table 3. Low pH strongly affects the τ(V) in NaV1.2 and NaV1.5 by accelerating rate of recovery from FI, slowing rate entry to FI and producing depolarizing shift in maximum of τ(V) curve. In contrast, effects of low pH on τ(V) in NaV1.4 are limited to an increase in the rate of recovery from FI (Figure 5B).
pH Differentially Alters Slow Inactivation in NaV1.2 and NaV1.5
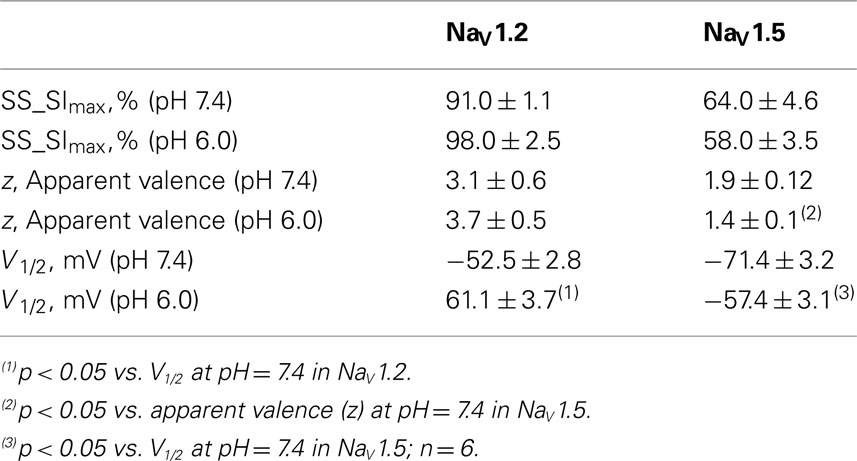
We compared the effects of low pH on steady-state slow inactivation (SS-SI) in NaV1.2, NaV1.4, and NaV1.5 (Figure 6). SS-SI was measured using a 60-s prepulse followed by a 20-ms, −150 mV FI recovery pulse immediately before the 0-mV test. After the test pulse, channels were hyperpolarized to −130 mV for 30 s before every prepulse to completely recover channels from both fast and slow inactivation (Featherstone et al., 1996). Data points represent averaged and normalized amplitudes of currents recorded during test pulse (see pulse protocol diagram in Figure 6 inset). Figure 6A shows SS-SI in NaV1.2 at pH 7.4 (filled circles) and pH 6.0 (open circles). Figure 6B shows SS-SI in NaV1.5 at pH 7.4 (filled squares) and at pH 6.0 (open squares). Data are plotted as a function of prepulse potential. Data sets were fitted with modified Boltzmann function (Figure 6, solid lines, Eq. 6, Materials and Methods) to obtain values for maximum probability, apparent valence (z), and V1/2, summarized in Table 4. Data in Figure 6 were closely matched by asymptotic values of exponential fits to the data in Figures 7A,C at corresponding voltages (−50 mV).
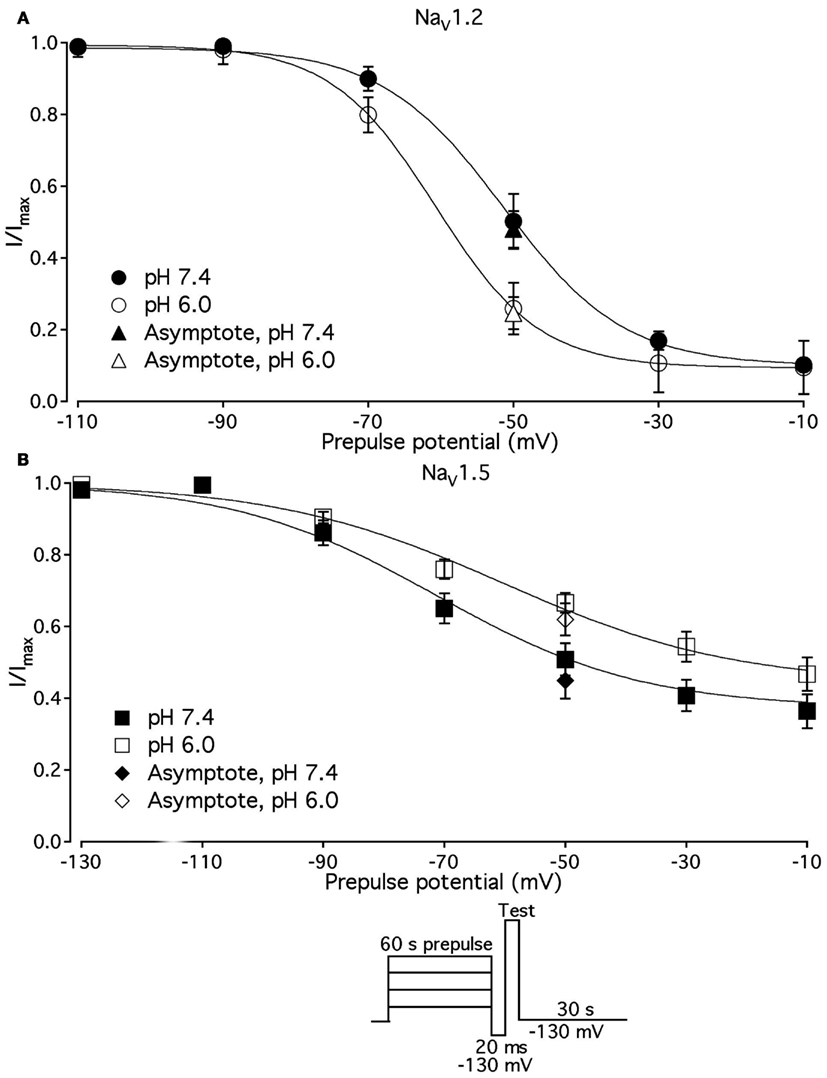
Figure 6. Low pH alters properties of slow inactivation in NaV1.2 and in NaV1.5. (A) Steady-state slow inactivation in NaV1.2 at pH 7.4 (filled circles) and at pH 6.0 (open circles) is plotted as averaged normalized current amplitude vs. 60-s prepulse voltage. Asymptotic values for NaV1.2 derived from double exponential fit to slow inactivation onset (B) at pH 7.4 (filled triangles) and at pH 6.0 (open triangles) are superimposed with steady-state slow inactivation data at corresponding prepulse voltage (−50 mV). (B) Steady-state slow inactivation in NaV1.5 at pH 7.4 (filled squares) and at pH 6.0 (open squares) is plotted as averaged normalized current amplitudes vs. 60-s prepulse voltage. Asymptotic values for NaV1.5 derived from double exponential fits to slow inactivation onset (B) at pH 7.4 (filled triangles) and at pH 6.0 (open triangles) are superimposed with steady-state slow inactivation data at corresponding prepulse voltage (−50 mV). Data were obtained with pulse protocol shown in (B) inset and fit with a modified Boltzmann function (Eq. 6, Material and Methods). Data represent mean ± SEM (n = 7–10).
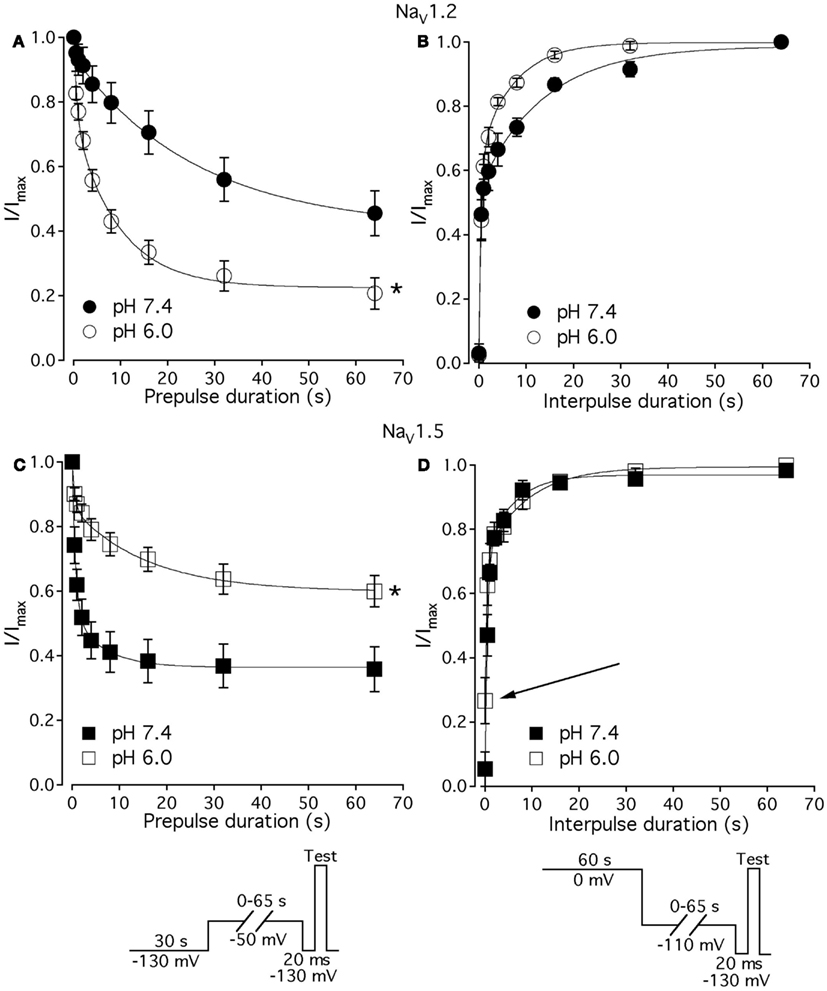
Figure 7. Low pH alters kinetics of slow inactivation in NaV1.2 and in NaV1.5. (A) The time course of slow inactivation onset in NaV1.2 at pH 7.4 (filled circles) and at pH 6.0 (open circles) is plotted vs. prepulse voltage as averaged and normalized currents, obtained with pulse protocol shown in (C) inset. (B) The time course of recovery from slow inactivation in NaV1.2 at pH 7.4 (filled circles) and at pH 6.0 (open circles) is plotted vs. interpulse voltage as averaged and normalized currents, obtained with pulse protocol in (D) inset. (C) The time course of slow inactivation onset in NaV1.5 at pH 7.4 (filled squares) and at pH 6.0 (open squares). (D) The time course of recovery from slow inactivation in NaV1.5 at pH 7.4 (filled squares) and at pH 6.0 (open squares). Data represent mean ± SEM (n = 7–10). Asterisks denote statistical difference (p < 0.05).
Our results revealed no significant differences in properties of SS-SI in NaV1.4 recorded at pH 7.4 and at pH 6.4 (data not shown). However, low pH produced shifts in V1/2: hyperpolarizing for NaV1.2 and depolarizing for NaV1.5 (see Table 4).
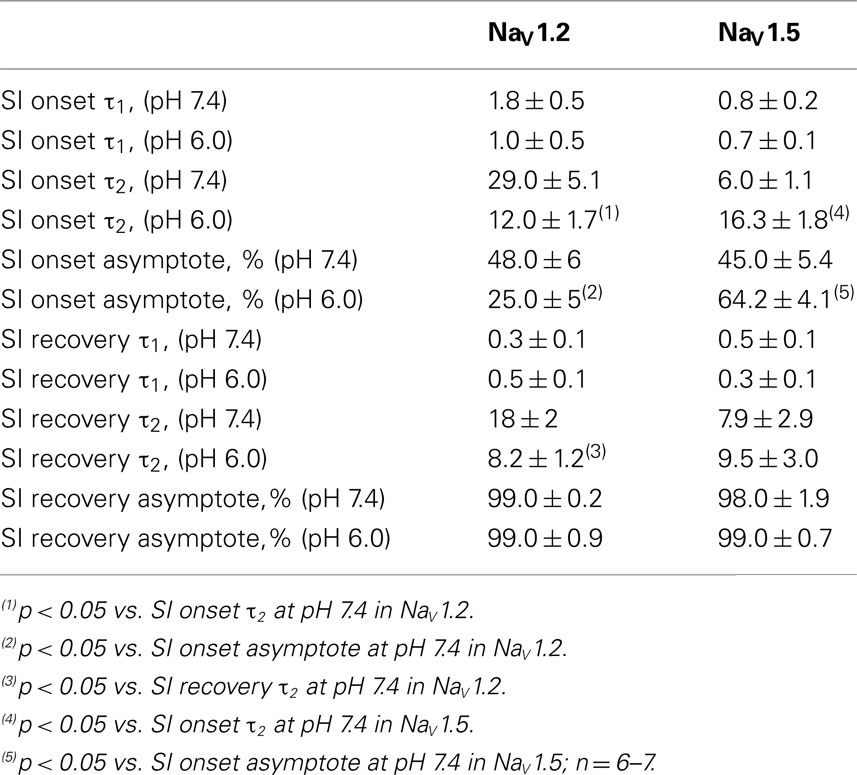
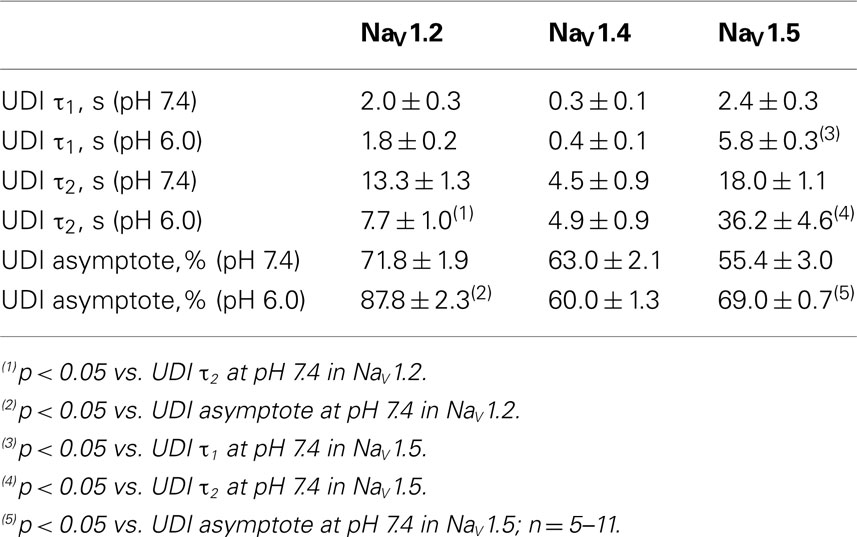
Figures 7A,C show time course of onset of SI in NaV1.2 at pH 7.4 (filled circles) and at pH 6.0 (open circles) and in NaV1.5 at pH 7.4 (filled squares) and at pH 6.0 (open squires), respectively. The onset of SI was assessed by recording peak currents during the test pulse preceded by −50 mV prepulse of varied duration (0–64 s). As with the pulse protocol for steady-state SI (Figure 6), a 20-ms, −130 mV pulse immediately prior to a test pulse was used to recover channels from accumulated FI. After the test pulse, channels were hyperpolarized to −130 mV for 30 s before every prepulse to completely recover channels from both fast and SI. The pulse protocol is shown below Figure 7C. Data points in Figures 7A,C are averaged and normalized amplitudes of peak currents recorded in response to a test pulse (as described above). The time course of SI onset was fit with double exponential (solid lines, Eq. 4, Materials and Methods) and time constants were extracted. Parameters, derived from the double exponential fits are summarized in Table 5. Asymptotic values of onset to SI at both pH values were added Figure 6 to verify SS-SI data. In NaV1.2, at pH 6.0 the asymptotic value of onset of SI was significantly decreased. Also, at low pH the slow time constant (τ2) was significantly smaller at pH 6.0 compared to pH 7.4. In contrast, the asymptotic value of onset of SI in NaV1.5 was significantly increased at pH 6.0 compared with pH 7.4 (p < 0.05, n = 7), and the slow component (τ2) of SI onset was significantly smaller at pH 6.0 compared to pH 7.4 at pH 7.4 (p < 0.05, n = 7).
Figures 7B,D show time course of recovery from SI in NaV1.2 at pH 7.4 (filled circles) and at pH 6.0 (open circles) and in NaV1.5 at pH 7.4 (filled squares) and at pH 6.0 (open squares), respectively. The recovery from SI was measured as follows: channels were inactivated with 60 s prepulse at 0 mV, and then recovered from inactivation with a −110-mV interpulse of variable duration (0–64 s, see Materials and Methods for details about the interpulse duration protocol). A short pulse of 20 ms, at −130 mV immediately prior to the test pulse was used to recover channels from FI. The fraction of channels recovered from SI was assessed with a 0-mV test pulse. The pulse protocol is shown below Figure 7D. Currents, recorded during the test pulse were normalized, averaged, and plotted vs. interpulse duration. The time course of recovery from SI in NaV1.2 was fitted with a double exponential (Eq. 4, Materials and Methods) to obtain time constants and asymptotic values, summarized in Table 5. Low pH did not significantly affect the faster component (τ1) of recovery from SI in NaV1.2. However, the slower time constant (τ2) of recovery from SI was significantly decreased at pH 6.0 (p < 0.05, n = 6, Figure 7B). The asymptotic value of time course from recovery from SI in NaV1.2 at pH 6.0 was not different (p > 0.05) from that at pH 7.4.
Figure 7D shows time course of recovery from SI in NaV1.5 at pH 7.4 (filled squares) and at pH 6.0 (open squares). Comparing the time constants extracted from double exponential fits revealed no significant (p > 0.05) effect of low pH on either on τ1 or τ2. However, we found that, at pH 6.0, more NaV1.5 channels are available for recovery at the beginning (t = 0) of interpulse (Figure 7D, open squares, arrow) as compared to pH 7.4 (Figure 7C, filled squares). The asymptotic values for recovery from SI in NaV1.5 at pH 6.0 were not different (p > 0.05) from those at pH 7.4 (Table 5).
Our experiments revealed no significant effects of low pH kinetics of SI in NaV1.4 channels (data not shown).
pH Differentially Alters Use-Dependent Inactivation in NaV1.2 and NaV1.5
To further investigate the effects of low pH on inactivation in NaV1.2 and NaV1.5, we compared use-dependent current reduction at pH 7.4 and pH 6.0. The frequency of pulse stimulation for each channel isoform was chosen to emulate its tissue-specific activity prior to/during an ischemic event, such as epileptic episode or stroke (Kjekshus, 1986; Adeli et al., 2003). Figure 8A shows use-dependent inactivation (UDI) in NaV1.2 at pH 7.4 (filled circles) and at pH 6.0 (open circles). Peak current amplitudes, recorded during a series of 1000, 20 ms test pulses to 0 mV are plotted as a function of pulse number. The interval between adjacent pulses was 1 ms, holding potential was −60 mV to emulate neuronal resting potential in vivo. The resulting frequency was approximately 45 ± 5 Hz, which roughly corresponds to frequency of AP firing during epileptic episode (Adeli et al., 2003). Peak currents were normalized to the peak amplitude of the first current record of the series and fit with a double exponential function to determine time constants, τ1 and τ2, and steady-state fraction of inactivated channels (asymptote). UDI parameters are summarized in Table 6.
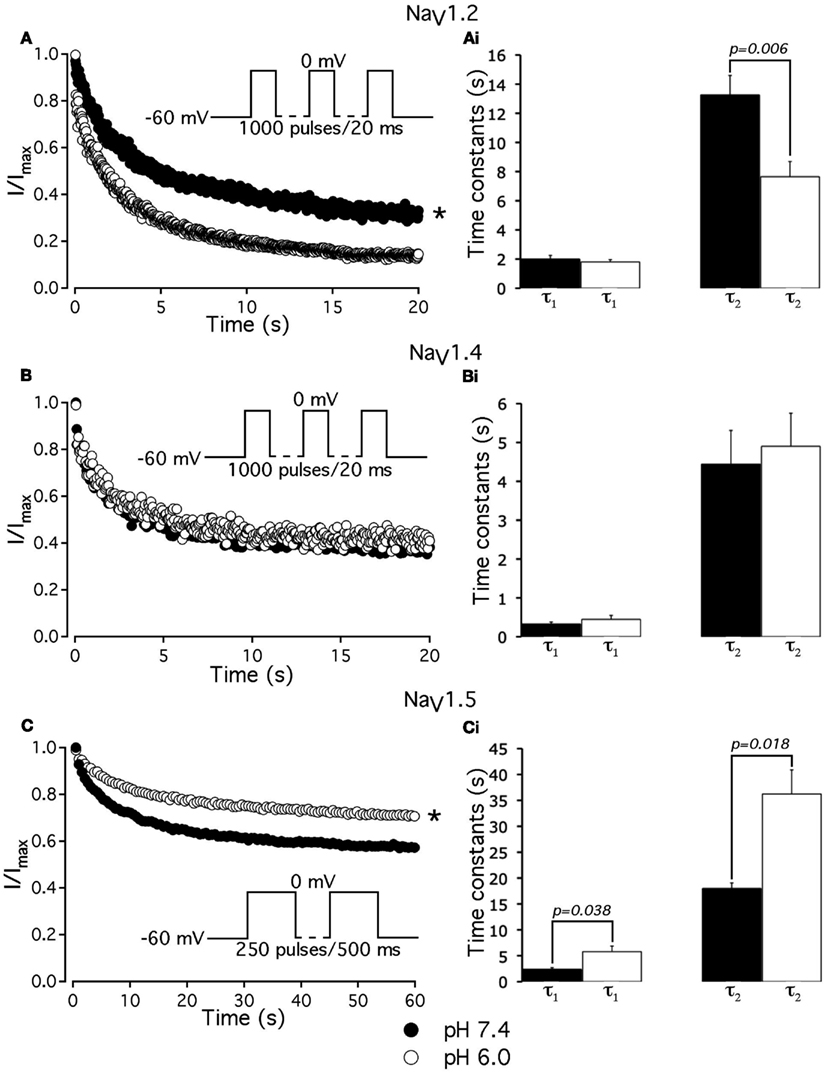
Figure 8. Low pH differentially affects use-dependent inactivation. (A,B,C) Use-dependent inactivation at pH 7.4 (filled symbols) and at pH 6.0 (open symbols) in NaV1.2, NaV1.4 and NaV1.5, respectively. Cells were held at −60 mV and repetitively stimulated either with one thousand 20 ms test pulses to 0 mV (for NaV1.2 and NaV1.4) or with 120 500 ms test pulses to 0 mV (for NaV1.5). Corresponding pulse protocol diagrams are shown in (A,B,C) insets. Peak currents from test pulses were normalized to the amplitude of the first current in the series and values were plotted vs. number of pulses. (A) Use-dependent inactivation in NaV1.2 at pH 7.4 (filled symbols) and at pH 6.0 (open symbols). Ai time constants of double exponential use-dependent inactivation in NaV1.2 at pH 7.4 (filled histograms) and at pH 6.0 (open histograms). (B) Use-dependent inactivation in NaV1.4 at pH 7.4 (filled symbols) and at pH 6.0 (open symbols). Bi time constants of double exponential use-dependent inactivation in NaV1.4 at pH 7.4 (filled histograms) and at pH 6.0 (open histograms). (C) Use-dependent inactivation in NaV1.5 at pH 7.4 (filled symbols) and at pH 6.0 (open symbols). Ci time constants of double exponential use-dependent inactivation in NaV1.5 at pH 7.4 (filled histograms) and at pH 6.0 (open histograms). Data represent mean ± SEM (n = 9–12). Asterisks denote statistical difference (p < .05).
At pH 7.4 (Figure 8A, filled circles) the asymptote of UDI in NaV1.2 was significantly (p < 0.05) decreased compared to that at pH 6.0 (Figure 8A, open circles). Also, acidification accelerated the τ2 of UDI in NaV1.2 (Figure 8Ai, open histogram), Table 6. Data shown in Figures 8B,Bi indicate that both time course and maximum probability of UDI in NaV1.4 at pH 7.4 (filled circles and histograms) were statistically similar (p > 0.05) to those at pH 6.0 (open circles and histograms), Table 6. In NaV1.5 the effects of low pH on UDI were essentially reversed as compared to NaV1.2. At pH 7.4 the asymptote of UDI (Figure 8C, filled circles) was increased as compared to that at pH 6.0 (Figure 8Ci, open circles), Table 6. Also, low pH decelerated both τ1 (Figure 8Ci, filled histograms) and τ2 (Figure 8Ci, filled histograms) of the UDI, Table 6. Note that different depolarization durations for UDI pulse protocols were used (see pulse protocols in Figure 8 and description in the figure legend) to account for differences in AP durations between neurons and skeletal muscles (NaV1.2 and 1.4) vs. myocytes (NaV1.5).
Our results suggest acidification produces differential effects on inactivation properties of NaV1.2 and NaV1.5, but not in NaV1.4, suggesting that changes in pH would affect AP generation and propagation in neuronal and cardiac tissue but not in skeletal muscle.
Modeling: Effects of Low PH on Neuronal Action Potential
Our experimental data were used as the basis for computer modeling (see Materials and Methods) to measure characteristics of neuronal APs at either normal or acidic pH. Figure 9 shows the results of neuronal modeling. Simulations to elicit APs were done at a continuous stimulus of −1 pA/pF in both pH 6.0 (dashed line) and pH 7.4 (solid line) over a period of 105 ms (Figure 9A). The membrane potentials of the model neurons at each pH value were plotted as a function of time (Figure 9A). Three main differences were observed between the two pH values: (1) the pH 6.0 neuron reached its maximal depolarization at 68.90 ms, faster than the pH 7.4 neuron at 76.98 ms; (2) the membrane potential at peak depolarization was 18.7 mV in the pH 6.0, a more positive depolarization than the 30.40-mV observed in the pH 7.4 neuron; and (3) the maximum hyperpolarization voltage was less negative in the pH 6.0 neuron, with a value of −67 mV compared to −74.4 mV found in the pH 7.4 neuron.
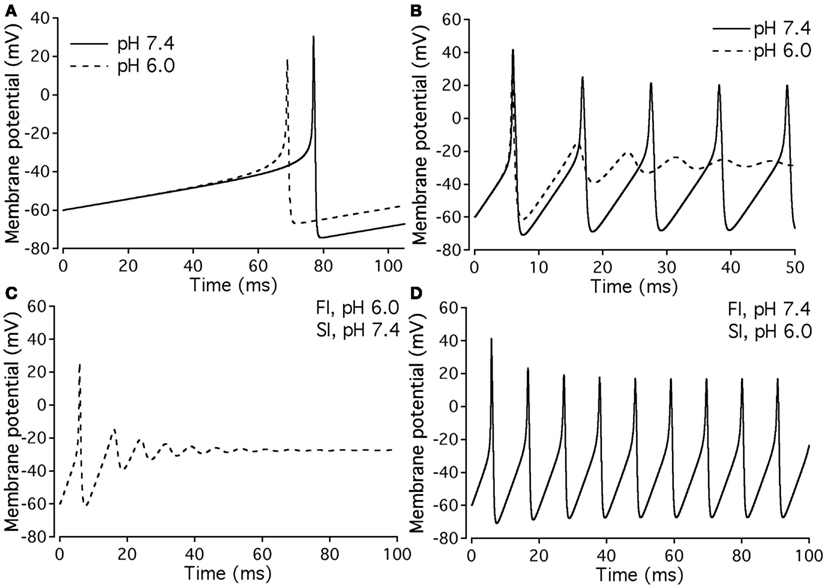
Figure 9. Effects of pH on neuronal action potential. (A) An overlap of a two neuronal APs with sodium currents at pH 7.4 (solid line) and pH 6.0 (dashed line). The APs were elicited by a continuous stimulus current of 1 pA/pF. (B) Continuous APs with sodium currents at pH 7.4 (solid line) and pH 6.0 (dashed line). The continuous firing was induced with a continuous current of 20 pA/pF. (C) Continuous APs of a neuron expressing a sodium channel “pH chimera” whose parameters of conductance and FI correspond to those at pH 6.0 and the parameters of slow inactivation correspond to those at pH 7.4. The APs were stimulated with a continuous current of 20 pA/pF. (D) Continuous APs of a neuron expressing a sodium channel “pH chimera” whose parameters of conductance and FI correspond to those at pH 7.4 and the parameters of slow inactivation correspond to those at pH 6.0. The APs were stimulated with a continuous current of 20 pA/pF.
Figure 9B compares repetitive AP firing in a model neuron at pH 7.4 (solid line) and at pH 6.0 (dashed line). Data shown are for neurons injected with a constant stimulus of −20 pA/pF although simulations were also performed at stimulus amplitudes of −3, −5, −10, and −15 pA/pF with the same data trends obtained (data not shown). In the first AP, the maximum depolarization and hyperpolarization trends seen in the single AP studies, are reproduced (Table 7). The pH 7.4 neuron continues to fire APs at a rate of 94.3 Hz, but with a decreased maximum depolarization and less negative undershoot (Table 7). In contrast, the pH 6.0 model neuron failed to repetitively fire.

Table 7. Parameters of repetitively firing neurons at a stimulus of −20 pA/pF for pH 7.4 model neurons, pH 6.0 model neurons, and pH 6.0 model neurons with either pH 7.4 slow inactivation or fast inactivation parameters.
Since our model takes into account both fast and slow gating, we have modeled “AP chimeras” to study the specific effects of both inactivation types on the neuronal AP. Chimera 1 (Figure 9C) consists of pH 6.0 data programmed in for the activation and FI and pH 7.4 data programmed in for the slow inactivation gate. Chimera 2 (Figure 9D) has pH 6.0 data programmed in for the activation and slow inactivation gates and pH 7.4 data programmed in for the FI gate. Chimera 2 (Figure 9D) was found to have similar characteristics to the pH 7.4 neuronal model, in which the repetitive firing was preserved (Figure 9B, solid line). In contrast, Chimera 1 (Figure 9C) results were similar to the pH 6.0 model (Table 7). These modeling results suggest FI defects induced by decreased pH are responsible for the failure of the neuronal model to display repetitive AP firing.
Modeling: Effects of Low PH on Cardiac Action Potential
Figures 10A,B, show the modeled sodium current during the 15th and 200th APs (firing frequency of 2.5 and 3.33 Hz, respectively) at pH 7.4 (solid line) and at pH (6.0). Plotted are the sodium current densities in pA/pF over the initial 5 ms of the cardiac AP. The sodium current is reduced and delayed in the pH 6.0 model during both 15th and 200th APs. At pH 6.0 there is a decreased level of activation and a decreased level of FI as described in Table 7; Figure 10C is the full 15th AP at both pH values; Figures 10Ci,ii show expanded views of the rising phase and repolarization phase respectively. The membrane potential of the model cardiac myocytes is plotted on the vertical axis, with −85.9 mV as the resting membrane potential, vs. a single cycle length. The maximum rise rate in the pH 6.0 model is reduced from 62.1 mV/ms, at pH 7.4, to 18.6 mV/ms, and was also delayed by 0.6 ms at pH 6.0. There also was a delay in the peak plateau potential at pH 6.0, but there was no significant difference in the AP duration (APD) between the models (Table 7). Figures 10D,Di,ii show the 200th AP as well as expanded views of the rise phase and repolarization phase. As in Figure 10C, the membrane potential of the model cardiac AP is plotted as a function of the time of a single cycle length, with the resting membrane potential at −85.9 mV. There was a decreased maximal rise rate in the pH 6.0 AP (41.1 mV/ms at pH 7.4 compared to 11.0 mV/ms at pH 6.0) and a delay in the peak plateau depolarization (Table 7). There also was a 3.7-mV difference in the peak plateau membrane potential at pH 6.0 as well as a 1.4-ms delay in the repolarization of the pH 6.0 AP.
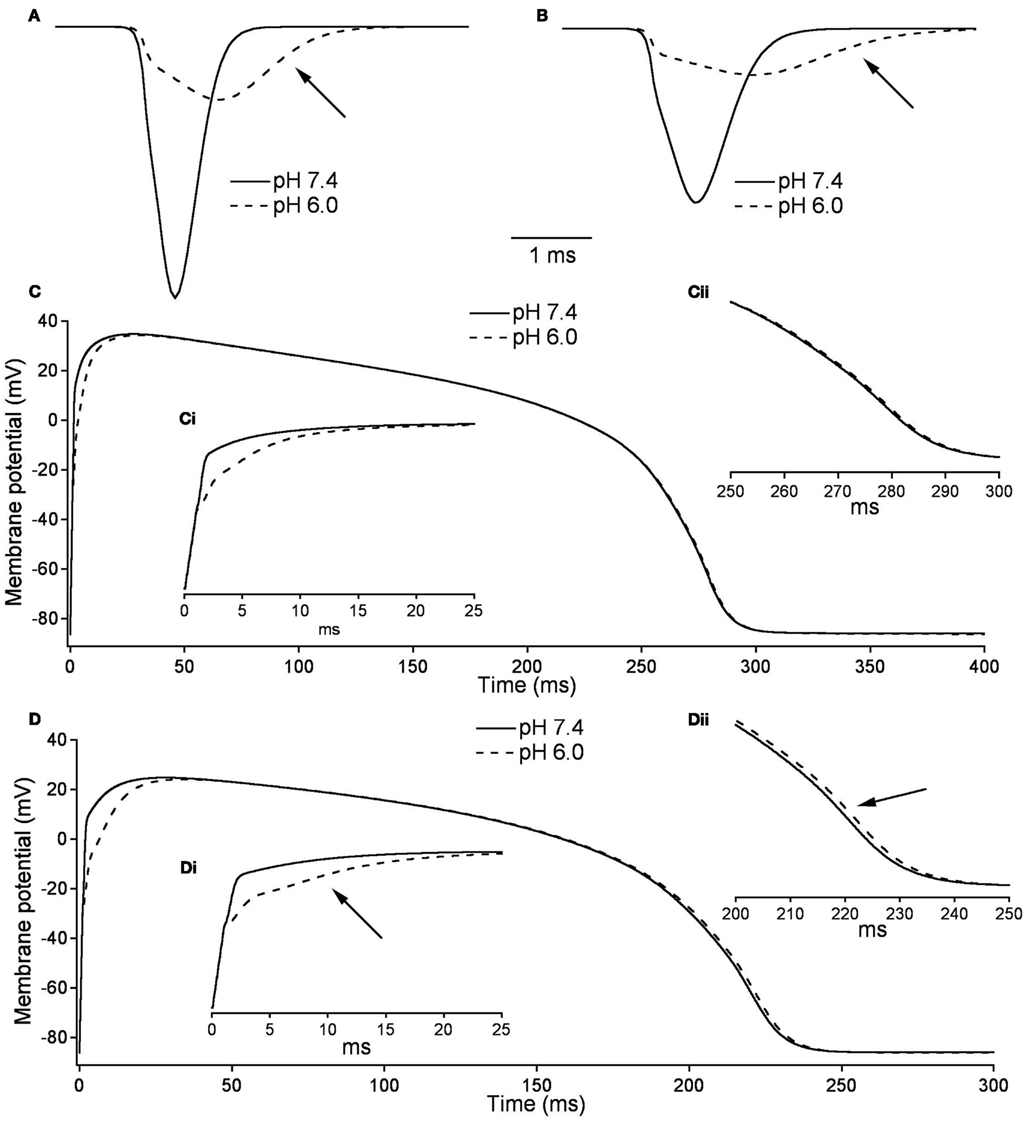
Figure 10. Effects of pH on cardiac action potential. (A) The fast sodium current of a cardiac AP at pH 7.4 (solid line) and pH 6.0 (dashed line). The sodium current is recorded on the 15th AP in an endocardial myocyte stimulated at a frequency of 2.5 Hz. (B) The fast sodium current of a cardiac AP at pH 7.4 (solid line) and pH 6.0 (dashed line). The sodium current is recorded on the 200th AP in a endocardial myocyte stimulated at a frequency of 3.33 Hz. (C) The membrane potential over the time of one endocardial myocyte AP with sodium currents at pH 7.4 (solid line) and pH 6.0 (dashed line). The AP is the 15th produced in a model ventricular endocardial myocyte stimulated at 2.5 Hz. (Ci) The first 25 ms of the 15th endocardial AP stimulated at 2.5 Hz with sodium currents at pH 7.4 (solid line) and pH 6.0 (dashed line). (Cii) The last 50 ms of the 15th endocardial AP stimulated at 2.5 Hz with sodium currents at pH 7.4 (solid line) and pH 6.0 (dashed line). (D) The membrane potential over the time of one endocardial myocyte AP with sodium currents at pH 7.4 (solid line) and pH 6.0 (dashed line). The AP is the 200th produced in a model ventricular endocardial myocyte stimulated at 3.33 Hz. (Di) The first 25ms of the 200th endocardial AP stimulated at 3.33 Hz with sodium currents at pH 7.4 (solid line) and pH 6.0 (dashed line). (Dii) The last 50 ms of the 200th endocardial AP stimulated at 3.33 Hz with sodium currents at pH 7.4 (solid line) and pH 6.0 (dashed line).
Discussion
The goal of this study was to compare the effects of extracellular acidosis on biophysical properties of NaV1.2, NaV1.4, and NaV1.5 channels. We observed both similarities and differences between the responses of the different subtypes to changing pH from 7.4 to 6.0. On one hand, peak current amplitudes in all three channel isoforms were approximately equally suppressed due to proton block (Figures 1A,Ai,D,Di,G,Gi), consistent with previously published data (Hille, 1968; Benitah et al., 1997; Khan et al., 2006). However, more detailed study revealed that effects of low pH significantly differ between these channel subtypes, suggesting a specificity of effects that acidosis might have on voltage-gated sodium channels and, consequently, the tissues in which the different subtypes are found. In contrast to NaV1.2 and NaV1.5, NaV1.4 channels are practically insensitive to changes in pH; activation, and both fast and slow inactivation were largely unaffected by acidosis (Figures 1D,Di,E,F, 2B, and 5B) and the UDI at pH 7.4 was statistically identical to that at pH 6.0 (Figure 8B). These data suggest that steady-state and kinetic properties of activation and inactivation in NaV1.4 are pH-insensitive and the decrease in macroscopic current amplitudes at low pH (Figures 1D,Di) can be entirely attributed to proton block (Hille, 1968; Mozhayeva et al., 1984; Yatani et al., 1984; Benitah et al., 1997; Khan et al., 2006; Zhang et al., 2007). This apparent resistance to changes in extracellular pH may reflect the role of NaV1.4 in skeletal muscle function and its requirement to maintain normal functionality during exercise-induced acidosis.
On the other hand, inactivation in NaV1.2 and NaV1.5 was modified at low pH in opposite ways. First, the time course of open-state inactivation was delayed in NaV1.5 (Figure 2C), but not in NaV1.2 (Figure 2A). Longer time constants of NaV1.5 open-state inactivation indicate destabilization of the fast inactivation state, which in turn may result in elevated electrical excitability of cardiac tissue (Nerbonne and Kass, 2005; Wang et al., 2009). Second, the peak of window current area was shifted toward depolarized potentials in NaV1.5 (Figure 1I), but not in NaV1.2 (Figure 1C). This also may lead to overexcitability of cardiac tissue via elongation of the plateau phase of the cardiac AP (Abriel et al., 2001). Third, at pH 6.0, there was increased maximum channel availability in NaV1.5 (Figure 7B). In contrast, maximum availability in NaV1.2 is decreased in acidic conditions (Figure 6B). These data agree well with the maximum probability of UDI in NaV1.2 and NaV1.5 (Figures 8A,C, respectively), which is another indication that acidic conditions have opposite effects on NaV1.2 (decreased availability) and NaV1.5 (increased availability).
These hypotheses were tested with computer modeling. The results of modeling these data support in vivo experiments on acidosis and suggest mechanisms as to how the changes that occur in electrical signals at low pH are brought about. Neuronal modeling has shown the presence of both acidosis-inhibited and acidosis-stimulated neurons (Wang and Richerson, 2000; Wang et al., 2001). Our models showed complete inhibition of firing when only sodium channel parameters were changed (Figure 9B), which agrees with previous reports (Zhang et al., 2007). This suggests that acidosis inhibition of neurons is in part due to inhibited sodium currents, more specifically the altered FI kinetics (Figures 9C,D). Experiments on ventricular myocyte have shown reduced rise rates in APs at low pH (Kagiyama et al., 1982), which may be attributed in our modeling data to a decrease in sodium current amplitude (Figure 10). Decreases in initial rise rate are a potential cause of slow conduction velocity at low pH (Fry and Poole-Wilson, 1981; Kagiyama et al., 1982), a condition associated with ventricular arrhythmias (Cranefield et al., 1972). Decreased sodium current amplitude would normally suggest an early repolarization. Our data, however, suggests this is not the case (Figures 10C,D), and in vivo experiments have shown that acidosis leads to delays in repolarization. Our data further suggests that elongated macroscopic sodium currents are part of this effect. Sodium currents were present for almost twice as long at low pH (Figures 10A,B), probably due to delays in open-state inactivation at pH 6.0 (Figure 4).
The interpretation of our modeling is necessarily limited by the fact that only sodium channel properties were modified. The contribution of other channel types, and the effect of low pH on them, will inevitably alter the results we report. Nevertheless, our data, and the models we derive, provide the first direct comparison of the effects of low pH on sodium channel gating. Future studies using potassium and calcium channels, as well as other sodium channel subtypes, will provide the data necessary for a more complete picture of the effects of low pH on electrical excitability of nerve and muscle.
Our present results with NaV1.5 and the effects of low pH are consistent with our previous observations (Jones et al., 2011b). In our previous work, we observed similar effects of low pH on SS-FI, window current, τ(V), and UDI in NaV1.5 channels recorded using the cut-open oocyte voltage clamp. The effects of low pH on this sodium channel subtype thus are independent of the expression system and recording technique. The similarity of the NaV1.5 data we report here to that in Jones et al. (2011b), addresses what we therefore consider to be an unlikely possibility that the differences between NaV isoforms might be due to differences between expression systems.
Our results do not distinguish definitively between charge screening and pore block by protons. Since the peak INa amplitude is diminished in all the isoforms we tested, we conclude the same mechanism described by Khan et al. (2002) is responsible for this effect. Our previous results (Jones et al., 2011a), however, suggest the proton-dependent decrease in current amplitude is mediated by mechanism and molecular underpinnings different from than that by which kinetic properties are affected.
We can, at this point, only speculate as to the molecular basis for isoform-dependent differences in responses to low pH. The most likely place to explore the structural underpinnings of differential pH0 sensitivity is in residues that face the external milieu. Our previously published results (Jones et al., 2011b) suggest that histidine residues, with a pKa of 6.5, close to the pKa of 6.1 measured for pH-dependent decrease in peak INa in NaV1.5, could be NaV pH sensors. In addition, histidine residues in potassium channels have been reported to function as pH sensors (Kehl et al., 2002). Finally, our preliminary experiments also suggest histidine residues may be pH sensors (Jones et al., 2011a), although other reports suggest C373 in NaV1.5 might fulfill this role (Khan et al., 2006). Future studies will explore the possibility that there may be several residues that may be protonated under low external pH conditions.
Conflict of Interest Statement
The authors declare that the research was conducted in the absence of any commercial or financial relationships that could be construed as a potential conflict of interest.
Acknowledgments
This project was funded by a Discovery Grant from NSERC to Peter C. Ruben. We thank David K. Jones for his insight and fruitful discussions.
References
Abriel, H., Cabo, C., Wehrens, X. H. T., Rivolta, I., Motoike, H. K., Memmi, M., Napolitano, C., Priori, S. G., and Kass, R. S. (2001). Novel arrhythmogenic mechanism revealed by a long-QT syndrome mutation in the cardiac Na channel. Circ. Res. 88, 740.
Adeli, H., Zhou, Z., and Dadmehr, N. (2003). Analysis of EEG records in an epileptic patient using wavelet transform. J. Neurosci. Methods 123, 69–87.
Amin, A. S., Asghari-Roodsari, A., and Tan, H. L. (2010). Cardiac sodium channelopathies. Pflugers Arch. 460, 223–237.
Benitah, J. P., Balser, J. R., Marban, E., and Tomaselli, G. F. (1997). Proton inhibition of sodium channels: mechanism of gating shifts and reduced conductance. J. Membr. Biol. 155, 121–131.
Cranefield, P. F., Wit, A. L., and Hoffman, B. F. (1972). Conduction of the cardiac impulse. J. Gen. Physiol. 59, 227.
Featherstone, D., Richmond, J., and Ruben, P. (1996). Interaction between fast and slow inactivation in Skm1 sodium channels. Biophys. J. 71, 3098–3109.
Fry, C. H., and Poole-Wilson, P. A. (1981). Effects of acid-base changes on excitation–contraction coupling in guinea-pig and rabbit cardiac ventricular muscle. J. Physiol. (Lond.) 313, 141.
Hermansen, L., and Osnes, J. B. (1972). Blood and muscle pH after maximal exercise in man. J. Appl. Physiol. 32, 304.
Hodgkin, A. L., and Huxley, A. F. (1952). A quantitative description of membrane current and its application to conduction and excitation in nerve. J. Physiol. (Lond.) 117, 500.
Hund, T. J., and Rudy, Y. (2004). Rate dependence and regulation of action potential and calcium transient in a canine cardiac ventricular cell model. Circulation 110, 3168–3174.
Jones, D. K., Claydon, T. W., and Ruben, P. C. (2011a). Turret histidines in pH modulation of the cardiac voltage-gated sodium channel. Biophys. J. 100, 422a.
Jones, D. K., Peters, C. H., Tolhurst, S. A., Claydon, T. W., and Ruben, P. C. (2011b). Extracellular proton modulation of the cardiac voltage-gated sodium channel, NaV.15. Biophys. J. 101, 2147–2156.
Kagiyama, Y., Hill, J. L., and Gettes, L. S. (1982). Interaction of acidosis and increased extracellular potassium on action potential characteristics and conduction in guinea pig ventricular muscle. Circ. Res. 51, 614.
Kehl, S. J., Eduljee, C., Kwan, D. C., Zhang, S., and Fedida, D. (2002). Molecular determinants of the inhibition of human Kv1.5 potassium currents by external protons and Zn2+. J. Physiol. (lond.) 541, 9–24.
Khan, A., Kyle, J. W., Hanck, D. A., Lipkind, G. M., and Fozzard, H. A. (2006). Isoform-dependent interaction of voltage-gated sodium channels with protons. J. Physiol. (Lond.) 576, 493.
Khan, A., Romantseva, L., Lam, A., Lipkind, G., and Fozzard, H. A. (2002). Role of outer ring carboxylates of the rat skeletal muscle sodium channel pore in proton block. J. Physiol. (Lond.) 543, 71.
Kjekshus, J. K. (1986). Importance of heart rate in determining beta-blocker efficacy in acute and long-term acute myocardial infarction intervention trials. Am. J. Cardiol. 57, 43F–49F.
Luo, C., and Rudy, Y. (1991). A model of the ventricular cardiac action potential. Depolarization, repolarization, and their interaction . Circ. Res. 68, 1501.
Maruki, Y., Koehler, R. C., Eleff, S. M., and Traystman, R. J. (1993). Intracellular pH during reperfusion influences evoked potential recovery after complete cerebral ischemia. Stroke 24, 697.
Meyer, F. B. (1990). Intracellular brain pH and ischemic vasoconstriction in the white New Zealand rabbit. Stroke 21, IV117–IV119.
Mozhayeva, G. N., Naumov, A. P., and Nosyreva, E. D. (1984). A study on the potential-dependence of proton block of sodium channels. Biochim. Biophys. Acta 775, 435–440.
Nagatomo, T., Fan, Z., Ye, B., Tonkovich, G. S., January, C. T., Kyle, J. W., and Makielski, J. C. (1998). Temperature dependence of early and late currents in human cardiac wild-type and long QT DeltaKPQ Na channels. Am. J. Physiol. 275, H2016.
Nerbonne, J. M., and Kass, R. S. (2005). Molecular physiology of cardiac repolarization. Physiol. Rev. 85, 1205.
Spampanato, J., Escayg, A., Meisler, M. H., and Goldin, A. L. (2001). Functional effects of two voltage-gated sodium channel mutations that cause generalized epilepsy with febrile seizures plus type 2. J. Neurosci. 21, 7481.
Spampanato, J., Escayg, A., Meisler, M. H., and Goldin, A. L. (2003). Generalized epilepsy with febrile seizures plus type 2 mutation W1204R alters voltage-dependent gating of Na(v)1. 1 sodium channels. Neuroscience 116, 37–48.
Ten Tusscher, K., Noble, D., Noble, P. J., and Panfilov, A. V. (2004). A model for human ventricular tissue. Am. J. Physiol. Heart Circ. Physiol. 286, H1573.
Ten Tusscher, K., and Panfilov, A. V. (2003). Reentry in heterogeneous cardiac tissue described by the Luo-Rudy ventricular action potential model. Am. J. Physiol. Heart Circ. Physiol. 284, H542.
Ten Tusscher, K., and Panfilov, A. V. (2006). Cell model for efficient simulation of wave propagation in human ventricular tissue under normal and pathological conditions. Phys. Med. Biol. 51, 6141.
Terrenoire, C., Clancy, C. E., Cormier, J. W., Sampson, K. J., and Kass, R. S. (2005). Autonomic control of cardiac action potentials: role of potassium channel kinetics in response to sympathetic stimulation. Circ. Res. 96, e25.
Vilin, Y., and Ruben, P. C. (2010). Differential pH-dependent regulation of NaV channels. Biophys. J. 98, 111a.
Wang, L., Sun, L., Zhang, Y., Wu, H., Li, C., Pan, Z., Lu, Y., and Yang, B. (2009). Ionic mechanisms underlying action potential prolongation by focal cerebral ischemia in rat ventricular myocytes. Cell. Physiol. Biochem. 23, 305–316.
Wang, W., and Richerson, G. B. (2000). Chemosensitivity of non-respiratory rat CNS neurons in tissue culture. Brain Res. 860, 119–129.
Wang, W., Tiwari, J. K., Bradley, S. R., Zaykin, R. V., and Richerson, G. B. (2001). Acidosis-stimulated neurons of the medullary raphe are serotonergic. J. Neurophysiol. 85, 2224.
Wang, W., Yazawa, K., George, A. Jr., and Bennett, P. (1996). Characterization of human cardiac Na+ channel mutations in the congenital long QT syndrome. Proc. Natl. Acad. Sci. U.S.A. 93, 13200–13205.
Yatani, A., Brown, A. M., and Akaike, N. (1984). Effect of extracellular pH on sodium current in isolated, single rat ventricular cells. J. Membr. Biol. 78, 163–168.
Yuen, G. L. F., and Durand, D. (1991). Reconstruction of hippocampal granule cell electrophysiology by computer simulation. Neuroscience 41, 411–423.
Zhang, R. Z., Nadler, J. V., and Schwartz-Bloom, R. D. (2007). Impaired firing and sodium channel function in CA1 hippocampal interneurons after transient cerebral ischemia. J. Cereb. Blood Flow Metab. 27, 1444–1452.
Zygmunt, A. C., Eddlestone, G. T., Thomas, G. P., Nesterenko, V. V., and Antzelevitch, C. (2001). Larger late sodium conductance in M cells contributes to electrical heterogeneity in canine ventricle. Am. J. Physiol. Heart Circ. Physiol. 281, H689.
Appendix
General equations
where V is membrane potential, I is total current, C is capacitance, and t is time.
where y is the value of any gate, y∞ is its steady-state value and τy is its time constant value.
Neuron
C = −3.5 μF/cm2
Gna = 200 mS/cm2
Ena = 50 mV
τm = 0.15 ms
Gk = 40 mS/cm2
Ek = −80 mV
Fast sodium current.
Potassium current.
Cardiac
Gna = 23 mS/cm2
Gnal = 0.065 mS/cm2
τhl = 600 ms
Fast sodium current.
Late sodium current.
Slow delayed rectifier current conductance.
Keywords: gating, activation, fast inactivation, slow inactivation, patch-clamp, sodium channels
Citation: Vilin YY, Peters CH and Ruben PC (2012) Acidosis differentially modulates inactivation in NaV1.2, NaV1.4, and NaV1.5 channels. Front. Pharmacol. 3:109. doi: 10.3389/fphar.2012.00109
Received: 27 April 2012; Accepted: 22 May 2012;
Published online: 11 June 2012.
Edited by:
Gildas Loussouarn, University of Nantes, FranceReviewed by:
Jean-Pierre Benitah, INSERM U637, FranceJean-Sebastien Rougier, University of Bern, Switzerland
Copyright: © 2012 Vilin, Peters and Ruben. This is an open-access article distributed under the terms of the Creative Commons Attribution Non Commercial License, which permits non-commercial use, distribution, and reproduction in other forums, provided the original authors and source are credited.
*Correspondence: Peter C. Ruben, Department of Biomedical Physiology and Kinesiology, Simon Fraser University, 8888 University Drive, Burnaby, BC, Canada V5A 1S6. e-mail:cHJ1YmVuQHNmdS5jYQ==
 Yury Y. Vilin
