
94% of researchers rate our articles as excellent or good
Learn more about the work of our research integrity team to safeguard the quality of each article we publish.
Find out more
ORIGINAL RESEARCH article
Front. Pediatr., 07 March 2025
Sec. Pediatric Gastroenterology, Hepatology and Nutrition
Volume 13 - 2025 | https://doi.org/10.3389/fped.2025.1446431
 Abdulkerim Kassaw1
 Tefera Chane Mekonnen2Erkihun Tadesse Amsalu3
 Eyob Tilahun ABeje3
 Chala Daba4
 Yawkal Tsega5
 Abel Endawkie3*
Background: Inadequate intake of macro- and micronutrients is a significant public health challenge in Ethiopia. Ethiopia carries a substantial burden of both macro- and micronutrient deficiencies, with far-reaching consequences. However, there is limited evidence on the determinants and mean nutrient adequacy of complementary foods among children aged 6–23 months. Therefore, this study aims to determine the mean nutrient adequacy ratio and associated factors of complementary feeding among children aged 6–23 months in Northeast Ethiopia.
Methods: A study was conducted in Northeast Ethiopia between 1 March and 30 April 2023, among 255 children aged 6–23 months. The study employed a systematic sampling technique to select 255 children. The data were collected using a 24-h dietary recall method. Linear regression analysis was conducted to identify factors associated with the nutrient adequacy of complementary foods. In the multivariable analysis, variables with p-values <0.05 were considered statistically significant.
Results: The study found that the mean nutrient adequacy ratio of complementary foods among children aged 6–23 months in Northeast Ethiopia was 63% (95% CI 60.8–65.14). The adequacy of nutrients in complementary foods varied: energy (90%), fat (93%), carbohydrate (70%), protein (88%), calcium (57%), zinc (52%), vitamin B1 (50%), vitamin A (52%), and vitamin C (60%). The age of the child, mother's education, wealth index, feeding frequency, dietary diversity, minimum acceptable diet, source of information during antenatal care, postnatal care, food insecurity, and the number of children aged under 5 were associated with mean nutrient adequacy of complementary feeding.
Conclusions: The study concludes that the mean nutrient adequacy ratio of complementary foods among children aged 6–23 months in Northeast Ethiopia is alarmingly low, indicating a significant gap in meeting the nutritional recommendations set by the World Health Organization. Various factors, including the child's age, maternal education, household wealth index, food insecurity, and dietary diversity, were identified as critical determinants of nutrient adequacy. These findings underscore the urgent need for comprehensive interventions at multiple levels, including education, food security, and health services, to enhance the consumption of adequate and diverse complementary foods. By addressing these factors, stakeholders can improve the nutritional status of young children, ultimately contributing to better health outcomes and development in the region.
Complementary foods are essential for child growth, development, and survival in young children aged 6–23 months (1). Complementary foods should contain high-biological value protein, vitamins, and minerals (2). Nutritional adequacy is the comparison between the requirement and intake of nutrients of a certain individual and the mean nutrient adequacy ratio (MNAR) used to evaluate the general adequacy of the diet from food and beverage intake (3). Globally, micronutrient inadequacy is a major public health problem, with more than 340 million children experiencing inadequacy of essential micronutrients and at least 1 in 2 children with hidden hunger (4). In Ethiopia, protein-energy malnutrition and micronutrient deficiency, such as iron, vitamin A, zinc, and iodine deficiencies, are major nutritional problems (5, 6). Inadequate nutrient intake in children aged below 2 years results in growth faltering as long-term effects are poor cognitive development, reproductive dysfunction, poor economic productivity, and nutrition-related chronic diseases (7). However, MNAR is associated with various factors, such as adequacy of nutrient contents and dietary diversity (8). Every food group contains a particular nutrient and each nutrient has a specific function in the human body; therefore, consumption of various foods in the right proportion from different food groups is vital to the well-being of individuals (8).
In Ethiopia, various studies have shown that nutrient adequacy among children aged 6–23 months is influenced by factors such as family size, food group, number of children, antenatal (ANC) and postnatal care (PNC), food security, feeding frequency, dietary diversity, nutrient content, childhood illness, infant age, adequate care, parental education and occupation, and resident-related characteristics (9–13). However, the mean nutrient adequacy ratio of complementary foods and its associated factors have not been well studied among children aged 6–23 months, particularly in northeast Ethiopia. Therefore, this study aimed to assess the mean nutrient adequacy ratio and factors influencing complementary foods among children aged 6–23 months in this region.
This study was conducted in Kombolcha, Northeast Ethiopia, between 1 March and 30 April 2023. According to the 2022 Kombolcha administration health office report, the town has a total population of approximately 156,140 people, distributed across 12 administrative kebeles, with 12 health posts, four health centers, and seven private medium clinics that provide health services, including maternal and child healthcare and one general hospital. The number of infants and young children aged 6–23 months is estimated to be 6,761 of the total population.
The study was conducted using a community-based cross-sectional study design. The study included all children aged 6–23 months with mothers who had lived in the selected kebeles for at least 6 months.
The sample size was calculated using Stata version 14 software, with a single population proportion formula with the following assumptions: Alpha = 0.05, Power = 0.8, Delta = 0.1850, mean adequacy ratio (MAR) H0 = 0.67, Ha = 0.7070, and (MAR) SD = 0.2001 (14). After accounting for non-response, the final sample size was 255. Initially, there were 12 kebeles, out of which four kebeles were selected using a simple random sampling (SRS) lottery method. A sampling frame containing 1,016 lists of households with children aged 6–23 months was obtained and listed using the Kebele health post registration log book. All listed households were coded with a numeric code. The sample size was allocated to the population size proportionately, and the sampling interval (K = 4) was calculated. Finally, 255 participants were selected using a systematic sampling method after randomly identifying the first household and proceeding to the second participant based on the interval. The number of infants drawn from each kebele was calculated by proportion using the formula ni = Ni*n/N, where N is the total number of infants in 12 districts, Ni is the number of infants in each district, n is the total sample size to be selected in kebeles, and ni is the number of infants drawn from each kebele (Figure 1).
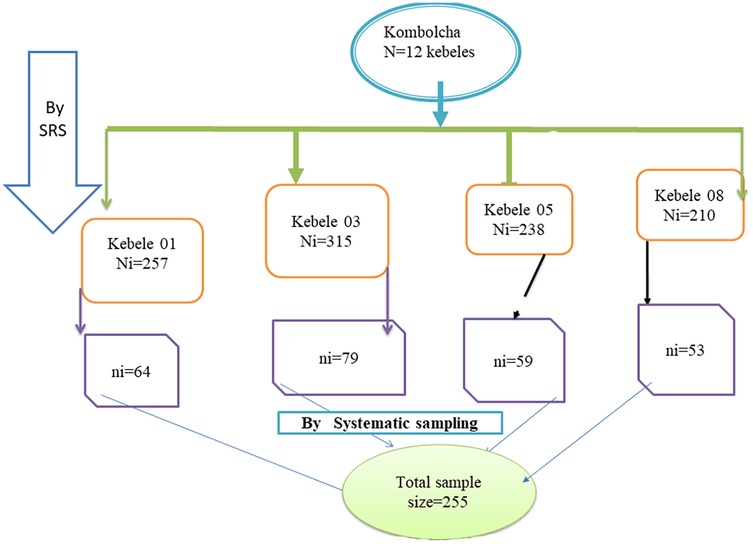
Figure 1. Schematic presentation of sampling procedure in Kombolcha, Northeast Ethiopia, 2023.
The mean nutrient adequacy ratio of complementary food among children aged 6–23 months was a dependent variable along with sociodemographic factors, including child’s age, child’s sex, household size, marital status, parental education and occupation, mother’s age and wealth index. Independent variables included the following: food security factors, such as food access, food group and food availability; maternal and child health factors, such as breastfeeding status, maternal care, feeding frequency, nutrients intakes of macro and micronutrient intake; and medical and healthcare service-related factors, such as child disease, child care, ANC and PNC visits.
The MAR was computed as an overall measure of dietary intake adequacy (15). A mean adequacy ratio value to reflect indexes of dietary quality (15).
The Household Food Insecurity and Access Scale (HFIAS) is a continuous measure assessing the degree of food insecurity based on the frequency of nine food insecurity-related events in the preceding 4 weeks (30 days). Household scores are in the range of 0–27, with higher scores indicating greater food insecurity. Based on this scale, food insecurity is classified into four categories: food secure (0–1), mild (2–8), moderate (9–14), and severe (15–27) (2, 16).
The proportion of children aged 6–23 months who received foods from five or more of the eight food groups was calculated. The eight food groups used for tabulation of this indicator were breast milk grains, legumes, dairy products, flesh foods, eggs, vitamin A-rich fruits and vegetables, and other fruits and vegetables (2).
The proportion of breastfed children aged 6–23 months who received solid, semi-solid, or soft foods the minimum number of times or more was calculated. The adequate minimum meal frequency for children aged 6–9 months, 9–11, and 11–23 months is 2–3 meals, more than 3 meals, and 3–4 meals per day, respectively. For a non-breastfed child, it should be at least four times in the last 24 h (2).
The proportion of breastfed and non-breastfed children aged 6–23 months who had at least the minimum dietary diversity and minimum meal frequency during the previous day was calculated (2).
The wealth index was computed using composite asset indicators for urban residents. A composite wealth index was constructed using principal components analysis (PCA) based on asset indicators, including television, refrigerator, mobile telephone, availability of electric power, fixed phone, bicycle, car, and cart. The final wealth index was classified into five categories: Lowest, Second, Middle, Fourth, and Highest (17).
The data collection for this study was conducted by interviewing mothers or primary caregivers of children aged 6–23 months in their own homes. The data collection instrument was a structured questionnaire prepared in English. To collect dietary intake data, 24-h dietary recall was conducted with the caregivers of the children using the multiple pass technique. This technique includes a quick list of consumed food, a detailed description of the listed food, and a review of the recall if the respondent may have forgotten the recall. In some situations, siblings and fathers of the child assisted the mother in recalling the last 24-h food intake of the child. All days of the week were equally represented in the final sample. All the recall days were arranged on non-special occasions like holidays, feast days, death occasions in the household, or fasting time. On the interview day, the participants were requested to report all foods that they served their child on the previous day, using a multiple-pass method.
Data were collected by six diploma nurses who had experience in collecting data in urban settings, were native speakers of the local languages, and were intensively trained for this study. Five days before the interview, the principal investigator visited 20 households to collect data on common child food, ingredients, and cooking methods and took photos of equipment commonly used to serve food for children. The food list was used to probe for food intake and describe the ingredients of listed food during data collection. It was read to the participant after completing dietary recall to help her recall any food that she forgot to list (Supplementary File I). The equipment from the pictures was purchased from the local.
We use salted replicas of local common foods for infants and young children to estimate portion size. Portions were mostly estimated by direct weighing of salted replicas of actual foods prepared locally. The salted replicas consisted of injera (fermented flat, pancake), shiro (a legume-based spicy stew), and bread. Otherwise, graduated food models and common household measures were used. In most cases, siblings living market. The equipment included a spoon, cup, ladle, bowl, and feeding bottle.
To estimate the portion size of the actual foods, a dietary scale was used to weigh them. The locally available labeled cup, bowl, spoon, ladle, bottle, and food weighing scale were calibrated to estimate the portion size (Supplementary File II). The completeness of the information gathered was checked, and salted replicas of common local food for infants and young children were also used. Each participant was asked to put a quantity of food that was equivalent to the eaten food on the food weighing scale. If the actual food was not available in the house, they were asked to borrow from neighbors. Otherwise, they were asked to estimate the portion of food that their child ate using equipment handled by the data collector. Most of the dietary intake was weighed in the household of the respondent. For purchased food, the respondent was asked about the monetary value and labeling/brand of the food (Supplementary File III).
Interviewers were trained before the actual data collection. They were frequently supervised and the questionnaires were pretested on 10% of the participants in the selected areas. The questionnaire was then rechecked for its precision and consistency, and necessary modifications were incorporated before commencing the actual data collection. Similarly, interviews were conducted in local languages. The English version of the questionnaire was translated first to Amharic and back to English by the language experts to maintain consistency. The selected data collectors received 2 days of training before data collection and two BSc nurses were recruited as supervisors.
The compiled food composition tables were entered into the software package, food processor (version 8.1) to create a dietary database. The dietary data were then entered into this software to calculate the nutrient composition of the food. An ESHA food processor was used to calculate the nutrient values of the food, except for Ethiopia's local foods, which were calculated based on their values from Ethiopia's food composition table. Missing values were completed using the Kenya nutrient database and the West African food composition table (18, 19). Two canned mango juices (RAN and YAMI) were not labeled for their nutrient intake. For this reason, we borrowed canned mango juice from USDA Sir 26 to calculate their nutrient intake. The data were analyzed and converted to the amount of nutrient and energy intake per individual per day. The NAR of macro- and micronutrient intakes from complementary foods were calculated for children aged 6–23 months and compared with the World Health Organization’s (WHO) recommended dietary allowance (RDA) (20). Moderate (10%) and low bioavailability (15%) were assumed to assess the adequacy of zinc and iron.
Data entry was made using EPi-Data software and exported to SPSS 23 for analysis. Frequency, percentage, mean, and standard deviation were used to summarize the data. Food composition tables were analyzed using a food processor (version 8.1).
The MAR was used as an overall measure of dietary adequacy. To compute MAR, the nutrient adequacy ratio (NAR) has to be calculated, which is defined as the ratio of an individual's nutrient intake to the recommended nutrient intake (RNI) of the assessed nutrient, appropriate for the age and sex of the individual
The value for MAR is calculated as the total of all the NARs divided by the total expressed as a percentage. MAR is calculated in a range of 0%–100% (4)
For computing MAR, each of the NARs was truncated as 1 so that a high intake of one nutrient could not compensate for the low intake of another nutrient, as originally conceived (15).
Linear regression analysis was used to determine an association between mean nutrient adequacy ratio (MAR) and its associated factors of complementary food among children aged 6–23 months in Northeast Ethiopia. Simple and multivariable linear regression analyses were used to model MAR and its associated factors. All explanatory variables that demonstrated a p-value <0.25 (21) in the simple analysis were considered candidates for the multivariable models. The outputs of the analyses are presented via crude and coefficient of determination (β). In final multivariable linear regression models and statistically significant at p-value <0.05, the extent of multicollinearity was measured using the variance inflation factor (VIF) and found to be within the variable range (the VIF for each variable was less than 10).
Ethical approval was obtained from the Institutional Review Board of the Wollo University College of Medicine and Health Science, School of Public Health. A letter of permission was obtained from the Kombolcha Administrative Health Office. Each study participant provided written informed consent to confirm their willingness to participate in the research after being informed of the study's goal and purpose. Written informed consent was presumably obtained from legally authorized representatives, such as parents (mothers) and/or legal guardians (caregivers). In addition, participants were made aware that their participation in the study was entirely voluntary and that they might leave at any moment if the questionnaire did not feel comfortable. The participant's name was not entered into the questionnaire, and the data were password-protected and stored on a computer to maintain privacy and secrecy. During the data collection period, the study participants received critical advice regarding diet from the data collectors, and all methods and data were performed based on Helsinki principles and Ethiopian research guidelines.
A total of 255 mothers with children aged 6–23 months were interviewed, with a response rate of 100%. Of the children in the study, 56% were male. The mean (±SD) age of the children was 13.2 ± 4.7 months, and almost half (n=142, 55.7%) of them were in the age category of 12–23 months. In addition, two-thirds of the mothers (n = 143, 56.1%) were aged 25–34 years. Regarding maternal literacy, 196 (76.9%) mothers were formally educated (Table 1).
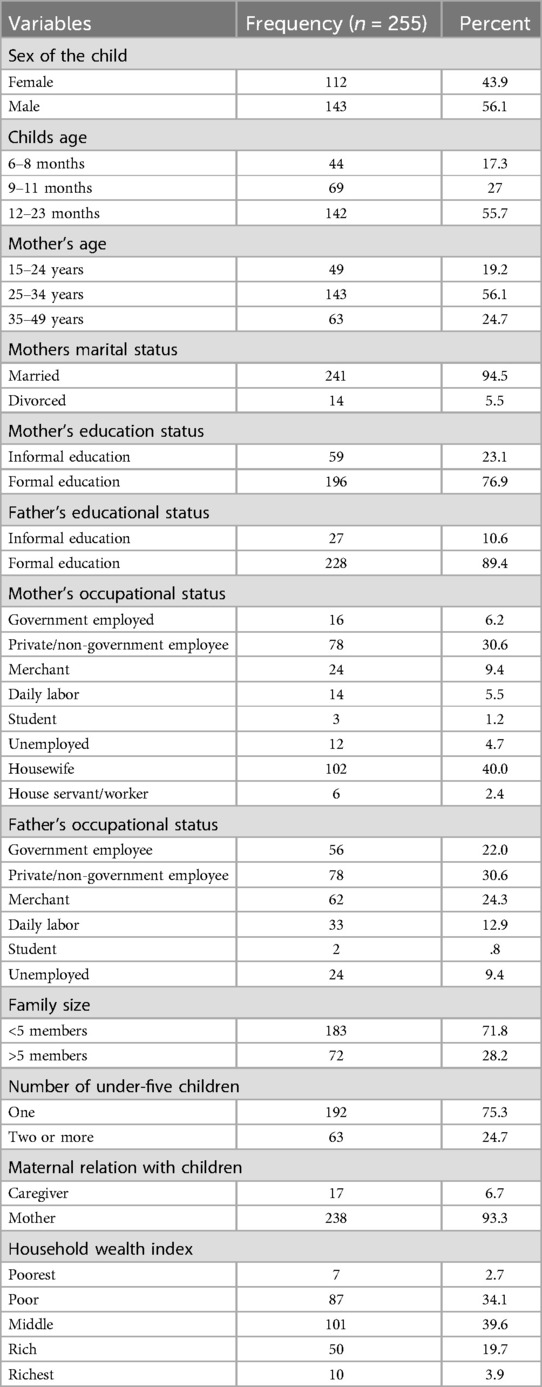
Table 1. Sociodemographic characteristics of respondents in Kombolcha, Northeast, Ethiopia, 2023.
Among children aged 6–23 months in Northeast Ethiopia in 2023, 233 (91.4%) were eating cereals and grains, 179 (70.2%) legumes and nuts, 110 (43.1%) dairy products (milk, yogurt), 67 (26.3%) flesh foods (meat, fish, poultry), 96 (37.6%) eggs, 82 (32.2%) vitamin-A rich fruits and vegetables, and 90 (35.3%) other fruits and vegetables (Figure 2).
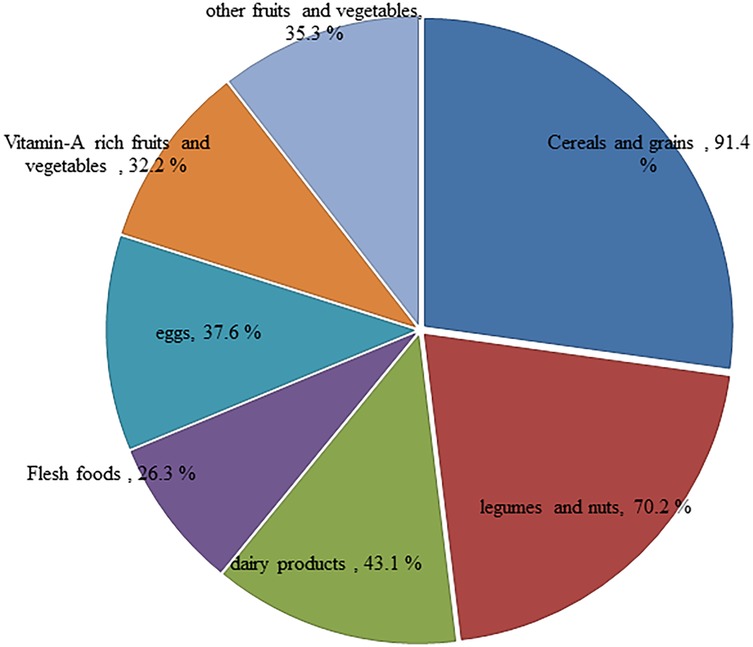
Figure 2. Types of food groups consumed among children aged 6–23 months in Northeast Ethiopia, 2023.
The majority of children (n = 208, 81.6%) were breastfed. Both early and late initiation of additional food were practiced extensively in the study area, but most (n = 212, 83.1%) of the mothers started to give complementary food to their children at just 6 months. Approximately 139 (54.5%) children met the minimum meal frequency requirement. The present study found that a minimum acceptable diet was consumed by 48 (18.8%) participants and 150 (58.8%) of them consumed less than four food groups per day in their recommended dietary diversity. Market purchasing was reported as the major source of food in 240 (94.1%) households. Furthermore, a food security assessment based on HFIAS revealed that 102 (40%) of the households were food secure (Table 2).
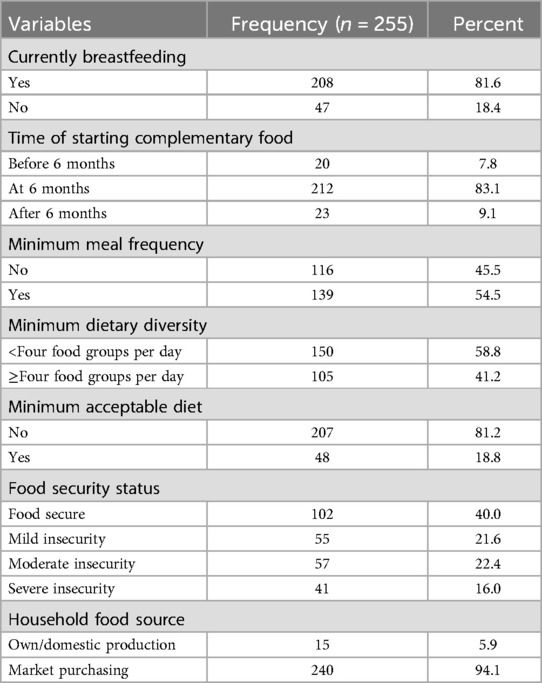
Table 2. Infant and young children feeding practices, food security, and food groups among children aged 6–23 months in Northeast Ethiopia, 2023.
Approximately 3%, 83%, 9%, and 6% of the mothers received dietary diversity-related information or education from health posts, health centers, hospitals, and private health organizations, respectively, in the month preceding the study. The majority received information about the importance of dietary diversity during ANC visits (n = 194, 76%) and PNC checkups (n = 204, 80%). In addition, the majority (n = 185, 72.5%) of mothers do not prepare any particular food for their children during sickness or recovery from disease (Table 3).
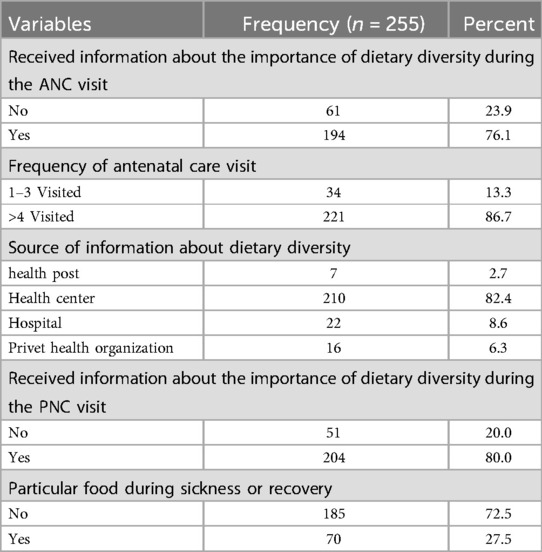
Table 3. Medical and healthcare information related factors among children aged 6–23 months in Kombolcha, Northeast Ethiopia, 2023.
The mean intake of macro- and micronutrients such as energy, fat, protein, carbohydrate, calcium, iron, zinc, vitamin A, vitamin C, vitamin B1, vitamin B2, niacin, vitamin B6, vitamin B12, and folate was significantly lower than the reference value for all age categories (Supplementary File III).
For all children aged 6–23 months, adequate nutrients in the complementary foods were energy (90%), fat (93%), carbohydrate (70%), protein (88%), calcium (57%), zinc (52%), vitamin B1 (50%), vitamin B2 (51%), vitamin B3 (52%), vitamin B6 (54%), vitamin B12 (54%), iron (54%), vitamin A (52%), vitamin C (60%), and folate (64%).
The nutrient adequacy of complementary foods for children aged 6–8 months was energy (78%), fat (81%), protein (77%), carbohydrate (60%), vitamin A (44%), vitamin B1 (45%), vitamin B2 (43%), vitamin B3 (42%), vitamin B6 (35%), vitamin B12 (43%), vitamin C (49%), folate (54%), calcium (46%), iron (41%), and zinc (42%). The nutrient adequacy of complementary foods for children aged 9–11 months was energy (85%), fat (90%), protein (83%), carbohydrate (65%), vitamin A (50%), vitamin B1 (48%), vitamin B2 (45%), vitamin B3 (47%), vitamin B6 (48%), vitamin B12 (51%), vitamin C (56%), folate (58%), calcium (49%), iron (44%), and zinc (43%). Finally, the mean nutrient adequacy ratio for children aged 6–23 months was 63% (Figure 3).
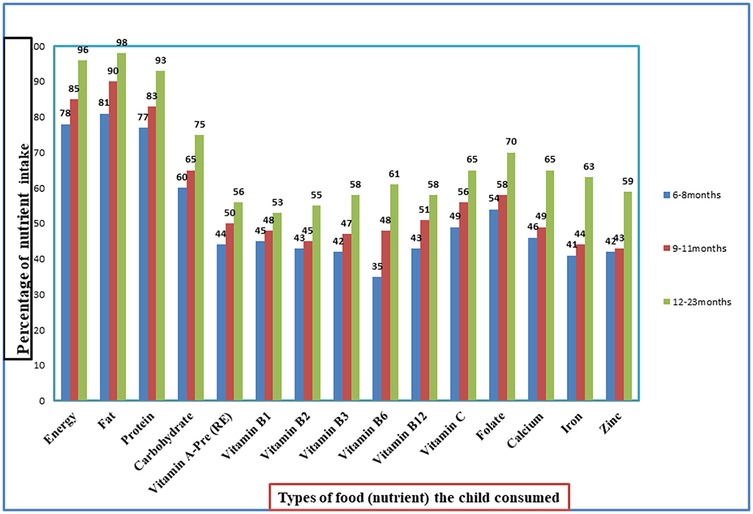
Figure 3. Nutrients intake among children aged 6–23 months in Northeast Ethiopia, 2023.
In this study, several factors were evaluated for their association with the mean nutrient adequacy ratio (MNAR) using the crude (bivariable) analysis. For example, the results revealed that boys had a coefficient of 16.99 (95% CI 13.38–20.61), indicating a significant positive association with MNAR. In addition, each month of age was linked to an increase in MAR of 1.33 (95% CI 0.92–1.74). Furthermore, the children of mothers who had a formal education demonstrated a significantly higher MAR, with a coefficient of 19.30 (95% CI 15.00–23.61). Conversely, the analysis showed a negative association with the number of children aged under 5 years, reflected in a coefficient of −27.75 (95% CI −31.06–−24.42). In this study, we considered age, socioeconomic status, and sex of the study participants as the natural confounders that may affect the relationship between independent and dependent variables.
To account for these confounders, a multivariable linear regression model was used. The extent of multicollinearity was measured using a variance inflation factor (VIF) and was found to be within the variable range (the VIF for each variable was less than 10). In the multivariable linear regression models, variables such as feeding frequency (β: 3.49; 95% CI 2.12–4.85), minimum dietary diversity (β: 9.74; 95% CI 7.66–11.82), minimum acceptable diet (β: 6.16; 95% CI 4.12–8.20), ANC follow-up (β: 3.26; 95% CI 1.23–5.29), and PNC follow-up (β: 2.67; 95% CI 0.49–4.85) were associated with improved MAR. The mothers with a formal education increased the MAR by 2.48 (95% CI 0.78–4.19) compared to those who did not have a formal education. The score of the household wealth index rose by 2.31 (coefficient 2.31; 95% CI 1.61–3.01) in MAR. The score of household food insecurity declined by 0.64 (−0.64; 95% CI −0.83–−0.29) in MAR. Binning indicated that the number of children aged 5 decreased by 5.48 (95% CI −7.74–−3.23) in the MAR for nutrients. The children’s age (β: 0.14; 95% CI 0.01–0.27) was positively significantly associated with MAR. However, variables such as the child’s sex, mother’s age, father's education, and family size did not have a statistical association with MAR (Table 4).
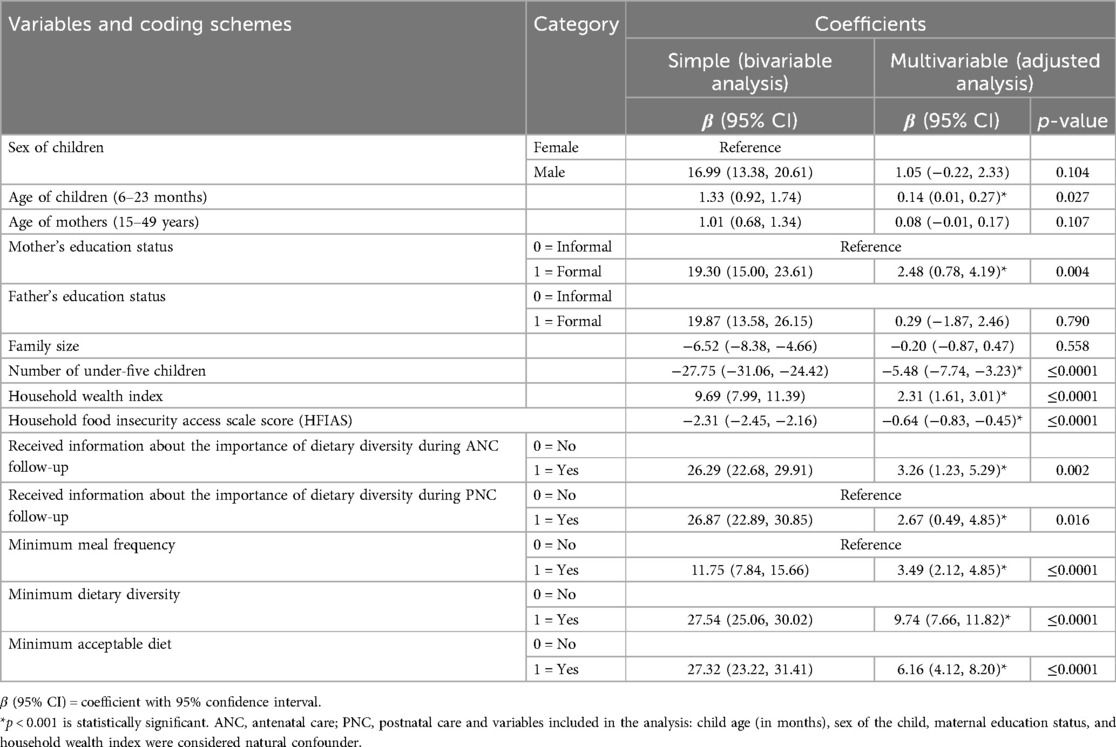
Table 4. Simple and multivariable linear regression analysis for factors associated with MAR of complementary food among children aged 6–23 months in Kombolcha, Northeast Ethiopia, 2023 (n = 255).
This study showed that all the complementary foods did not contain adequate amounts of protein, fat, energy, carbohydrate, folate, vitamin C, calcium, vitamin A, thiamin, riboflavin, niacin, vitamin B6, vitamin B12, iron, and zinc (values <1 or 100%) for children aged 6–23 months. This finding aligns with studies conducted in Jimma, Ethiopia, which reported that the diets of predominantly fed children lacked adequate protein, fat, carbohydrate, energy, and calcium as recommended for complementary feeding. However, iron and zinc levels were found to be adequate (1).
The computed adequacy ratio was almost consistent with similar studies conducted in Uganda, Ghana, and Zambia (22–24). However, the ratio was lower than that in a study conducted in the UK (25), which revealed that the majority of children have an adequate or more than adequate intake of energy, protein, and micronutrients. This may be due to the fact that the complementary foods are primarily grain-based. These grain-based foods contain high levels of phytic acid, which can inhibit the absorption of essential micronutrients such as iron, zinc, and calcium (9). Even though the introduction of animal-source foods, such as meat, fish, poultry, and eggs, into the diet is late, very few children consume them (1). This indicates that meeting the recommended intake for dietary adequacy has remained a challenge throughout the country. This study identified that the majority of the children consumed cereals and grains (91.4%) and legumes (70.2%), while the consumption of eggs (37.6%), dairy products (milk, yogurt) (43.1%), flesh foods (meat, fish, and poultry) (26.3%), vitamin-A rich fruits and vegetables (32.2%), and other fruits and vegetables (35.5%) was low. This finding was almost consistent with studies form Southwest Ethiopia (1) and Bench Maji Zone, Southwest Ethiopia (26). However, this finding was slightly higher than the findings of a report from Southern Ethiopia (10). This may be because of differences in the season, study setting, and sample size of this study. The results of this study showed that the MAR was 63% (95% CI 60.8–65.14) among children aged 6–23 months in Northeast Ethiopia. The MAR in this setting was higher than findings from India (50%) (27), Bangladesh (43%) (28), and Madagascar (50%) (29). In contrast to the above findings, the magnitude of the MAR in our study was lower than reports from Malaysia (67%) (14). This may be due to the low nutrient density of their diet, coupled with consumption of small quantities of food with limited diversity. In addition, thin gruel made from a mixture of cereal and legumes was commonly consumed among children in Northeast Ethiopia, unlike children in some sub-Saharan Africa who were fed with cereal-based porridge (13, 29). The low MAR in the present study is an indication that children in the study area were not likely to meet the adequate macro- and micronutrient requirements for growth.
This study illustrated that dietary diversity was positively associated with nutrient adequacy.
This result was supported by studies conducted in Mali (29) and studies from developing countries (30, 31). Many dietary guidelines also recommend the inclusion of a variety of foods in the diet, which is associated with adequate intake of all the essential nutrients (4, 20).
Dietary intake adequacy in terms of MAR was shown to be more influenced by the minimum dietary diversity indicator. This finding was in line with a study carried out in Malaysia where the minimum acceptable diet in predicting dietary quality (14). The children need to be fed a wider variety of foods since an increase in individual minimum dietary diversity shows a corresponding increase in nutrient intake (1).
In this study, the minimum acceptable diet was statistically significant with a MAR. Similarly, the finding was supported by findings from EDHS 2016 where minimum acceptable diets were associated with better adequacy of diets for children (14, 32). A study conducted in Wolayita also showed a significant association between minimum acceptable diet and nutritional adequacy in children's diets (33). The possible justification for this may be related to the availability of diversified foods for children that satisfy essential nutrients required for growth and development, leading to improved nutritional adequacy.
This study found that meal frequency showed a positive association with the MAR of children. To meet the macro- and micronutrient requirements for the growth and development of infants and young children, WHO/UNICEF recommends a minimum meal frequency for children aged 6–23 months (34). This finding was consistent with findings from a study carried out in Uganda (22). The recommended number of meals per day for a healthy breastfed baby to meet nutritional adequacy should be 2–3 times at 6–8 months of age, 3–4 times at 9–11 months of age, and 3–4 times with 1–2 additional nutritious snacks at 12–23 months of age. This may be because as the meal frequency increases, the nutritional adequacy would be met, leading to an increase in the MAR.
The study observed that the household wealth index was a significant predictor of nutrient intake adequacy in terms of MAR. This finding is in line with studies conducted in Wolayita, Southern Ethiopia (33) and Nigeria (35). This is possibly because these children’s families may have afforded to purchase meat or to slaughter animals for their children. The rising income of the family increases the consumption of meat-based food, leading to nutrient adequacy being met.
In this study, food insecurity was negatively associated with the MAR. The studies conducted abroad showed the MAR as an index of household food insecurity (26, 31). Furthermore, local studies carried out in Ethiopia showed that food security was significantly associated with adequate diet quality (36). Other reasons for food insecurity may include low food supply, insufficient quality, lack of resources, and limited variety of foods due to a lack of resource because there was not enough food thereby decreasing nutrient quality.
Our study reported that having a formal education was positively associated with nutrient adequacy and is supported by other studies (37–39). This may be because education has a strong positive influence on adequate nutrient intake (8). Maternal education with a positive deviance from the norm may effectively influence the behavior of their partners. There is a reasonable body of evidence about the link between maternal knowledge of infant and young child feeding (IYCF) and the quality of the diet offered to children.
Our study found that information about the importance of dietary diversity during ANC and PNC checkups was positively associated with the adequacy of complementary food. Consistent findings have been reported by studies conducted in Ethiopia (1, 10, 13, 39), and Nepal (40). This may be because promoting the utilization of maternity services and stronger integration with IYCF helps to improve infant feeding practices. In addition, mothers who attended ANC and PNC visits may have better access to services or might be from a wealthier family and thus are more likely to provide a diet quality to their children (40).
The other factor that turned out to be a significant predictor of MAR was the number of children. Multiple studies from Ethiopia show that the number of children was a significant determinant of complementary food adequacy (1, 10, 13, 39). This could be because caregivers assume that younger infants do not need diverse foods or their gut may not be able to digest animal-source foods. Consequently, complementary feeding might be initiated with monotonous staples.
The study's practical and policy implications emphasize the need for enhanced nutritional education for mothers and caregivers, supported by health workers during ANC and PNC visits, to promote dietary diversity in complementary feeding. It calls for initiatives to improve food availability through local food production and community-based programs, alongside policy support for food security, including subsidies for nutrient-dense foods.
Using community-based quantitative methods is a strength of this study as it increases the validity of the data and helps to assess the nutrient adequacy of complementary foods in children aged 6–23 months. The use of a validated multiple-pass 24-h recall and data collection tool was pre-tested before the actual data collection time. We use salted replicas of local common infant and young child food to estimate portion size.
The present study has some limitations. First, the reported nutritional adequacy was assessed based on single-day recall; hence, it may not exactly reflect the common dietary practices of the children and it is possible that the dietary intake of the child may be affected by the appetite and health status of the child. However, such variables were not accounted for in the study. This may result in an underestimation of the association.
The study concludes that the mean nutrient adequacy ratio of complementary foods among children aged 6–23 months in Northeast Ethiopia is alarmingly low, indicating a significant gap in meeting the nutritional recommendations set by the WHO. Various factors, including the child's age, maternal education, household wealth index, food insecurity, and dietary diversity, were identified as critical determinants of nutrient adequacy. These findings underscore the urgent need for comprehensive interventions at multiple levels, including education, food security, and health services, to enhance the consumption of adequate and diverse complementary foods. By addressing these factors, stakeholders can improve the nutritional status of young children, ultimately contributing to better health outcomes and development in the region.
The datasets presented in this study can be found in online repositories. The names of the repository/repositories and accession number(s) can be found in the article/Supplementary Material.
Ethical approval was obtained from the Institutional Review Board of the Wollo University College of Medicine and Health Science, School of Public Health. A permission letter was obtained from Kombolcha Administrative Health Office. Each study participant provided written informed consent to confirm their willingness to participate in the research after being told of the study’s goal and purpose. Written informed consent was presumably obtained from legally authorized representatives, such as parents (mothers) and/or legal guardians (caregivers).
AK: Conceptualization, Data Curation, Formal Analysis, Funding Acquisition, Investigation, Methodology, Project Administration, Resources, Software, Supervision, Validation, Visualization, Writing – original draft, Writing – review & editing. TC: Writing – original draft, Writing – review & editing. ET: Writing – original draft, Writing – review & editing. EA: Writing – original draft, Writing – review & editing. CD: Writing – original draft, Writing – review & editing. YT: Writing – original draft, Writing – review & editing. AE: Conceptualization, Data Curation, Formal Analysis, Funding Acquisition, Investigation, Methodology, Project Administration, Resources, Software, Supervision, Validation, Visualization, Writing – original draft, Writing – review & editing.
The authors declare that no financial support was received for the research, authorship, and/or publication of this article.
We would like to thank Wollo University College of Medicine and Health Science, School of Public Health for giving us the chance to study this thesis. We would also like to acknowledge all the respondents for their participation.
The authors declare that the research was conducted in the absence of any commercial or financial relationships that could be construed as a potential conflict of interest.
All claims expressed in this article are solely those of the authors and do not necessarily represent those of their affiliated organizations, or those of the publisher, the editors and the reviewers. Any product that may be evaluated in this article, or claim that may be made by its manufacturer, is not guaranteed or endorsed by the publisher.
The Supplementary Material for this article can be found online at: https://www.frontiersin.org/articles/10.3389/fped.2025.1446431/full#supplementary-material
ANC, antenatal care; EDHS: Ethiopian Demographic and Health Survey; DDS, dietary diversity score; EMDHS, Ethiopian Mini Demographic and Health Survey; IYCF, infant and young child feeding; MAD, minimum acceptable diet; MAR, mean adequacy ratio; MDD, minimum dietary diversity; NAR, nutrient adequacy ratio; PNC, postnatal care; MMF, minimum meal frequency; RDA, recommended dietary allowance; SNNP, Southern Nations, Nationalities and Peoples; SSA, sub-Saharan Africa; UNICEF, United Nation International Children Emergency Fund; USAID, United States Agency for International Development; WHO, World Health Organization.
1. Forsido SF, Kiyak N, Belachew T, Hensel O. Complementary feeding practices, dietary diversity, and nutrient composition of complementary foods of children 6–24 months old in Jimma zone, southwest Ethiopia. J Health Popul Nutr. (2019) 38:1–7. doi: 10.1186/s41043-019-0172-6
2. Kennedy G, Ballard T, Dop M. Guidelines for measuring household and individual dietary diversity (2011).
3. Sen P, Mardinogulu A, Nielsen J. Selection of complementary foods based on optimal nutritional values. Sci Rep. (2017) 7(1):5413. doi: 10.1038/s41598-017-05650-0
4. Clark H, Coll-Seck AM, Banerjee A, Peterson S, Dalglish SL, Ameratunga S, et al. A future for the world’s children? A WHO–UNICEF–lancet commission. Lancet. (2020) 395(10224):605–58. doi: 10.1016/S0140-6736(19)32540-1
5. Baye K, Guyot JP, Icard-Verniere C, Mouquet-Rivier C. Nutrient intakes from complementary foods consumed by young children (aged 12–23 months) from North Wollo, northern Ethiopia: the need for agro-ecologically adapted interventions. Public Health Nutr. (2013) 16(10):1741–50. doi: 10.1017/S1368980012005277
6. Abeshu MA, Adish A, Haki GD, Lelisa A, Geleta B. Assessment of caregiver’s knowledge, complementary feeding practices, and adequacy of nutrient intake from homemade foods for children of 6–23 months in food insecure woredas of Wolayita zone, Ethiopia. Front Nutr. (2016) 3:32. doi: 10.3389/fnut.2016.00032
7. Nachvak SM, Abdollahzad H, Mostafai R, Moradi S, Pasdar Y, Rezaei M, et al. Dietary diversity score and its related factors among employees of Kermanshah University of Medical Sciences. Clin Nutr Res. (2017) 6(4):247. doi: 10.7762/cnr.2017.6.4.247
8. Scaglioni S, De Cosmi V, Ciappolino V, Parazzini F, Brambilla P, Agostoni C. Factors influencing children’s eating behaviours. Nutrients. (2018) 10(6):706. doi: 10.3390/nu10060706
9. Temesgen M. Nutritional status of Ethiopian weaning and complementary foods: a review. Open Access Sci Rep. (2013) 2(2):1–9.
10. Dafursa K, Gebremedhin S. Dietary diversity among children aged 6–23 months in Aleta Wondo district, southern Ethiopia. J Nutr Metab. (2019) 2019(1):2869424. doi: 10.1155/2019/2869424
11. Dangura D, Gebremedhin S. Dietary diversity and associated factors among children 6–23 months of age in Gorche district, southern Ethiopia: cross-sectional study. BMC Pediatr. (2017) 17:1–7. doi: 10.1186/s12887-016-0764-x
12. Mekonnen DA, Talsma EF, Trijsburg L, Linderhof V, Achterbosch T, Nijhuis A, et al. Can household dietary diversity inform about nutrient adequacy? Lessons from a food systems analysis in Ethiopia. Food Secur. (2020) 12:1367–83. doi: 10.1007/s12571-020-01056-5
13. Feyisa BB, Tefera GM, Endris BS, Asayehu TT, Gebreyesus SH. Feeding practice, energy, and nutrient intake adequacy among children aged 6–23 months in southern Ethiopia: a community based cross-sectional study. Food Sci Nutr. (2020) 8(12):6680–90. doi: 10.1002/fsn3.1962
14. Khor GL, Tan SY, Tan KL, Chan PS, Amarra MS. Compliance with WHO IYCF indicators and dietary intake adequacy in a sample of Malaysian infants aged 6–23 months. Nutrients. (2016) 8(12):778. doi: 10.3390/nu8120778
16. Coates J, Swindale A, Bilinsky P. Household Food Insecurity Access Scale (HFIAS) for measurement of food access: indicator guide: version 3. (2007).
17. Bottone R, AhPoe C. Creation of a Wealth Index. United Nations World Food Programme (2017). Available online at: https://www.wfp.org/publications/creationwealth-index-june (Accessed February 14, 2025).
19. Barbara S, Ruth C, Victor N, Romaric G, Babacar S. West African Food Composition Table. Rome: Food and Agriculture Organization (2012).
20. Michaelsen KF. Feeding and nutrition of infants and young children: guidelines for the WHO European region, with emphasis on the former Soviet countries. World Health Organization. Regional Office for Europe (2003).
21. Harrell FE. Regression Modeling Strategies: With Applications to Linear Models, Logistic Regression, and Survival Analysis. Vol. 608. United States: Springer (2001).
22. Becquey E, Martin-Prevel Y, Traissac P, Dembélé B, Bambara A, Delpeuch F. The household food insecurity access scale and an index-member dietary diversity score contribute valid and complementary information on household food insecurity in an urban west-African setting. J Nutr. (2010) 140(12):2233–40. doi: 10.3945/jn.110.125716
23. de Jager I, Borgonjen-Van Den Berg KJ, Giller KE, Brouwer ID. Current and potential role of grain legumes on protein and micronutrient adequacy of the diet of rural Ghanaian infants and young children: using linear programming. Nutr J. (2019) 18:1–16. doi: 10.1186/s12937-019-0435-5
24. Zhao W, Yu K, Tan S, Zheng Y, Zhao A, Wang P, et al. Dietary diversity scores: an indicator of micronutrient inadequacy instead of obesity for Chinese children. BMC Public Health. (2017) 17:1–11. doi: 10.1186/s12889-017-4381-x
25. Gibson S, Sidnell A. Nutrient adequacy and imbalance among young children aged 1–3 years in the UK. Nutrition Bulletin. (2014) 39(2):172–80. doi: 10.1111/nbu.12087
26. Mallard SR, Houghton LA, Filteau S, Chisenga M, Siame J, Kasonka L, et al. Micronutrient adequacy and dietary diversity exert positive and distinct effects on linear growth in urban Zambian infants. J Nutr. (2016) 146(10):2093–101. doi: 10.3945/jn.116.233890
27. Nithya DJ, Bhavani RV. Factors which may limit the value of dietary diversity and its association with nutritional outcomes in preschool children in high burden districts of India. Asia Pac J Clin Nutr. (2018) 27(2):413–20.29384331
28. Sanin KI, Islam MM, Mahfuz M, Ahmed AS, Mondal D, Haque R, et al. Micronutrient adequacy is poor, but not associated with stunting between 12 and 24 months of age: a cohort study findings from a slum area of Bangladesh. PLoS One. (2018) 13(3):e0195072. doi: 10.1371/journal.pone.0195072
29. Hatløy A, Torheim LE, Oshaug A. Food variety—a good indicator of nutritional adequacy of the diet? A case study from an urban area in Mali, West Africa. Eur J Clin Nutr. (1998) 52(12):891–8. doi: 10.1038/sj.ejcn.1600662
30. Chaudhury RH. Determinants of dietary intake and dietary adequacy for pre-school children in Bangladesh. Food Nutr Bull. (1984) 6(4):1–10. doi: 10.1177/156482658400600408
31. Kimiywe J, Chege P. Determinants of com-plementary feeding and nutrition Status of children 6–23 months in Vi-higa county. Kenya. BAOJ Pediat. (2017) 3:032.
32. Ahmed KY, Page A, Arora A, Ogbo FA. Trends and factors associated with complementary feeding practices in Ethiopia from 2005 to 2016. Matern Child Nutr. (2020) 16(2):e12926. doi: 10.1111/mcn.12926
33. Abeshu MA, Adish A, Haki GD, Lelisa A, Geleta B. Evaluation of energy, protein, and selected micronutrient density of homemade complementary foods consumed by children between 6 months and 23 months in food insecure woredas of Wolayita zone, southern Ethiopia. Nutr Diet Suppl. (2016) 2016:71–84. doi: 10.2147/NDS.S112736
34. Allen L. Guidelines on Food Fortification with Micronutrients. Washington, DC: World Health Organization (2006).
35. Akerele D, Sanusi RA, Fadare OA, Ashaolu OF. Factors influencing nutritional adequacy among rural households in Nigeria: how does dietary diversity stand among influencers? Ecol Food Nutr. (2017) 56(2):187–203. doi: 10.1080/03670244.2017.1281127
36. Gunaratna NS, Moges D, De Groote H. Biofortified maize can improve quality protein intakes among young children in southern Ethiopia. Nutrients. (2019) 11(1):192. doi: 10.3390/nu11010192
37. Poh BK, Ng BK, Haslinda MD, Shanita SN, Wong JE, Budin SB, et al. Nutritional status and dietary intakes of children aged 6 months to 12 years: findings of the nutrition survey of Malaysian children (SEANUTS Malaysia). Br J Nutr. (2013) 110(S3):S21–35. doi: 10.1017/S0007114513002092
38. Vossenaar M, van Beusekom I, Alvey J, Doak CM, Solomons NW. Several problem nutrients are identified in the complementary diet of 6 to 11 month old breastfed children in western Guatemala. Asia Pac J Clin Nutr. (2018) 27(5):1084–94. doi: 10.6133/apjcn.042018.08
39. Edris M, Atnafu N, Abota T. Determinants of dietary diversity score among children age between 6 and 23 months in bench Maji zone, southwest Ethiopia. Ped Health Res. (2018) 3(3):10.
Keywords: mean nutrient adequacy ratio, children, northeast, Ethiopia, complementary foods, associated factors
Citation: Kassaw A, Chane Mekonnen T, Tadesse Amsalu E, ABeje ET, Daba C, Tsega Y and Endawkie A (2025) Mean nutrient adequacy ratio and associated factors of complementary foods among children aged 6–23 months in Northeast Ethiopia. Front. Pediatr. 13:1446431. doi: 10.3389/fped.2025.1446431
Received: 9 June 2024; Accepted: 3 February 2025;
Published: 7 March 2025.
Edited by:
Olutosin Ademola Otekunrin, University of Ibadan, NigeriaReviewed by:
Samson Nivins, Karolinska Institutet (KI), SwedenCopyright: © 2025 Kassaw, Chane Mekonnen, Tadesse Amsalu, ABeje, Daba, Tsega and Endawkie. This is an open-access article distributed under the terms of the Creative Commons Attribution License (CC BY). The use, distribution or reproduction in other forums is permitted, provided the original author(s) and the copyright owner(s) are credited and that the original publication in this journal is cited, in accordance with accepted academic practice. No use, distribution or reproduction is permitted which does not comply with these terms.
*Correspondence: Abel Endawkie, YWJlbGVuZGF3a2llQGdtYWlsLmNvbQ==
Disclaimer: All claims expressed in this article are solely those of the authors and do not necessarily represent those of their affiliated organizations, or those of the publisher, the editors and the reviewers. Any product that may be evaluated in this article or claim that may be made by its manufacturer is not guaranteed or endorsed by the publisher.
Research integrity at Frontiers
Learn more about the work of our research integrity team to safeguard the quality of each article we publish.