 Charmaine Chew1,2
 Misa Matsuyama3
 Peter S. W. Davies3Rebecca J. Hill3
 Mark Morrison4
 Rocio Martin5
 Francisco M. Codoñer5
 Jan Knol2,5
 Guus Roeselers5*
- 1Danone Research & Innovation, Singapore, Singapore
- 2Laboratory of Microbiology, Wageningen University, Wageningen, Netherlands
- 3Faculty of Medicine, Child Health Research Centre, The University of Queensland, Brisbane, QLD, Australia
- 4Faculty of Medicine, Frazer Institute, The University of Queensland, Brisbane, QLD, Australia
- 5Danone Research & Innovation, Utrecht, Netherlands
Early-life gut microbiota development depends on a highly synchronized microbial colonization process in which diet is a key regulator. Microbiota transition toward a more adult-like state in toddlerhood goes hand in hand with the transition from a milk-based diet to a family diet. Microbiota development during the first year of life has been extensively researched; however, studies during toddlerhood remain sparse. Young children's requirement for micronutrients, such as dietary iron, is higher than adults. However, their intake is usually sub-optimal based on regular dietary consumption. The Child Health and Residence Microbes (CHaRM) study, conducted as an adjunct to the GUMLi (Growing Up Milk “Lite”) trial, was a double-blind randomized controlled trial to investigate the effects on body composition of toddler milk compared to unfortified standard cow's milk in healthy children between 1 and 2 years of age in Brisbane (Australia). In this trial, fortified milk with reduced protein content and added synbiotics [Bifidobacterium breve M-16V, short-chain galactooligosaccharides, and long-chain fructooligosaccharides (ratio 9:1)] and micronutrients were compared to standard unfortified cow's milk. In the present study, the effects of the intervention on the gut microbiota and its relationship with iron status in toddlers were investigated in a subset of 29 children (18 in the Active group and 11 in the Control group) who completed the CHaRM study. The toddler microbiota consisted mainly of members of the phyla Firmicutes, Bacteroidota, and Actinobacteriota. The abundance of the B. breve species was quantified and was found to be lower in the Control group than in the Active group. Analysis of blood iron markers showed an improved iron status in the Active group. We observed a positive correlation between Bifidobacterium abundance and blood iron status. PICRUSt, a predictive functionality algorithm based on 16S ribosomal gene sequencing, was used to correlate potential microbial functions with iron status measurements. This analysis showed that the abundance of predicted genes encoding for enterobactin, a class of siderophores specific to Enterobacteriaceae, is inversely correlated with the relative abundance of members of the genus Bifidobacterium. These findings suggest that healthy children who consume a young child formula fortified with synbiotics as part of a healthy diet have improved iron availability and absorption in the gut and an increased abundance of Bifidobacterium in their gut microbiome.
Introduction
As infants grow, many micronutrients are needed for their development. Macro- and micronutrient deficiencies increase a young child's risk of infection and can compromise growth and health trajectories (1). Iron (Fe) deficiency is considered the most frequent micronutrient deficiency and has been reported to predispose children to the aforementioned risks (2–4). Furthermore, studies have shown that an iron deficiency in infancy has a long-term impact on mental, motor, and cognitive functions later in life (5–7). This is especially important as dietary iron requirements are higher in children during the first 2 years of life and adequate iron status is a prerequisite for optimal child development, especially in toddlerhood (2).
When consumed according to the appropriate nutritional guidelines, cow's milk provides essential micro- and macronutrients to a toddler's diet, especially when transitioning from a predominantly milk-based diet to a family diet. However, cow's milk is naturally low in iron and high in calcium, which has an inhibitory effect on iron bioavailability (8). It has been widely documented that the consumption of fortified milk by infants and toddlers results in a better iron status than in children consuming cow's milk (9–11). Furthermore, cow's milk from 1 year of age is often a significant contributor to the total dietary protein intake. Rolland-Cachera et al. (12) reported that protein intake above metabolic requirements is correlated with increased secretion of growth mediators, insulin, and insulin-like growth factor I, which could enhance fat deposition and weight gain, along with increased body fat and risk of obesity in later life (13, 14). Furthermore, it has been documented that nutrient levels in usual family diets often do not fully support the micro-/macronutrients required for a child's development (15–18). It has previously been demonstrated that the consumption of suitable amounts of fortified milk as a supplement to the regular family diet is an effective source of complementary nutrition (11, 19).
De Filippo et al. (20) demonstrated that dietary fiber and protein intake variations can profoundly impact the gut microbiota in children from different countries. The functional diversity of the microbiota reflects diet and life style. This illustrated by the observation that children in rural Burkina Faso have a gut microbiome enriched in taxa known to have the capacity to break down polysaccharides, in contrast to Italian children of the same age.
Several studies have highlighted the interaction between nutrition and microbiota composition in undernutrition conditions. Some bacterial groups, such as Pseudomonadota (synonym Proteobacteria) or Enterococcaceae spp., have been associated with diarrhea and an overgrowth of opportunistic bacteria in malnutrition conditions (21, 22). However, such a distinctive characteristic is usually less apparent in healthy cohorts, where microbiota signatures are generally less conclusive as there are multiple factors such as inter-subject variability, diet, and genetics (23–27).
Lovell et al. (28) showed that nutrient supplementation of young child formula (YCF) with synbiotics as part of a complete diet for 12 months between the ages of 1 and 2 years resulted in significantly higher Fe, vitamin D, vitamin C, and zinc (Zn) levels in children compared to unfortified cow's milk. In addition, Matsuyama et al. (29) showed that this YCF with synbiotics facilitated the recruitment and expansion of the Bifidobacterium spp. among children who consumed this formula. In this study, we aim to explore the effect of synbiotics on the composition and functionality of the gut microbiome through taxonomic classification and predicted microbial metabolic pathway analyses.
Materials and methods
Subjects and study population
This study used a subset of samples from the Child Health and Residence Microbes (CHaRM) study (30, 31) conducted in Brisbane, Australia, selected based on the depth and quality of available DNA sequencing data. Briefly, the CHaRM study was conducted as an adjunct to the GUMLi (Growing Up Milk “Lite”) trial, a multi-center double-blind, randomized control trial (Brisbane, Australia, and Auckland, New Zealand) investigating the effect of a fortified young child formula (Active) compared to unfortified cow's milk (Control) on various outcomes in toddlers between the ages of 1 and 2 years (30).
The Active group received fortified milk supplemented with synbiotics: a formulation with 7.8 × 10⁸ cfu/100 ml of B. breve M-16V, 1.8 g of short-chain galactooligosaccharides (scGOS), and 0.2 g of long-chain fructooligosaccharides (lcFOS) per 100 ml (Supplementary Table 1). The participants consumed two 150 mL servings of formula daily. An energy-matched, non-fortified cow’s milk was used as a Control. In addition, the Active milk was fortified with 1.3 mg of Fe and 1.2 µg of vitamin D and vitamin C to increase the bioavailability of non-heme Fe (ferrous citrate). Further compositional differences between the Active and the Control milk are described in the study by Wall et al. (30) and the corresponding ethical approval can be found in the study by Matsuyama et al. (29).
Of the 48 children who completed the CHaRM study, a subset of 29 (18 subjects from the Active group and 11 from the Control group, details in Supplementary Table 2), for which a minimum of 15,000 high-quality sequencing reads were generated, was included in the current study.
Blood parameters
Blood samples were collected at baseline and month 12 as described by Lovell et al. (28). In this study, we aimed to link the same parameters [serum iron, ferritin, and hemoglobin (Hb)] with the functional analyses of the gut microbiome.
Fecal DNA isolation and sequencing
All fecal samples were collected and preserved, and gut microbiota DNA was extracted as described previously (31). Briefly, a repeated beat-beating and a column (RBB + C) technique was used based on Yu and Morrison (32) and modified to suit the automated Maxwell 16MDx system (Promega, Madison, WI, USA). An aliquot of each fecal sample was mixed with beads, homogenized with lysis buffer, and homogenized in a Precellys 24 homogenizer (Bertin Corp, Rockville, MD, USA). After the protocol was completed, the supernatant was transferred into Maxwell 16 MDx cartridges for elution. At this step, a non-template control was used to check the quality of each batch of buffers (lysis and elution). DNA samples were normalized to sample concentration before the creation of 16S rRNA gene amplicon libraries following Illumina library preparation instructions, using the primers of Klindworth et al. (33) to amplify the V3-V4 hypervariable regions of the bacterial 16s rRNA gene region. The libraries were then sequenced for 300 paired-end cycles using the Illumina MiSeq platform.
Quantitative polymerase chain reaction
In parallel, we used four targeted quantitative polymerase chain reaction (q-PCR) assays to detect total bacteria, total Bifidobacterium, B. breve group, and B. breve M-16V strain. Briefly, the normalized DNA samples were used for all the amplified quantitative real-time PCR amplification performed using an ABI Prism 7900HT (Applied Biosystems, California, USA) using the TaqMan Universal Master Mix (Applied Biosystems, Austin, TX, USA). Standards for each target were generated from their genomic DNA and were amplified with specific primers, and purified using a MinElute PCR Purification Kit (Qiagen, Valencia, CA, USA) as per the manufacturer’s protocol. Final standard concentrations were quantified using a NanoDrop 2000 (Thermo Scientific, Waltham, MA, USA). For a detailed description of the methods, including the oligonucleotide sequences of the primers and probes used for the q-PCR analyses, please see Chua et al. (34).
Samples were prepared using a Microlab NIMBUS (Hamilton Robotics, Reno, Nevada, USA) in a customized setup. The q-PCR conditions were 1 cycle of 95°C for 20 s, followed by amplification at 95°C for 1 s, and 62°C for 20s for 40 cycles, and then 1 cycle of 95°C for 15 s, followed by 60°C for 15 s, and 95°C for 15 s. SDS 2.4 (Applied Biosystems) was used to visualize and check the abnormality of the curves deviating from standard amplification. Raw data were then exported into Microsoft Excel, where the Ct values were transformed to log copy numbers per gram of feces for the statistical analyses.
16S rRNA gene sequencing analysis
The data analysis performed in this sub-study differs from that of Matsuyama et al. (29) by using a higher sequence coverage cut-off and optimized sequence data quality control. Briefly, pre-processing and filtering of the raw 16S rRNA gene sequence data resulted in an average of 18,916 high-quality reads per sample, and each rarefaction analysis showed slopes reaching a plateau, indicating that a sufficient sequencing depth had been achieved. An adaptation of the “Quantitative Insights into Microbial Ecology” (QIIME) v1.9.1 package (35) was used for the processing and analysis as described in (29). The paired-end reads were demultiplexed and trimmed (q > 20) before being merged using QIIME. These were dereplicated and counted using mothur (36) and reads with a low abundance (less than 2 reads across all samples) were discarded. Chimeras were removed using VSEARCH (37), using the RDP gold database (38) as a reference. Reads that contained PhiX or adapters as defined in Deblur (part of QIIME2) (39) were eliminated. Taxonomic assignment was performed using the RDP classifier (40) against the SILVA_138.1 database (41), from which results where the sequences were aggregated at the genus and phylum level, were further explored. Reads with eukaryotic assignments and reads with a low relative abundance of up to 0.0005% across all samples were excluded from further downstream analysis. Samples were rarefied, and α-diversity was calculated using the phyloseq (42) and vegan (43) packages in R software (version 3.5.1) (44).
In addition to the amplicon-based analysis, we used a metagenome functional content bioinformatics package that provides potential functional category abundances for a microbial community from marker genes extracted from full genomes using 16S operational taxonomic unit (OTU) profiles as implemented in the PICRUSt software package (45) using the default parameter. Briefly, the 16S OTUs were normalized by copy number and mapped onto a phylogenetic tree created from an ancestral state reconstruction (ASR) reference genome database with more than 10× coverage. The predicted metagenome functional abundance counts per sample were then collapsed into functional categories based on KEGG Gene Orthology pathways for analyses. We investigated the change in predicted functionality abundances using the delta difference in the counts at baseline and at month 12.
Statistical analysis
PRISM GraphPad 8 (version 8.4.3) was used for all the statistical analyses. The change from baseline within each group was analyzed using a non-parametric pair-wise Mann–Whitney test. The baseline and end-of-intervention parameters of the groups were compared using a non-parametric Wilcoxon test. The effect size was calculated using Cohen's d, where the mean difference between the two groups was divided by the pooled standard deviation. The interaction of the intestinal microbiota composition with the intervention was visualized spatially using distance matrices in the principal component analysis (PCA), an unconstrained ordination method, using CANOCO 5 (2012) software. The Benjamini–Hochberg procedure (46) was used to reduce the false discovery rate (FDR) for all comparisons (within each group, at baseline, and at the end of the intervention) made using the predicted microbial functionalities.
Results
In this subset study, the participants were evenly divided by gender and anthropometric measurements, such as weight and length at baseline, with no significant differences observed (Supplementary Table 1). At the end of the intervention, there were significant differences as noted in previous publications (28–30).
Blood parameters
The same findings in the main GUMLi study were observed in this subset of samples from the CHaRM study. There was no statistically significant difference in serum iron at baseline between the groups (p = 0.111), and significant differences were detected at the end of the study within the Active group (p < 0.0008, effect size d = 1.390574) but not within the Control group (p = 0.898) (Figure 1). Similarly, there was no difference at baseline between the groups for transferrin, 25(OH)D and ferritin, (p > 0.05) amongst this subset of samples (data not shown). We did not observe a significant difference between the groups in hemoglobin levels at baseline (p = 0.346) or at month 12 (p = 0.580).
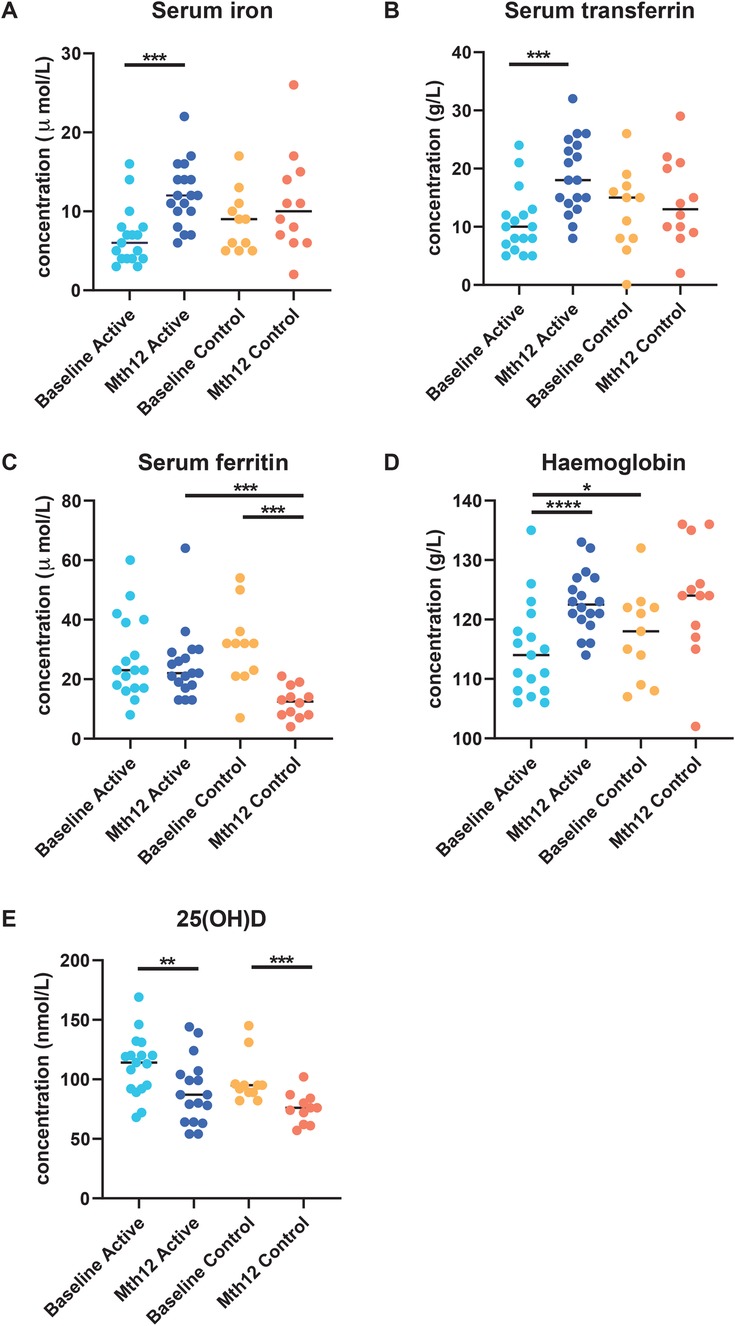
Figure 1. Blood serum parameters (A) serum iron, (B) serum ferritin, (C) serum transferrin, (D) hemoglobin, and (E) 25(OH)D were measured at baseline and at the end of the intervention (month 12) in participants in both groups as reported previously by Lovell et al. (28). Serum iron (A) and transferrin (C) increased in the Active group, while no significant difference was observed in the Control group. A significant decrease in serum ferritin (B) was observed between baseline and month 12 in the Control group. At month 12, serum ferritin was significantly lower in the Control group than in the Active group.
The hemoglobin levels were significantly increased from baseline to month 12 in the Active group (p < 0.0001, effect size = 1.125876), while it was significant in the Control group for the same comparison (p = 0.024). The Vitamin D indicator, 25(OH)D, was significantly reduced from baseline to month 12 in both the Active (p = 0.003, effect size = 0.826) and the Control groups (p = 0.001, effect size d = 1.399) although they were still within the healthy range according to the Endocrine Society’s Clinical Practice Guidelines (>50 nmol/L) (47).
At the end of the study, there were significantly higher transferrin levels in the Active group from baseline to month 12 (p = 0.0029) compared to the Control group from baseline to month 12 (p = 0.527). In addition, serum ferritin concentration was significantly lower at month 12 compared to the baseline in the Control group (p = 0.001). A significant difference was only observed at month 12 between the Active and Control groups (p = 0.0002) (Figure 1).
q-PCR
We quantified the total bacteria [copy number in feces (log10/g)] in the fecal samples and observed an increase that was significantly different from baseline to month 12 in the Active group [mean difference 0.84 (log10/g), p = 0.001] and in the Control group [mean difference 0.30 (log10/g), p = 0.032]. No significant difference was observed at baseline or at month 12 between the intervention groups. We observed no significant difference in the total count of Bifidobacterium copy number in feces (log10/g) at baseline or at month 12 between the Active and Control groups. There was a significant decrease in the B. breve group in the Control group from baseline to month 12 [0.79 (log10/g), p = 0.049]. This decrease was not observed in the Active group. The supplemented probiotic strain, B. breve M-16V, was only detected in the Active group and we observed a significant increase [1.66 (log10/g), p ≤ 0.001] between baseline and month 12 (Supplementary Figure 1).
16S rRNA gene profiling and functionality predictions
The major bacterial phyla present in this subset of samples were the same as previously reported (29), namely, Firmicutes, Bacteroidetes, and Actinobacteria, characteristic of healthy human gut microbiota. Increased α-diversity among this subset of samples was also demonstrated (Supplementary Figure 2). Here, we report the most abundant bacteria genera showing significant differences between baseline and month 12. Bifidobacterium decreased in the Control group from 20.6% at baseline to 7.9% at month 12 (p = 0.020). The Escherichia-Shigella group significantly decreased during the intervention in the Active group (from 4.17% to 0.18%) (p = 0.0017) and the Control group (from 1.8% to 0.30%) (p = 0.004) (Supplementary Figures 3A,C). For the other genera investigated, such as Bacteroides, Collinsella, and Faecalibacterium, no significant differences were observed (Supplementary Figure 3). Furthermore, the genus Veillonella showed a significant decrease as observed previously (29), most noticeably in the Active group.
In Figure 2, the 10 most abundant predicted functionalities were subjected to PCA. PCA Axis 1 explained 41.13% of the variation, with the most significant predicted functions pointing (red arrows) to the right quadrants. However, the majority of the samples, regardless of group or timepoint, congregated and overlapped in the center of the graph. Functional abundance predicted by PICRUSt was compared between the intervention groups at either baseline, month 12 or within each intervention group from baseline to month 12. No significant differences were observed at baseline or month 12 after applying multiple correction (FDR). In the Active (baseline to month 12) and Control group comparison, several functions remained significant after FDR correction (refer to Supplementary Table 3). Among the listed functions, enterobactin biosynthesis was reduced in both the Active (p = 0.00182) and Control (p = 0.047) groups at the end of the study.
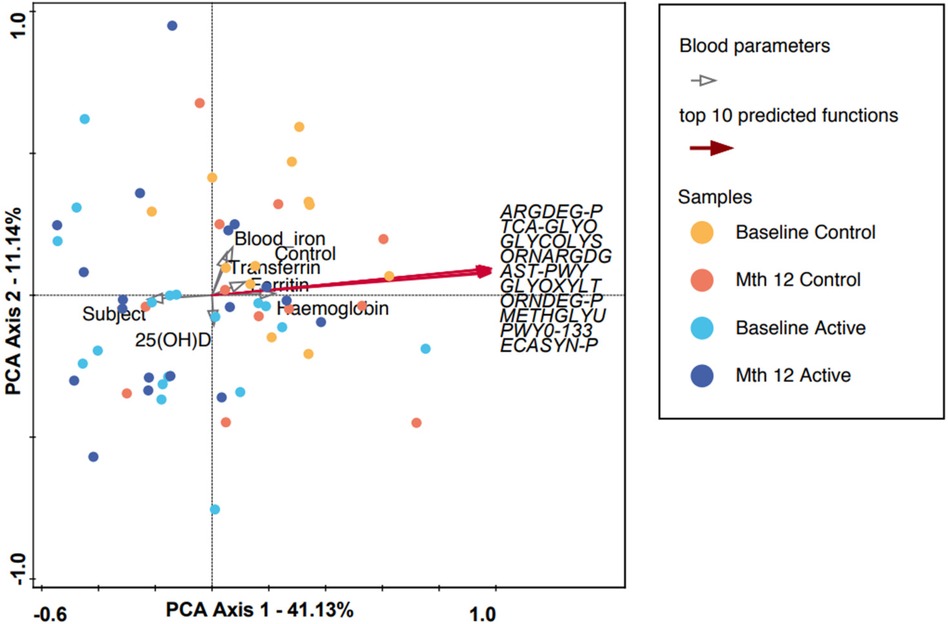
Figure 2. A PCA plot in which each dot represents a microbiota composition sample. Blue and purple indicate the Active group at baseline and month 12, and red and yellow indicate the Control group at baseline and month 12, respectively. PCA axis 1 shows an explained variance of 41.13% with a strong correlation with the top 10 predicted microbial functions (using the PICRUSt algorithm, refer to Supplementary Table 3), while the measured blood parameters are represented by gray clear arrows. ARGDEG-PWY, super-pathway of L-arginine, putrescine, and 4-aminobutanoate degradation; AST-PWY, L-arginine degradation II (AST pathway); ECASYN-PWY, enterobacterial common antigen biosynthesis; ENTBACSYN-PWY, enterobactin biosynthesis; GLYCOL-GLYOXDEG-PWY, super-pathway of glycol metabolism and degradation; GLYOXYLATE-BYPASS, glyoxylate cycle; METHGLYUT-PWY, super-pathway of methylglyoxal degradation; ORNARGDEG-PWY, super-pathway of L-arginine and L-ornithine degradation; ORNDEG-PWY, super-pathway of ornithine degradation; PWY0-1338, polymyxin resistance; TCA-GLYOX-BYPASS, super-pathway of glyoxylate bypass and TCA.
For participants in the Active group at month 12, we observed a trend toward the right quadrant of the PCA plot that was in line with the explained genera and blood parameters (iron, transferrin, and Hb). This separation explained 25.41% of the observed variation in the microbiomes during the intervention (in Supplementary Figure 4). In the Control group, every blood parameter except hemoglobin trended in the opposite direction, although the bacteria genera were also shifted toward the participants at month 12, explaining 46.95% of the variation observed. In addition, Bifidobacterium pointed in the opposite direction (toward baseline), while the remaining top 10 genera pointed toward month 12, indicating a possible normal microbiota maturation with age. We evaluated the influence of the intervention on the microbiota over time by using the delta change in the relative abundance from baseline to month 12. The PCA analysis of the 10 most abundant bacteria genera explained 31.29% of the observed variation, as shown in Figure 3. The figure shows that the clustering in the Active group was mainly driven by Bifidobacterium and Bacteroides. The clustering in the Control group was mainly driven by Prevotella 9 and Sutterella. A combined unconstrained PCA plot is presented in Figure 4. PCA axis 1 explained 25.59% of the variation seen in the microbiota, with the baseline samples clustered in the bottom left quadrant of the plot. The Escherichia-Shigella group pointed in the opposite direction to the other influencing genera that clustered at month 12 (for both Active and Control group samples). On the same plot, serum ferritin and 250HD pointed toward the left quadrants (higher levels at baseline) while serum iron, transferrin, and hemoglobin pointed toward the month 12 samples (increased levels at the end of the intervention). This is consistent with the results shown in Figure 1.
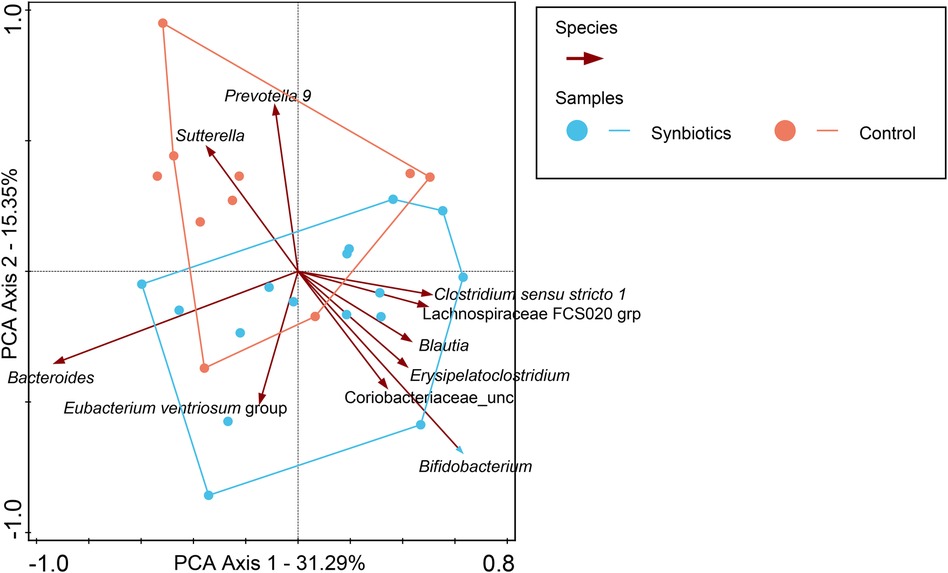
Figure 3. In this PCA coordinate plot, the changes in relative abundance from baseline for each sample (month 12 to baseline) were used. From the plot, it can be observed that Bifidobacterium is one of the most influential factors driving the synbiotics group cluster, while in the Control group, it is Prevotella 9 and Sutterella.
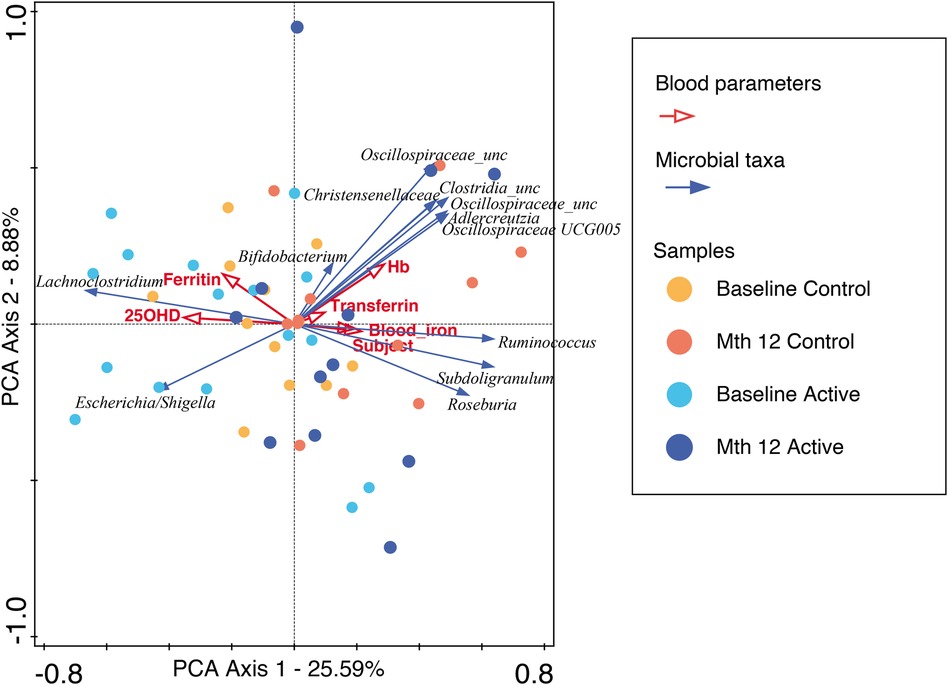
Figure 4. An unconstrained PCA plot of all the samples using the predicted functionalities as the supplementary variables. The blood parameters are denoted by red arrows and the top 10 bacteria genera by blue arrows. The baseline samples from both the Active and Control groups are predominantly in the left quadrants with Escherichia-Shigella explaining the separation, while the month 12 samples are in the center to right quadrants with blood iron, transferrin, and hemoglobin, along with other bacteria genera, showing temporal changes across the intervention.
Discussion
In this study, we further explored the potential effects of a year-long intervention with YCF supplemented with synbiotics on the gut microbiota composition and predicted the microbial functionality in a subset of children who participated in the CHaRM study (29).
At the end of the intervention, we observed significant differences in several blood parameters; serum iron, transferrin, and hemoglobin levels were higher in the Active group at month 12 compared to baseline. The Control group showed smaller, significant changes for the same corresponding parameters. Serum iron levels were higher in the Active group at month 12. This suggests that increased iron uptake coincided with increased iron carriers (transferrin) in the blood and ferritin stores were maintained in the body.
Iron is an important micronutrient that plays a role in the normal development of mental and motor skills in children (5, 7). In developing countries, the prevalence of iron deficiency in early life is high. However, two recent iron fortification trials in infants in developing countries have raised safety concerns: in Ghana, there was an increased rate of hospitalization possibly due to diarrhea (48), and in Pakistan, a small but significant increase was reported in the overall prevalence of diarrhea (49).
At the gut microbiota level, iron supplementation has been associated with adverse effects such as an increase in opportunistic pathogenic bacteria and a decrease in beneficial bacterial taxa such as Bifidobacteriaceae and Lactobacillaceae when supplemented individually (50–53). Nevertheless, it is still imperative to provide adequate iron-rich complementary foods in the diets of infants and children (54). This supports the rationale for including iron supplementation in YCF to provide sufficient sources of iron for young children. Unfortunately, iron absorption from iron-fortified foods or oral iron supplements is often <20% (55); thus, the majority of the iron passes unabsorbed into the colon. This can adversely favor the growth of potential enteropathogens because iron is a growth-limiting nutrient for the majority of enteric Gram-negative bacteria (e.g., pathogenic Escherichia coli and Salmonella), as iron acquisition is essential for virulence and colonization.
Several studies have shown modulation of the colonic microbiota by pre-, pro-, or synbiotics can mitigate these adverse effects of iron fortification on the gut microbiome (56, 57). This study confirms changes in both the taxonomic composition and the relative abundances of predicted microbial functions over 1 year, indicative of a developing early-life microbiome. The synbiotic intervention resulted in the maintenance of B. breve abundances and did not appear to diminish or stagnate the growth of other bacterial groups. We observed a decrease in B. breve in the Control group while q-PCR quantification showed no difference in Bifidobacterium. However, 16S rRNA sequence data showed a decrease in the total relative abundance of the genus Bifidobacterium. This discrepancy between the results for Bifidobacterium generated by q-PCR and 16S rRNA gene analysis may be attributed in part to the different amplification and normalization biases, as previously reported by Zemb et al. (58). The presence of the supplemented probiotic strain (B. breve M-16 V) was only detected in the Active group, as shown by the q-PCR results. Bifidobacterium is one of the most abundant genera in the gut of breastfed infants and is considered a true “keystone” taxon with a strong eco-physiological impact on the microbiota composition. Therefore, the abundance of Bifidobacterium spp. may serve as a marker of healthy microbiota development and breastfeeding practices (59).
In this study, we observed no other differences in taxonomic composition between the Active and Control groups. Previously, infant formula with B. breve M-16V + scGOS/lcFOS (9:1) was reported to result in a lower fecal pH through the production of acetate. B. breve UCC2003 was reported to secrete iron-binding domains and ferric uptake regulatory proteins (60). It has been proposed that this is an adaptive mechanism to secure the iron required for growth and inhibit potential pathogens that are susceptible to a lower pH (61, 62), and to promote other beneficial bacteria such as butyrate producers through cross-feeding in vitro cultures (63, 64). We observed that Escherichia-Shigella was inversely correlated with butyrate-producing bacteria (e.g., members of the Eubacterium groups, and the genera Ruminococcus and Subdoligranulum) and blood biomarkers (serum iron, transferrin, and hemoglobin) (see Figure 3).
We are aware that these findings are only reflective of a small cohort and emphasize caution in the interpretation of the data as the children in this study were clinically healthy. We hypothesize that the mode of action by which Bifidobacterium may improve host iron bioavailability is by (1) lowering the colonic luminal pH and (2) converting Fe3+ to Fe2+, due to their ferric-reducing activity. In addition, Bifidobacteria may prevent opportunistic pathogenic bacteria from utilizing the scarce amount of iron either by (1) competitive exclusion or by (2) reducing Fe2+ accessibility for other microorganisms by competitively binding it to their extracellular membranes (60, 65–67). Several studies have demonstrated that iron supplementation resulted in a less detrimental effect on the microbiota when complemented with prebiotics, probiotics, or synbiotics (56, 57, 68–71).
The 10 most abundant predicted microbial functions included enterobactin biosynthesis, enterobacterial common antigen biosynthesis, and polymyxin resistance genes (see Supplementary Table 3). These pathways are adaptations that allow opportunistic pathogenic bacteria such as Enterobacteriaceae to grow under iron-limited conditions but the metabolic cost of carrying the genes to synthesize microbial iron chelators such as siderophores is significant. The presence of these functions suggests that iron is a limitation for potential opportunistic pathogens to thrive. In this study, healthy children who underwent the year-long intervention with a synbiotic formula or a cow's milk control formula showed a reduction in Escherichia-Shigella and enterobactin biosynthesis function, which provided insight into gut microbiota maturation over time. In the Active group, in addition to the microbial maturation, improved blood iron status markers were observed. This appears to support the current hypothesis that microbiome modulation in combination with iron supplementation can improve absorption and utilization and reduce the risk of iron deficiency anemia, as proposed in other studies (72–74).
Toddlerhood is an important phase in life in which adequate nutrition with micro- and macronutrients is essential for growth and development. This study has provided us with a working hypothesis on the effect of synbiotics on toddler gut microbiota composition and microbial function. In the presence of synbiotics, iron absorption may be improved through the acidification of the gut. As the study aimed to compare the effects of synbiotic-supplemented formula with cow's milk, which is a common practice, we were unable to independently differentiate the effects of iron fortification from the interaction of synbiotics with the microbiota composition. We propose that this hypothesis should be addressed using existing publicly available studies and in future clinical trials.
Data availability statement
The original contributions presented in the study are publicly available. These data can be found here: European Nucleotide Archive (ENA) under accession number PRJEB66204 (https://www.ebi.ac.uk/ena/browser/view/PRJEB66204).
Ethics statement
The studies involving humans were approved by the University of Queensland Human Research Ethics Committee. The studies were conducted in accordance with the local legislation and institutional requirements. Written informed consent for participation in this study was provided by the participants’ legal guardians/next of kin.
Author contributions
CC wrote the manuscript. CC, GR, and FC analyzed and interpreted the data. The clinical study was conducted and designed by MMo, RH, MMa, and PD. MMa was involved in the execution of the clinical study, managing the collection of samples and processing of samples. All authors contributed to the reviewing, finalizing, and approval of the manuscript. All authors contributed to the article and approved the submitted version.
Funding
The authors declare financial support was received for the research, authorship, and/or publication of this article. The CHaRM study, conducted as an adjunct to the GUMLi (Growing Up Milk “Lite”) trial, received an investigator initiated grant from Danone Nutricia Australia Pty Ltd.
Conflict of interest
The clinical study was supported by Danone Nutricia Australia Pty Ltd. Industry Funded Research: This study was an industry-based collaboration and scientist affiliated with Danone Research & Innovation were involved in the study hypothesis/design, execution, analysis, and interpretation. Hereby the authors declare that: (1) Industry funding was transparent, acknowledged, and appropriately recognized throughout all stages of design, implementation, and reporting. (2) Project design, implementation, analysis, and interpretation have been performed with efforts to maximize academic independence in each of these areas. Danone Research & Innovation conducts clinical research according to ICH-GCP guidelines, the Declaration of Helsinki and the WHO code. In addition, our Quality Management system for clinical research has been ISO 9001 certified since 2007, and has been recertified every 3 years. Certified compliance with ICH-GCP standards provides public assurance that the rights, safety and wellbeing of trial subjects are protected, and that clinical-trial data are scientifically credible. (3) The researchers associated with Wageningen University & Research and the University of Queensland retained complete academic independence throughout the project and had full access to all of the data in this study and take complete responsibility for the integrity of the data and the accuracy of the data analysis. CC, FC, RM, JK, and GR are employees of Danone (Singapore and the Netherlands).
Publisher's note
All claims expressed in this article are solely those of the authors and do not necessarily represent those of their affiliated organizations, or those of the publisher, the editors and the reviewers. Any product that may be evaluated in this article, or claim that may be made by its manufacturer, is not guaranteed or endorsed by the publisher.
Supplementary material
The Supplementary Material for this article can be found online at: https://www.frontiersin.org/articles/10.3389/fped.2024.1193027/full#supplementary-material
Supplementary Table 1 | Nutritional composition of the formula used in the trial.
Supplementary Table 2 | Anthropometric measurements of the participants included in this study.
Supplementary Table 3 | Comparisons generated within groups/timepoints using the PICRUSt generated functionalities with FDR corrections.
Supplementary Figure 1 | q-PCR quantified log scale copy number of the various targets with median center bars.
Supplementary Figure 2 | α-diversity showing (A) Shannon and (B) Simpson indices showing an increase in diversity over time.
Supplementary Figure 3 | Relative abundance of several genera was found to have changed by the end of the intervention.
Supplementary Figure 4 | PCA analyses showing the top 10 most abundant genera contributing to the microbiota of participants in the Active (right) and Control (left) groups. Bifidobacterium was enforced in the graphs. The Control group had more opportunistic pathogens associated with it at the end of the intervention compared to the Active (synbiotics) group.
References
1. Savage JS, Fisher JO, Birch LL. Parental influence on eating behavior: conception to adolescence. J Law Med Ethics. (2007) 35(1):22–34. doi: 10.1111/j.1748-720X.2007.00111.x
2. Domellöf M, Braegger C, Campoy C, Colomb V, Decsi T, Fewtrell M, et al. Iron requirements of infants and toddlers. J Pediatr Gastroenterol Nutr. (2014) 58(1):119–29. doi: 10.1097/MPG.0000000000000206
3. Borre YE, O’Keeffe GW, Clarke G, Stanton C, Dinan TG, Cryan JF. Microbiota and neurodevelopmental windows: implications for brain disorders. Trends Mol Med. (2014) 20(9):509–18. doi: 10.1016/j.molmed.2014.05.002
4. Gordon N. Iron deficiency and the intellect. Brain Dev. (2003) 25(1):3–8. doi: 10.1016/s0387-7604(02)00148-1
5. Walker SP, Grantham-Mcgregor SM, Powell CA, Chang SM. Effects of growth restriction in early childhood on growth, IQ, and cognition at age 11 to 12 years and the benefits of nutritional supplementation and psychosocial stimulation. J Pediatr. (2000) 137(1):36–41. doi: 10.1067/mpd.2000.106227
6. Kane AV, Dinh DM, Ward HD. Childhood malnutrition and the intestinal microbiome. Pediatr Res. (2015) 77(1):256–62. doi: 10.1038/pr.2014.179
7. Lukowski AF, Koss M, Burden MJ, Jonides J, Nelson CA, Kaciroti N, et al. Iron deficiency in infancy and neurocognitive functioning at 19 years: evidence of long-term deficits in executive function and recognition memory. Nutr Neurosci. (2010) 13(2):54–70. doi: 10.1179/147683010X12611460763689
8. Ziegler EE. Consumption of cow’s milk as a cause of iron deficiency in infants and toddlers. Nutr Rev. (2011) 69(suppl_1):S37–42. doi: 10.1111/j.1753-4887.2011.00431.x
9. Ghisolfi J, Fantino M, Turck D, de Courcy GP, Vidailhet M. Nutrient intakes of children aged 1–2 years as a function of milk consumption, cows’ milk or growing-up milk. Public Health Nutr. (2013) 16(3):524–34. doi: 10.1017/S1368980012002893
10. Eussen S, Alles M, Uijterschout L, Brus F, van der Horst-Graat J. Iron intake and status of children aged 6–36 months in Europe: a systematic review. Ann Nutr Metab. (2015) 66(2–3):80–92. doi: 10.1159/000371357
11. Matsuyama M, Harb T, David M, Davies PS, Hill RJ. Effect of fortified milk on growth and nutritional status in young children: a systematic review and meta-analysis. Public Health Nutr. (2017) 20(7):1214–25. doi: 10.1017/S1368980016003189
12. Rolland-Cachera MF, Deheeger M, Bellisle F, Sempé M, Guilloud-Bataille M, Patois E. Adiposity rebound in children: a simple indicator for predicting obesity. Am J Clin Nutr. (1984) 39(1):129–35. doi: 10.1093/ajcn/39.1.129
13. Günther ALB, Buyken AE, Kroke A. The influence of habitual protein intake in early childhood on BMI and age at adiposity rebound: results from the DONALD study. Int J Obes. (2006) 30(7):1072–9. doi: 10.1038/sj.ijo.0803288
14. Rolland-Cachera MF, Deheeger M, Akrout M, Bellisle F. Influence of macronutrients on adiposity development: a follow up study of nutrition and growth from 10 months to 8 years of age. Int J Obes Relat Metab Disord. (1995) 19(8):573–8.7489029
15. EFSA Panel on Dietetic Products, Nutrition and Allergies (NDA). Scientific opinion on nutrient requirements and dietary intakes of infants and young children in the European union. EFSA J. (2013) 11(10):3408. doi: 10.2903/j.efsa.2013.3408
16. World Health Organization. Essential Nutrition Actions: Improving Maternal, Newborn, Infant and Young Child Health and Nutrition. WHO Guidelines Approved by the Guidelines Review Committee (2013). Available online at: https://www.who.int/publications/i/item/9789241505550.
17. Hilger J, Goerig T, Weber P, Hoeft B, Eggersdorfer M, Carvalho NC, et al. Micronutrient intake in healthy toddlers: a multinational perspective. Nutrients. (2015) 7(8):6938–55. doi: 10.3390/nu7085316
18. Weaver LT, More JA, Harris G. What foods for toddlers? Nutr Bull. (2008) 33(1):40–6. doi: 10.1111/j.1467-3010.2007.00667.x
19. Vandenplas Y, De Ronne N, Van De Sompel A, Huysentruyt K, Robert M, Rigo J, et al. A Belgian consensus-statement on growing-up milks for children 12–36 months old. Eur J Pediatr. (2014) 173(10):1365–71. doi: 10.1007/s00431-014-2321-7
20. De Filippo C, Cavalieri D, Di Paola M, Ramazzotti M, Poullet JB, Massart S, et al. Impact of diet in shaping gut microbiota revealed by a comparative study in children from Europe and rural Africa. Proc Natl Acad Sci U S A. (2010) 107(33):14691–6. doi: 10.1073/pnas.1005963107
21. Subramanian S, Huq S, Yatsunenko T, Haque R, Mahfuz M, Alam MA, et al. Persistent gut microbiota immaturity in malnourished Bangladeshi children. Nature. (2014) 510(7505):417–21. doi: 10.1038/nature13421
22. Ghosh TS, Gupta SS, Bhattacharya T, Yadav D, Barik A, Chowdhury A, et al. Gut microbiomes of Indian children of varying nutritional status. PLoS One. (2014) 9(4):e95547. doi: 10.1371/journal.pone.0095547
23. Goodrich JK, Waters JL, Poole AC, Sutter JL, Koren O, Blekhman R, et al. Human genetics shape the gut microbiome. Cell. (2014) 159(4):789–99. doi: 10.1016/j.cell.2014.09.053
24. Vandenplas Y, Carnielli VP, Ksiazyk J, Luna MS, Migacheva N, Mosselmans JM, et al. Factors affecting early-life intestinal microbiota development. Nutrition. (2020) 78:110812. doi: 10.1016/j.nut.2020.110812
25. Duncan SH, Lobley GE, Holtrop G, Ince J, Johnstone AM, Louis P, et al. Human colonic microbiota associated with diet, obesity and weight loss. Int J Obes (Lond). (2008) 32(11):1720–4. doi: 10.1038/ijo.2008.155
26. Flint HJ, Duncan SH, Scott KP, Louis P. Links between diet, gut microbiota composition and gut metabolism. Proc Nutr Soc. (2015) 74(1):13–22. doi: 10.1017/S0029665114001463
27. Louis P, Flint HJ. Diversity, metabolism and microbial ecology of butyrate-producing bacteria from the human large intestine. FEMS Microbiol Lett. (2009) 294(1):1–8. doi: 10.1111/j.1574-6968.2009.01514.x
28. Lovell AL, Davies PSW, Hill RJ, Milne T, Matsuyama M, Jiang Y, et al. A comparison of the effect of a growing up milk—lite (GUMLi) vs. cows’ milk on longitudinal dietary patterns and nutrient intakes in children aged 12–23 months: the GUMLi randomised controlled trial. Br J Nutr. (2019) 121(6):678–87. doi: 10.1017/S0007114518003847
29. Matsuyama M, Morrison M, Cao KL, Pruilh S, Davies PSW, Wall C, et al. Dietary intake influences gut microbiota development of healthy Australian children from the age of one to two years. Sci Rep. (2019) 9(1):12476. doi: 10.1038/s41598-019-48658-4
30. Wall CR, Hill RJ, Lovell AL, Matsuyama M, Milne T, Grant CC, et al. A multicenter, double-blind, randomized, placebo-controlled trial to evaluate the effect of consuming growing up milk “lite” on body composition in children aged 12–23 mo. Am J Clin Nutr. (2019) 109(3):576–85. doi: 10.1093/ajcn/nqy302
31. Matsuyama M, Gomez-Arango LF, Fukuma NM, Morrison M, Davies PSW, Hill RJ. Breastfeeding: a key modulator of gut microbiota characteristics in late infancy. J Dev Orig Health Dis. (2019) 10(2):206–13. doi: 10.1017/S2040174418000624
32. Yu Z, Morrison M. Improved extraction of PCR-quality community DNA from digesta and fecal samples. Biotechniques. (2004) 36(5):808–12. doi: 10.2144/04365ST04
33. Klindworth A, Pruesse E, Schweer T, Peplies J, Quast C, Horn M, et al. Evaluation of general 16S ribosomal RNA gene PCR primers for classical and next-generation sequencing-based diversity studies. Nucleic Acids Res. (2013) 41(1):e1. doi: 10.1093/nar/gks808
34. Chua MC, Ben-Amor K, Lay C, Neo AGE, Chiang WC, Rao R, et al. Effect of synbiotic on the gut microbiota of cesarean delivered infants: a randomized, double-blind, multicenter study. J Pediatr Gastroenterol Nutr. (2017) 65(1):102–6. doi: 10.1097/MPG.0000000000001623
35. Caporaso JG, Kuczynski J, Stombaugh J, Bittinger K, Bushman FD, Costello EK, et al. QIIME allows analysis of high-throughput community sequencing data. Nat Methods. (2010) 7(5):335–6. doi: 10.1038/nmeth.f.303
36. Schloss PD, Westcott SL, Ryabin T, Hall JR, Hartmann M, Hollister EB, et al. Introducing mothur: open-source, platform-independent, community-supported software for describing and comparing microbial communities. Appl Environ Microbiol. (2009) 75(23):7537–41. doi: 10.1128/AEM.01541-09
37. Rognes T, Flouri T, Nichols B, Quince C, Mahé F. VSEARCH: a versatile open source tool for metagenomics. PeerJ. (2014) 4:e2584. doi: 10.7717/peerj.2584
38. Cole JR, Wang Q, Fish JA, Chai B, McGarrell DM, Sun Y, et al. Ribosomal database project: data and tools for high throughput rRNA analysis. Nucleic Acids Res. (2014) 42(Database issue):D633–42. doi: 10.1093/nar/gkt1244
39. Bolyen E, Rideout JR, Dillon MR, Bokulich NA, Abnet CC, Al-Ghalith GA, et al. Reproducible, interactive, scalable and extensible microbiome data science using QIIME 2. Nat Biotechnol. (2019) 37(8):852–7. doi: 10.1038/s41587-019-0209-9 Erratum in: Nat Biotechnol. 2019 September 37(9):1091. doi: 10.1038/s41587-019-0252-6.31341288
40. Wang Q, Garrity GM, Tiedje JM, Cole JR. Naive Bayesian classifier for rapid assignment of rRNA sequences into the new bacterial taxonomy. Appl Environ Microbiol. (2007) 73(16):5261–7. doi: 10.1128/AEM.00062-07
41. Pruesse E, Quast C, Knittel K, Fuchs BM, Ludwig W, Peplies J, et al. SILVA: a comprehensive online resource for quality checked and aligned ribosomal RNA sequence data compatible with ARB. Nucleic Acids Res. (2007) 35(21):7188–96. doi: 10.1093/nar/gkm864
42. McMurdie PJ, Holmes S. Phyloseq: an R package for reproducible interactive analysis and graphics of microbiome census data. PLoS One. (2013) 8(4):e61217. doi: 10.1371/journal.pone.0061217
43. Oksanen J, Blanchet FG, Friendly M, Kindt R, Legendre P, McGlinn D, et al. vegan: Community Ecology Package. R Package Version 2.5-2. (2018). Available online at: https://CRAN.R-project.org/package=vegan.
44. R Core Team. R: A Language and Environment for Statistical Computing. Vienna, Austria: R Foundation for Statistical Computing. (2014). Available online at: https://www.R-project.org/.
45. Langille MG, Zaneveld J, Caporaso JG, McDonald D, Knights D, Reyes JA, et al. Predictive functional profiling of microbial communities using 16S rRNA marker gene sequences. Nat Biotechnol. (2013) 31(9):814–21. doi: 10.1038/nbt.2676
46. Benjamini Y, Drai D, Elmer G, Kafkafi N, Golani I. Controlling the false discovery rate in behavior genetics research. Behav Brain Res. (2001) 125(1–2):279–84. doi: 10.1016/S0166-4328(01)00297-2
47. Holick MF, Binkley NC, Bischoff-Ferrari HA, Gordon CM, Hanley DA, Heaney RP, et al. Evaluation, treatment, and prevention of vitamin D deficiency: an endocrine society clinical practice guideline. J Clin Endocrinol Metab. (2011) 96(7):1911–30. doi: 10.1210/jc.2011-0385. Erratum in: J Clin Endocrinol Metab. 2011 Dec;96(12):3908. Erratum in: J Clin Endocrinol Metab. 2024 September 16;109(10):e1991. doi: 10.1210/clinem/dgae373.21646368
48. Zlotkin S, Newton S, Aimone AM, Azindow I, Amenga-Etego S, Tchum K, et al. Effect of iron fortification on malaria incidence in infants and young children in Ghana: a randomized trial. JAMA. (2013) 310(9):938–47. doi: 10.1001/jama.2013.277129
49. Soofi S, Cousens S, Iqbal SP, Akhund T, Khan J, Ahmed I, et al. Effect of provision of daily zinc and iron with several micronutrients on growth and morbidity among young children in Pakistan: a cluster-randomised trial. Lancet. (2013) 382 (9886):29–40. doi: 10.1016/S0140-6736(13)60437-7
50. Jaeggi T, Kortman GA, Moretti D, Chassard C, Holding P, Dostal A, et al. Iron fortification adversely affects the gut microbiome, increases pathogen abundance and induces intestinal inflammation in Kenyan infants. Gut. (2015) 64(5):731–42. doi: 10.1136/gutjnl-2014-307720
51. Gera T, Sachdev HPS. Effect of iron supplementation on incidence of infectious illness in children: systematic review. Br Med J. (2002) 325(7373):1142. doi: 10.1136/bmj.325.7373.1142
52. Zimmermann MB, Chassard C, Rohner F, N’goran EK, Nindjin C, Dostal A, et al. The effects of iron fortification on the gut microbiota in African children: a randomized controlled trial in Côte d’Ivoire. Am J Clin Nutr. (2010) 92(6):1406–15. doi: 10.3945/ajcn.110.004564
53. Kortman GA, Dutilh BE, Maathuis AJ, Engelke UF, Boekhorst J, Keegan KP, et al. Microbial metabolism shifts towards an adverse profile with supplementary iron in the TIM-2 in vitro model of the human colon. Front Microbiol. (2016) 6:1481. doi: 10.3389/fmicb.2015.01481
54. Atkins LA, McNaughton SA, Campbell KJ, Szymlek-Gay EA. Iron intakes of Australian infants and toddlers: findings from the Melbourne infant feeding, activity and nutrition trial (InFANT) program. Br J Nutr. (2016) 115(2):285–93. doi: 10.1017/S0007114515004286
55. Zimmermann MB, Hurrell RF. Nutritional iron deficiency. Lancet. (2007) 370(9586):511–20. doi: 10.1016/S0140-6736(07)61235-5
56. Paganini D, Uyoga MA, Kortman GAM, Cercamondi CI, Moretti D, Barth-Jaeggi T, et al. Prebiotic galacto-oligosaccharides mitigate the adverse effects of iron fortification on the gut microbiome: a randomised controlled study in Kenyan infants. Gut. (2017) 66(11):1956–67. doi: 10.1136/gutjnl-2017-314418
57. Lin F, Wu H, Zeng M, Yu G, Dong S, Yang H. Probiotic/prebiotic correction for adverse effects of iron fortification on intestinal resistance to salmonella infection in weaning mice. Food Funct. (2018) 9(2):1070–8. doi: 10.1039/C7FO00990A
58. Zemb O, Achard CS, Hamelin J, De Almeida ML, Gabinaud B, Cauquil L, et al. Absolute quantitation of microbes using 16S rRNA gene metabarcoding: A rapid normalization of relative abundances by quantitative PCR targeting a 16S rRNA gene spike-in standard. Microbiologyopen. (2020) 9 (3):e977. doi: 10.1002/mbo3.977. Erratum in: Microbiologyopen. 2022 Jun;11(3):e1305. doi: 10.1002/mbo3.1305.31927795
59. Alessandri G, van Sinderen D, Ventura M. The genus Bifidobacterium: from genomics to functionality of an important component of the mammalian gut microbiota. Comput Struct Biotechnol J. (2021) 19:1472–87. doi: 10.1016/j.csbj.2021.03.006
60. Cronin M, Zomer A, Fitzgerald GF, van Sinderen D. Identification of iron-regulated genes of Bifidobacterium breve UCC2003 as a basis for controlled gene expression. Bioeng Bugs. (2012) 3(3):159–69. doi: 10.4161/bbug.18985
61. Turroni F, Foroni E, Pizzetti P, Giubellini V, Ribbera A, Merusi P, et al. Exploring the diversity of the bifidobacterial population in the human intestinal tract. Appl Environ Microbiol. (2009) 75(6):1534–45. doi: 10.1128/AEM.02216-08
62. Ventura M, Turroni F, Motherway MO, MacSharry J, van Sinderen D. Host-microbe interactions that facilitate gut colonization by commensal bifidobacteria. Trends Microbiol. (2012) 20(10):467–76. doi: 10.1016/j.tim.2012.07.002
63. Bunesova V, Lacroix C, Schwab C. Mucin cross-feeding of infant bifidobacteria and Eubacterium hallii. Microb Ecol. (2018) 75(1):228–38. doi: 10.1007/s00248-017-1037-4
64. Rivière A, Selak M, Lantin D, Leroy F, De Vuyst L. Bifidobacteria and butyrate-producing colon bacteria: importance and strategies for their stimulation in the human gut. Front Microbiol. (2016) 7:979. doi: 10.3389/fmicb.2016.00979
65. Vazquez-Gutierrez P, Lacroix C, Jaeggi T, Zeder C, Zimmerman MB, Chassard C. Bifidobacteria strains isolated from stools of iron deficient infants can efficiently sequester iron. BMC Microbiol. (2015) 15(1):3. doi: 10.1186/s12866-014-0334-z
66. Kot E, Bezkorovainy A. Binding of ferric iron to the cell walls and membranes of Bifidobacterium thermophilum: effect of free radicals. J Agric Food Chem. (1999) 47(11):4606–10. doi: 10.1021/jf990474l
67. Yasuda K, Dawson HD, Wasmuth EV, Roneker CA, Chen C, Urban JF, et al. Supplemental dietary inulin influences expression of iron and inflammation related genes in young pigs. J Nutr. (2009) 139(11):2018–23. doi: 10.3945/jn.109.110528
68. Sazawal S, Dhingra U, Hiremath G, Sarkar A, Dhingra P, Dutta A, et al. Effects of Bifidobacterium lactis HN019 and prebiotic oligosaccharide added to milk on iron status, anemia, and growth among children 1 to 4 years old. J Pediatr Gastroenterol Nutr. (2010) 51(3):341–6. doi: 10.1097/MPG.0b013e3181d98e45
69. Castro LCV, Costa NMB, Sant’Anna HMP, Ferreira CLDLF, Franceschini SDCDC. Improvement the nutritional status of pre-school children following intervention with a supplement containing iron, zinc, copper, vitamin A, vitamin C and prebiotic. Ciência Saúde Coletiva. (2017) 22(2):359–68. doi: 10.1590/1413-81232017222.15902015
70. Christides T, Ganis JC, Sharp PA. In vitro assessment of iron availability from commercial young child formulae supplemented with prebiotics. Eur J Nutr. (2018) 57(2):669–78. doi: 10.1007/s00394-016-1353-3
71. Vieira AT, Teixeira MM, Martins FS. The role of probiotics and prebiotics in inducing gut immunity. Front Immunol. (2013) 4:445. doi: 10.3389/fimmu.2013.00445
72. McCarthy EK, Ní Chaoimh C, Hourihane JO, Kenny LC, Irvine AD, Murray DM, et al. Iron intakes and status of 2-year-old children in the cork BASELINE birth cohort study. Matern Child Nutr. (2017) 13(3):e12320. doi: 10.1111/mcn.12320
73. Rusu IG, Suharoschi R, Vodnar DC, Pop CR, Socaci SA, Vulturar R, et al. Iron supplementation influence on the gut microbiota and probiotic intake effect in iron deficiency-a literature-based review. Nutrients. (2020) 12(7):1993. doi: 10.3390/nu12071993
Keywords: early life, nutrition, microbiome, probiotics, iron supplementation, milk, toddler
Citation: Chew C, Matsuyama M, Davies PSW, Hill RJ, Morrison M, Martin R, Codoñer FM, Knol J and Roeselers G (2024) A young child formula supplemented with a synbiotic mixture of scGOS/lcFOS and Bifidobacterium breve M-16V improves the gut microbiota and iron status in healthy toddlers. Front. Pediatr. 12:1193027. doi: 10.3389/fped.2024.1193027
Received: 24 March 2023; Accepted: 12 September 2024;
Published: 14 October 2024.
Edited by:
Michelle Plusquin, University of Hasselt, BelgiumReviewed by:
Roshonda B. Jones, Independent Researcher, Charlotte, United StatesTim S. Nawrot, University of Hasselt, Belgium
Copyright: © 2024 Chew, Matsuyama, Davies, Hill, Morrison, Martin, Codoñer, Knol and Roeselers. This is an open-access article distributed under the terms of the Creative Commons Attribution License (CC BY). The use, distribution or reproduction in other forums is permitted, provided the original author(s) and the copyright owner(s) are credited and that the original publication in this journal is cited, in accordance with accepted academic practice. No use, distribution or reproduction is permitted which does not comply with these terms.
*Correspondence: Guus Roeselers, Z3V1cy5yb2VzZWxlcnNAZGFub25lLmNvbQ==