
95% of researchers rate our articles as excellent or good
Learn more about the work of our research integrity team to safeguard the quality of each article we publish.
Find out more
ORIGINAL RESEARCH article
Front. Pediatr. , 23 May 2023
Sec. Pediatric Orthopedics
Volume 11 - 2023 | https://doi.org/10.3389/fped.2023.1103565
 Chi-Jen Hsu1,†
 Yongguang Ma1,†
 Peilun Xiao1,†
 Chia-Chien Hsu2,†
 Dawei Wang1,†
 Mei Na Fok3,†Rong Peng1,‡
 Xianghe Xu1*
 Huading Lu1*
Background: Ewing sarcoma (ES) is a common primary bone tumor in children. Our study aimed to compare overall survival (OS) between pediatric and adult bone ES patients, identify independent prognostic factors and develop a nomogram for predicting OS in adult patients with ES of bone.
Methods: We retrospectively analyzed data for the 2004–2015 period from the Surveillance, Epidemiology, and End Results (SEER) database. To guarantee well-balanced characteristics between the comparison groups, propensity score matching (PSM) was used. Kaplan–Meier (KM) curves were used to compare OS between pediatric and adult patients with ES of bone. Univariate and multivariate Cox regression analyses were used to screen independent prognostic factors for ES of bone, and a prognostic nomogram was constructed by using the factors identified. The prediction accuracy and clinical benefit were evaluated using receiver operating characteristic (ROC) curves, areas under the curves (AUCs), calibration curves, and decision curve analysis (DCA).
Results: Our results showed that adult ES patients had lower OS than younger ES patients. Age, surgery, chemotherapy, and TNM stage were independent risk factors for bone ES in adults and were used to develop a nomogram. AUCs for 3-, 5-, and 10-year OS were 76.4 (67.5, 85.3), 77.3 (68.6, 85.9) and 76.6 (68.6, 84.5), respectively. Calibration curves and DCA results indicated excellent performance for our nomogram.
Conclusion: We found that ES pediatric patients have better OS than adult ES patients, and we constructed a practical nomogram to predict the 3-, 5- and 10-year OS of adult patients with ES of bone based on independent prognostic factors (age, surgery, chemotherapy, T stage, N stage and M stage).
In the 2020 WHO classification, ES is grouped with round cell sarcomas with EWSR1-nonerythroblast transformation specific (ETS) fusions, CIC-rearranged sarcomas, and sarcomas with BCOR genetic alterations in a new chapter named “undifferentiated small round cell sarcomas of bone and soft tissue” to represent a more accurate biological landscape (1). Over the last two decades, ES treatment has advanced significantly, with many clinical trials on different treatment modalities and combinations (2). However, these treatments may be accompanied by acute and chronic side effects that may impair patient quality of life.
To date, few articles have presented a comparison of overall survival (OS) between pediatric and adult patients with ES of bone, and there is no nomogram currently available for predicting bone ES in adult patients. Thus, we utilized the Surveillance, Epidemiology, and End Results (SEER) database to identify independent risk factors for adult patients, compare OS between pediatric and adult patients with ES of bone and create a clinical nomogram to predict the OS of adult patients with ES of bone. A nomogram is a mathematical formula or algorithm that can predict a particular end point (3). Under the American legal system, the legal age of majority is 18, and children under the age of 18 cannot make healthcare decisions without their parents' permission (4). Therefore, we constructed a nomogram that predicts OS prognosis of adults with ES of bone and offers both clinicians and patients different perspectives on treatment.
Data for patients diagnosed with ES between 2004 and 2015 were obtained from the SEER 17 registry online database using SEER*Stat 8.4.0.1 software. The site code for histological types was limited to ICD-O-3:9260/3: ES, and the tumor site was set as C40.0-C41.9. The inclusion criteria were as follows: (1) diagnosed between 2004 and 2015 and (2) confirmation by positive histology. The exclusion criteria were as follows: (1) incomplete information and (2) ES not the primary tumor. Only 756 patients met these criteria. To compare the OS of pediatric and adult patients, we divided the patients into two groups (<18 and ≥18 years old).
The variables obtained from the SEER database included age, sex, race, surgery, radiation, chemotherapy, T stage, N stage, M stage and primary site. We calculated the cutoff value for age using X-tile 3.6.1, which can subclassify tumors based on biomarker expression and has a wide variety of clinical applications (5). TNM stage was defined following the 6th TNM staging system. The other clinicopathological features of the patients were labeled as follows: sex (female, male), race (white, black, others), surgery (yes, no), radiation (yes, no/unknown), chemotherapy (yes, no/unknown), and primary site (axial, extremity).
We used univariate and multivariate Cox regression analyses to identify independent prognostic factors and Kaplan–Meier (KM) curves to identify whether the OS of pediatric and adult bone ES patients differed significantly. To reduce the effects of biases and confounding variables, we used the chi-square test and Fisher's test to determine variables that were imbalanced among the baseline characteristics (P < 0.05). Propensity score matching (PSM) is a method used to achieve balanced variables between two groups and decrease selection bias in nonrandomized research (6), and we performed PSM analysis to balance the variables. For PSM, the caliper was set to 0.02, and nearest neighbor matching (in a 1:1 ratio) was performed to create matching pairs between the pediatric and adult groups. After PSM, we constructed a KM curve to evaluate differences in the OS of the pediatric and adult patients with ES of bone.
We performed univariate Cox and multivariate Cox regression analyses to identify independent risk factors. The hazard ratios (HRs) and 95% confidence intervals (95% CIs) of the variables were calculated (7). We constructed our nomogram based on the identified independent prognostic factors by R with the rms package (8). Using these independent risk factors, we created a nomogram for predicting OS at 3, 5, and 10 years. We evaluated our nomogram's prediction ability using receiver operating characteristic (ROC) curves and areas under the curve (AUC). Then, using a bootstrapping procedure with 1,000 resamples, calibration curves were built to assess the degree of agreement between the actual and predicted probabilities based on our nomogram (9). We performed decision curve analysis (DCA) to compare our nomogram with the TNM nomogram in terms of clinical usefulness and net benefits (10).
All statistical analyses were carried out using SPSS version 26.0 (IBM, Chicago, IL, USA), R software (version 4.2.1; http://www.Rproject.org) for Windows, and X-tile 3.6.1. In all our statistical tests, a P value <0.05 was statistically significant.
Figure 1 illustrates the data selection process used in our investigation; a total of 756 patients were selected for the study. We used X-tile software to investigate the association between patient age and risk of mortality. The X-tile results showed that the optimal cutoff values of age in terms of OS were 18 and 28 years, and survival curves were plotted using the KM method for those age subgroups to assess OS (Figures 2A,B). To study the effect of differences in survival between pediatric and adult ES patients, we divided the patients into two distinct groups: a pediatric group (age <18, n = 438) and an adult group (age ≥18, n = 318).
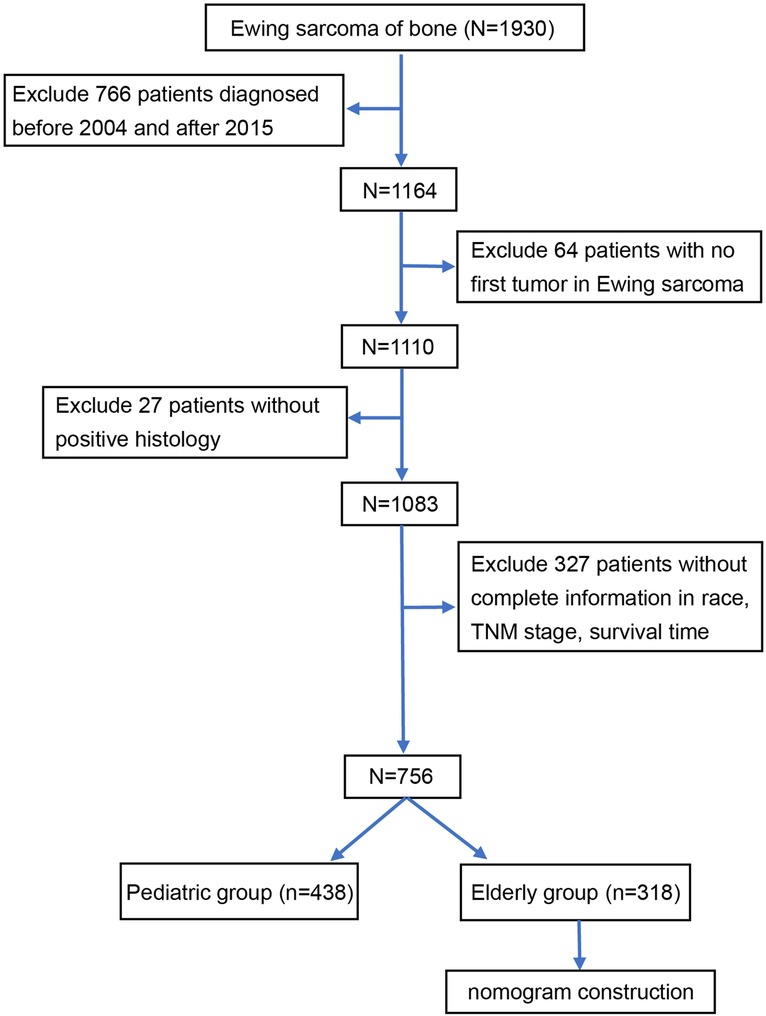
Figure 1. Flow diagram of the selection process for the patient cohort from the SEER database. Finally, 756 patients were included in our study and divided into an adult group (n = 428) and a pediatric group (n = 318). SEER Surveillance, Epidemiology, and End Results.
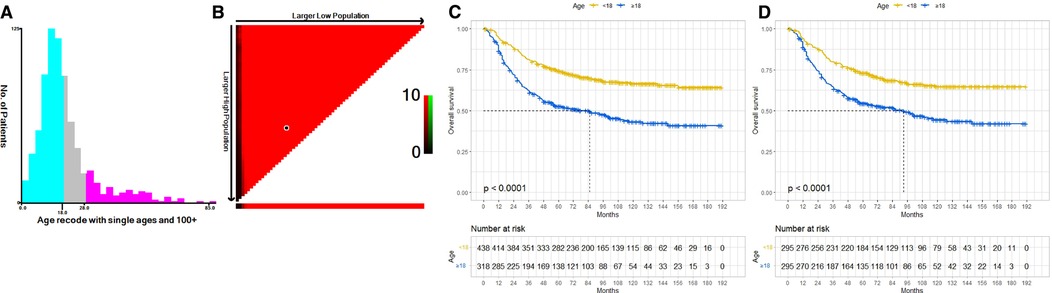
Figure 2. The optimal cutoff value of age was identified by X-tile analysis (A,B). The optimal age cutoffs were 18 and 28 years. KM curves of OS for our data before PSM (C) and after PSM (D). Both before and after PSM, the OS of the pediatric group was better than that of the adult group. OS, overall survival; KM, Kaplan–Meier; PSM, Propensity Score Matching.
Based on the results of chi-square tests and Fisher tests, obvious differences in race, sex, surgery, and chemotherapy were found between the two groups. This indicated that the baseline characteristics of the two groups were not well balanced. After matching, 295 pediatric patients and 295 adult patients were enrolled in the final analysis, and the baseline characteristics were balanced in the final model (Table 1).
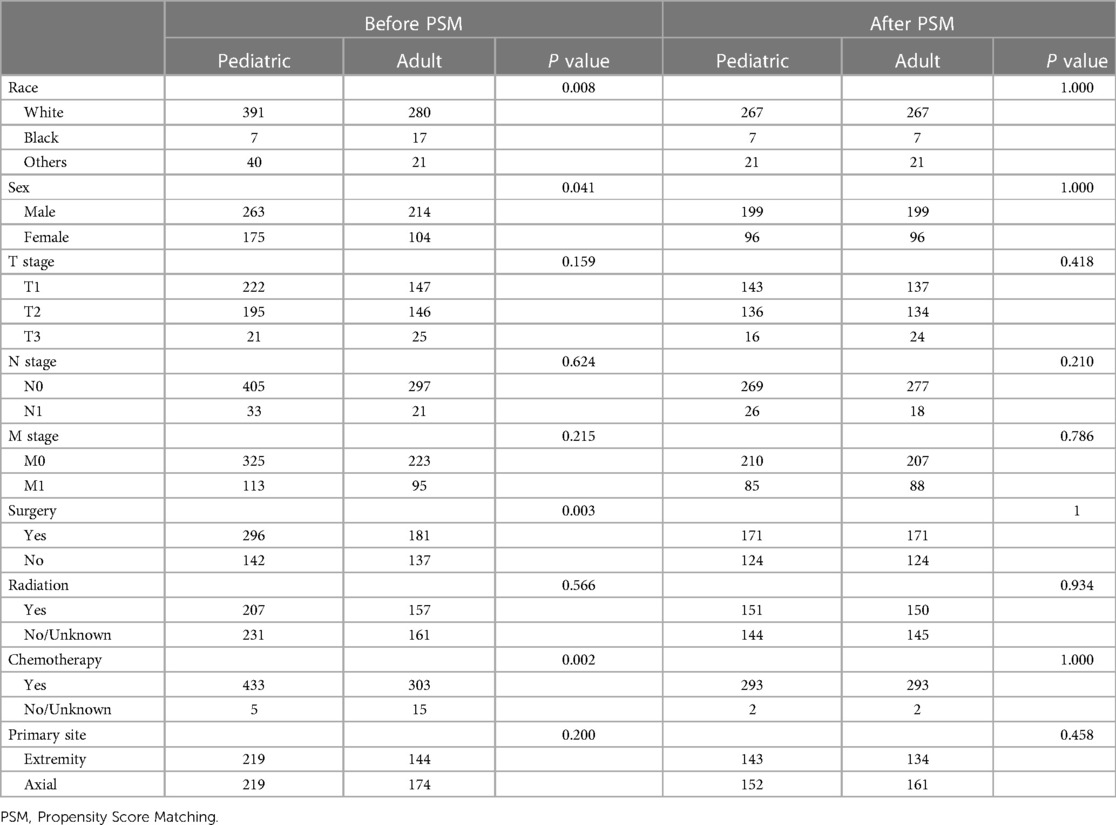
Table 1. Comparison of baseline variables between the pediatric and adult groups before and after PSM.
Before PSM, univariate Cox regression analyses showed that adult patients had worse OS (HR: 2.11; 95% CI: 1.68–2.65; P < 0.001), and multivariate Cox regression analyses indicated age to be an independent prognostic factor (HR, 1.97; 95% CI: 1.56–2.48; P < 0.001) (Table 2A). After PSM, adult patients also had poorer OS than pediatric patients (HR: 1.91; 95% CI: 1.47–2.47; P < 0.001), and age remained an independent prognostic factor (HR: 1.99; 95% CI: 1.53–2.58; P < 0.001) (Table 2B). We constructed KM curves to compare the OS of pediatric and adult ES patients. Both before and after PSM, the OS of the adult group was worse than that of the pediatric group [Figures 2C,D].

Table 2A. Univariate and multivariate Cox analyses of factors related to OS before PSM.
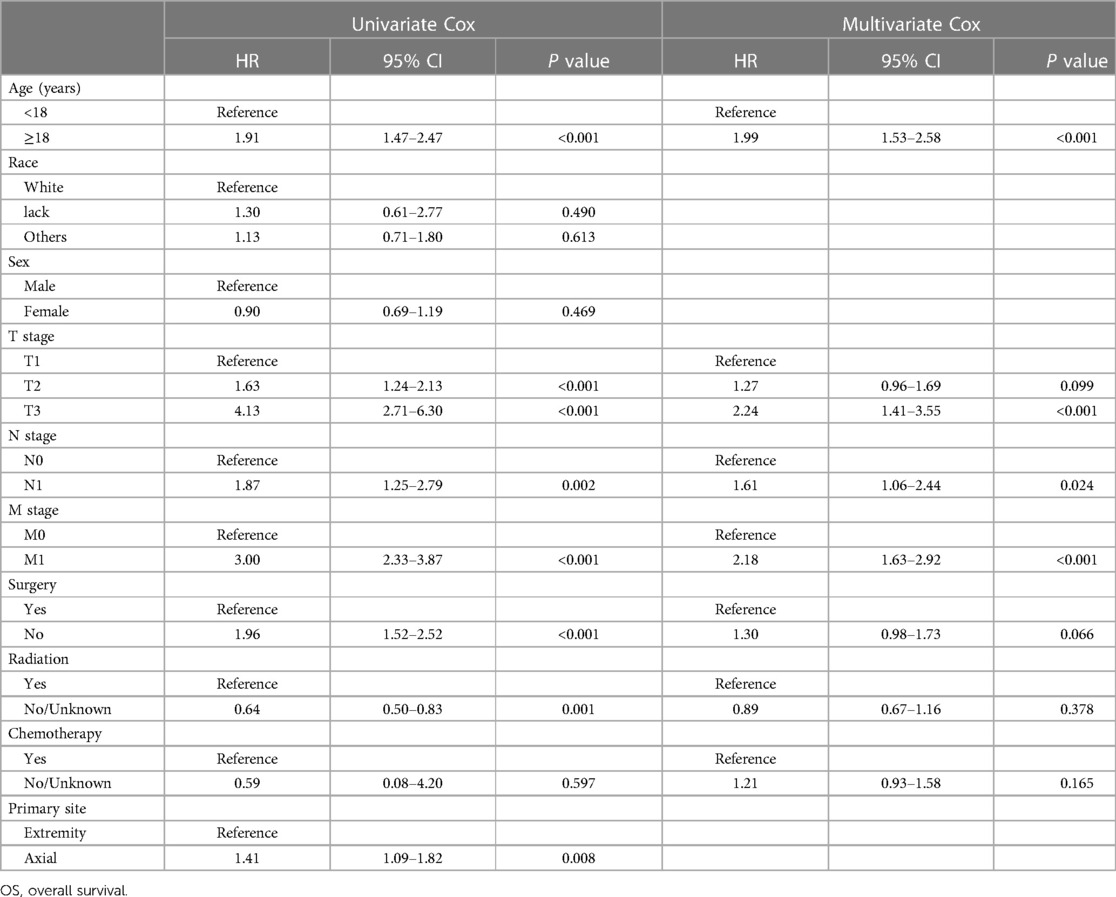
Table 2B. Univariate and multivariate Cox analyses of factors related to OS after PSM.
Because the survival rate of adult patients was found to be poorer than that of pediatric patients, we sought to build a nomogram for these adult patients. Univariate and multivariate Cox regression analyses identified that age, T stage, N stage, M stage, surgery, and chemotherapy were independent prognostic factors in adult patients with ES of bone (Table 3). We created our nomogram based on these factors to predict 3-, 5-, and 10-year OS (Figure 3). Calculating the projected chance of survival at each time point was straightforward, as the entire score was added and plotted on the total point scale (11).
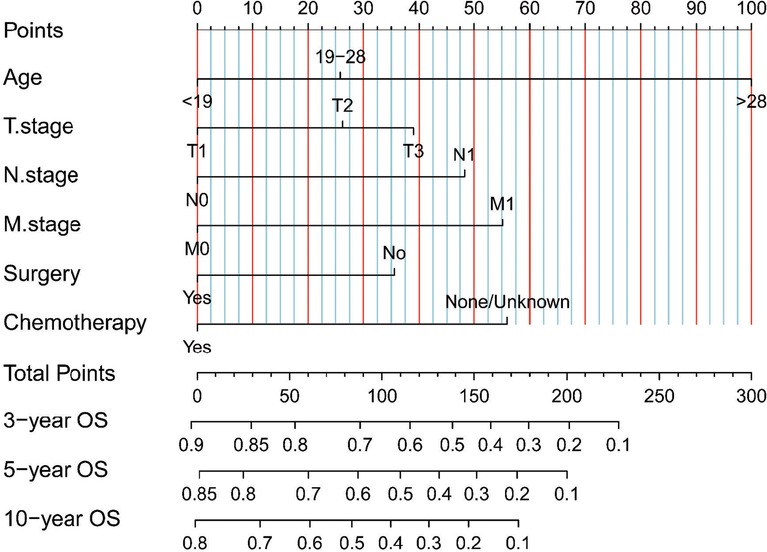
Figure 3. Our nomograms for predicting the 3-, 5-, and 10-year OS of adult patients with ES of bone. It consists of 6 variables (age, T stage, N stage, M stage, surgery, and chemotherapy).
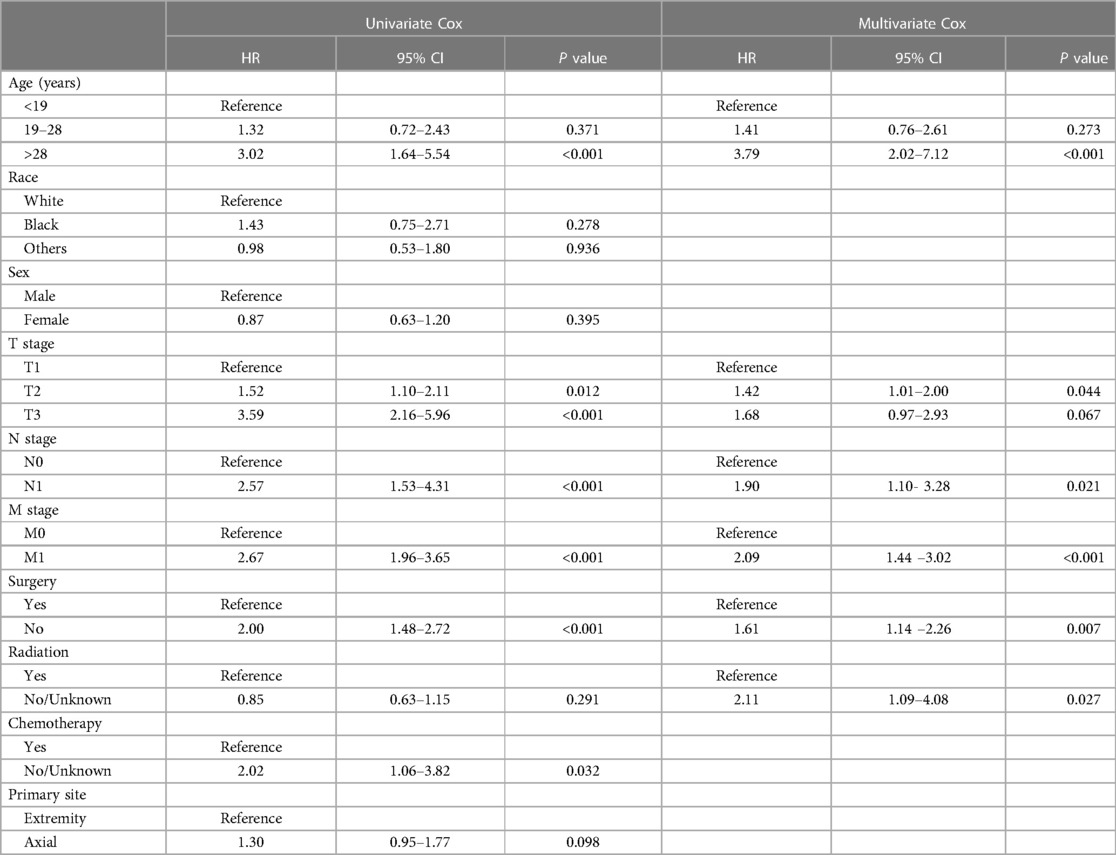
Table 3. Identification of independent prognostic factors in adult patients based on univariate and multivariate Cox analyses.
We constructed calibration curves for 3-year, 5-year, and 10-year OS, which showed good consistency between the predicted and observed probabilities of OS (Figures 4A–C). Indeed, our nomogram was able to produce precise predictions in a variety of situations, with high AUC values [3-year ROC of OS, AUC = 76.4 (67.5, 85.3); 5-year, AUC = 77.3 (68.6, 85.9); 10-year, AUC = 76.6 (68.6, 84.5)] [Figure 4(D)], and performed better than the TNM nomogram [3-year ROC of OS, AUC = 70.7 (62.1, 79.4); 5-year ROC of OS, AUC = 69.2 (60.6, 77.9); 10-year OS, AUC = 70.1 (61.6, 78.7)] [Figure 4(E)]. DCA results for our nomogram were compared with those of the TNM nomogram, and our nomogram showed a more considerable net benefit regarding 3-, 5- and 10-year OS (Figures 4F–H), indicating that our model was more accurate at predicting the OS of adult patients with ES of bone.
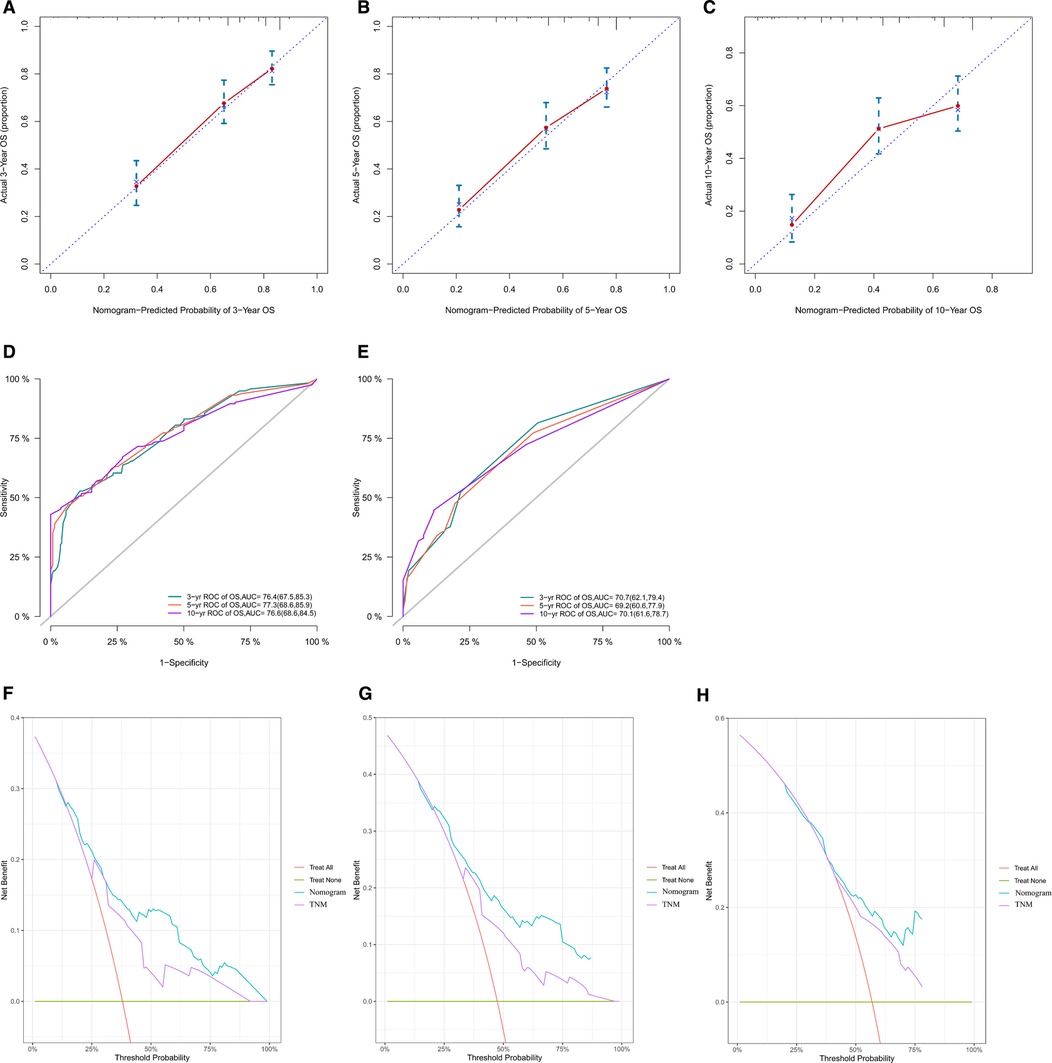
Figure 4. Calibration curves of our nomogram in all cohorts for 3-year (A), 5-year (B), and 10-year (C) OS. This shows that the OS predicted by our nomogram is highly consistent with the actual survival rate and has a high level of calibration. ROC curves of our nomogram (D) and the TNM nomogram (E) for 3-year, 5-year and 10-year OS. The AUC values of our nomogram for predicting 3-, 5- and 10-year OS were 76.4, 77.3, and 76.6, respectively; the AUC values of the TNM nomogram for predicting 3-, 5- and 10-year OS were 70.7, 69.2, and 70.1, respectively. According to the results of ROC curves and AUC values, it can be concluded that our nomogram has better predictive ability than the TNM nomogram. Comparison of our nomogram with the TNM nomogram by DCA for OS at 3 years (F), 5 years (G) and 10 years (H). Comparison of DCA curves of the two nomograms shows that our nomogram has greater clinical benefits. OS, overall survival; ROC, receiver operating characteristic; AUC, areas under the curve; DCA, decision curve analysis.
ES is the second most frequent bone tumor in children and teens (12, 13). Many articles have discussed independent factors of ES, but few articles have presented comparisons of OS between pediatric and adult patients with ES of bone and constructed nomograms for adults. Based on our study, age, TNM stage, surgery, and chemotherapy are independent prognostic factors in adult patients with ES of bone.
Age is a significant predictor of survival in patients with ES. In previous studies, younger patients had more favorable survival, and older age was linked to poorer clinical outcomes (14, 15). However, the exact mechanism remains unknown. It is possible that some explanations have not been considered, such as seeking care, slow expression, the quality of care and less aggressive treatment; additionally, some explanations of why older patients have worse OS than young people may have been overlooked (16). It has also been thought that older patients with ES may have multiple comorbidities, including diabetes, hypertension, and secondary cancers, which may lead to worse prognosis (17, 18). In many cases, children may have access to high medical care relative to adult patients, regardless of their socioeconomic status (16). Abha A Gupta et al. considered that factors not assessed in most similar studies (e.g., the duration of topical treatments) may be prognostic (19). In our study, age was an independent prognostic factor for adult ES of bone.
Use of radiation therapy in patients with ES has been a point of debate. Many studies, such as ours, have shown no significant relationship between radiotherapy use and prognosis in ES patients (20–24). ES is considered radiation sensitive, whereas radiation therapy is controversial, and the proportion of patients receiving radiation alone has been steadily decreasing. This may be attributable to advances in orthopedic surgery and chemotherapy, as well as late effects of radiotherapy in children, such as secondary malignancies and growth disorders (25). Our study found that patients who underwent surgery had a better prognosis than those who did not, and many studies have reported the same findings (16, 22, 23). With the advances in diagnosis and treatment technology, more precise individualized treatment strategies can effectively improve the prognosis of patients with ES (26). A recent systematic review by J. Werier et al. found that, regarding the optimal local treatment strategy for localized ES, surgery alone (if negative margins can be achieved) is a reasonable treatment option and should be decided on the basis of patient clinical characteristics, side effects, and patient preference for optimal local treatment (27).
In our study, chemotherapy was an independent prognostic factor, which was the same as in previous research (22). However, chemotherapy strategies are not necessarily the same in each study, and chemotherapy drugs, doses, and combinations vary from country to country. Accordingly, heterogeneity in the treatment of patients exists in different studies. Although all patients received neoadjuvant therapy, followed by local treatment of the primary tumor and adjuvant chemotherapy, the existence of heterogeneity between treatments will increase risk of bias, thus affecting the quality of research results (27). Based on the previous studies above, further large-scale prospective clinical trials are needed to explore the prognosis related to various treatment strategies.
T stage is one of the prognostic factors in our nomogram, and some previous studies have shown that a larger tumor volume is related to poor prognosis (28–30). M stage is also a prognostic factor, representing whether metastasis will affect the patient's OS. This result is the same as in previous work (17, 22, 31). Nevertheless, the prognosis of patients with metastatic or recurrent ES remains poor, and 20%–25% of patients develop metastases. The presence of metastatic disease is the most important adverse prognostic factor in ES, with a survival rate after metastasis of 30%. The most common sites of metastatic disease are the bone, bone marrow, and lung, but other sites are extremely rare (32–35). Among patients with metastases, those with lung metastases tend to have better survival than those with bone or combined lung and bone metastases (30).
Our nomogram including independent prognostic factors (age, TNM stage, surgery, and chemotherapy) may be effective in predicting prognosis. However, the present personalized nomogram of ES is not highly efficient. Our research seeks to create a realistic survival prediction model for customized prediction regarding the OS of adult patients with ES of bone. Our model is predictive, with high AUC values. Calibration curves revealed good correlation between predicted survival and actual survival, ensuring our nomogram's repeatability and reliability. Additionally, we were able to more precisely analyze and predict OS when using our nomogram. Wang J built a model for predicting ES mortality using least absolute shrinkage and selection operator (LASSO) analysis and multivariate logistic analysis with five factors (age, tumor size, primary site, tumor extension, and other site metastasis). However, that nomogram does not include treatment approach (28). Chen L created a nomogram to predict the OS of pelvic ES with four factors (age, race, tumor stage, and surgery) (9).
Our study developed the first nomograms capable of predicting OS in adult patients with ES of bone. Using the scoring system, both clinicians and patients may understand individual survival expectations. For example, a 55-year-old patient was diagnosed with ES of bone at stage T1, stage N0, and stage M0 and was treated with surgery and chemotherapy. This patient received 140 points according to our nomogram. Therefore, the estimated 3-, 5- and 10-year OS probabilities would be approximately 60%–70%, 50%–60%, and 40%–50%, respectively. This prognostic model may serve as a tool for clinical research and decision-making, including patient classification and treatment recommendations. In general, with the advancement of complete therapies for ES, new therapeutic techniques are needed to enhance survival in patients.
There are some limitations in our study. First, the SEER database contains retrospective cohort data, which may have included selection bias and unavoidably involved missing data. Second, as the primary endpoints, we only focused on the three-, five-, and ten-year OS rates, and we only included data from 2004 to 2015 in our analysis. Additionally, SEER data do not include some details, such as adjuvant or neoadjuvant treatment, proportion of subtypes, local recurrence, detailed radiotherapy regimen, surgical margin status, and postoperative complications. Finally, the prognostic nomogram requires external data for verification and support. However, due to our study's lack of external data, only internal verification can be done. A multicenter analysis of a large population should be used to verify the prognostic nomogram in our study. Although it has certain limitations, the nomogram was built using a large population, ultimately yielding a therapeutically effective tool for predicting the OS of adult patients with ES of bone.
In conclusion, we identified patients with ES of bone with poor OS and constructed a nomogram for these patients. The nomogram showed relatively good performance and may be considered a practical tool to predict the individual prognosis of adult patients with ES of bone.
The original contributions presented in the study are included in the article/Supplementary Materials, further inquiries can be directed to the corresponding author/s.
The data for our study were entirely from SEER, which is an online public database, and the identified nonhuman studies. We obtained permission to use SEER data by signing the agreement. Thus, our study did not require ethics committee approval.
Conceptualization: C-JH, YM, and PX. Methodology: C-JH, C-CH, and MNF. Collation of data: C-CH and DW. Data analysis and interpretation: C-CH and DW. Manuscript writing: C-JH, PX, YM, and MNF. Funding acquisition: HL and XX. All authors contributed to the article and approved the submitted version.
This study was supported by grants from the National Natural Science Foundation of China (NO. 81772384 and 81902242), Project funded by China Postdoctoral Science Foundation (NO. 2019M663268), GuangDong Basic and Applied Basic Research Foundation (NO. 2021A1515010531 and 2021A1515010621), Medical Scientific Research Foundation of Guangdong Province, China (20191114155423807) and Medical Science and Technology planning Project of Zhuhai, China (NO. ZH2201200003HJL and ZH22036201210053PWC). The funders had no role in the study design, data collection and analysis, decision to publish, or preparation of the manuscript.
The authors are grateful to all the investigators for their contributions to this study.
The authors declare that the research was conducted in the absence of any commercial or financial relationships that could be construed as a potential conflict of interest.
All claims expressed in this article are solely those of the authors and do not necessarily represent those of their affiliated organizations, or those of the publisher, the editors and the reviewers. Any product that may be evaluated in this article, or claim that may be made by its manufacturer, is not guaranteed or endorsed by the publisher.
The Supplementary Material for this article can be found online at: https://www.frontiersin.org/articles/10.3389/fped.2023.1103565/full#supplementary-material.
1. Kallen ME, Hornick JL. The 2020 WHO classification: what’s new in soft tissue tumor pathology? Am J Surg Pathol. (2021) 45(1):e1–23. doi: 10.1097/PAS.0000000000001552
2. Pappo AS, Dirksen U. Rhabdomyosarcoma, Ewing sarcoma, and other round cell sarcomas. J Clin Oncol. (2018) 36(2):168–79. doi: 10.1200/JCO.2017.74.7402
3. Shariat SF, et al. Comparison of nomograms with other methods for predicting outcomes in prostate cancer: a critical analysis of the literature. Clin Cancer Res. (2008) 14(14):4400–07. doi: 10.1158/1078-0432.CCR-07-4713
4. Parsapoor A, et al. Autonomy of children and adolescents in consent to treatment: ethical, jurisprudential and legal considerations. Iran J Pediatr. (2014) 24(3):241–8. PMID: 25562015, PMCID: PMC4276576.25562015
5. Camp RL, Dolled-Filhart M, Rimm DL. X-Tile: a new bio-informatics tool for biomarker assessment and outcome-based cut-point optimization. Clin Cancer Res. (2004) 10(21):7252–9. doi: 10.1158/1078-0432.CCR-04-0713
6. Benedetto U, et al. Statistical primer: propensity score matching and its alternatives. Eur J Cardiothorac Surg. (2018) 53(6):1112–7. doi: 10.1093/ejcts/ezy167
7. Hu C-Y, et al. Nomograms for predicting long-term overall survival and cancer-specific survival in lip squamous cell carcinoma: a population-based study. Cancer Med. (2019) 8(8):4032–42. doi: 10.1002/cam4.2260
8. Harrel FJ. rms: regression modeling strategies. R package version 5.0-0. (2017). Available at: http://CRAN.R-project.org/package=rms
9. Chen L, et al. Characteristics and prognosis of pelvic Ewing sarcoma: a SEER population-based study. PeerJ. (2019) 7:e7710. doi: 10.7717/peerj.7710
10. Vickers AJ, Elkin EB. Decision curve analysis: a novel method for evaluating prediction models. Med Decis Making. (2006) 26(6):565–74. doi: 10.1177/0272989X06295361
11. Liang W, et al. Development and validation of a nomogram for predicting survival in patients with resected non–small-cell lung cancer. J Clin Oncol. (2015) 33(8):861–9. doi: 10.1200/JCO.2014.56.6661
12. Sundaresan N, Rosen G, Boriani S. Primary malignant tumors of the spine. Orthop Clin North Am. (2009) 40(1):21–36. doi: 10.1016/j.ocl.2008.10.004
13. Arndt CA, Crist WM. Common musculoskeletal tumors of childhood and adolescence. N Engl J Med. (1999) 341(5):342–52. doi: 10.1056/NEJM199907293410507
14. Davenport JR, et al. Conditional survival and predictors of late death in patients with Ewing sarcoma. Pediatr Blood Cancer. (2016) 63(6):1091–5. doi: 10.1002/pbc.25945
15. Friedman DN, et al. Morbidity and mortality after treatment of Ewing sarcoma: a single-institution experience. Pediatr Blood Cancer. (2017) 64(11):e26562. doi: 10.1002/pbc.26562
16. Lee J, et al. Analysis of prognostic factors in Ewing sarcoma using a population-based cancer registry. Cancer. (2010) 116(8):1964–73. doi: 10.1002/cncr.24937
17. Zhan H, et al. A SEER-based nomogram accurately predicts prognosis in Ewing's sarcoma. Sci Rep. (2021) 11(1):22723. doi: 10.1038/s41598-021-02134-0
18. Wolden SL, Alektiar KM. Sarcomas across the age spectrum. Semin Radiat Oncol. (2010) 20(1):45–51. doi: 10.1016/j.semradonc.2009.09.003
19. Gupta AA, et al. Clinical outcome of children and adults with localized Ewing sarcoma: impact of chemotherapy dose and timing of local therapy. Cancer. (2010) 116(13):3189–94. doi: 10.1002/cncr.25144
20. Miller BJ, Gao Y, Duchman KR. Does surgery or radiation provide the best overall survival in Ewing's sarcoma? A review of the national cancer data base. J Surg Oncol. (2017) 116(3):384–90. doi: 10.1002/jso.24652
21. Zhou Q, Wu ZY, Lin ZQ. A nomogram to predict prognosis in Ewing sarcoma of bone. J Bone Oncol. (2019) 15:100223. doi: 10.1016/j.jbo.2019.100223
22. Zheng Y, et al. A novel nomogram and risk classification system predicting the Ewing sarcoma: a population-based study. Sci Rep. (2022) 12(1):8154. doi: 10.1038/s41598-022-11827-z
23. Verma V, et al. A comparison of pediatric vs. adult patients with the Ewing sarcoma family of tumors. Front Oncol. (2017) 7:82. doi: 10.3389/fonc.2017.00082
24. Bosma SE, et al. Prognostic factors for survival in Ewing sarcoma: a systematic review. Surg Oncol. (2018) 27(4):603–10. doi: 10.1016/j.suronc.2018.07.016
25. Balamuth NJ, Womer RB. Ewing's sarcoma. Lancet Oncol. (2010) 11(2):184–92. doi: 10.1016/S1470-2045(09)70286-4
26. Ren EH, et al. An immune-related gene signature for determining Ewing sarcoma prognosis based on machine learning. J Cancer Res Clin Oncol. (2021) 147(1):153–65. doi: 10.1007/s00432-020-03396-3
27. Werier J, et al. A systematic review of optimal treatment strategies for localized Ewing's sarcoma of bone after neo-adjuvant chemotherapy. Surg Oncol. (2016) 25(1):16–23. doi: 10.1016/j.suronc.2015.11.002
28. Wang J, Fan Y, Xia L. Lung metastasis probability in Ewing sarcoma: a nomogram based on the SEER database. Curr Oncol. (2020) 28(1):69–77. doi: 10.3390/curroncol28010009
29. Wan Z-H, Huang Z-H, Chen L-B. Survival outcome among patients with Ewing’s sarcoma of bones and joints: a population-based cohort study. Sao Paulo Med J. (2017) 136:116–22. doi: 10.1590/1516-3180.2017.0236230917
30. Cotterill SJ, et al. Prognostic factors in Ewing's tumor of bone: analysis of 975 patients from the European intergroup cooperative Ewing's sarcoma study group. J Clin Oncol. (2000) 18(17):3108–14. doi: 10.1200/JCO.2000.18.17.3108
31. Dai KN, Li AB. An efficient nomogram to predict overall survival of patients with pediatric Ewing's sarcoma: a population-based study. Int J Gen Med. (2021) 14:6101–9. doi: 10.2147/IJGM.S324163
32. Guduguntla BA, Shi J, Kwon RS. Ewing sarcoma: rare metastasis to the pancreas. ACG Case Rep J. (2022) 9(12):e00930. doi: 10.14309/crj.0000000000000930
33. Suvarna K, et al. Slit2 signaling stimulates Ewing sarcoma growth. Genes Cancer. (2022) 13:88–99. doi: 10.18632/genesandcancer.227
34. Biermann JS, et al. NCCN guidelines insights: bone cancer, version 2.2017. J Natl Compr Canc Netw. (2017) 15(2):155–67. doi: 10.6004/jnccn.2017.0017
Keywords: Ewing sarcoma, nomogram, SEER, PSM, overall survival.
Citation: Hsu C-J, Ma Y, Xiao P, Hsu C-C, Wang D, Fok MN, Peng R, Xu X and Lu H (2023) Overall survival comparison between pediatric and adult Ewing sarcoma of bone and adult nomogram construction: a large population-based analysis. Front. Pediatr. 11:1103565. doi: 10.3389/fped.2023.1103565
Received: 20 November 2022; Accepted: 20 April 2023;
Published: 23 May 2023.
Edited by:
Jason Pui Yin Cheung, The University of Hong Kong, Hong Kong, SAR ChinaReviewed by:
Ying Tian, Affiliated Hospital of Shandong University of Traditional Chinese Medicine, China© 2023 Hsu, Ma, Xiao, Hsu, Wang, Fok, Peng, Xu and Lu. This is an open-access article distributed under the terms of the Creative Commons Attribution License (CC BY). The use, distribution or reproduction in other forums is permitted, provided the original author(s) and the copyright owner(s) are credited and that the original publication in this journal is cited, in accordance with accepted academic practice. No use, distribution or reproduction is permitted which does not comply with these terms.
*Correspondence: Huading Lu am9obm5pZWh1YWRpbmdAMTYzLmNvbQ== Xianghe Xu eHV4aDI4QG1haWwuc3lzdS5lZHUuY24=
†These authors have contributed equally to this work and share first authorship
‡These authors have contributed equally to this work and share senior authorship
Disclaimer: All claims expressed in this article are solely those of the authors and do not necessarily represent those of their affiliated organizations, or those of the publisher, the editors and the reviewers. Any product that may be evaluated in this article or claim that may be made by its manufacturer is not guaranteed or endorsed by the publisher.
Research integrity at Frontiers
Learn more about the work of our research integrity team to safeguard the quality of each article we publish.