 Dehai Zhu
 Hui Wang
 Ruoshi Li
 Jing Wen
 Ruiying Li1,2
95% of researchers rate our articles as excellent or good
Learn more about the work of our research integrity team to safeguard the quality of each article we publish.
Find out more
ORIGINAL RESEARCH article
Front. Pediatr. , 06 February 2023
Sec. Children and Health
Volume 11 - 2023 | https://doi.org/10.3389/fped.2023.1092153
This article is part of the Research Topic Refractive Errors: Public Health Challenges and Interventions View all 29 articles
Background: The current study was to evaluate the choroidal thickness (CT) and vascular microstructure parameters in Chinese children with high hyperopia through enhanced depth imaging optical coherence tomography (EDI-OCT).
Methods: Cross-sectional study. A total of 23 children with high hyperopia and 29 children with normal refractive status were retrospectively enrolled in the study. The measurement of the macular CT, 7 points: the sub-foveal area point, the temporal and nasal points at a radius of 0.5-mm, 1.5-mm, and 3-mm were measured. After binarization of the OCT images, the total choroidal area (TCA), stromal area (SA) as well as the luminal area (LA) were identified and measured. The choroidal vascularity index (CVI) was defined as the ratio of LA to TCA. The independent t-test for normal distributions and Kruskal-Wallis tests for non-normal distributions were used to compare other parameters between groups. The Tamhane's T2 test was performed to adjust for multiple comparisons between groups within each analysis.
Results: The subfoveal CT (SFCT) in the high hypermetropic group was significantly thicker than that in normal controls (309.22 ± 53.14 μm vs. 291.27 ± 38.27 μm; P = 0.019). At 0.5 mm, 1.5 mm, and 3.0 mm in diameter, the nasal choroidal sectors of the high hyperopia eyes were significantly thicker than that of the control (P < 0.05). There was significant difference in the choroidal vascular parameters. TCA and LA in the high hyperopia eyes was significantly larger than that of the normal control eyes (3078129.54 ± 448271.18 μm2 vs. 2765218.17 ± 317827.19 μm2, 1926819.54 ± 229817.56 μm2 vs. 1748817.18 ± 191827.98 μm2; P = 0.009, P = 0.011; Table 2). SA values were 1086287.55 ± 212712.11 um2 in the high hyperopia eyes and 999712.71 ± 209838.12 μm2 in the control eyes. The CVI and LA/SA ratio values were differed significantly in the two groups (P = 0.019, P = 0.030, respectively). AL was significantly correlated with SFCT (r = −0.325, P = 0.047), but not significantly correlated with other parameters. Spherical equivalent (SE) was significantly correlated with AL and SFCT (r = −0.711, r = 0.311; P = 0.001, P = 0.016), whereas no significant association between sphere and other parameters.
Conclusion: The choroidal structure of the high hyperopia eyes was different from the normal control eyes. The thicker SFCT, higher LA, and TCA were characteristic of high hyperopia eyes. Choroidal blood flow may be decreased in amblyopic eyes. SFCT of high hyperopia children abnormally increased and correlated with shorter AL and higher SE. AL and SE affect choroidal structure and vascular density.
By birth, human beings are predominantly hyperopic, and as the age progresses, hyperopic eyeballs grow to become emmetropic or even myopic (1–4). For children with refractive errors, the most common type is hyperopia worldly. If left untreated, the hyperopia, especially moderate-to-high hyperopia, may develop a series of sequelae, such as amblyopia and strabismus (5–8). Therefore, early diagnosis and severity stratification of hyperopia is vital for physicians to select appropriate management strategies, thus minimizing relevant sequelae.
The choroid comprises blood vessels, melanocytes, fibroblasts, resident immunocompetent cells, and supporting collagenous and elastic connective tissue. It plays a vital role in ocular physiology by oxygenating and nourishing avascular outer retinal layers, particularly photoreceptors and the optic nerve pre-laminar section of the optic nerve (9). It is reported that the choroid may play an essential role in the visually guided regulation of eye growth and the development of myopia and hyperopia (1–4), so several choroid-related parameters have been investigated to evaluate the severity degree of hyperopia. Choroidal thickness (CT) is widely used in the evaluation of choroid status, and its value is associated with a range of factors, including age, gender, and refractive errors (10–15). However, CT provides limited information related to the choroid's subtle structural changes.
As we know, in the pathological changes of myopia, the choroidal thinning associated with myopic axial elongation is primarily the result of reduced thickness of the stromal rather than the vascular component of the choroid (16). In contrast, hyperopia eyes have shorter axis and a thicker choroid, but it is still not clear whether the choroid thickens due to stromal or vascular component. So, we need the parameters to provide more subtle structural changes, which are not available in CT.
With the development of optical coherence tomography (OCT), the measurement of subtle choroid structures becomes possible. Recently, a new quantitative index, choroidal vascularity index (CVI), defined as the ratio of blood vessels' luminal area (LA) to the total choroidal area (TCA), has been developed to evaluate the vascular structure of the choroid (17). As CVI, which mainly measures choroidal vascularity, may play a more important role in evaluating hyperopia severity. Most of the previous studies focused on using the CVI to assess the subtle choroid structural changes related to myopia or high myopia. Still, its applications in children with high hyperopia have not been fully documented, especially in the Chinese pediatric population.
In this study, we used the enhanced depth imaging OCT (EDI-OCT) to measure CT and CVI metrics in Chinese children with high hyperopia and normal controls. We aimed to determine the value of CVI as a characteristic parameter to evaluate the severity of hyperopia.
The Institutional Review Board of our hospital approved this observational cross-sectional study, and written informed consent were obtained from all participants.
The participants were consecutively recruited in the Department of Pediatric Ophthalmology of our hospital from June 2021 to September 2021. The inclusion criteria were (1) age between 4 and 14 years, (2) best-corrected visual acuity (BCVA) ≥ 0.8, (3) intraocular pressure (IOP) < 21 mmHg, (4) normal anterior chamber angles, (5) normal optic nerve head (ONH) without glaucomatous changes, such as the neuro-retinal rim narrowing, cup-disc ratio increasing, and no retinal nerve ber layer abnormalities. The participants with the following criteria were excluded, (1) history of ocular or systemic diseases, including congenital cataract and glaucoma, hypertension, and diabetes, (2) previous intraocular or refractive surgery, (3) neurologic disease, or (4) other evidence of retinal pathology. The demographic data of all enrolled patients were collected for analysis.
All participants underwent comprehensive ophthalmic examinations to collect the following data, which were BCVA, spherical equivalent (SE), slit-lamp biomicroscopy, axial length (IOL Master; Carl Zeiss Meditec, Dublin, CA), corneal curvature and IOP. Retinoscopy measurements were performed under the cycloplegia. The visual acuity was measured with a standard logarithmic visual acuity chart, and the decimal visual acuity was converted to the logarithm of the minimal angle of resolution (logMAR) units.
The choroidal area was obtained by the EDI-OCT (Spectralis, Heidelberg Engineering, Heidelberg, Germany) by one ophthalmologist with ten years of experience in OCT exam throughout the study to measure CT and choroid vascular parameters.
The macular CT was measured from the outer portion of the hyper-refractive line corresponding to the retinal pigment epithelium (RPE) to the inner surface of the sclera. The CT measurements were obtained at seven spots in a single horizontal scan centered on the fovea, including directly beneath the sub-foveal area CT (SFCT) point, the temporal and nasal points at a radius of 0.5- mm, 1.5-mm, and 3-mm (Figure 1). The elongation of AL may result in optical amplification effect. Littmann formula was used to calculate true image size to correct the optical amplification effect of OCT measurement.
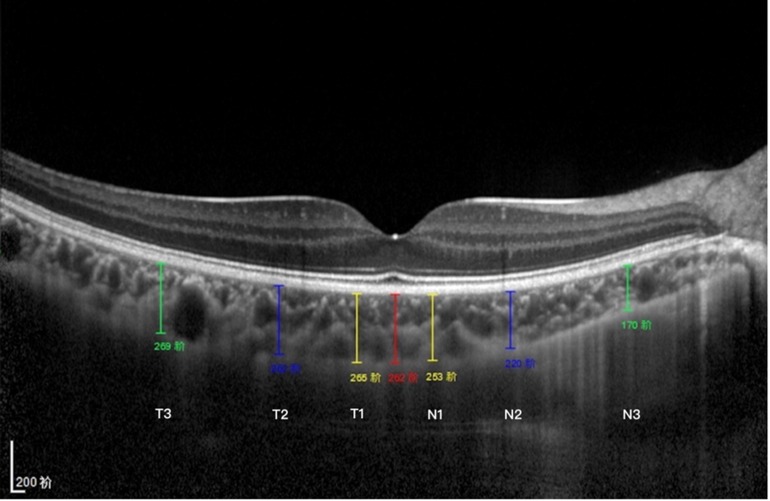
Figure 1. Subfoveal CT measurement. CT was measured at 7 points: directly beneath the fovea or the subfoveal area (SFCT) point, and 0.5/1.5/3 mm to the fovea nasally (N1/N2/N3), 0.5/1.5/3 mm to the fovea temporally (T1/T2/T3).
Choroid vascular parameters were measured using the Niblack auto local threshold tool in the Image J platform (version 1.47, National Institutes of Health, Bethesda, MD, USA; http://imagej.nih.gov/ij/). Each segmented B-scan through the fovea on OCT was binarized with dark and light pixels to signify the L.A. and S.A. of the choroid, respectively (Figure 2). The TCA was calculated by multiplying the standard width of 3000 µm (1500 µm on the nasal and temporal side of the fovea) by the center choroidal thickness. Finally, TCA, LA, and SA were measured, followed by the CVI, defined as the ratio of LA to TCA.
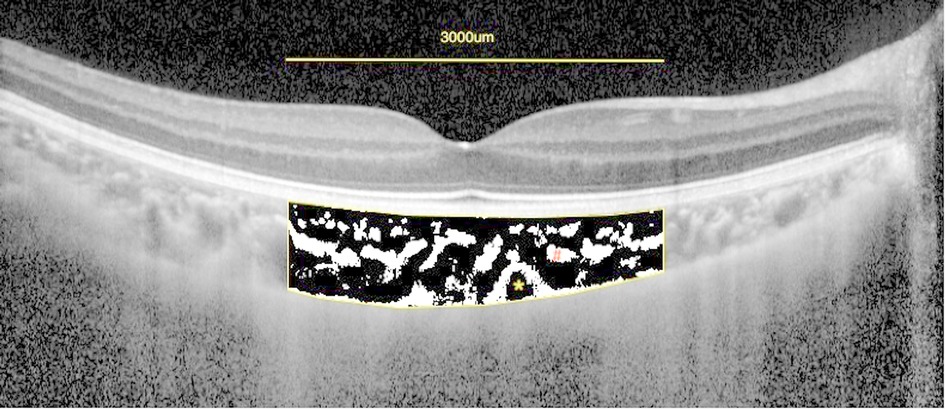
Figure 2. Enhanced depth imaging (EDI)-OCT image and converted binary image of a normal eye. An EDI-OCT image of a healthy eye (A) was converted to a binary image (B) using the ImageJ software. The luminal area (dark area, asterisk) and the interstitial area (cross) are seen. The rectangle surrounded by a red line was excised, and the dark areas were traced by the Niblack method.
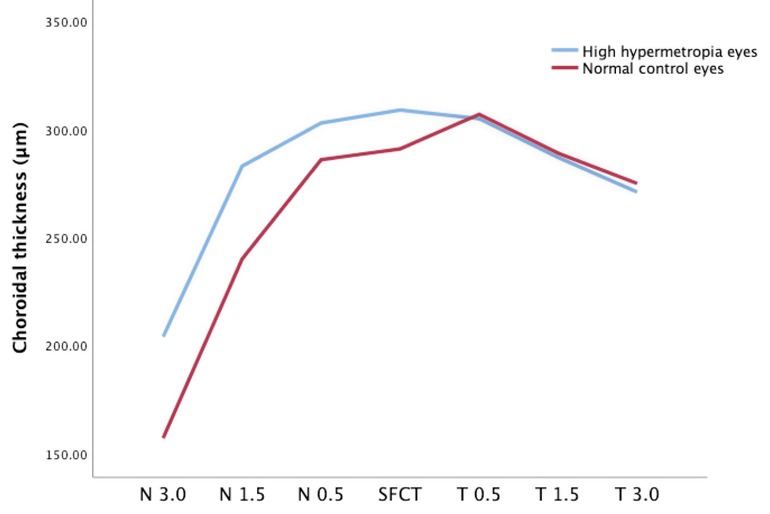
Figure 3. CT at different locations of high hyperopia and normal eyes.
The Kolmogorov-Smirnov test was used to analyze the normality of distribution. Descriptive statistics were calculated as the mean and standard deviation for normally distributed variables and median and interquartile range (IQR) for non-normally distributed variables. The independent t-test for normal distributions and Kruskal-Wallis tests for non-normal distributions were used to compare other parameters between groups. The categorical data were described as frequencies and percentages and compared between groups using Fisher's exact test as appropriate. The Tamhane's T2 test was performed to adjust for multiple comparisons between groups within each analysis. A two-sided P value less than 0.05 was considered statistically significant. Statistical analysis was performed using the SPSS software version 21 (SPSS, Inc., IL, USA).
Measures of central tendency in continuous data were described as median (or mean) and range, and categorical data were described as frequencies and percentages. The propensity score matching method was used to match the control cases with patients with complications. The continuous variables were compared using a t-test, and the ordinal variables were compared using conditional logistic regression. P < 0.05 was considered statistically significant.
In the study interval, a total of 52 children were enrolled, including 23 with high hyperopia (female/male = 13/10, age 6.13 ± 2.24 years) and 29 normal controls (female/male = 15/14, age 7.00 ± 2.00 years) (Table 1). The patients were classified according to spherical equivalent (SE), which were high hyperopia with SE of + 5.00D or more, and normal controls with S.E. of −0.50D ∼ + 1.00D. The mean BCVA was 0.06 ± 0.11 logMAR units in the high hyperopia eyes and −0.01 ± 0.06 logMAR units in the control eyes.
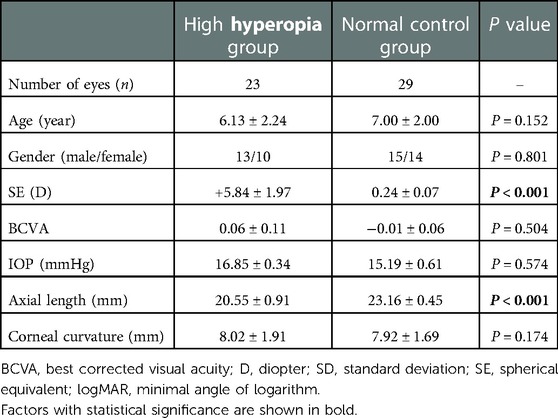
Table 1. Demographic and clinical characteristics of enrolled participants (n = 52).
The demographic and ocular characteristics were listed in the study (Table 1). Significant differences were observed on spherical equivalent (+5.84 ± 1.97D vs. 0.24 ± 0.07D, P < 0.001) and AL (20.55 ± 0.91 mm vs. 23.16 ± 0.45 mm, P < 0.001) between the two groups, while no differences were found on other parameters.
The SFCT was significantly thicker in the high hyperopia eyes than that in normal controls (309.22 ± 53.14 μm vs. 291.27 ± 38.27 μm, P = 0.017) (Table 2). At 0.5 mm, 1.5 mm, and 3.0 mm in diameter, the nasal choroidal sectors of the high hyperopia eyes were significantly thicker than that of the normal control eyes (P < 0.05). The temporal CT at 0.5 mm, 1.5 mm, and 3.0 mm were not significant different in high hyperopia eyes than that in normal control eyes (all P > 0.05) (Figure 3).
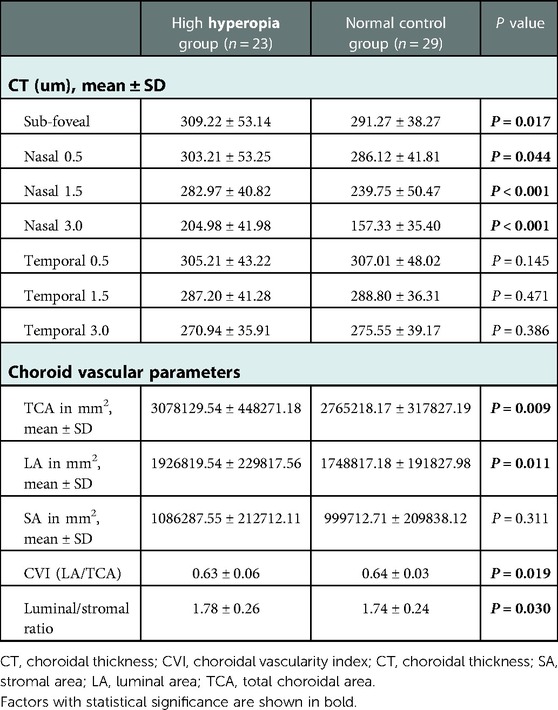
Table 2. Comparison of CT and choroidal vascular characteristics (n = 52).
There was significant difference in the choroidal vascular parameters. TCA and LA in the high hyperopia eyes was significantly larger than that of the normal control eyes (3078129.54 ± 448271.18 μm2 vs. 2765218.17 ± 317827.19 μm2, 1926819.54 ± 229817.56 μm2 vs. 1748817.18 ± 191827.98 μm2; P = 0.009, P = 0.011; Table 2). SA values were 1086287.55 ± 212712.11 μm2 in the high hyperopia eyes and 999712.71 ± 209838.12 μm2 in the control eyes. The CVI and LA/SA ratio values were differed significantly in the two groups (P = 0.019, P = 0.030, respectively).
Correlation analyses were performed between the choroidal parameters and age, AL, and SE (Table 3). Our results showed that AL was significantly correlated with SFCT and LA (r = −0.325, r = −0.417, P = 0.007), but not significantly correlated with other parameters. SE was found to be significantly correlated with AL and SFCT (r = −0.711, r = 0.311; P = 0.001, P = 0.016), whereas no significant association between sphere and other parameters.
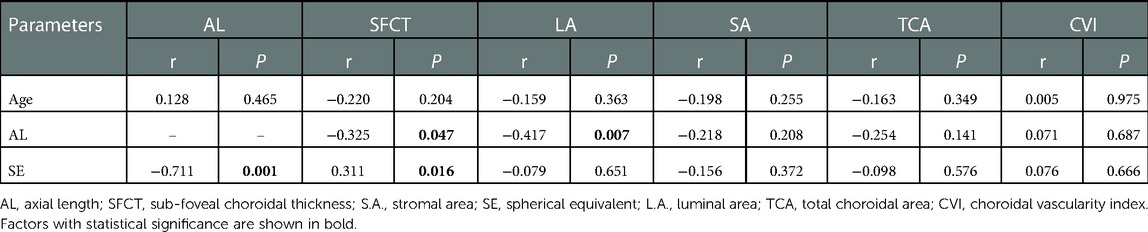
Table 3. Correlation between choroid microstructure parameters and other baseline parameters in high hyperopia patients .
This study has provided a comprehensive assessment of the topographical variations in choroidal microstructure parameters in Chinese children with high hyperopia. CT is different between the two groups and the significantly higher in the high hyperopia group. A significant difference was found in the following spots, including sub-foveal, Nasal 0.5, Nasal 1.5, and Nasal 3.0. Our analyses also showed that TCA, LA, and the LA/SA ratio of high hyperopia eyes were significantly larger, CVI was significantly smaller than that of the normal control eyes.
CT is the main parameter used to obtain information about the choroidal layer and has been examined in children and adolescents in many studies (18–21). In healthy pediatric populations, the mean sub-foveal from these studies ranged from 245 to 361 μm (18, 20, 21). Read et al. (22) reported that the mean of the sub-foveal CT was 330 ± 65 μm in Australian children (4–12 years) with spherical equivalent refractive errors (SER) (+1.25–−0.50 D). Takafumi Mori and Yukinori Sugano also found a similar result in preschool Japanese children (23). Additionally, Zha Yi et al. (24) reported that the SFCT was of 328.12 ± 65.93 μm in 4–12 years old Chinese children with SER was between −1.75D to +0.63D. Our study in normal children had very close values for age-matched normal children. The value of CT in evaluating the degree of refractive errors or amblyopia had also been depicted in some studies (19, 23–25). The results are roughly the same in different cohorts: the myopic eyes had thinner sub-foveal choroidal thickness, and the hyperopic eyes and hyperopic amblyopic eyes had thicker CT than emmetropic eyes and myopic eyes. However, few studies focused on the structural characteristic of the choroid in high hyperopia subjects. In the current study, both the subfoveal CT and topographical variation in high hyperopic children were described. Consistent with the existing conclusions, we found that the SFCT in high hyperopia children was significantly thicker than that in the normal control group. The average CT in the hyperopia group in our study was similar to the results of previous studies, but they seemed to be lower than those in the hyperopic amblyopia children with lower SER, which might verify the previous speculation that hyperopia was associated with subfoveal ChT, whereas amblyopia had no significant independent effect on subfoveal ChT in our study population (24). The pathophysiologic mechanisms involved need further verification. Additionally, the topographic features of the choroid in the hyperopia group in this study were almost the same as those in controls: the choroid was the thickest in the sub-foveal region and the thinnest in nasal regions which approach the optic nerve. These findings were also consistent with previous results of children either with different refractive status or with amblyopia, indicating the relatively stable choroid contour in pediatric populations (19, 24).
In normal eyes, CT in children can be affected by various factors, such as age, gender, diopter, and axial length. Previous studies reported a significant association between the AL and CT (26–28). Nagasawa et al. and Bidaut-Garnier reported that CT was negatively correlated with AL (29, 30). Li et al. reported that a thinner subfoveal CT correlated with a longer AL but no other factors, such as age, sex, and SER in myopic children (31). Read et al. found that CT increased in children with normal axial elongation, whereas children undergoing faster AL elongation tended to exhibit less thickening and a thinning of the choroid in some cases (32). In the current study, a thinner SFCT was also found to be negatively correlated with longer A.L. However, the causal relationship between choroidal thickening and hyperopia remains controversial.
OCT system uses fixed eye AL to scan. With the elongation of AL, the scanning area increases, resulting in optical amplification effect. Even if the Littmann formula is used to correct the optical amplification effect, there will be some errors in the results. CT could be also affected by sorts of variables and could not represent the choroid's subtle structural changes; we cannot assess the choroid structural changes and blood supply only by CT. measurement. Recently, Agrawal et al. (17) assessed the LA, SA, and TCA through EDI-OCT images and proposed a new parameter-CVI to assess the choroidal vascular structure. In their study, they found that CVI was less affected than the sub-foveal CT and suggested CVI be a more robust marker of choroidal diseases. Subsequently, other studies have also demonstrated less variability of CVI.
However, there are conflicting views on choroidal blood flow in the study of choroidal hyperopic patients. Baek et al. (33) claimed that hyperopia eyes were found to have increased choroidal CV compared to normal eyes. But most studies concluded that the choroidal blood flow in patients with high hyperopia eyes is lower than that in normal children (34–36). The results in this study are consistent with most of the previous studies, the average CVI in the hyperopic amblyopic eyes was lower than the normal control eyes. In our study, we found that the AL was significantly correlated with SFCT but not the CVI, which was consistent with the previous results, further indicating that CVI might be an alternative metric for the evaluation of choroidal disorders.
On the other hand, a shorter AL tended to be associated with bigger LA, SA, and TCA. Li et al. reported that changes in luminal areas might directly influence choroidal thickness, as blood vessels represent the main component of the choroid (31). Alis et al. (37) found that TCA and SA were higher in hyperopia than in both emmetropic and myopic eyes. Nishi et al. found that the LA was significantly larger, the SA was significantly smaller, and the luminal/stromal ratio was larger in amblyopic eyes than that of normal children (38). Meryem et al. (37) found that TCA and SA were higher in hyperopia than in both emmetropic and myopic eyes. In the present study, LA, and TCA values of the high hyperopia eyes were significantly larger than that of the normal control eyes suggesting an increase in blood flow and blood vessel area in eyes with shorter AL. It is still unknown whether the thickening of the choroid in hyperopia is caused by the increase of stromal area or the enlargement of the vascular luminal area. Multicenter studies with large sample sizes are needed for further validation.
Age is also an important factor affecting choroid structure. Previous studies found that the CT tended to decrease with increasing age in adults (27, 28), Fujiwara et al. found that choroidal vascular density had a negative association with age in healthy adults (39). In the present study, SFCT had a significant negative relationship with AL and positive relationship with SE. Ruiz-Medrano et al. (40) found that the choroidal stromal area was not affected by age in a healthy population that included normal children. In our study, there were no significant association among AL, SA, LA, and TCA.
Our study has several limitations. First, the sample size is relatively small, and the high hyperopes are all Chinese children. Second, the OCT measurement of each subject in our study was performed at a randomized time at their convenience, and the CT measurements only occurred in a single horizontal scan centered on the fovea. Further studies with a large population and unified examination time are needed for more positive and robust results.
In summary, to our knowledge, the current study provides the first description of the structural features of the choroid and the factors influencing them in Chinese children with high hyperopia.
The choroidal structure of the high hyperopia eyes was different from the normal control eyes. The thicker SFCT, higher LA, and TCA were characteristic of high hyperopia eyes. Choroidal blood flow may be decreased in amblyopic eyes. SFCT of high hyperopia children abnormally increased and correlated with shorter AL and higher SE. AL and SE affect choroidal structure and vascular density. We suggest that choroidal topographic features, are biomarker of high hyperopia, but CVI is another more robust indicator.
The raw data supporting the conclusions of this article will be made available by the authors, without undue reservation.
The studies involving human participants were reviewed and approved by The Institutional Review Board of Peking University First Hospital. Written informed consent to participate in this study was provided by the participants’ legal guardian/next of kin. Written informed consent was obtained from the individual(s), and minor(s)' legal guardian/next of kin, for the publication of any potentially identifiable images or data included in this article.
DHZ and HW: were responsible for the study design. RSL, JW, RYL and JJZ: examined all subjects. HW: collected the data. HW and RSL: contributed to the data analysis. DHZ: made major contributions to writing the manuscript. DHZ: revised and edited the manuscript. All authors contributed to the article and approved the submitted version.
The authors declare that the research was conducted in the absence of any commercial or financial relationships that could be construed as a potential conflict of interest.
All claims expressed in this article are solely those of the authors and do not necessarily represent those of their affiliated organizations, or those of the publisher, the editors and the reviewers. Any product that may be evaluated in this article, or claim that may be made by its manufacturer, is not guaranteed or endorsed by the publisher.
AL, axial length; BCVA, best-corrected visual acuity; IOP, intraocular pressure; LogMAR, logarithm of the minimum angle of resolution; CT, choroidal thickness; TCA, total choroidal area; S.A., stromal area; L.A., the luminal area; CVI, the choroidal vascularity index; EDI-OCT, enhance depth imaging-optical coherence tomography.
1. Summers JA. The choroid as a sclera growth regulator. Exp Eye Res. (2013) 114:120–7. doi: 10.1016/j.exer.2013.03.008
2. Lin P-W, Chang H-W, Lai I-C, Teng M-C. Visual outcomes after spectacles treatment in children with bilateral high refractive amblyopia. Clin Exp Optom. (2016) 99:550–4. doi: 10.1111/cxo.12412
3. Semeraro F, Forbice E, Nascimbeni G, Cillino S, Bonfiglio VME, Filippelli ME, et al. Ocular refraction at birth and its development during the first year of life in a large cohort of babies in a single center in northern Italy. Front Pediatr. (2019) 7:539. doi: 10.3389/fped.2019.00539
4. Yahya AN, Sharanjeet-Kaur S, Akhir SM. Distribution of refractive errors among healthy infants and young children between the age of 6 to 36 months in Kuala Lumpur, Malaysia-A pilot study. Int J Environ Res Public Health. (2019) 16:E4730. doi: 10.3390/ijerph16234730
5. Chiang ST-H, Phillips JR, Backhouse S. Effect of retinal image defocus on the thickness of the human choroid. Ophthalmic Physiol Opt J Br Coll Ophthalmic Opt Optom. (2015) 35:405–13. doi: 10.1111/opo.12218
6. He L, Frost MR, Siegwart JT, Norton TT. Gene expression signatures in tree shrew choroid during lens-induced myopia and recovery. Exp Eye Res. (2014) 123:56–71. doi: 10.1016/j.exer.2014.04.005
7. Chakraborty R, Read SA, Collins MJ. Monocular myopic defocus and daily changes in axial length and choroidal thickness of human eyes. Exp Eye Res. (2012) 103:47–54. doi: 10.1016/j.exer.2012.08.002
8. Chakraborty R, Read SA, Collins MJ. Hyperopic defocus and diurnal changes in human choroid and axial length. Optom Vis Sci Off Publ Am Acad Optom. (2013) 90:1187–98. doi: 10.1097/OPX.0000000000000035
9. Nickla DL, Wallman J. The multifunctional choroid. Prog Retin Eye Res. (2010) 29:144–68. doi: 10.1016/j.preteyeres.2009.12.002
10. Tan CSH, Cheong KX. Macular choroidal thicknesses in healthy adults–relationship with ocular and demographic factors. Invest Ophthalmol Vis Sci. (2014) 55:6452–8. doi: 10.1167/iovs.13-13771
11. Rhodes LA, Huisingh C, Johnstone J, Fazio MA, Smith B, Wang L, et al. Peripapillary choroidal thickness variation with age and race in normal eyes. Invest Ophthalmol Vis. (2015) 56(3):1872–9. doi: 10.1167/iovs.14-16179
12. Wakatsuki Y, Shinojima A, Kawamura A, Yuzawa M. Correlation of aging and segmental choroidal thickness measurement using swept source optical coherence tomography in healthy eyes. PloS One. (2015) 10(12):e0144156. doi: 10.1371/journal.pone.0144156
13. Xiong S, He X, Zhang B, Deng J, Wang J, Lv M, et al. Changes in choroidal thickness varied by age and refraction in children and adolescents: a 1-year longitudinal study. Am J Ophthalmol. (2020) 213:46–56. doi: 10.1016/j.ajo.2020.01.003
14. Zhou H, Dai Y, Shi Y, Russell JF, Lyu C, Noorikolouri J, et al. Age-related changes in choroidal thickness and the volume of vessels and stroma using swept-source OCT and fully automated algorithms. Ophthalmol Retina. (2020) 4:204–15. doi: 10.1016/j.oret.2019.09.012
15. Li XQ, Larsen M, Munch IC. Subfoveal choroidal thickness in relation to sex and axial length in 93 danish university students. Invest Ophthalmol Vis Sci. (2011) 52:8438–41. doi: 10.1167/iovs.11-8108
16. Alshareef RA, Khuthaila MK, Goud A, Vupparaboina KK, Jana S, Chhablani J. Subfoveal choroidal vascularity in myopia: evidence from spectral-domain optical coherence tomography. Ophthalmic Surg Lasers Imaging Retina. (2017) 48:202–7. doi: 10.3928/23258160-20170301-02
17. Agrawal R, Gupta P, Tan K-A, Cheung CMG, Wong T-Y, Cheng C-Y. Choroidal vascularity index as a measure of vascular status of the choroid: measurements in healthy eyes from a population-based study. Sci Rep. (2016) 6:21090. doi: 10.1038/srep21090
18. Zhang JM, Wu JF, Chen JH, Wang L, Lu TL, Sun W, et al. Macular choroidal thickness in children: the shandong children eye study. Invest Ophthalmol Vis Sci. (2015) 56:7646–52. doi: 10.1167/iovs.15-17137
19. Jin P, Zou H, Zhu J, Xu X, Jin J, Chang TC, et al. Choroidal and retinal thickness in children with different refractive Status measured by swept-source optical coherence tomography. Am J Ophthalmol. (2016) 168:164–76. doi: 10.1016/j.ajo.2016.05.008
20. Read SA, Collins MJ, Vincent SJ, Alonso-Caneiro D. Choroidal thickness in myopic and nonmyopic children assessed with enhanced depth imaging optical coherence tomography. Invest Ophthalmol Vis Sci. (2013) 54:7578–86. doi: 10.1167/iovs.13-12772
21. Fontaine M, Gaucher D, Sauer A, Speeg-Schatz C. Choroidal thickness and ametropia in children: a longitudinal study. Eur J Ophthalmol. (2017) 27:730–4. doi: 10.5301/ejo.5000965
22. Read SA, Collins MJ, Vincent SJ, Alonso-Caneiro D. Choroidal thickness in childhood. Invest Ophthalmol Vis Sci. (2013) 54:3586–93. doi: 10.1167/iovs.13-11732
23. Mori T, Sugano Y, Maruko I, Sekiryu T. Subfoveal choroidal thickness and axial length in preschool children with hyperopic anisometropic amblyopia. Curr Eye Res. (2014) 40:1–8. doi: 10.3109/02713683.2014.964418
24. Zha Y, Zhuang J, Feng W, Zheng H, Cai J. Evaluation of choroidal thickness in amblyopia using optical coherence tomography. Eur J Ophthalmol. (2020) 30(4):629–34. doi: 10.1177/1120672119834179
25. Öner V, Bulut A, Büyüktarakçı Ş, Kaim M. Influence of hyperopia and amblyopia on choroidal thickness in children. Eur J Ophthalmol. (2016) 26:623–6. doi: 10.5301/ejo.5000703
26. El-Shazly AA, Farweez YA, ElSebaay ME, El-Zawahry WMA. Correlation between choroidal thickness and degree of myopia assessed with enhanced depth imaging optical coherence tomography. Eur J Ophthalmol. (2017) 27:577–84. doi: 10.5301/ejo.5000936
27. Ikuno Y, Kawaguchi K, Nouchi T, Yasuno Y. Choroidal thickness in healthy Japanese subjects. Invest Ophthalmol Vis Sci. (2010) 51:2173–6. doi: 10.1167/iovs.09-4383
28. Kim M, Kim SS, Koh HJ, Lee SC. Choroidal thickness, age, and refractive error in healthy Korean subjects. Optom Vis Sci Off Publ Am Acad Optom. (2014) 91:491–6. doi: 10.1097/OPX.0000000000000229
29. Bidaut-Garnier M, Schwartz C, Puyraveau M, Montard M, Delbosc B, Saleh M. Choroidal thickness measurement in children using optical coherence tomography. Retina Phila Pa. (2014) 34:768–74. doi: 10.1097/IAE.0b013e3182a487a4
30. Nagasawa T, Mitamura Y, Katome T, Shinomiya K, Naito T, Nagasato D, et al. Macular choroidal thickness and volume in healthy pediatric individuals measured by swept-source optical coherence tomography. Invest Ophthalmol Vis Sci. (2013) 54:7068–74. doi: 10.1167/iovs.13-12350
31. Li Z, Long W, Hu Y, Zhao W, Zhang W, Yang X. Features of the choroidal structures in myopic children based on image binarization of optical coherence tomography. Invest Ophthalmol Vis Sci. (2020) 61:18. doi: 10.1167/iovs.61.4.18
32. Read SA, Alonso-Caneiro D, Vincent SJ, Collins MJ. Longitudinal changes in choroidal thickness and eye growth in childhood. Invest Ophthalmol Vis Sci. (2015) 56:3103–12. doi: 10.1167/iovs.15-16446
33. Baek J, Lee A, Chu M, Kang NY. Analysis of choroidal vascularity in children with unilateral hyperopic amblyopia. Sci Rep:9(1):1–8. doi: 10.1038/s41598-019-48613-3
34. Furundaoturan O, Değirmenci C, Akkın C, Demirkılınç Biler E, Üretmen Ö, Nalçacı S, et al. Evaluation of choroidal vascular Index in amblyopic patients. Turk J Ophthalmol. (2022) 52:168–73. doi: 10.4274/tjo.galenos.2021.48275
35. Cevher S, Üçer MB, Şahin T. How does anisometropia affect the choroidal vascularity index? Indian J Ophthalmol. (2022) 70:2043–9. doi: 10.4103/ijo.IJO_3092_21
36. Guler Alis M, Alis A. Features of the choroidal structure in children with anisometropic amblyopia. J Pediatr Ophthalmol Strabismus. (2022) 59:320–5. doi: 10.3928/01913913-20220103-01
37. Alis MG, Alis A. Choroidal vascularity Index in adults with different refractive Status. Photodiagnosis Photodyn Ther. (2021) 36:102533. http://www.sciencedirect.com/science/article/pii/S1572100021003574 (Accessed March 1, 2022) doi: 10.1016/j.pdpdt.2021.102533
38. Nishi T, Ueda T, Mizusawa Y, Shinomiya K, Semba K, Mitamura Y, et al. Choroidal structure in children with anisohypermetropic amblyopia determined by binarization of optical coherence tomographic images. PloS One. (2016) 11:e0164672. doi: 10.1371/journal.pone.0164672
39. Fujiwara A, Morizane Y, Hosokawa M, Kimura S, Kumase F, Shiode Y, et al. Factors affecting choroidal vascular density in normal eyes: quantification using en face swept-source optical coherence tomography. Am J Ophthalmol. (2016) 170:1–9. doi: 10.1016/j.ajo.2016.07.006
Keywords: choroidal thickness, choroidal vascularity index, EDI-OCT choroidal thickness, EDI-OCT, high hyperopia
Citation: Zhu D, Wang H, Li R, Wen J, Li R and Zhao J (2023) Choroidal thickness and vascular microstructure parameters in Chinese school-age children with high
Received: 7 November 2022; Accepted: 13 January 2023;
Published: 6 February 2023.
Edited by:
Andrzej Grzybowski, University of Warmia and Mazury in Olsztyn, PolandReviewed by:
Longqian Liu, Sichuan University, China© 2023 Zhu, Wang, Li, Wen, Li and Zhao. This is an open-access article distributed under the terms of the Creative Commons Attribution License (CC BY). The use, distribution or reproduction in other forums is permitted, provided the original author(s) and the copyright owner(s) are credited and that the original publication in this journal is cited, in accordance with accepted academic practice. No use, distribution or reproduction is permitted which does not comply with these terms.
*Correspondence: Zhu Dehai MTM2NTExMDMwMzZAMTYzLmNvbQ==
†These authors have contributed equally to this work
Specialty Section: This article was submitted to Children and Health, a section of the journal Frontiers in Pediatrics
Disclaimer: All claims expressed in this article are solely those of the authors and do not necessarily represent those of their affiliated organizations, or those of the publisher, the editors and the reviewers. Any product that may be evaluated in this article or claim that may be made by its manufacturer is not guaranteed or endorsed by the publisher.
Research integrity at Frontiers
Learn more about the work of our research integrity team to safeguard the quality of each article we publish.