- Department of Pediatrics, Shengjing Hospital of China Medical University, Shenyang, Liaoning, China
Background: Bronchopulmonary dysplasia (BPD) is the most common neonatal chronic lung disease. However, its exact molecular pathogenesis is not understood. We aimed to identify relevant gene modules that may play crucial roles in the occurrence and development of BPD by weighted gene co-expression network analysis (WGCNA).
Methods: We used RNA-Seq data of BPD and healthy control rats from our previous studies, wherein data from 30 samples was collected at days 1, 3, 7, 10, and 14. Data for preprocessing analysis included 17,613 differentially expressed genes (DEGs) with false discovery rate <0.05.
Results: We grouped the highly correlated genes into 13 modules, and constructed a network of mRNA gene associations, including the 150 most associated mRNA genes in each module. Lgals8, Srpra, Prtfdc1, and Thap11 were identified as the key hub genes. Enrichment analyses revealed Golgi vesicle transport, coated vesicle, actin-dependent ATPase activity and endoplasmic reticulum pathways associated with these genes involved in the pathological process of BPD in module.
Conclusions: This is a study to analyze data obtained from BPD animal model at different time-points using WGCNA, to elucidate BPD-related susceptibility modules and disease-related genes.
Introduction
Bronchopulmonary dysplasia (BPD), a chronic respiratory disease with distinctive pathological features and clinical outcomes, is common in premature infants (1). Preterm birth affects about 11% of newborns worldwide. However, due to differences in gestational age measurements, preterm birth definitions, and data collection and reporting, the incidence varies (2–4). Although the pathogenesis of BPD is not fully understood, the pathological features of alveolar dysplasia have been elucidated long-term immaturity of the alveolar structure and a reduced number of pulmonary blood vessels (5–7). Therefore, an in-depth investigation of the biomarkers and molecular mechanisms (8) involved in BPD development is required to unravel the links affecting lung development and to explore effective intervention methods.
The WGCNA algorithm is a systems biology algorithm for constructing gene co-expression networks. The algorithm is based on high-throughput gene messenger RNA (mRNA) expression data and is widely used in the international biomedical field (9). In recent years, as high-throughput biotechnology is widely used in the basic research and clinical treatment of BPD (10–12), a modular analysis tool that performs tissue/cellular networks weighted gene co-expression network analysis (WGCNA) is increasingly being used (13). First, the WGCNA algorithm assumes that the gene network obeys a scale-free distribution and defines the gene co-expression correlation matrix and the adjacency function formed by the gene network (13, 14). Second, it calculates the dissimilarity coefficients of different nodes and builds a hierarchical clustering tree accordingly (15). Different branches of the clustering tree represent different gene modules. The genes within the same modules have a high co-expression degree, while those with different scores have a low co-expression degree (16). Finally, WGCNA reveals the relationship between the modules and specific phenotypes or diseases to identify target genes and gene networks (9); the analysis provides system-level insight and high sensitivity for genes with low abundance or small folding changes, without any information loss (17, 18).
In this study, through comprehensive bioinformatics analysis, we analyzed the RNA-Seq data from our previous study to identify differentially expressed genes (DEGs) between BPD and control rat models to elucidate the mechanism behind BPD pathogenesis. Therefore, in this study we elucidated genes that they may be used as diagnostic indicators and therapeutic markers for BPD.
Materials and methods
Animal model
According to previous research methods, long-term hyperoxia exposure after newborn has been considered to be a relatively complete method in animal models that can delay alveolar development in previous studies (6, 19, 20). Newborn Sprague–Dawley rats were randomly and double-blindly divided into a control group and a model group. Following previous method (20–22), confounding factors such as birth weight, sex, gestational age, and temperature were excluded by random assignment. The light/dark cycle was 12 h, and the rat had free access to food and water. The control group was fed in the air (FiO2 = 0.21), and the model group was placed in a hyperoxia box to maintain the oxygen concentration in the box (FiO2 = 0.85). Lime soda was placed in oxygen box to absorb CO2 less than 0.5%. Silica gel was used to remove the water vapor in the oxygen tank so that the humidity in the box was maintained at 60%–70%, and the temperature of the two groups was maintained at 25–26 °C. The dams were fed neonatal rats and were shuffled between different cages every 24 h to reduce the effect of differences in lactation ability. The cages were opened for 30 min daily, and the rats were provided with clean drinking water and food. On days 1, 3, 7, 10, and 14 after birth, the neonatal pups were randomly selected from each group. After administration of anesthesia (isoflurane via inhalation), the thoracic cavity of the rat was opened, the lung tissue was lavaged with 18 cm H2O pressure normal saline, and the blood in the lung was perfused. The lung lobes of were separated and placed in tubes. After quick freezing in liquid nitrogen, the lung samples were stored at −80 °C for RNA-Seq. The procedures and design of the experiments involving animals complied with the guidelines for animal care and use. This study was approved by the Ethics Committee of China Medical University (ethics code: 2020PS764K).
Data preprocessing
The RNA-seq data of this study is uploaded into the GEO database (https://www.ncbi.nlm.nih.gov/geo/query/acc.cgi). The Gene Expression Omnibus (GEO) accession number is GSE 212098. We also obtained the BPD-related transcriptomic dataset GSE156028 from GEO. They analyzed tracheal aspirates (TAs) from 53 neonates receiving invasive mechanical ventilation. 26 infants were diagnosed with extremely preterm birth without lung disease, and 27 term infants received invasive mechanical ventilation for elective surgery. The “affy” package in R was used for normalization and background correction of the data. The probe-level data were then converted to gene expression values. For multiple probes corresponding to a gene, the average expression value was taken as the gene expression value in this study. We observed the distribution patterns of disease and control samples (before and after cluster analysis and outlier removal) using principal component analysis (PCA).
Identification of DEGs
The “limma” package in R was used to identify DEGs between the expression data of BPD and healthy control samples. We performed a significance analysis on the transcriptomic mRNA profiles data and set the selection criteria as false discovery rate (FDR) values <0.05 and |log2 Fold change| > 0 for network construction.
Construction of co-expression network
We analyzed the connectivity of eigengenes. Eigengenes can provide information about the relationship between pairs of gene co-expression modules. The “WGCNA” package in R was used to construct co-expression networks based on the expression data profiles. We constructed a network of mRNA gene associations, including the 150 most associated mRNA genes in each module, using the STRING database and Cytoscape software to construct a protein-protein interaction (PPI) network. Transcriptomic mRNA profiles data quality was checked by the “impute” package in R, which detects genes for missing values and ensures that they are good samples. We performed sample clustering to draw sample trees, and detect and remove outliers. We then constructed a Pearson correlation matrix for paired genes and found a soft threshold power β value by using the pickSoftThreshold function of the “WGCNA” package.
Identification of hub genes
We defined hub genes in the co-expression network as genes that satisfy two conditions: the absolute value of Pearson correlation for module membership (MM) > 0.8 and the absolute value of Pearson correlation for gene-trait (GS) relationship > 0.2, representing high modular connectivity and high clinical significance. The true central genes were subsequently obtained by obtaining the intersection of the central genes and significant DEGs in a co-expression network visualized by Cytoscape 3.7.1.
Enrichment analysis
Based on the results in the previous section, we focused on modules that were differentially expressed consistently across developmental time. We performed GO and KEGG pathway enrichment annotations for candidate genes in up-regulated brown modules and down-regulated purple modules at all time points in the BPD model. The online software DAVID (Database for Annotation, Visualization, and Integrated Discovery v6.8; https://david.ncifcrf.gov/) was used to investigate gene-related biological processes and pathways. GO biological processes and KEGG pathways with P < 0.05 and/or FDR < 0.05 were defined as significant terms. GO terms are divided into biological process (BP), cellular component (CC), and molecular function (MF). Statistical significance was considered at P-value < 0.05.
Results
Construction of WGCNA and selection of soft threshold
We used RNA-Seq data of normal controls (n = 30, 3 repetitions per set from postnatal days 1, 3, 7, 10, and 14) and BPD rat models (n = 30, 3 repetitions per set from postnatal days 1, 3, 7, 10, and 14) for analysis. We examined genes and samples with several missing values, but all genes passed the cutoff threshold. Next, we calculated the correlation coefficient (Pearson Coefficient) between any two genes of a sample and used the weighted value of the correlation coefficient to make the connection between the genes in the network obey scale-free networks. In this study, the weight parameter β was 3. Since the scale independence reached 0.8, the data had a relatively high average connectivity (Figure 1).
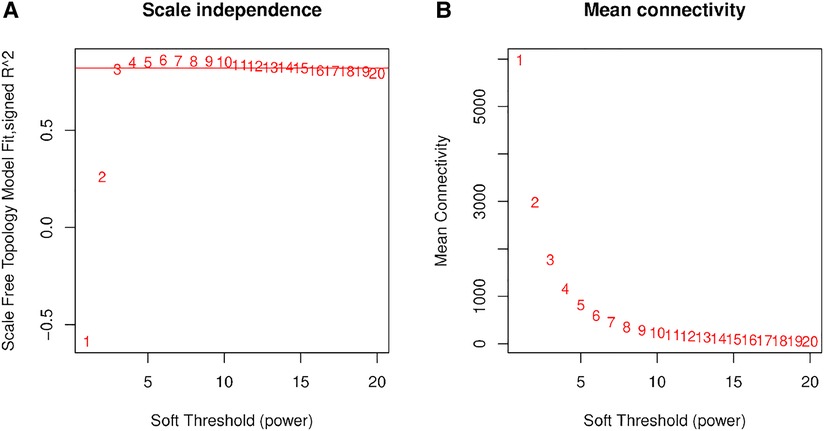
Figure 1. Network topology analysis of soft threshold power. (A) The x-axis reflects soft threshold capability, and the y-axis reflects the scale-free topological model fit index. (B) The x-axis reflects the soft threshold capability, and the y-axis reflects the average connectivity (degrees).
Module hierarchical clustering and correlation analysis
First, the distance between samples was calculated using an algorithm describing the community's composition and structure, i.e., hierarchical clustering analysis was performed according to the beta diversity distance matrix, and 13 gene co-expression modules were finally constructed. The topological overlap matrix (TOM) between all genes included in the analysis is depicted by a heatmap. Light colors indicate low overlap, and progressively darker reds indicate high overlap. The results showed strong gene expression connectivity between modules (Figure 2). The results revealed that the 13 modules could be grouped into two clusters in each sample at different time points. (Figure 3), and four combinations (module brown and yellow, module black and magenta, module tan and turquoise, and module green and red) were highly interactive. We associated modules with features and searched for the most significant associations. The results showed that module red had the most significant positive correlation with BPD model at day 1; the module brown and yellow had the most significant positive correlation with BPD model at day 14, and the module purple had the most significant negative correlation with BPD model at day 14 (Figure 3).
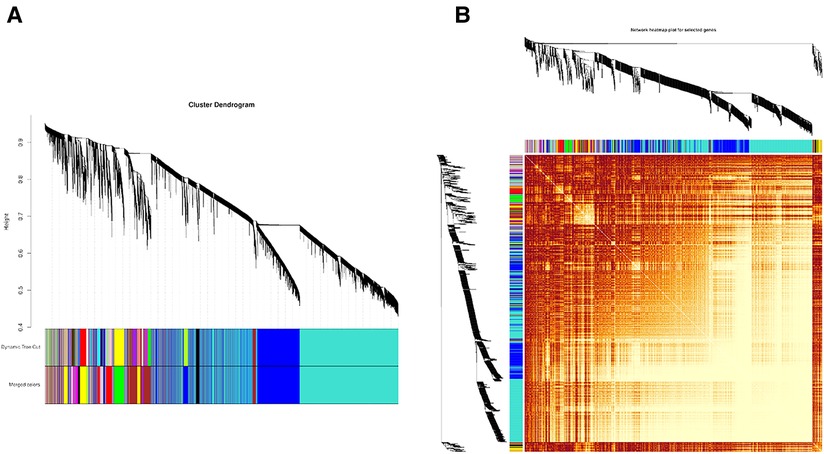
Figure 2. (A) Module hierarchical clustering tree. The upper part of the tree diagram, the vertical distance represents the distance between two nodes (genes). (B) Heatmap representing the clustering of all modules (Maps represent the relationship between the identified modules). The heat map depicts the topological overlap matrix (TOM) between all genes included in the analysis. Light colors indicate low overlap, and progressively darker red indicates high overlap.
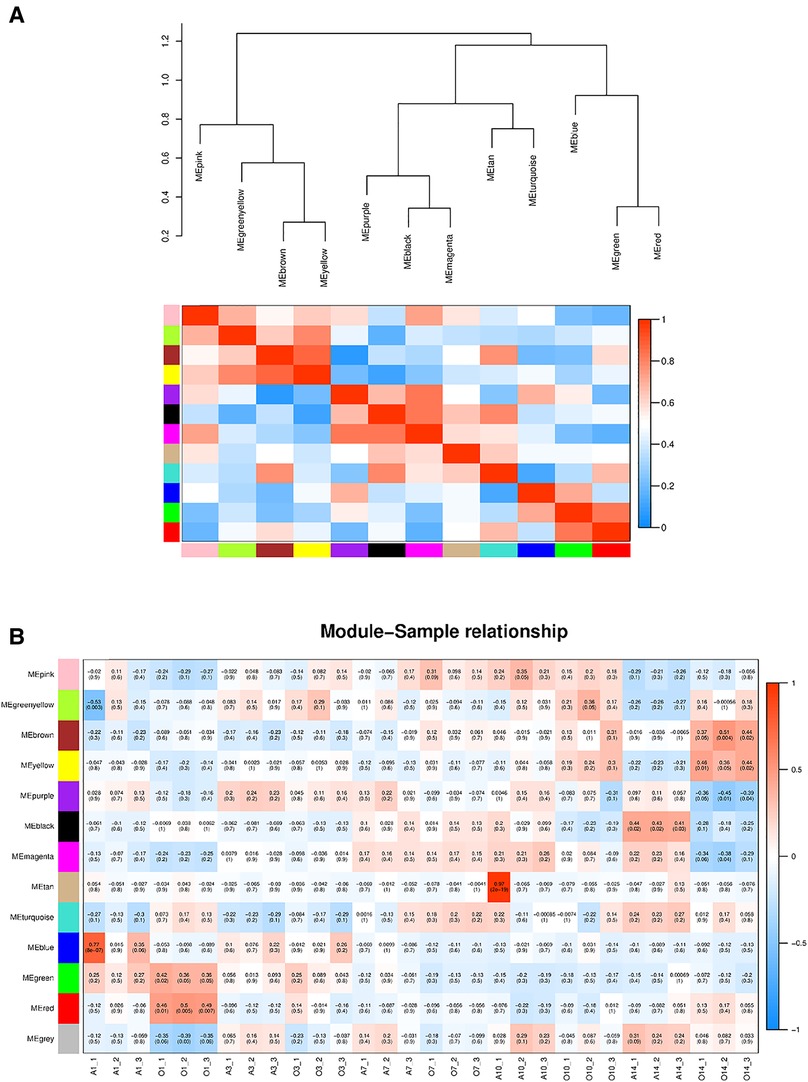
Figure 3. (A) Heatmap of the correlation between modules from the gene dendrogram and the self-gene adjacency graph (the upper part clusters the modules according to the eigengenes of the modules. The ordinate represents the degree of dissimilarity of the nodes; each row in the lower part of the graph. The sum column represents a module). (B) Module-feature associations (Each row corresponds to a module, and each column corresponds to a sample. Each cell contains the corresponding correlation and P-value. The table is color-coded by correlation according to the color legend).
Gene expression patterns of each module
Both in the green module and yellow module, the expression pattern of the BPD group was up-regulated at days 10 and 14. Rassf5 etc. were the most related hub genes of this module. In the black module, the expression pattern of the BPD group was up-regulated at day 1 and significantly down-regulated at days 10 and 14. In the yellow module, the expression pattern of the BPD group was down-regulated at day 1, and significantly up-regulated at days 10 and 14; PPI network revealed Prickle4 and Sod2 as the most significant hub genes in this module. In the magenta module, the expression pattern of the BPD group was down-regulated at days 10 and 14; PPI network analysis revealed Fgfr4, Jak3, and Tcf7 as the most significant hub genes in this module. In the red module, the expression pattern of the BPD model group was up-regulated at day 1; PPI network analysis revealed Dusp4, Golm1, and Kif16b as the most significant hub genes in this module. In the turquoise module, the expression pattern of the BPD model group was up-regulated at days 1 and 7, and down-regulated at day 14; PPI network analysis revealed Dctn4, Cox4i1, and Ppib as the most significant hub genes for this module (see Figures in Supplementary Materials). In the brown module, the expression pattern of the BPD group was up-regulated at days 1, 3, 7, 10, and 14; PPI network analysis revealed Lgals8 and Srpra as the hub genes of this module. In the purple module, the expression pattern of the BPD model group was down-regulated at days 1, 3, 7, 10, and 14; PPI network analysis revealed Prtfdc1 and Thap11 as the hub genes of this module (Figure 4).
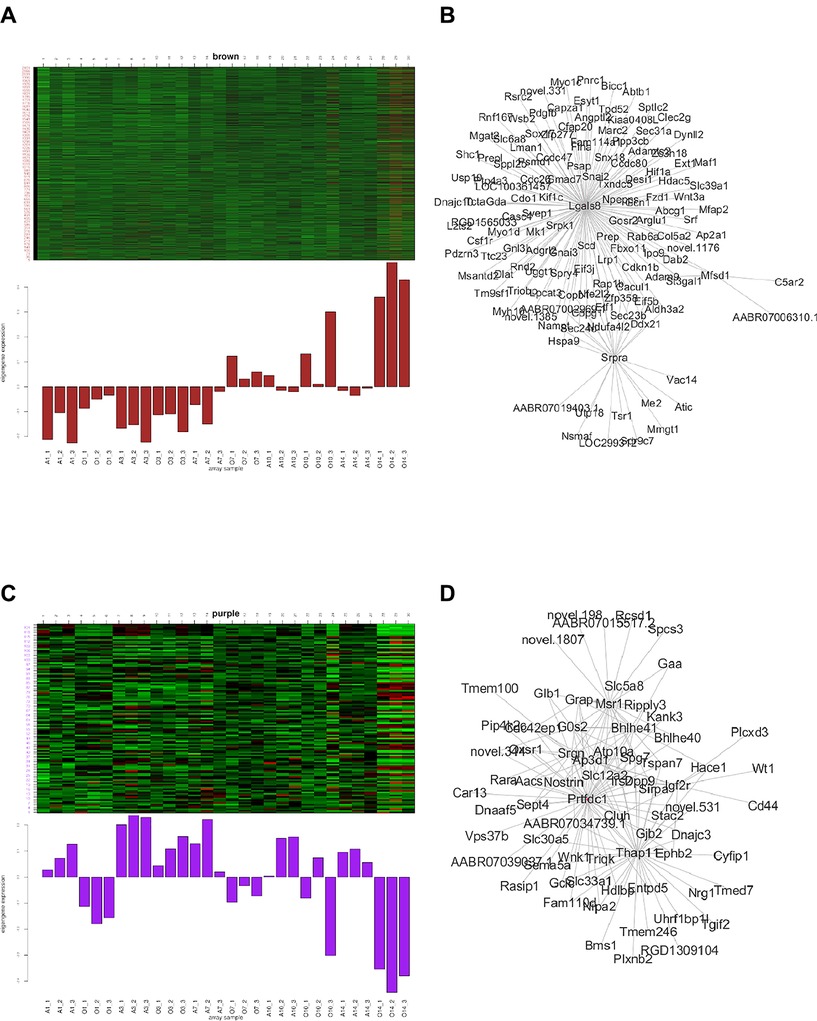
Figure 4. Gene expression pattern of each module (the left part exhibits the gene expression pattern, and the right part shows the hub-gene expression network).
Functional annotation of hub genes in candidate modules
We performed GO and KEGG pathway enrichment annotations for candidate genes in brown modules that were up-regulated and in purple modules that were down-regulated at all time-points in the BPD model. The up-regulated genes of the brown module were mainly enriched in the following GO terms: Golgi vesicle transport (BP), coated vesicle (CC), and actin-dependent ATPase activity (MF) pathways; KEGG enrichment analysis revealed that they were mainly enriched in the protein processing in endoplasmic reticulum pathway. The down-regulated genes of the purple module were mainly enriched in the following GO terms: T cell chemotaxis (BP), axon cytoplasm (CC), and magnesium ion binding pathways; KEGG enrichment analysis revealed that they were mainly enriched in the lysosome pathway (Figure 5).
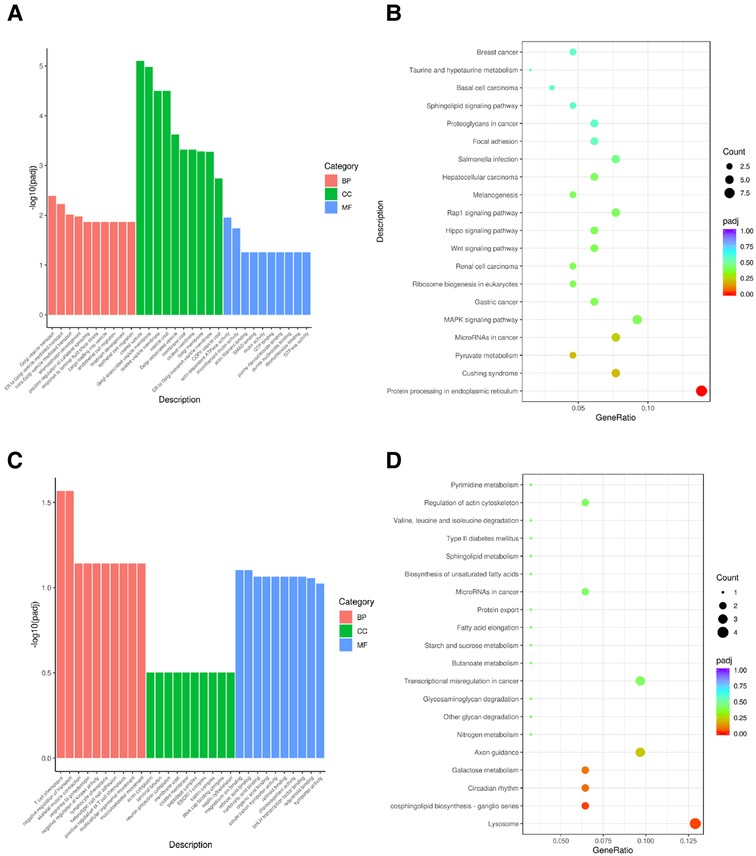
Figure 5. KEGG and GO pathway annotations of candidate module genes (A) GO enrichment of brown module; (B) KEGG enrichment of brown module; (C) GO enrichment of purple module; (D) KEGG enrichment of purple module.
Differential expressions were verified in clinical patients samples
Finally, we validated the differentially expressed differentially identified genes of interest with RNA-Seq data from clinical patient samples from the Gene Expression Omnibus (GEO) database. GSE156028 was selected as tracheal aspirate samples from normal controls and patients with BPD (n = 38). The results showed that the expression of Lgals8, Srpra, Prtfdc1, and Thap11 were up-regulated in BPD, and the difference of Lgals8 and Srpra was statistically significant (Figure 6). The diagnostic effect was judged according to the sensitivity, specificity and area under the receiver operating characteristic (ROC) curve. The AUC value was 0.6875, which has certain diagnostic significance. It is expected to continue to be verified in the expanded clinical database samples in the future.
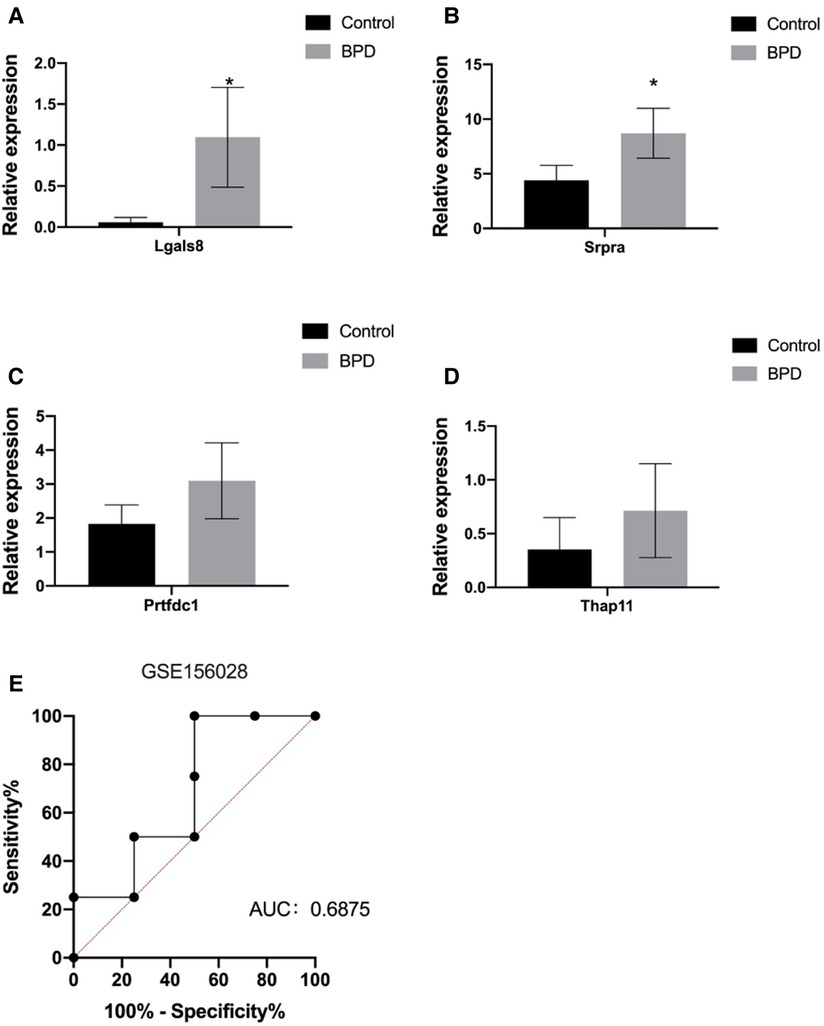
Figure 6. (A–D) Validation of expression levels of Lgals8, Srpra, Prtfdc1, and Thap1 in tracheal aspirate samples from normal controls and BPD patients (n = 38) from GSE156028 in the gene expression omnibus (GEO) database. (E) Receiver operating characteristic curve for diagnosis of BPD patients using expression levels of these four RNAs in GSE156028. Data are shown as the mean ± SEM. *P < 0.05.
Discussion
BPD is a multifactorial disease that remains a major therapeutic challenge in neonatal care (23, 24). According to a study conducted by the Neonatal Research Network of the National Institutes of Child Health and Human Development, the overall incidence of BPD in infants born at less than 28 weeks of gestation is estimated to be between 48% and 68% (4). In this study, we used the complete RNA-Seq data of our research group to determine the key features of the BPD rat model at different time-points by constructing WGCNA modules, using data from lung tissue of rat BPD model, and comparing the data from model group with those from the control group. Key genes, including Lgals8, Srpra, Prtfdc1, Thap11, were identified.
In the brown module, the expression pattern of the BPD group was up-regulated at days 1, 3, 7, 10, and 14; PPI network analysis revealed Lgals8 and Srpra as the hub genes of this module. Lgals8 (Lectin, galactoside-binding soluble 8) codes for a member of the galactose family. Galectins are galactoside-binding animal lectins with a conserved carbohydrate recognition domain. Galectins have important functions in development, differentiation, cell adhesion, cell-matrix interactions, growth regulation, apoptosis, and RNA splicing (25). The gene is widely expressed in tumor tissues and is involved in integrin-like cell interactions. Additionally, spliced transcript variants of the gene encoding different isoforms have been identified. It is also commonly expressed in 27 tissues including the spleen, skin, and lung (26–28). Srpra (SRP receptor subunit alpha) is a subunit of the endoplasmic reticulum signal-recognition granule receptor, which, together with the signal-recognition granule, is involved in the targeting and translocation of secreted and membrane proteins marked by the endoplasmic reticulum signal sequence. Alternative splicing results in multiple transcript variants (29–32). Therefore, it may play an important role in the process of lung development and the pathological process of BPD.
In the purple module, the expression pattern of the BPD model group was down-regulated at days 1, 3, 7, 10, and 14; PPI network analysis revealed Prtfdc1 and Thap11 as the hub genes of this module. Prtfdc1 (phosphoribosyl transferase domain containing 1) is a hypoxanthine-guanine phosphoribosyltransferase (PRT) homolog of unknown function that catalyzes the conversion of hypoxanthine and guanine to their respective monophosphate-enabled proteins homodimerization activity, and is involved in purine ribonucleoside rescue (33, 34). Thap11 (Thanatos-associated protein domain containing protein 11) is a ubiquitously-expressed member of the transcription factor family with a highly conserved DNA-binding and protein-interacting region (35), involved in various cellular regulations such as apoptosis, proliferation and differentiation (36–38). Relevant studies of the above genes in BPD are lacking, and their role in BPD models deserve further research.
Functional enrichment analysis revealed that the hub genes of the brown module were mainly enriched in Golgi vesicle transport (BP), coated vesicle (CC), and actin-dependent ATPase activity (MF) pathways. KEGG enrichment analysis revealed that these genes were mainly enriched in protein processing in endoplasmic reticulum pathway. These results are in accordance with those from our previous study on the pathogenesis of BPD, which suggested that cellular lipid membrane activities, such as those of the endoplasmic reticulum, were involved in the pathological process of BPD (39), and many studies also confirmed that pathways, such as YAP/TAZ mediate actin-dependent ATPase and endoplasmic reticulum function pathways (40–42), which are involved in the functional changes of alveolar epithelial cells. These studies confirmed that these pathways were involved in BPD pathogenesis. The GO enrichment analysis of the down-regulated hub genes of the purple module revealed that the following terms were enriched: T cell chemotaxis (BP), axon cytoplasm (CC) and magnesium ion binding pathways. KEGG enrichment analysis revealed that the genes were mainly enriched in pathways such as the lysosome pathway. Concurrently, previous studies also showed that T cell receptors are reduced in BPD (43) and may be a risk factor for infection (44). Finally, the tracheal aspirate samples of BPD patients in the GEO database were used to verify Lgals8, Srpra, Prtfdc1, and Thap11 expression, and the results showed that the above genes were up-regulated in BPD.
Significant impairment of lung development results in persistent airway and pulmonary vascular disease, which affects adult lung function (45–48). Clinical and translational research that improve phenotypic classification of BPD and enable early identification of at-risk preterm infants should improve trial design and individualized care, which can improve outcomes for preterm infants (49). In this study, we cited the results of Oji Mmuo et al. (50), they analyzed the transcriptome characteristics of tracheal aspirates in extremely preterm infants with BPD and term infants without BPD. BPD is a complex disease with multiple contributing factors, including genetic predisposition, epigenetic factors, arrest of lung development, chronic inflammation, mechanical ventilation, and oxygen toxicity. In this study, we focused on the simplified lung structure of premature infants caused by long-term hyperoxia exposure and the normal premature infant model from different time points. We explored the transcriptome characteristics in the development of BPD. Oji-Mmuo et al. (51) also analyzed miRNA and mRNA profiles in tracheal aspirates, and due to the small number of clinical samples, the expression of further large-scale clinical studies deserves attention. It is believed that in the near future, the research on BPD markers will have important progress.
Conclusion
This study revealed the potential biological targets and enrichment pathways of BPD through the WGCNA analysis method, which paves the way for future BPD research and early clinical diagnosis and treatment of BPD. This is the first study that integrates data obtained from animal models of BPD at different time-points to construct co-expression networks using the WGCNA approach to explore BPD-related susceptibility modules and disease-related genes. Our findings reveal abnormal modules and several key genes that enhance our fundamental understanding of the molecular mechanisms of BPD.
Data availability statement
The raw data supporting the conclusions of this article will be made available by the authors, without undue reservation.
Ethics statement
The animal study was reviewed and approved by the Ethics Committee of China Medical University.
Author contributions
XY: substantial contributions to conception and design, acquisition of data, or analysis and interpretation of data; XY, ZL, YP, XC, XZ, DL, XX and JF: drafting the article or revising it critically for important intellectual content. All authors contributed to the article and approved the submitted version.
Funding
This study was supported by grants from the National Natural Science Foundation of China (No. 82071688); Joint plan of Liaoning Provincial Key R&D Program (2020JH2/10300152); and Key R&D Guidance Plan Projects of Liaoning Province (2020JH1/10300001).
Conflict of interest
The authors declare that the research was conducted in the absence of any commercial or financial relationships that could be construed as a potential conflict of interest.
Publisher's note
All claims expressed in this article are solely those of the authors and do not necessarily represent those of their affiliated organizations, or those of the publisher, the editors and the reviewers. Any product that may be evaluated in this article, or claim that may be made by its manufacturer, is not guaranteed or endorsed by the publisher.
References
2. Vogel JP, Chawanpaiboon S, Moller AB, Watananirun K, Bonet M, Lumbiganon P. The global epidemiology of preterm birth. Best Pract Res Clin Obstet Gynaecol. (2018) 52:3–12. doi: 10.1016/j.bpobgyn.2018.04.003
3. Baker EK, Davis PG. Bronchopulmonary dysplasia outcome estimator in current neonatal practice. Acta Paediatr. (2021) 110(1):166–7. doi: 10.1111/apa.15427
4. Thebaud B, Goss KN, Laughon M, Whitsett JA, Abman SH, Steinhorn RH, et al. Bronchopulmonary dysplasia. Nat Rev Dis Primers. (2019) 5:78. doi: 10.1038/s41572-019-0127-7
5. Marszalek A, Biczysko W, Wasowicz M. Development of the fetal and newborn lung–morphometric studies (rat model). Pol J Pathol. (1999) 50:277–88.10721268
6. Lignelli E, Palumbo F, Myti D, Morty RE. Recent advances in our understanding of the mechanisms of lung alveolarization and bronchopulmonary dysplasia. Am J Physiol Lung Cell Mol Physiol. (2019) 317:L832–87. doi: 10.1152/ajplung.00369.2019
7. Joshi S, Kotecha S. Lung growth and development. Early Hum Dev. (2007) 83:789–94. doi: 10.1016/j.earlhumdev.2007.09.007
8. Piersigilli F, Lam TT, Vernocchi P, Quagliariello A, Putignani L, Aghai ZH, et al. Identification of new biomarkers of bronchopulmonary dysplasia using metabolomics. Metabolomics. (2019) 15:20. doi: 10.1007/s11306-019-1482-9
9. Liang W, Sun F, Zhao Y, Shan L, Lou H. Identification of susceptibility modules and genes for cardiovascular disease in diabetic patients using WGCNA analysis. J Diabetes Res. (2020) 2020:4178639. doi: 10.1155/2020/4178639
10. Metzger RJ, Klein OD, Martin GR, Krasnow MA. The branching programme of mouse lung development. Nature. (2008) 453:745–50. doi: 10.1038/nature07005
11. Verder H, Heiring C, Ramanathan R, Scoutaris N, Verder P, Jessen TE, et al. Bronchopulmonary dysplasia predicted at birth by artificial intelligence. Acta Paediatr. (2021) 110(2):503–9. doi: 10.1111/apa.15438
12. Piersigilli F, Bhandari V. Biomarkers in neonatology: the new “omics” of bronchopulmonary dysplasia. J Matern Fetal Neonatal Med. (2016) 29:1758–64. doi: 10.3109/14767058.2015.1061495
13. Liu W, Li L, Ye H, Tu W. Weighted gene co-expression network analysis in biomedicine research. Sheng Wu Gong Cheng Xue Bao. (2017) 33:1791–801. doi: 10.13345/j.cjb.170006
14. Tian Z, He W, Tang J, Liao X, Yang Q, Wu Y, et al. Identification of important modules and biomarkers in breast cancer based on WGCNA. Onco Targets Ther. (2020) 13:6805–17. doi: 10.2147/OTT.S258439
15. Chen S, Yang D, Lei C, Li Y, Sun X, Chen M, et al. Identification of crucial genes in abdominal aortic aneurysm by WGCNA. PeerJ. (2019) 7:e7873. doi: 10.7717/peerj.7873
16. Yang J, Ren Y, Zhang D, Chen X, Huang J, Xu Y, et al. Transcriptome-based WGCNA analysis reveals regulated metabolite fluxes between floral color and scent in Narcissus tazetta flower. Int J Mol Sci. (2021) 22:8249. doi: 10.3390/ijms22158249
17. Pei G, Chen L, Zhang W. WGCNA application to proteomic and metabolomic data analysis. Methods Enzymol. (2017) 585:135–58. doi: 10.1016/bs.mie.2016.09.016
18. Niemira M, Collin F, Szalkowska A, Bielska A, Chwialkowska K, Reszec J, et al. Molecular signature of subtypes of non-small-cell lung cancer by large-scale transcriptional profiling: identification of key modules and genes by weighted gene co-expression network analysis (WGCNA). Cancers. (2019) 12:37. doi: 10.3390/cancers12010037
19. Buczynski BW, Maduekwe ET, O'Reilly MA. The role of hyperoxia in the pathogenesis of experimental BPD. Semin Perinatol. (2013) 37:69–78. doi: 10.1053/j.semperi.2013.01.002
20. Hou A, Fu J, Yang H, Zhu Y, Pan Y, Xu S, et al. Hyperoxia stimulates the transdifferentiation of type II alveolar epithelial cells in newborn rats. Am J Physiol Lung Cell Mol Physiol. (2015) 308:L861–72. doi: 10.1152/ajplung.00099.2014
21. Yang H, Fu J, Xue X, Yao L, Qiao L, Hou A, et al. Epithelial-mesenchymal transitions in bronchopulmonary dysplasia of newborn rats. Pediatr Pulmonol. (2014) 49:1112–23. doi: 10.1002/ppul.22969
22. Zhao X, Shi Y, Zhang D, Tong X, Sun Y, Xue X, et al. Autophagy inducer activates Nrf2-ARE pathway to attenuate aberrant alveolarization in neonatal rats with bronchopulmonary dysplasia. Life Sci. (2020) 252:117662. doi: 10.1016/j.lfs.2020.117662
23. Dylag AM, Haak J, Yee M, O'Reilly MA. Pulmonary mechanics and structural lung development after neonatal hyperoxia in mice. Pediatr Res. (2020) 87(7):1201–10. doi: 10.1038/s41390-019-0723-y
24. Svedenkrans J, Stoecklin B, Jones JG, Doherty DA, Pillow JJ. Physiology and predictors of impaired gas exchange in infants with bronchopulmonary dysplasia. Am J Respir Crit Care Med. (2019) 200:471–80. doi: 10.1164/rccm.201810-2037OC
25. Girardi B, Manna M, Van Klaveren S, Tomasic T, Jakopin Z, Leffler H, et al. Selective monovalent galectin-8 ligands based on 3-lactoylgalactoside. Chem Med Chem. (2022) 17:e202100514. doi: 10.1002/cmdc.202100514
26. Ely ZA, Moon JM, Sliwoski GR, Sangha AK, Shen XX, Labella AL, et al. The impact of natural selection on the evolution and function of placentally expressed galectins. Genome Biol Evol. (2019) 11:2574–92. doi: 10.1093/gbe/evz183
27. Zhai D, Li T, Ye R, Bi J, Kuang X, Shi Y, et al. LncRNA LGALS8-AS1 promotes breast cancer metastasis through miR-125b-5p/SOX12 feedback regulatory network. Front Oncol. (2021) 11:711684. doi: 10.3389/fonc.2021.711684
28. Pardo E, Carcamo C, Uribe-San Martin R, Ciampi E, Segovia-Miranda F, Curkovic-Pena C, et al. Galectin-8 as an immunosuppressor in experimental autoimmune encephalomyelitis and a target of human early prognostic antibodies in multiple sclerosis. PLoS One. (2017) 12:e0177472. doi: 10.1371/journal.pone.0177472
29. Janin N, Delattre O, Lipinski M. PCR-assisted localization of the human SRPR gene. Hum Genet. (1992) 88:583–5. doi: 10.1007/BF00219349
30. Jiang Y, Cheng Z, Mandon EC, Gilmore R. An interaction between the SRP receptor and the translocon is critical during cotranslational protein translocation. J Cell Biol. (2008) 180:1149–61. doi: 10.1083/jcb.200707196
31. Fulga TA, Sinning I, Dobberstein B, Pool MR. SRbeta coordinates signal sequence release from SRP with ribosome binding to the translocon. EMBO J. (2001) 20:2338–47. doi: 10.1093/emboj/20.9.2338
32. Akopian D, Shen K, Zhang X, Shan SO. Signal recognition particle: an essential protein-targeting machine. Annu Rev Biochem. (2013) 82:693–721. doi: 10.1146/annurev-biochem-072711-164732
33. Eyre C, Davison AN, Scott JT. Phosphoribosyl transferase activity in Normal subjects, gout patients, and children with mental retardation. J Neurol Neurosurg Psychiatry. (1971) 34:23–4. doi: 10.1136/jnnp.34.1.23
34. Welin M, Egeblad L, Johansson A, Stenmark P, Wang L, Flodin S, et al. Structural and functional studies of the human phosphoribosyltransferase domain containing protein 1. FEBS J. (2010) 277:4920–30. doi: 10.1111/j.1742-4658.2010.07897.x
35. Zhang J, Zhang H, Shi H, Wang F, Du J, Wang Y, et al. THAP11 Functions as a tumor suppressor in gastric cancer through regulating c-myc signaling pathways. Biomed Res Int. (2020) 2020:7838924. doi: 10.1155/2020/7838924
36. Jin Y, Wang B, Ke Y, Li Y, Li F, Luo H, et al. THAP11 mediates the proliferation and apoptosis of esophageal cancer cells via inhibiting ubiquitination of p53. Zhong Nan Da Xue Xue Bao Yi Xue Ban. (2019) 44:1338–43. doi: 10.11817/j.issn.1672-7347.2019.180642
37. Dehaene H, Praz V, Lhote P, Lopes M, Herr W. THAP11F80L Cobalamin disorder-associated mutation reveals Normal and pathogenic THAP11 functions in gene expression and cell proliferation. PLoS One. (2020) 15:e0224646. doi: 10.1371/journal.pone.0224646
38. Kong XZ, Yin RH, Ning HM, Zheng WW, Dong XM, Yang Y, et al. Effects of THAP11 on erythroid differentiation and megakaryocytic differentiation of K562 cells. PLoS One. (2014) 9:e91557. doi: 10.1371/journal.pone.0091557
39. Tong X, Li M, Liu N, Huang W, Xue X, Fu J. Hyperoxia induces endoplasmic reticulum stressassociated apoptosis via the IRE1α pathway in rats with bronchopulmonary dysplasia. Mol Med Rep. (2021) 23:33. doi: 10.3892/mmr.2020.11671
40. LaCanna R, Liccardo D, Zhang P, Tragesser L, Wang Y, Cao T, et al. Yap/Taz regulate alveolar regeneration and resolution of lung inflammation. J Clin Invest. (2019) 129:2107–22. doi: 10.1172/JCI125014
41. Hillmer RE, Link BA. The roles of hippo signaling transducers yap and taz in chromatin remodeling. Cells. (2019) 8:502. doi: 10.3390/cells8050502
42. Sun M, Sun Y, Feng Z, Kang X, Yang W, Wang Y, et al. New insights into the hippo/YAP pathway in idiopathic pulmonary fibrosis. Pharmacol Res. (2021) 169:105635. doi: 10.1016/j.phrs.2021.105635
43. Cai Y, Ma F, Qu L, Liu B, Xiong H, Ma Y, et al. Weighted gene co-expression network analysis of key biomarkers associated with bronchopulmonary dysplasia. Front Genet. (2020) 11:539292. doi: 10.3389/fgene.2020.539292
44. Speer CP. Pulmonary inflammation and bronchopulmonary dysplasia. J Perinatol. (2006) 26(Suppl 1):S57–62; discussion S63–4. doi: 10.1038/sj.jp.7211476
45. Walsh BK, Brooks TM, Grenier BM. Oxygen therapy in the neonatal care environment. Respir Care. (2009) 54:1193–202.19712496
46. Jobe AH, Kallapur SG. Long term consequences of oxygen therapy in the neonatal period. Semin Fetal Neonatal Med. (2010) 15:230–5. doi: 10.1016/j.siny.2010.03.007
47. Wang J, Dong W. Oxidative stress and bronchopulmonary dysplasia. Gene. (2018) 678:177–83. doi: 10.1016/j.gene.2018.08.031
48. Bancalari E, Claure N, Sosenko IR. Bronchopulmonary dysplasia: changes in pathogenesis, epidemiology and definition. Semin Neonatol. (2003) 8:63–71. doi: 10.1016/S1084-2756(02)00192-6
49. Wang SH, Tsao PN. Phenotypes of bronchopulmonary dysplasia. Int J Mol Sci. (2020) 21:6112. doi: 10.3390/ijms21176112
50. Oji-Mmuo CN, Siddaiah R, Montes DT, Pham MA, Spear D, Donnelly A, et al. Tracheal aspirate transcriptomic and miRNA signatures of extreme premature birth with bronchopulmonary dysplasia. J Perinatol. (2021) 41:551–61. doi: 10.1038/s41372-020-00868-9
Keywords: brochopulmonary dysplasia (BPD), WGCNA (Weighted gene co- expression network analyses), biomarker, hub gene, hyperoxia (oxygen)
Citation: Yu X, Liu Z, Pan Y, Cui X, Zhao X, Li D, Xue X and Fu J (2022) Co-expression network analysis for identification of novel biomarkers of bronchopulmonary dysplasia model. Front. Pediatr. 10:946747. doi: 10.3389/fped.2022.946747
Received: 18 May 2022; Accepted: 11 October 2022;
Published: 7 November 2022.
Edited by:
Shi Yuan, Children's Hospital of Chongqing Medical University, ChinaReviewed by:
Lizhong Du, Zhejiang University School of Medicine, ChinaRamesh Vidavalur, Cayuga Medical Center, United States
© 2022 Yu, Liu, Pan, Cui, Zhao, Li, Xue and Fu. This is an open-access article distributed under the terms of the Creative Commons Attribution License (CC BY). The use, distribution or reproduction in other forums is permitted, provided the original author(s) and the copyright owner(s) are credited and that the original publication in this journal is cited, in accordance with accepted academic practice. No use, distribution or reproduction is permitted which does not comply with these terms.
*Correspondence: Jianhua Fu ZnVqaEBzai1ob3NwaXRhbC5vcmc=
Specialty Section: This article was submitted to Neonatology, a section of the journal Frontiers in Pediatrics
 Xuefei Yu
 Ziyun Liu
 Yuqing Pan
 Xuewei Cui
 Danni Li
 Jianhua Fu