 Jing Yang
 Junbin Huang
 Huabin Wang
 Yong Liu1
95% of researchers rate our articles as excellent or good
Learn more about the work of our research integrity team to safeguard the quality of each article we publish.
Find out more
ORIGINAL RESEARCH article
Front. Pediatr. , 03 June 2022
Sec. Pediatric Hematology and Hematological Malignancies
Volume 10 - 2022 | https://doi.org/10.3389/fped.2022.815421
This article is part of the Research Topic Hot Topics in Pediatrics View all 50 articles
Background: Caveolae are plasma membrane subdomains of many mammalian cells that play critical roles in cellular processes, including endocytosis, signal transduction and tumorigenesis. Cavin proteins are essential for caveola formation, structure and function and are reported to be involved in various human diseases, but little is known about their expression and prognostic value in leukemia.
Methods: We performed a detailed analysis of Cavin family mRNA expression levels in different cancer tissues vs. normal tissues via the ONCOMINE, Gene Expression Profiling Interactive Analysis (GEPIA) and Cancer Cell Line Encyclopedia (CCLE) databases. Then, we used qRT-PCR and Western blotting to validate Cavin1-4 expression in 10 fresh leukemia samples. Moreover, we estimated their prognostic value in leukemia with the R programming language and GEPIA database.
Results: The expression of Cavin members is low in most human cancers, especially in leukemia. Cavin-1 and Cavin-2 are often more expressed in myeloid leukemia than lymphoblastic leukemia, but Cavin-4 has the opposite pattern. Interestingly, low expression of CAVIN1 and CAVIN4 is correlated with poorer outcome but low CAVIN2 expression is associated with a significantly better leukemia prognosis in leukemia.
Conclusion: The Cavin family showed significant expression differences between leukemia and normal cells. High Cavin-2 and low Cavin-4 levels predict poor survival and could be promising subtype diagnosis and prognosis biomarkers for leukemia.
Leukemias are a group of hematologic disorders characterized by the aberrant proliferation and include acute lymphoblastic leukemia (ALL), acute myeloid leukemia (AML), chronic lymphocytic leukemia (CLL), and chronic myeloid leukemia (CML) (1). Acute leukemia develops with a peak incidence between 1 year and 4 years but chronic leukemia is very rare in children (2). Different types of leukemia have different treatment strategies and prognosis. Identifying the potential molecular biomarkers of subtyping, prognostic in leukemia is important for selecting the best treatment strategy and improving outcomes.
Caveolae or “little cave” is a cave-shaped invagination structure of the cell plasma membrane subdomains measuring 50–100 nm in many mammalian cells. Caveolae consists of caveolin and Cavin proteins and involved in endocytosis, cholesterol homeostasis, signal transduction and tumorigenesis (3). The Cavin family of proteins is essential for caveola formation, shape, size, structure, and functions (4). The Cavin family Consists of four Cavin proteins termed Cavin1~4 and is encoded by the polymerase 1 transcript release factor (PTRF, CAVIN1), serum deprivation response protein (SDPR, CAVIN2), protein kinase c delta binding protein (PRKCDBP, CAVIN3), and muscle-related skeletal and cardiac (MURC, CAVIN4) genes. Cavin-1 was found to mainly facilitate the number of caveolae and Cavin-2 is reported to contribute to the caveolae morphology repair (5). Cavin-3 is involved in the formation of caveolae, which is affected by its LZ domain and the Caveolin-1 expression (6). Cavin-4 is a muscle-specific component of the Cavin complex and able to interact with Cavin-2, which is associated with the sarcolemmal caveolae complexes (7).
Caveolae is associated with tumor growth, invasion, metastasis, multidrug resistance and angiogenesis in cancer (8). Cavin family members are major players in caveola biology. Recently, some studies have pointed to a potential role for Cavin family members in breast cancer, lung cancer and AML (6, 9). In the majority of human cancers, Cavin-1 is downregulated along with Cavin-2, Cavin-3 and Cavin-4 compared in cancer tissues vs. control tissues (9). Cavin-1 was found to involved in cell adhesion, senescence, cell metastasis and drug resistance (10). The role of Cavin-1 in cancer is controversial as it has both tumor suppression and promotion activities in different cancers or the same type of cancer at different stages of disease progression (6). Some observations point to Cavin-1 promoting tumor migration in pancreatic cancer cells by cooperating with caveolin-1 but inhibiting invasiveness and metastasis by matrix metalloproteinase 9 (MMP-9) production, neutralizing CAV1 tumor-promoting properties in PC3 pancreatic cancer cells (11, 12). Cavin-1 was reported to enhance resistance to anticancer treatment in colorectal cancer (13) but reduce the drug resistance in prostate cancer cells (14). Cavin-2 is a membrane-bound phosphatidylserine-binding protein and a substrate for Protein Kinase C (PKC), which is a critical organizer of caveolae and regulator of angiogenesis (15, 16). Cavin-2 recruits Cavin-1 and Caveolin-1 protein to the plasma membrane inducing drug resistance by facilitating the formation of lipid rafts in MDR cell lines (12, 14). Cavin-3 suppresses tumorigenic properties, interacts with the DNA damage repair pathway, regulates cancer cell invasion or metastasis and induces drug resistance by decreasing cell sensitivity to oxaliplatin (12). The absence or downregulation of Cavin-3 with promoter hypermethylation was found in various types of human cancer, especially at late stages of cancer, which could predict a low progression-free survival rate (17, 18). There are few reports about Cavin-4 in cancers. Their roles in leukemia need further investigation and clarification.
To investigate the relationship between dysregulation of Cavins levels and the classification and prognosis of children with leukemia. In the present study, we performed a comprehensive bioinformatics analysis to evaluated the relationship of the Cavin family with clinicopathological features and patient survival in leukemia by dataset analysis. We detected the expression levels of Cavin family members in 10 children with leukemia by qRT-PCR and Western blotting. These results for leukemia typing and prediction of prognosis in children with leukemia by targeting caveolae-related genes.
Data for a total of 10 patients with childhood leukemia and 6 matched healthy donors providing peripheral blood or bone marrow were obtained from The First and Seventh Affiliated Hospital of Sun Yat-sen University from 2020 to 2021. Clinical features such as age, sex, diagnosis date, disease state and white blood cell count were obtained from hospital records (Table 1).
Table 1. The patients clinical information.
Mononuclear cells were isolated by Histopaque gradient centrifugation (density 1.077; Sigma-Aldrich, Shanghai). Contaminating red blood cells were removed by incubation in 0.8% ammonium chloride solution for 10 min. After washing, the cells were suspended in IMDM supplemented with 10% FBS.
All the cells were collected and stored in liquid nitrogen. Total RNA was isolated using RN001 (Yishan Biotechnology, Shanghai, China) and reverse transcribed into cDNA by the cDNA Synthesis Kit RT001 (Yishan Biotechnology, Shanghai, China). qPCR was performed using the SYBR Premix Ex Taq Kit (Takara, Dalian, China) according to the manufacturer's recommended protocol. The reaction procedure was 95°C for 30 s, 95°C for 5 s and 60°C for 30 s in 40 cycles. The primers for the Cavin family members were as follows: Cavin-1, 5′-GGGCCGTAGACCAGATCCA-3′ and 5′-CTTGCTCACCGTATTGCTCGT-3′; Cavin-2, 5′- CATCCGGGACAACTCACAGG-3′ and 5′-CAGCGTCTAGCATGTTCACCA-3′; Cavin-3, 5′-CACGTTCTGCTCTTCAAGGAG-3′ and 5′-TGTACCTTCTGCAATCCGGTG-3′; and Cavin-4, 5′-TAAAATCCGTCCAGATTGACCTG-3′ and 5′-GAGCACTAACTTTTCGGGTTTTC-3′. The primer sequences for GAPDH were 5′-CCCCGCTACTCCTCCTCCTAAG-3′ and 5′-TCCACGACCAGTTGTCCATTCC-3′. Relative mRNA expression was analyzed by the 2–ΔCq method.
The cells were collected and lysed in radioimmunoprecipitation assay (RIPA) buffer (1 × PBS, 1% NP-40, 0.5% sodium deoxycholate, 0.1% SDS, 0.1 mg/ml phenyl-methanesulfonyl fluoride, 20 mM sodium fluoride, 0.2 mM sodium orthovanadate, and Complete Protease Inhibitor Mix, one tablet per 50 ml). The protein concentration of each sample was quantified by BCA assay, and 30 μg of protein was separated by 12% SDS-PAGE and transferred to nitrocellulose membranes. The membranes were blocked with 5% non-fat milk for 1 h and then incubated with anti-Cavin-1 (1:1,000, Cell Signaling Tech, Beverly, MA), anti-Cavin-2 (1:500, Abcam Corp, USA) and anti-actin antibodies (1:8000, Sigma-Aldrich, Shanghai, China) overnight at 4°C. The membranes were washed and incubated with secondary antibodies for 1 h. The membranes were scanned by using an Odyssey infrared imaging system (LI-COR).
ONCOMINE (https://www.oncomine.org/), an open online cancer microarray database, was used to analyze the transcript levels of the Cavin family in different cancers. The mRNA expression levels of the Cavin family members in clinical cancer specimens were compared with those in normal controls using Student's t-test to generate the p-value.
Gene Expression Profiling Interactive Analysis (GEPIA) is a newly developed interactive web server for analyzing the RNA sequencing expression data of 715 gene expression datasets of 9,736 tumor and normal samples from The Cancer Genome Atlas (TCGA), Gene Expression Omnibus (GEO) and Genotype-Tissue Expression (GTEx) projects using a standard processing website (http://gepia.cancer-pku.cn/). GEPIA can be applied for tumor vs. normal differential expression analysis, detailed analyses according to cancer types or pathological stages, patient survival analysis, correlation analysis, multiple gene comparison and dimensionality reduction analysis (19).
BloodSpot (http://servers.binf.ku.dk/bloodspot/) is an open online malignant haematopoiesis database of gene expression profiles from FACS sorted healthy and malignant haematopoietic cells. It was used to analyze the mRNA expression of the Cavin family in different types of leukemia compared with those in healthy bone marrow using oligonucleotide microarray chips. Datasets are organized by organism of origin and disease status, and includes human healthy hematopoietic cells, human leukemia and healthy mouse hematopoietic cells.
LinkedOmics (http://www.linkedomics.orglogin.php) is a new tool in the software ecosystem for disseminating data from large-scale cancer omics projects. To reduce redundant efforts, the LinkedOmics database uses preprocessed and normalized data from the Broad TCGA Firehose and Clinical Proteomic Tumor Analysis (CPTAC) data portals and focuses on the discovery and interpretation of attribute associations, thus complementing existing cancer data portals (20).
The CCLE (https://www.broadinstitute.org/ccle) project is a collaboration between the Broad Institute, the Novartis Institutes for Biomedical Research and the Genomics Institute of the Novartis Research Foundation that can be used to conduct a detailed genetic and pharmacologic characterization of a large panel of human cancer models, develop integrated computational analyses that link distinct pharmacologic vulnerabilities to genomic patterns and translate cell line integrative genomics data into cancer patient stratification systems (21). The CCLE provides public access to genomic data analysis and visualization tools for ~1,000 kinds of cell lines. The expression of the Cavin family in cancer cell lines was verified with the CCLE database.
The statistical results were recorded as the mean ± 95% confidence intervals unless otherwise stated and analyzed using GraphPad Prism 8.0 (San Diego, CA). The non-parametric Mann-Whitney U-test was used to compare the differences between two groups. The correlation between Cavin family member expression and clinical characteristics was analyzed by the chi-square test (χ2). Survival analysis was evaluated using the Kaplan-Meier method and Cox proportional hazards model. Differences with p < 0.05 were considered statistically significant.
As shown in Figure 1B, the mRNA expression levels of Cavin family members are downregulated in most human cancers, especially in leukemia analyzed by ONCOMINE database. We further confirmed this result with the GEPIA databases (http://gepia.cancer-pku.cn/) and found that all Cavin family members are downregulated in leukemia, significantly CAVIN1 and CAVIN2 (Figure 1C). We next furtherly expanded the process of detailed annotation of preclinical human leukemia models by assessing the CCLE (https://www.broadinstitute.org/ccle) and BloodSpot (http://servers.binf.ku.dk/bloodspot/) database. We found that the expression level of both CAVIN1 and CAVIN2 in myeloid leukemia is higher than that in lymphocytic leukemia, while the expression of CAVIN4 is higher in lymphocytic leukemia. There is no difference in the expression of CAVIN3 between the two types of leukemia (Figures 1D,E).
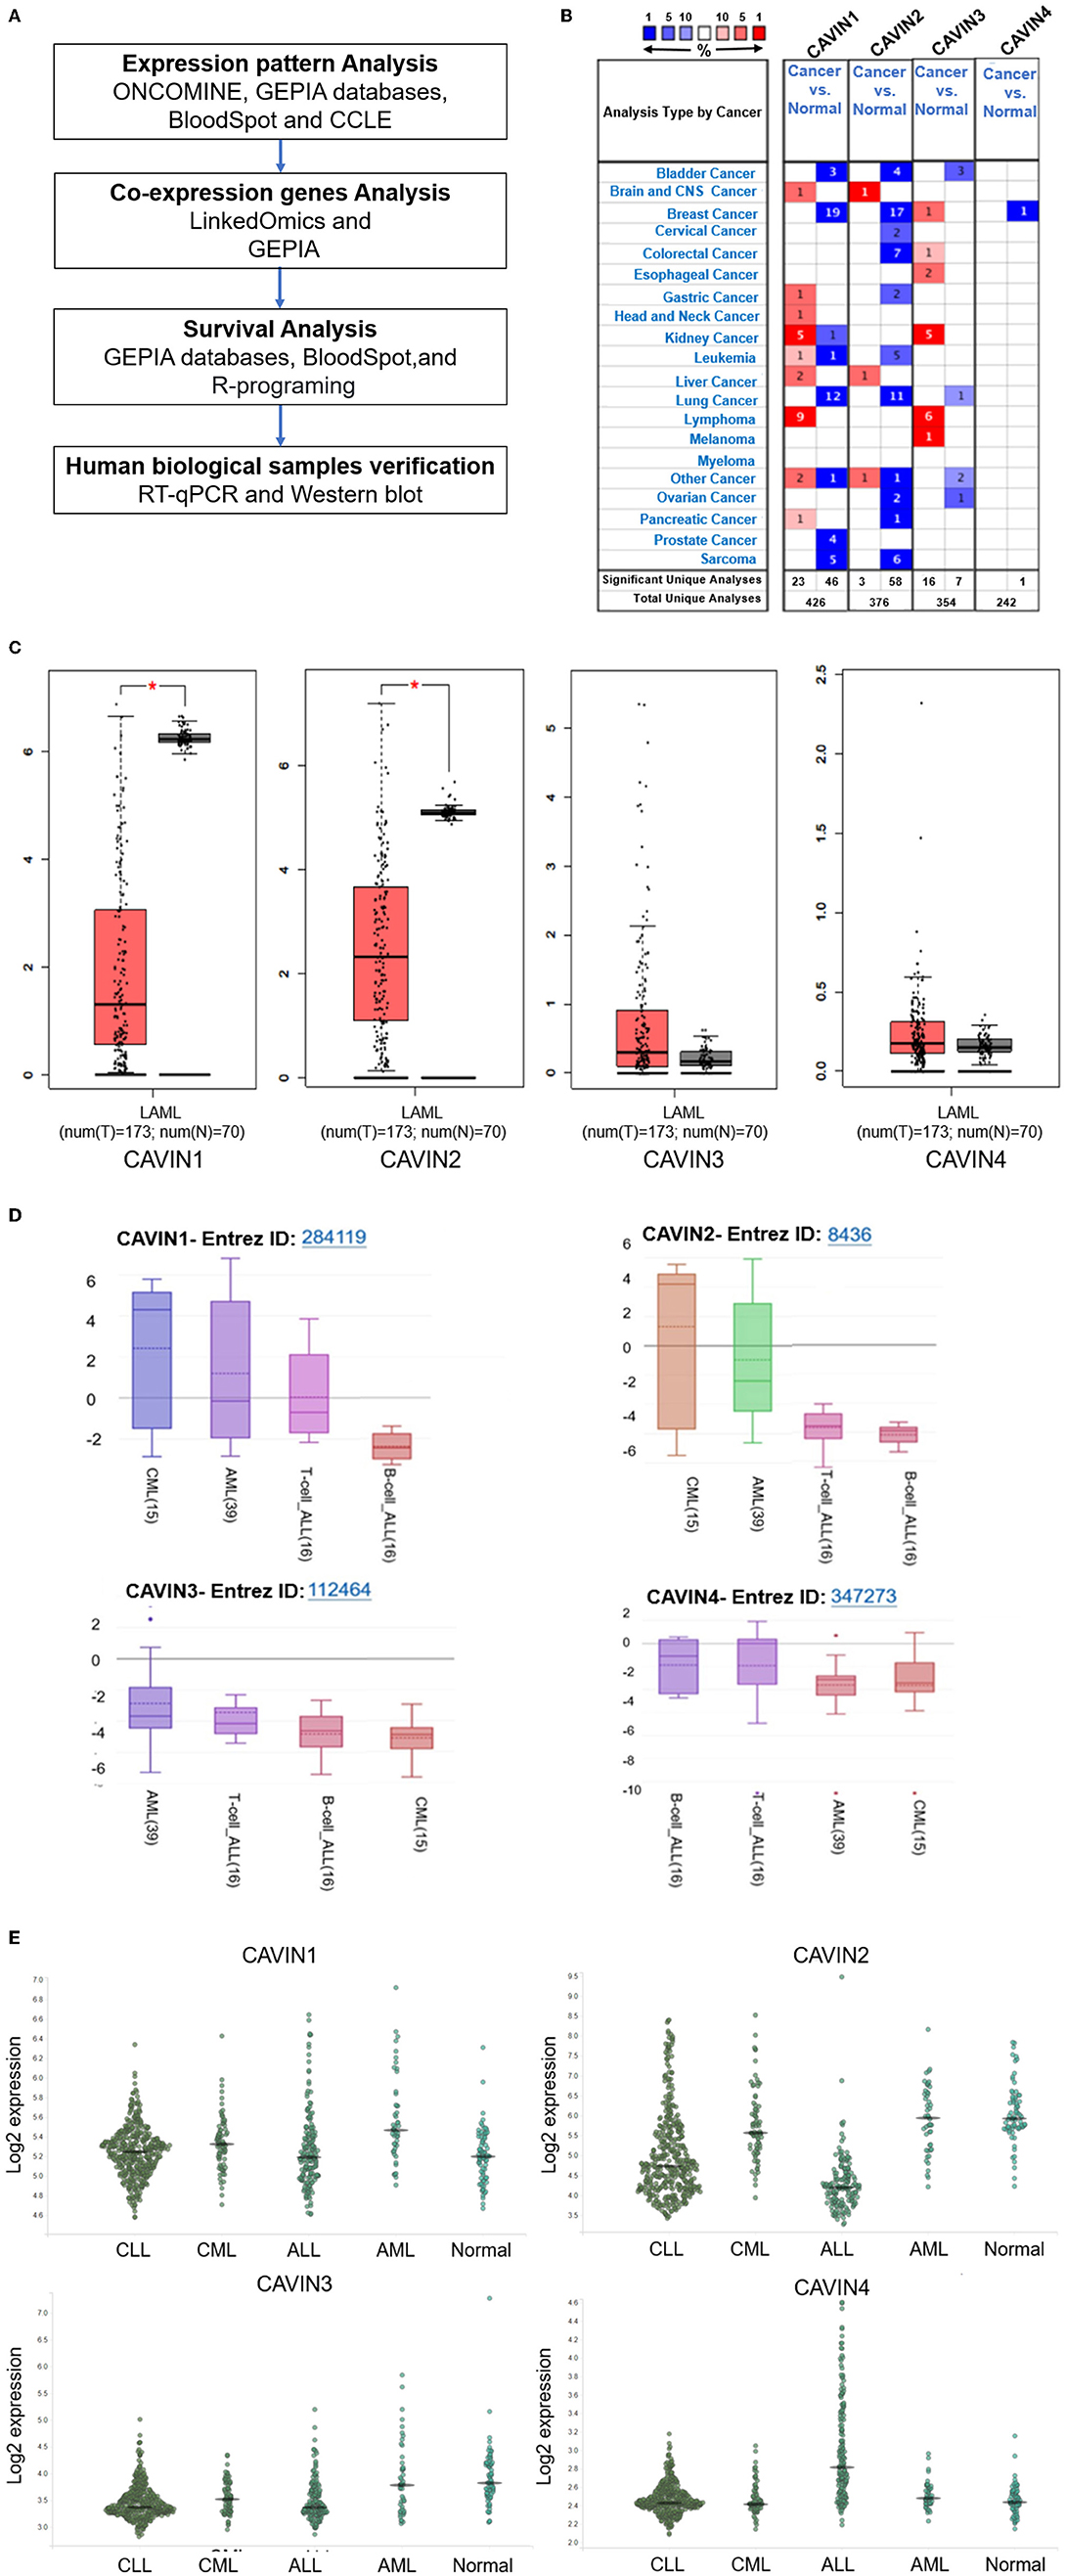
Figure 1. The expression of the Cavin family. (A) The workflow diagram of this study. (B) The transcription levels of CAVINs in different types of cancers discovered by ONCOMINE. The expression of Cavin members is under-expressed in most human cancers. The mRNA expression of CAVIN1 and CAVIN2 was significantly lower in human leukemia than that in normal cells. (C) The mRNA expression levels of Cavin family members in Acute Myeloid Leukemia (AML) detected by GEPIA. (D,E) The expression of CAVIN1-4 in different type of Leukemia Cell Lines analyzed by CCLE (D) and BloodSpot (E). CAVIN1 and CAVIN2 are higher in myeloid leukemia, while CAVIN4 expression is just the opposite in leukemia. LAML, Acute Myeloid Leukemia; CML, Chronic Myeloid Leukemia; T-ALL, T-cell Acute Lymphoblastic Leukemia; B-ALL, B-cell Acute Lymphoblastic Leukemia; CAVIN1 and CAVIN2 are often more expressed in myeloid leukemia than lymphoblastic leukemia, but CAVIN4 has the opposite pattern.
Next, we analyzed pairwise correlations among CAVIN1, CAVIN2, CAVIN3, and CAVIN4 via the LinkedOmics database and found that CAVIN1 was predominantly correlated with CAVIN2 (R = 0.3425, p < 0.05), but there was no significant correlation between other members (Figure 2A). Furthermore, we verified the results using the GEPIA dataset. Consistently, the mRNA level of CAVIN1 was positively correlated with CAVIN2 (R = 0.47, p < 0.05) but not significantly correlated with any other Cavin family members in leukemia (Figure 2B).
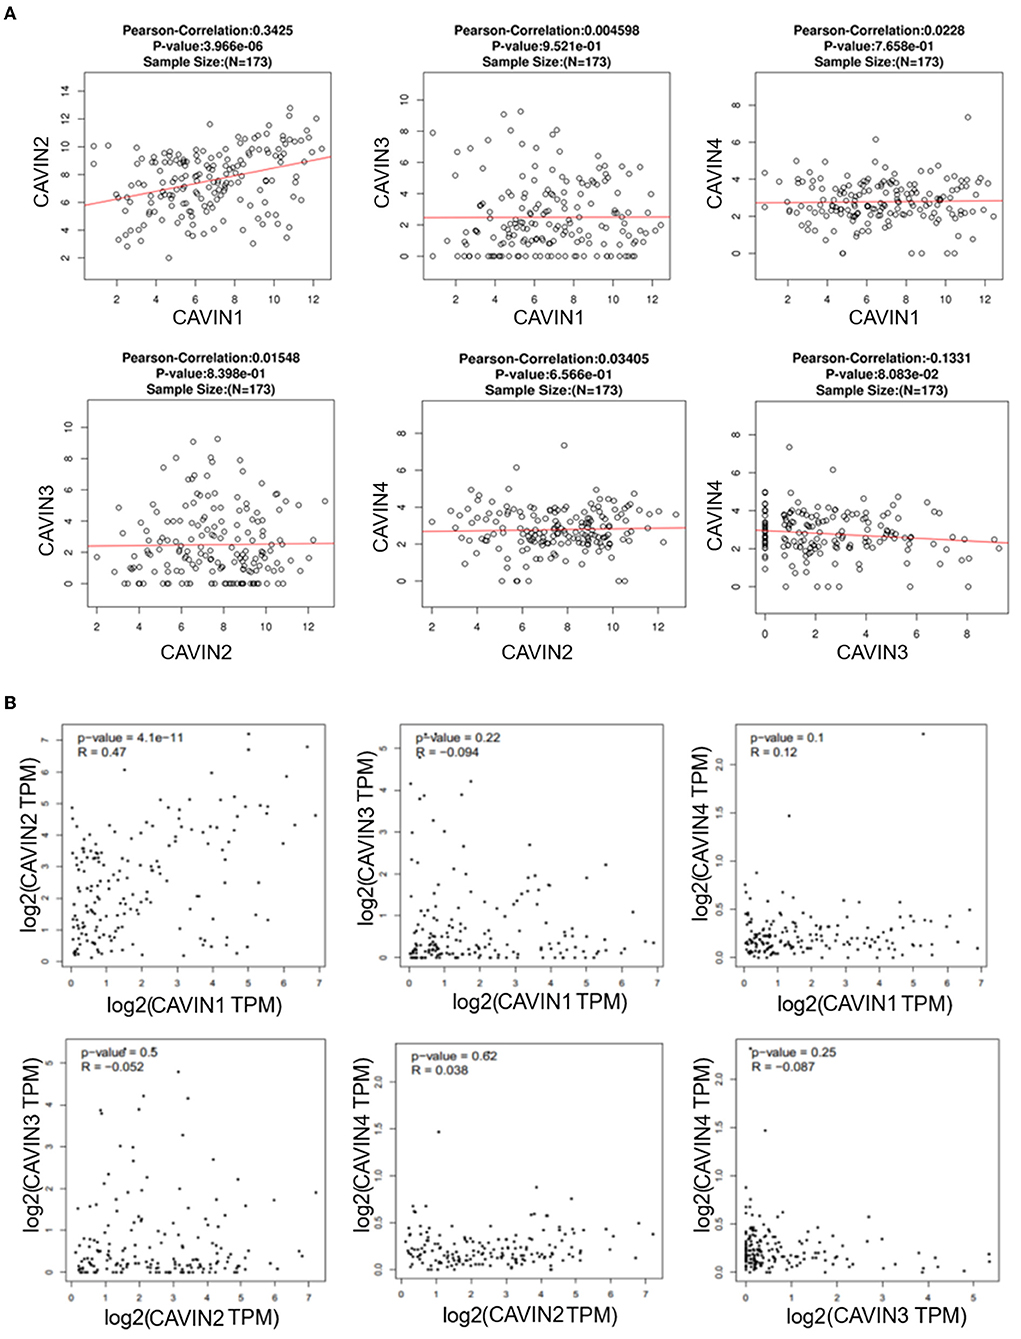
Figure 2. The correlation between Cavin family member pairs in Leukemia by LinkedOmics (A) and GEPIA (B). CAVIN1 is linearly correlated with CAVIN2, and there is no significant correlation between the remaining Cavins members.
Finally, we investigated the prognostic value of CAVIN1, CAVIN2, CAVIN3, and CAVIN4 in leukemia using the R programming language to assess data from LinkedOmics. In particular, higher CAVIN4 expression was significantly associated with better OS in leukemia (p = 0.048). However, patients with CAVIN2-overexpressing leukemia had even better survival (p = 0.017). There were no significant differences in either high or low levels of CAVIN1 and CAVIN3 in the leukemia prognostic analysis (Figure 3A). We further validated the results in the GEPIA and BloodSpot database (Figures 3B,C). We found higher expression of CAVIN2 was certainly associated with a poorer prognosis (p is equal to 0.037 and 0.0022 individually), but the expression levels of other members have no statistical correlation with the prognosis of leukemia.

Figure 3. The Prognostic value of mRNA level of Cavin family in leukemia patients. (A) Data from LinkedOmics was evaluated using the Kaplan-Meier method and Cox's proportional hazards model by R-programing. (B) The prognostic value of mRNA level of Cavin family in Leukemia patients, analyzed by GEPIA. Blue line indicates low expression, red line indicates high expression. (C) The overall survival of mRNA level of Cavin family in AML cell lines, analyzed by BloodSpot database. Green line indicates low expression, red line indicates high expression. p < 0.05 was considered as statistically significant.
Finally, the mRNA expression levels of Cavin family members in leukemia patient samples were further detected via qRT-PCR. The results show that the transcription of CAVIN1, CAVIN2 and CAVIN3 were significantly lower than in normal samples from healthy donors, and the expression of CAVIN1 in myeloid leukemia is significantly higher than that in lymphocytic leukemia (p < 0.05) (Figure 4A). In addition, we verified the Cavin-1 and Cavin-2 protein levels by Western blotting and indicated they were also lower in leukemia cells than in normal peripheral blood mononuclear cells (PBMCs) (Figure 4B).
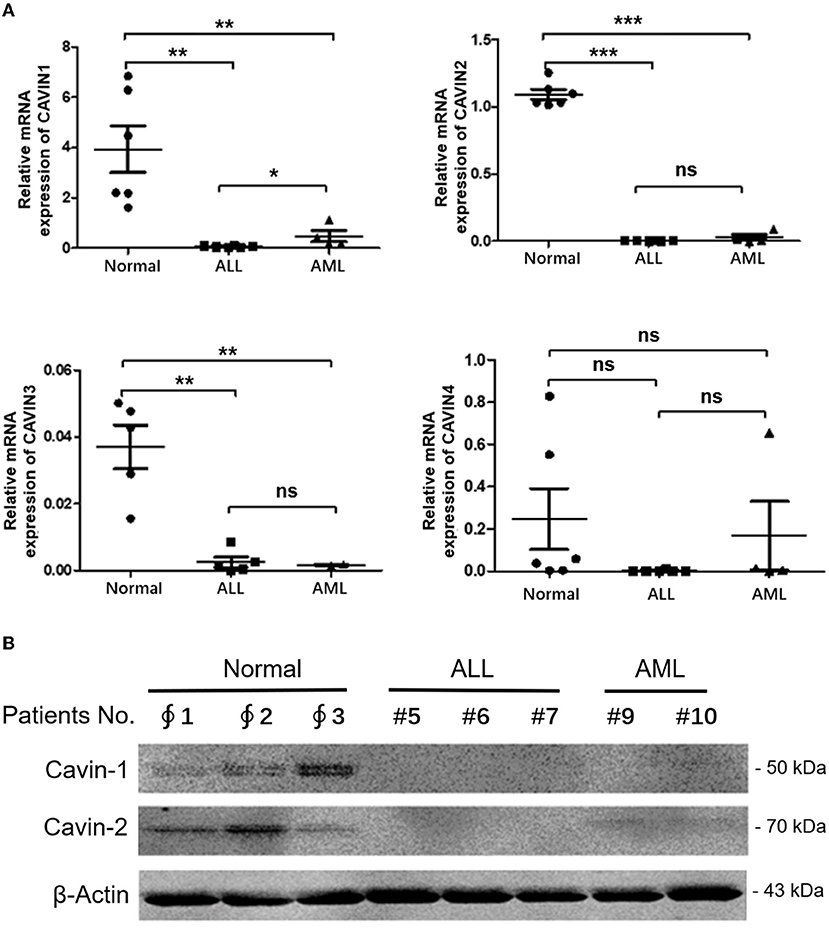
Figure 4. The transcription levels of Cavin family members in leukemia. (A) After mononuclear cells isolated and RNA extracted from peripheral blood or bone marrow of patients or health donars, the RNA levels of Cavin family members were analyzed by reverse transcription-quantitative polymerase chain reaction (qRT-PCR). Bar graphs: mean ± SEM; *, p < 0.05; **, p < 0.01; ***, p < 0.001, one-way ANOVA, post-hoc comparisons, Dunnett's test. (B) Mononuclear cells were isolated from healthy donors and patients with leukemia. Cytoplasmic and nuclear extracts were analyzed by Western blot using specific antibodies for Cavin-1, Cavin-2 and β-Actin. ∮ Normal donors; # Leukemia patients.
Recently, Cavin family members were found to be downregulated in multiple cancers and their tumor suppression properties have been confirmed via in vitro and in vivo assays (22, 23). Cavin-1 and Cavin-3 were down-regulated in breast cancer with a low progression-free survival rate (6). However, the expression level of the Cavin family in leukemia and the relationship between expression and prognosis are still not known.
In the attempt to understand the expression of the Cavin family in childhood leukemia and its implications in subtype diagnosis and prognosis. In this study, we performed a comprehensive bioinformatics analysis and validation experiments (Figure 1A), and found that the four Cavin members were lowly expressed in leukemia, especially in lymphoblastic leukemia. The expression of CAVIN1 and CAVIN2 is higher in myeloid leukemia than lymphoblastic leukemia, while CAVIN4 expression is just the opposite in leukemia. CAVIN1 and CAVIN2 complement each other with a significant linear positive correlation. CAVIN2 relatively high expression was often found in myeloid leukemia and predicted a poorer prognosis, which may be regarded as potential prognostic biomarkers, diagnostic subtype indicators and therapy targets for leukemia.
In our study, ONCOMINE and GEPIA dataset analysis revealed that the mRNA expression of Cavin family members, especially CAVIN1 and CAVIN2, was lower in human leukemia than that in normal cells, as the same as in most tumors (Figures 1B,C). Moreover, we further evaluated the expression of these four members in diverse types of human leukemia cell lines via the CCLE and BloodSpot database. As shown in Figures 1D,E, all Cavin family members were significantly downregulated in lymphoblastic leukemia except for CAVIN4. CAVIN1 and CAVIN2 are higher expressed in myeloid leukemias (including AML and CML) than that in lymphocytic leukemias (including ALL and CLL). CAVIN3 can be either overexpressed or underexpressed in myeloid leukemias and lymphoblastic leukemia. However, compared with lymphocytic leukemia, CAVIN4 expression is relatively higher in lymphocytic leukemia than that in myeloid leukemia, especially in acute lymphoblastic leukemia. Then we analyzed the correlation between Cavin family member pairs in Leukemia by LinkedOmics and GEPIA database. We found the mRNA expression levels of CAVIN1 and CAVIN2 complement each other with a significant positive correlation (R is 0.3425 and 0.47 individually) (Figure 2).
To investigate the inner linkage between the phenotype and prognosis of leukemia, we also analyzed the prognostic value of the mRNA levels of Cavin family members in patients with leukemia by the R programming language and data from LinkedOmics. In particular, overexpressed CAVIN4 was associated with a better overall survival (OS), as we expected, but there was obviously better OS with high vs. low expression of CAVIN2 in leukemia (p = 0.017) by R-programing in our report (Figure 3A). We then used the GEPIA and BloodSpot database to validate the unexpected result and found that high CAVIN2 expression was significantly associated with poorer OS in leukemia (p is 0.037 and 0.022 individually), but the trend was not significant for CAVIN1, CAVIN3 and CAVIN4 (Figures 3B,C).
In order to explain this strange phenomenon, we reviewed the relevant literature. Cavin-2 is critical organizer of caveolae and plays a critical role in tumor cell proliferation, migration and invasion (22). Cavin-2 downregulation in cancer tissues vs. control tissues has been reported in several malignant tumors, such as oral squamous cell carcinoma, and is associated with tumor progression (24). Cavin-2 is an essential factor for angiogenesis by increasing the production of nitric oxide (NO) in endothelial cells (15). However, ectopic Cavin-1 overexpression inhibits tumor growth and metastasis due to antiangiogenesis- and antilymphangiogenesis-regulating functions as is reported in prostate cancer (25). Several studies show that high levels of Cavin-2 facilitate caveolin-1 recruitment and colocalization. Caveolin-1 is the major essential coat protein for caveolae formation and is implicated in tumoral growth and angiogenesis. Caveolin-1 is expressed at high levels in leukemia cells, such as AML, CML, adult T-cell leukemia (ATL) and chronic lymphocytic leukemia (CLL) cells, compared with normal PBMCs (26–29). Previous studies have shown that caveolin-1 and multidrug resistance-1 (MDR-1) gene expression levels are positively correlated in relapsed leukemia (30). MDR-1 produces the membrane protein P-glycoprotein (P-gp) and acts as an efflux pump for cytotoxic drugs (30). It has been shown that P-gp is localized to caveolae and coimmunoprecipitates with caveolin-1 (30). Moreover, the coordinated overexpression of Cavin-2 and caveolin-1 leads to compartmentation into caveolae, which prevents epidermal growth factor receptor (EGFR) degradation and simultaneously enables intracellular EGFR kinase-linked signaling (28, 29). All in all, higher Cavin-2 may promote the resistance and progression of leukemia by regulating cell differentiation, proliferation, angiogenesis and MDR-1 or EGFR expression. As we know, the prognosis of ALL is better than that of AML, and the prognosis of B-ALL is generally better than that of T-ALL. In the present study, altered expression of Cavin family members, especially high mRNA levels of CAVIN2 and low levels of CAVIN4, indicating a poor outcome, were found in AML, CML and T-ALL, as shown in Figure 1D. We might hypothesize that the Cavin family, especially CAVIN2 and CAVIN4, could be potential markers of the clinicopathological parameters of patients with different types of leukemia.
However, there are some limitations of the present study. On the one hand, the sample size was small, and all patients were from two clinical pediatric centers, which means it is hard to eliminate selection bias. On the other hand, the biological functions and resistance mechanisms of the Cavin family in leukemia remain unknown. Therefore, additional investigations will be needed to investigate this issue.
Raw data of published western blot and gene expression arrays of all samples are available in additional accessory files (Supplementary Material). And the 5 datasets used in this study are: GEPIA (http://gepia.cancer-pku.cn); ONCOMINE (https://www.oncomine.org/); CCLE (https://www.broadinstitute.org/ccle); LinkedOmics (http://www.linkedomics.org/login.php); and BloodSpot (http://servers.binf.ku.dk/bloodspot/). Any additional information can be provided upon request.
The studies involving human participants were reviewed and approved by the Sun Yat-sen University Ethics Committee. Written informed consent to participate in this study was provided by the participants' legal guardian/next of kin.
JY and JH designed the research. JY, YT, CL, and HW collected the data. JH and YT finished the qRT-PCR and Western blotting. JY, JH, and HW conducted the statistical analysis. JY, QZ, and JH wrote the manuscript. JH and CC contributed to the review and editing of the manuscript. CC acquired the funding to support our research. All authors have read and approved the manuscript.
This research was funded by the Sanming Project of Medicine in Shenzhen (SZSM202011004) and the National Natural Science Foundation of China (8157010694).
The authors declare that the research was conducted in the absence of any commercial or financial relationships that could be construed as a potential conflict of interest.
All claims expressed in this article are solely those of the authors and do not necessarily represent those of their affiliated organizations, or those of the publisher, the editors and the reviewers. Any product that may be evaluated in this article, or claim that may be made by its manufacturer, is not guaranteed or endorsed by the publisher.
We are grateful to the open access websites of the ONCOMINE, CCLE, GEPIA, and LinkedOmics databases for providing clinical data and gene expression information. We thank American Journal Experts (AJE) for their professional English language editing services.
The Supplementary Material for this article can be found online at: https://www.frontiersin.org/articles/10.3389/fped.2022.815421/full#supplementary-material
AML, acute myeloid leukemia; ATL, adult T-cell leukemia; ALL, Acute lymphoblastic leukemia; CART, chimeric antigen receptor T cells; CLL, chronic lymphocytic leukemia; CCLE, Cancer Cell Line Encyclopedia; CGL, congenital generalized lipodystrophy; EGFR, epidermal growth factor receptor; MDR-1, multidrug resistance-1MMP-9 matrix metalloproteinase 9; MURC, muscle-related skeletal and cardiac; OS, overall survival; PBMCs, peripheral blood mononuclear cells; P-gp, P-glycoprotein; PTRF, polymerase 1 transcript release factor; PRKCDBP, protein kinase c delta binding protein; qRT-PCR, quantitative real-time Polymerase Chain Reaction; RIPA, radioimmunoprecipitation assay; SDPR, serum deprivation response protein; PKC, Protein Kinase C.
2. Juliusson G, Lazarevic V, Hörstedt AS, Hagberg O, Höglund M. Swedish Acute Leukemia Registry Group. Acute myeloid leukemia in the real world: why population-based registries are needed. Blood. (2012) 119:3890–9. doi: 10.1182/blood-2011-12-379008
3. Anderson RG. The caveolae membrane system. Annu Rev Biochem. (1998) 67:199–225. doi: 10.1146/annurev.biochem.67.1.199
4. Kovtun O, Tillu VA, Jung W, Leneva N, Ariotti N, Chaudhary N, et al. Structural insights into the organization of the cavin membrane coat complex. Dev Cell. (2014) 31:405–19. doi: 10.1016/j.devcel.2014.10.002
5. Hansen CG, Nichols BJ. Exploring the caves: cavins, caveolins and caveolae. Trends Cell Biol. (2010) 20:177–86. doi: 10.1016/j.tcb.2010.01.005
6. Bai L, Deng X, Li Q, Wang M, An W, Deli A, et al. Down-regulation of the cavin family proteins in breast cancer. J Cell Biochem. (2012) 113:322–8. doi: 10.1002/jcb.23358
7. Ogata T, Ueyama T, Isodono K, Tagawa M, Takehara N, Kawashima T, et al. MURC, a muscle-restricted coiled-coil protein that modulates the Rho/ROCK pathway, induces cardiac dysfunction and conduction disturbance. Mol Cell Biol. (2008) 28:3424–36. doi: 10.1128/MCB.02186-07
8. Casalou C, Fragoso R, Nunes JF, Dias S. VEGF/PLGF induces leukemia cell migration via P38/ERK1/2 kinase pathway, resulting in Rho GTPases activation and caveolae formation. Leukemia. (2007) 21:1590–4. doi: 10.1038/sj.leu.2404668
9. Nassar ZD, Parat MO. Cavin family: new players in the biology of caveolae. Int Rev Cell Mol Biol. (2015) 320:235–305. doi: 10.1016/bs.ircmb.2015.07.009
10. Hernandez VJ, Weng J, Ly P, Pompey S, Dong H, Mishra L, et al. Cavin-3 dictates the balance between ERK and Akt signaling. Elife. (2013) 2:e00905. doi: 10.7554/eLife.00905.015
11. Liu L, Xu HX, Wang WQ, Wu CT, Chen T, Qin Y, et al. Cavin-1 is essential for the tumor-promoting effect of caveolin-1 and enhances its prognostic potency in pancreatic cancer. Oncogene. (2014) 33:2728–36. doi: 10.1038/onc.2013.223
12. Bastiani M, Liu L, Hill MM, Jedrychowski MP, Nixon SJ, Lo HP, et al. MURC/Cavin-4 and cavin family members form tissue-specific caveolar complexes. J Cell Biol. (2009) 185:1259–73. doi: 10.1083/jcb.200903053
13. Liu L, Pilch PF. A critical role of cavin (polymerase I and transcript release factor) in caveolae formation and organization. J Biol Chem. (2008) 283:4314–22. doi: 10.1074/jbc.M707890200
14. Gould ML, Williams G, Nicholson HD. Changes in caveolae, caveolin, and polymerase 1 and transcript release factor (PTRF) expression in prostate cancer progression. Prostate. (2010) 70:1609–21. doi: 10.1002/pros.21195
15. Boopathy GTK, Kulkarni M, Ho SY, Boey A, Chua EWM, Barathi VA, et al. Cavin-2 regulates the activity and stability of endothelial nitric-oxide synthase (eNOS) in angiogenesis. J Biol Chem. (2017) 292:17760–76. doi: 10.1074/jbc.M117.794743
16. Toufaily C, Charfi C, Annabi B, Annabi B. A role for the Cavin-3/matrix metalloproteinase-9 signaling axis in the regulation of PMA-activated human HT1080 fibrosarcoma cell neoplastic phenotype. Cancer Growth Metastasis. (2014) 7:43– 51. doi: 10.4137/CGM.S18581
17. Moutinho C, Martinez-Cardús A, Santos C, Navarro-Pérez V, Martínez-Balibrea E, Musulen E, et al. Epigenetic inactivation of the BRCA1 interactor SRBC and resistance to oxaliplatin in colorectal cancer. J Natl Cancer Inst. (2014) 106:djt322. doi: 10.1093/jnci/djt322
18. Xu XL, Wu LC, Du F, Davis A, Peyton M, Tomizawa Y, et al. Inactivation of human SRBC, located within the 11p15.5-p15.4 tumor suppressor region, in breast and lung cancers. Cancer Res. (2001) 61:7943–9.
19. Tang Z, Li C, Kang B, Gao G, Li C, Zhang Z. GEPIA: a web server for cancer and normal gene expression profiling and interactive analyses. Nucleic Acids Res. (2017) 45:W98–102. doi: 10.1093/nar/gkx247
20. Vasaikar SV, Straub P, Wang J, Zhang B. LinkedOmics: analyzing multi-omics data within and across 32 cancer types. Nucleic Acids Res. (2018) 46:D956–63. doi: 10.1093/nar/gkx1090
21. Barretina J, Caponigro G, Stransky N, Venkatesan K, Margolin AA, Kim S, et al. The cancer cell line encyclopedia enables predictive modelling of anticancer drug sensitivity. Nature. (2012) 483:603–7. doi: 10.1038/nature11003
22. Gupta R, Toufaily C, Annabi B. Caveolin and cavin family members: dual roles in cancer. Biochimie. (2014) 107 Pt B:188–202. doi: 10.1016/j.biochi.2014.09.010
23. Bai L, Deng X, Li J, Wang M, Li Q, An W, et al. Regulation of cellular senescence by the essential caveolar component PTRF/Cavin-1. Cell Res. (2011) 21:1088–101. doi: 10.1038/cr.2011.56
24. Unozawa M, Kasamatsu A, Higo M, Fukumoto C, Koyama T, Sakazume T, et al. Cavin-2 in oral cancer: a potential predictor for tumor progression. Mol Carcinog. (2016) 55:1037–47. doi: 10.1002/mc.22347
25. Nassar ZD, Moon H, Duong T, Neo L, Hill MM, Francois M, et al. PTRF/Cavin-1 decreases prostate cancer angiogenesis and lymphangiogenesis. Oncotarget. (2013) 4:1844–55. doi: 10.18632/oncotarget.1300
26. Shi D, Liu Y, Xi R, Zou W, Wu L, Zhang Z, et al. Caveolin-1 contributes to realgar nanoparticle therapy in human chronic myelogenous leukemia K562 cells. Int J Nanomedicine. (2016) 11:5823–35. doi: 10.2147/IJN.S115158
27. Sawada S, Ishikawa C, Tanji H, Nakachi S, Senba M, Okudaira T, et al. Overexpression of caveolin-1 in adult T-cell leukemia. Blood. (2010) 115:2220–30. doi: 10.1182/blood-2009-08-240044
28. Vangapandu HV, Chen H, Wierda WG, Keating MJ, Korkut A, Gandhi V. Proteomics profiling identifies induction of caveolin-1 in chronic lymphocytic leukemia cells by bone marrow stromal cells. Leuk Lymphoma. (2018) 59:1427–38. doi: 10.1080/10428194.2017.1376747
29. Wang CH, Lai YL, Chang WS, Wu KH, Lane HY, Chiu CF, et al. Significant association of caveolin-1 single nucleotide polymorphisms with childhood leukemia in Taiwan. Cancer Genomics Proteomics. (2013) 10:75–9.
Keywords: Cavin family, childhood leukemia, diagnosis, prognosis, implications
Citation: Yang J, Huang J, Wang H, Liu Y, Tang Y, Lin C, Zhou Q and Chen C (2022) Expression of the Cavin Family in Childhood Leukemia and Its Implications in Subtype Diagnosis and Prognosis Evaluation. Front. Pediatr. 10:815421. doi: 10.3389/fped.2022.815421
Received: 15 November 2021; Accepted: 04 May 2022;
Published: 03 June 2022.
Edited by:
Seth Corey, Cleveland Clinic, United StatesReviewed by:
Vera Binder, LMU Munich University Hospital, GermanyCopyright © 2022 Yang, Huang, Wang, Liu, Tang, Lin, Zhou and Chen. This is an open-access article distributed under the terms of the Creative Commons Attribution License (CC BY). The use, distribution or reproduction in other forums is permitted, provided the original author(s) and the copyright owner(s) are credited and that the original publication in this journal is cited, in accordance with accepted academic practice. No use, distribution or reproduction is permitted which does not comply with these terms.
*Correspondence: Chun Chen, Y2hlbmNodW42OUAxMjYuY29t
†These authors have contributed equally to this work
Disclaimer: All claims expressed in this article are solely those of the authors and do not necessarily represent those of their affiliated organizations, or those of the publisher, the editors and the reviewers. Any product that may be evaluated in this article or claim that may be made by its manufacturer is not guaranteed or endorsed by the publisher.
Research integrity at Frontiers
Learn more about the work of our research integrity team to safeguard the quality of each article we publish.