 Jie Liu1
 Richard Evans2
 Yanjun Wang3Beibei Hu1
 Yan Tong1Shaoqiong Li4Zhiqiang Tian1Jing Li1Cuihua Zhang5Lu He1*
 Jianzhong Zheng1*
- 1School of Public Health, Shanxi Medical University, Taiyuan, China
- 2College of Engineering, Design and Physical Sciences, Brunel University London, London, United Kingdom
- 3Service Center of Shanxi Medical and Health Institutions, Taiyuan, China
- 4Center for Information, Chinese Center for Disease Control and Prevention, Beijing, China
- 5Physiatry Department, Hospital of Traditional Chinese Medicine, Taiyuan, China
Background: Visual impairments related to non-correctable vision loss, including blindness and low vision, have been consistently shown to lower a person's health-related quality of life. This study assessed the reliability, validity, and discrimination of the Quality of Life Scale for Children with Visual Impairments (QOLS-CVI) in China.
Methods: The Pediatric Quality of Life Inventory™ 4.0 and World Health Organization Quality of Life-Disability Scale for physical disability were selected to define conceptual frameworks and item libraries based on relevant existing studies. According to two rounds of expert consultations and group discussions, some items were modified, and the draft scale was developed. Two item selection processes based on classical test theory and item response theory were used to conduct a preliminary survey and a formal survey in special schools in Shanxi and Hebei Provinces. Finally, the reliability and validity of the quality of life scale for visually impaired children in China were verified.
Results: The final QOLS-CVI consisted of 38 items, 10 subdomains, and 6 domains. Reliability was verified by Cronbach's alpha coefficient, split-half reliability, and test-retest reliability (Cronbach's alpha for the full scale, 0.841; split-half reliability, 0.629; and test–retest reliability, 0.888). The validity results showed that the multidimensional scale met expectations: exploratory factor analysis and confirmatory factor analysis indicated good fitting models for children with visual impairments.
Conclusions: The QOLS-CVI was determined to be reliable and valid and to have strong feasibility and effectiveness. This scale can be used as an evaluation tool to study the QOL and social-participation ability of children with visual impairments.
Introduction
In the Sixth National Population Census, conducted in November 2010 by the National Bureau of Statistics of the People's Republic of China, the number of citizens with disabilities was ~85.02 million, representing 6.34% of China's 1.33 billion population. Of these, individuals with visual impairments accounted for 12.63 million (14.86%), with 494,000 of these being children aged 0–14 years (1).
Presently, for visually impaired children in China, clinical medicine mainly focuses on diagnosing the degree and cause of visual disability, and great achievements have been made, enabling appropriate remedy of the defects of visually impaired children with the help of medical equipment. However, studies on the special psychological and cognitive development characteristics, social communication ability, and early rehabilitation assessment of visually impaired children are still few (2). In terms of schooling, it is difficult to find suitable schools for the blind and most of them are enrolled in regular school classes. Although the government is paying more attention to visually impaired children, for example, the government proposed an early education and rehabilitation intervention for children in the “Expanded Core Curriculum (ECC)” as early as possible, and put forward the concept of integrated education and relevant rehabilitation countermeasures, among others. However, several problems exist regarding the quality of life of visually impaired children (3). For example, the concept of ECC occurring in ordinary schools is worse than when it occurs in the blind schools. However, there is a gap in the entire educational teaching level in the blind schools (4). Hence, there are still several problems to be addressed. In terms of employment opportunities, the visually impaired face huge challenges, including low employment rate, large gap between employment structure between disabled and non-disabled persons, poor quality of life, and low economic income (5). These problems lead to poor quality of life for the visually impaired children in China. Therefore, attention should be paid to the quality of life of visually impaired children by the society, and the degree of physical, psychological, and social adaptation of disabled children should be comprehensively evaluated.
The core goal of the quality-of-life evaluation is to develop an appropriate scale. Currently, visual scales are widely used in clinical settings, and in studies in foreign countries and China, these include the 9-SF (6–8), Low Vision Quality of Life Questionnaire (LVQOL) (7), Visual Function Index-14 (VF-14) (8), Chinese version of HLVQOL (9), and Chinese version of VF-14 (10). However, these scales are used to assess the visual function of adults and are not specific for children. In recent years, a number of visual scales have been developed internationally for children. For example, the Child Visual Function Questionnaire (11) is used to measure the vision-related quality of life of children aged <7 years with visual impairment (answers by proxy), mainly to evaluate the effect of visual impairment on the personal and social behaviors of children, family, and parents, and their attitudes toward treatment. Prasad Low Vision Visual Function Scales I and II (LVP-FVQ I and II) is the first self-reported questionnaire developed in India (developing country) for children and adolescents (aged 8–18 years) to evaluate visual functional level (12, 13). However, Rasch analysis of LVP-FVQ I showed that the measurement accuracy of the scale items was lower than the acceptable level, leading to the scale's poor resolution of participants' different visual abilities and the lack of evaluation of child-related psychological characteristics. The Impact of Vision Impairment in Children (14) is used to evaluate the vision-related quality of life of children and adolescents (aged 8–18 years) with visual impairment. The scale focuses on the evaluation of daily life activities of children and adolescents. Moreover, visual-related patient-reported outcome measure has been developed rapidly in foreign countries, and there are more than 10 scales used to evaluate specific ophthalmic diseases in children (15). For example, the Child Amblyopia Treatment Questionnaire is used to evaluate the quality of life of children with amblyopia (16). In China, studies on QOL scales related to children's vision are still in their early stages. Some independently developed scales are applied to the evaluation of children's vision-related quality of life, but they are all limited to a certain eye disease and lack universality for children (17). Because of the strong cultural dependence of quality of life, foreign scales are not suitable for the Chinese context in many aspects. Thus, it is urgent to develop a more appropriate quality of life scale for children and adolescents in the Chinese context.
In light of this, this study aimed to develop a scale for children with visual impairments (Quality of Life Scale for Children with Visual Impairments [QOLS-CVI]) (see Supplementary Material), which can measure the QOL of children with disabilities in China, and evaluate the reliability and validity of the proposed scale.
Methods
The Development of the Quality of Life Scale for Children With Visual Impairments
Phase 1: Establishment of the Conceptual Framework and Items
(1) Establishing the scale framework: Through core group discussions, considering the particularity of the population served by the scale, the Chinese version of the Pediatric Quality of Life Inventory™ 4.0 (18) and Chinese version of the World Health Organization Quality of Life-Disability Scale for physical disability (19), which have high reliability and validity for measuring the of quality of life of children and disabled persons, respectively, were selected. Based on these well-established international scales, we determined the six domains system through adjustment and modification.
(2) Establishment of the scale items: The dimensions and items were sorted and analyzed by the research team, and items with the same meaning were integrated and checked for missing information to gradually form the 42 second-level items, which were screened through two rounds of the Delphi method. Moreover, 26 experts in the field of quality-of-life assessment for visually impaired children were included in this survey. The expert opinions were relatively consistent, and the results were highly reliable; after two rounds of modification, deletion, and addition, the scale comprised 41 items and 6 domains.
(3) Scoring of the items: All indicators were reflected against a five-point Likert scale, in which 5 represents “never,” 4 “occasionally,” 3 “sometimes,” 2 “often,” and 1 “always.” These were recorded as 5, 4, 3, 2, and 1 points, respectively. Negative items were recoded as five minus the original score (20).
Phase 2: The Final Scale Was Determined by Screening of the Items
In the creation of QOLS-CVI, two item selection processes and five methods of item selection were used, all of which were based on the classical test theory (CTT). The item response theory (IRT) was used as the fifth method. The IRT, also known as potential trait theory, is used to guide test preparation and selection of items. The IRT assumes that a participant has a “potential trait,” which is a concept of the participant's response to test answers (21). If an item was retained by three or more methods, we retained it. The practical significance of an item was considered before deletion. If it was meaningful, the item was kept on hold while it was sifted through a formal investigation. The following statistical analyses were performed to either retain or delete an item:
The Cronbach alpha for the total scale was 0.868, and the Cronbach alpha for the deleted items is shown in Table 1. The exclusion of one item (item number DIS-GM10) from the original 41-item scale depended on the Cronbach's alpha. If the value of the deleted items is greater than the Cronbach alpha for the total scale, then the items should be primarily adjusted (23).
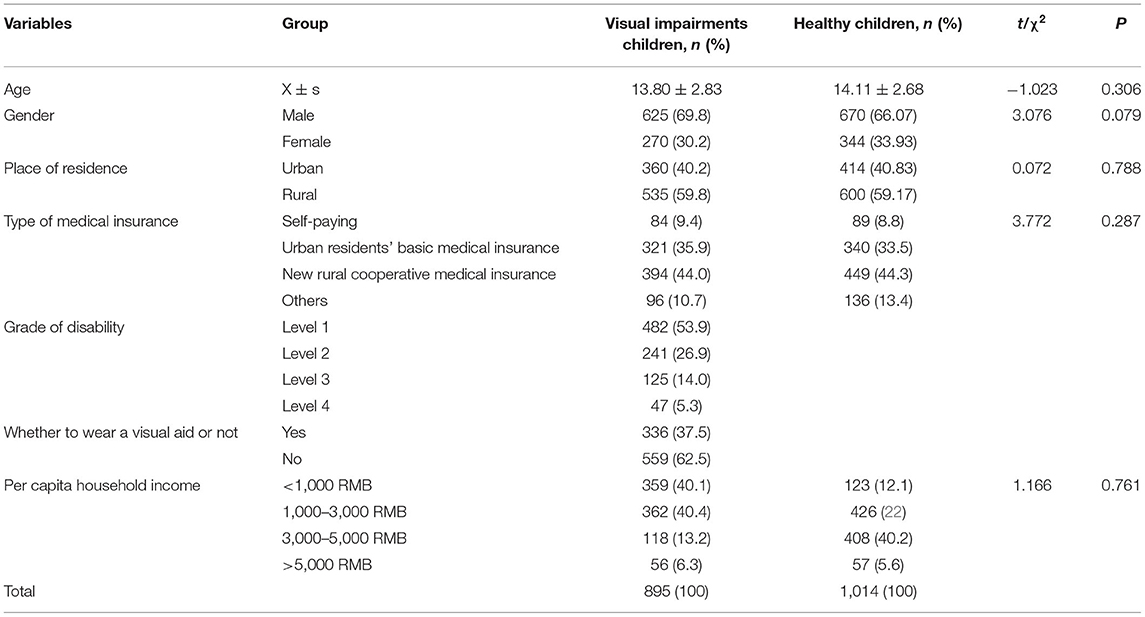
Table 1. Comparison of demographic characteristics between visually impared and healthy children.
The corrected item-total correlation (CITC), which is the correlation of an item with the scale omitting this item, was calculated for each item, and a CITC larger than 0.20 was deemed acceptable (24).
We deleted items with factor loadings that were low (<0.4) or close to the other factors in the exploratory factor analysis (EFA) (25).
When the standard deviation (SD) of an item was ≤ 1, the corresponding item was deleted (26).
In Samejima's graded response model, the practical values of the item parameters for deletion were as follows: item discrimination parameter (a) <0.4 or difficulty parameter (b) (−3, 3) (27).
Phase 3: Evaluation of the QOLS-CVI
The properties of the final version of the QOLS-CVI were assessed using data from a formal investigation.
(1) Evaluation of reliability: Split-half reliability was used to test the consistency of the scale across its items (28). Then, test–retest reliability was conducted, which reflects the stability and consistency of a scale across time (29). The Cronbach's alpha coefficient was then used to reflect the consistency and stability of items on the scale. A Cronbach's alpha coefficient of over 0.8 generally indicates excellence, and a Cronbach's alpha coefficient between 0.6 and 0.8 indicates good internal consistency (30).
(2) Evaluation of validity: The relevant literature and experts were consulted in establishing content validity, which represents how well the items captured the concept of interest (31). To verify the construct validity, confirmatory factor analysis was performed to examine the structure of the QOL scale for children with visual impairments. The standardized factor loadings for an item should be > 0.5 (32). To measure the difference between the groups, a t-test was conducted with P < 0.05 set for statistical significance and in consideration of the discriminant validity of the test (32).
Definitions
Visual impairment, also known as visual disability, refers to a certain degree of loss of visual function in individuals because of low visual acuity or visual field damage. Hence, these individuals do not achieve normal vision, thus affecting their daily life (33). The China's Federation of Persons with Disabilities defines four levels of visual disability as the standard for assessing people with disabilities. The first- and second-degree disabilities are blindness, and the third- and fourth-degree disabilities are low vision (34). The following are the International Classification of Diseases, 11th Revision [ICD-11, published by the World Health Organization (WHO)] definitions: far visual impairment, defined as visual acuity in daily life in the better of both eyes, were categporized as <0.5 (mild), <0.3 (moderate), <0.1 (severe) visual impairments, and <0.05 or central visual field <10° (blindness) (35). In 1987, China Disabled Persons' Federation formulated China's standard for visual impairment with reference to the WHO as follows: the best corrected visual acuity of the better of both eyes <0.3 with ≥0.05 and <0.05 considered as low vision and blindness, respectively. If the radius of the field of vision is <10°, no matter what the vision is, it is considered as blindness. For ease of use, we adopted the Chinese standard for visual impairment (34). The grades of visual disabilities are shown in Supplementary Table 1.
Research Participants
A cluster sampling method was used to collect the data in this cross-sectional study from visually impaired children (and their guardians) and adolescents studying at six special educational schools in Shanxi Province and three special educational schools in Hebei Province. Ten schools in Shanxi and Hebei Provinces (five each are located in the central and suburban areas, respectively) were selected by cluster stratified sampling. Students in grades 1–6 at the primary school and grades 1–2 at the middle and high schools were selected for investigation. School leaders and teachers were consulted throughout the study to ensure minimal disruption to student learning. Data were gathered through two rounds of surveys administered by the teachers and guardians of the students, with consent from the school leaders. The study was conducted in accordance with the Declaration of Helsinki. A total of 226 children and adolescents aged over 8 years with visual impairment were included in the pre-survey. A total of 895 visually impaired children and adolescents were included in the formal investigation. Healthy students from local normal schools were selected for the survey, and 1,014 completed questionnaires were included in the analysis.
The inclusion criteria for this study were as follows: (1) visually impaired children and their guardians meeting the criteria for the diagnosis and classification of visual impairment, (2) the investigated guardians had been living with the visually impaired child for a long time (over 5 years) and had a good understanding of their physical and mental conditions and living habits, (3) participants provided consent for data collection and being able to complete the survey independently, and (4) participants who gave informed consent to participate in the evaluation voluntarily. The exclusion criteria for our study were as follows: (1) the child and their guardian were unable to complete the questionnaire even with the help of the investigators due to low educational level or other reasons, (2) patients with mental disorders and related diseases, and (3) participants whose informed consent could not be obtained.
Procedure
Five trained investigators conducted one-on-one on-site interviews with the participants, including the reading of questions to the children and helping them choose answers, while teachers from the special training schools conducted auxiliary investigations, including distributing questionnaires on the spot, and filling in the questionnaires, which were collected through face-to-face interviews. The investigators were only responsible for reading the questions aloud, with no further explanations to avoid leading answers. After collecting the questionnaires, the collected questionnaires were strictly checked, the questionnaires with errors were eliminated, the valid questionnaires were numbered and sorted, and the EpiData version 3.1 software system (Odense, Denmark) was used for two-person dual-computer entry. The entered data was checked one by one to ensure data quality.
Results
Demographic Characteristics of the Visually Impaired Children
In this study, 226 visually impaired children were included in the pre-survey, and the results are shown in Supplementary Table 2. In the formal survey, 1,909 questionnaires (895 visually impaired children, 1,014 healthy children) were administered, and the baseline data of the two groups were compared using t-tests for continuous variables and chi-squared tests for categorical variables. Based on the results, with the significance level set at P <0.05, the baseline data from visually impaired children and healthy children were all comparable (Table 1).
Formation of the Final Scale by Screening Items
Cronbach's alpha, CITCs, SD, EFA, and IRT (Figure 1) were used to select items. According to the results shown in Table 2, three items were deleted, and the scale contained 6 domains and 38 items (see the Supplementary Material).

Figure 1. Item characteristic curve matrix diagram.

Table 2. Screening results of the second item-selection phase using CTT and IRT.
IRT was used to guide the test preparation and project selection (33). MULTILOG 7.03 software from Scientific Software International Inc. (Skokie, USA) was employed to estimate the item discrimination parameter (a) and difficulty parameter (b) of the scale. An item characteristic curve (ICC) matrix diagram was created for the items in the QOLS-CVI (Figure 1). Ideally, the blank and cyan curves should change monotonically, whereas the blue, magenta, and green curves should show a normal distribution. According to the ICC matrix, the ICCs for items 34 (DIS-GM10) and 41 (DIS-SMV7) were not ideal; therefore, they were deleted.
Evaluation of the Final Scale (QOLS-CVI)
Reliability
The split-half reliability for the entire scale was 0.629. Thirty students with visual impairment at the Taiyuan School for the Blind underwent test–retest measurements 2 weeks prior to data collection, and the test–retest reliability of the total scale was 0.888. For this scale, the Cronbach alpha coefficient for the total scale was 0.841, with each domain's result shown in Table 3.
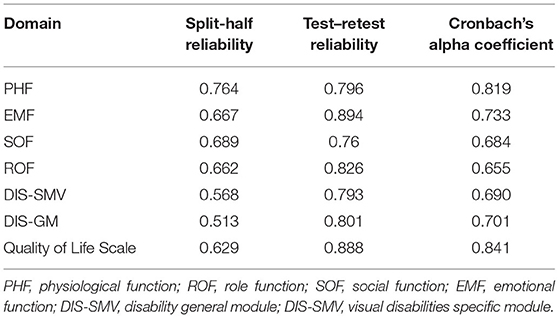
Table 3. Reliability of the total scale and of each domain.
Validity
(1) Content validity: When aiming to determine the degree of conformity between a measured subject and the prescribed content, it is impossible to determine the true value; consequently, expert evaluation is often used (36). The scale developed in this study was based on the mature, reliable, and valid QOL scales used by studies conducted in China and other countries. Concurrently, the research group consulted 26 experts in related fields as mentioned in section The Development of the Quality of Life Scale for Children With Visual Impairments, and after creating the initial items, two rounds of the Delphi method was used to screen the items. Therefore, the index system of this scale can be considered to have high content validity.
(2) Construct validity: Principal component analysis was used for EFA according to the characteristic root over one. The mean Kaiser–Meyer–Olkin index was 0.862. Bartlett's test of sphericity indicated that the samples were factorable at P < 0.001. Through maximum variance rotation, 38 items were screened and removed, and 10 subdomains were selected. The cumulative contribution rate was 57%. The structural framework of the final scale is presented in Table 4. According to the EFA results, R software (Auckland, New Zealand) was used to perform confirmatory factor analysis (CFA), and the fit indices indicated a good model fit (37) (χ2 = 1,848.32, df = 620, χ2/df = 2.981, and root mean square error of approximation = 0.048). As shown in Table 5, the model fitting indices of the scale met the corresponding requirements. The standardized factor loadings of the 10 subdomains were > 0.5. Therefore, the construct validity was deemed satisfactory, as shown in Figure 2.
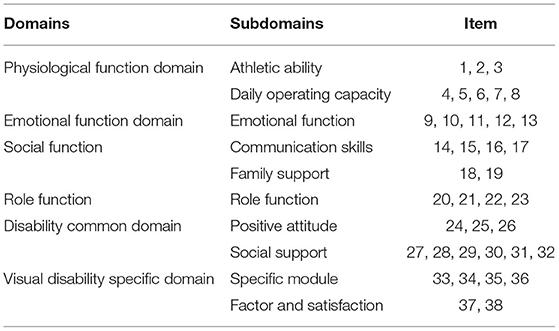
Table 4. Scale structure of the final scale.
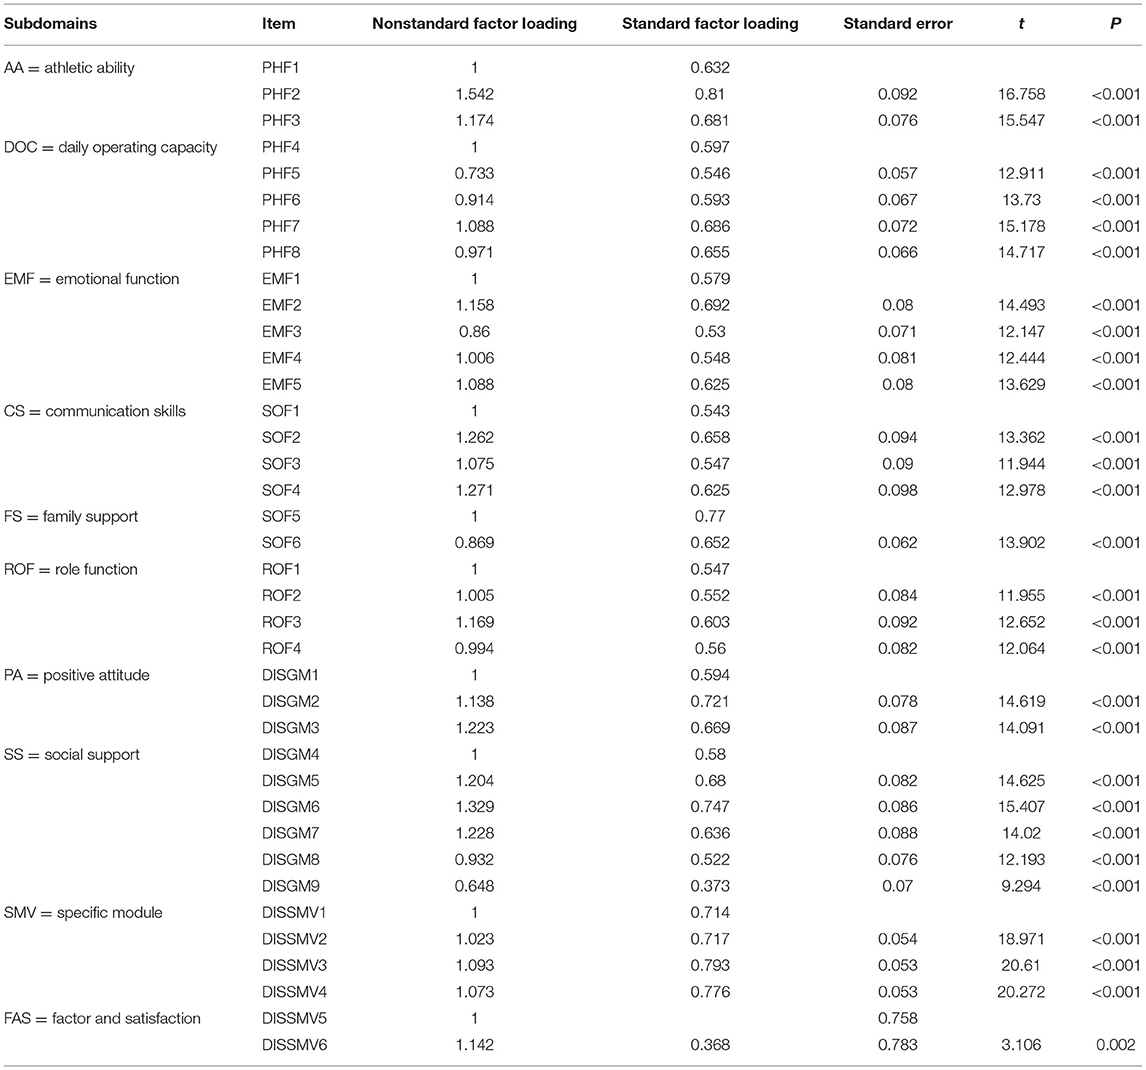
Table 5. Results of the confirmatory factor analysis.
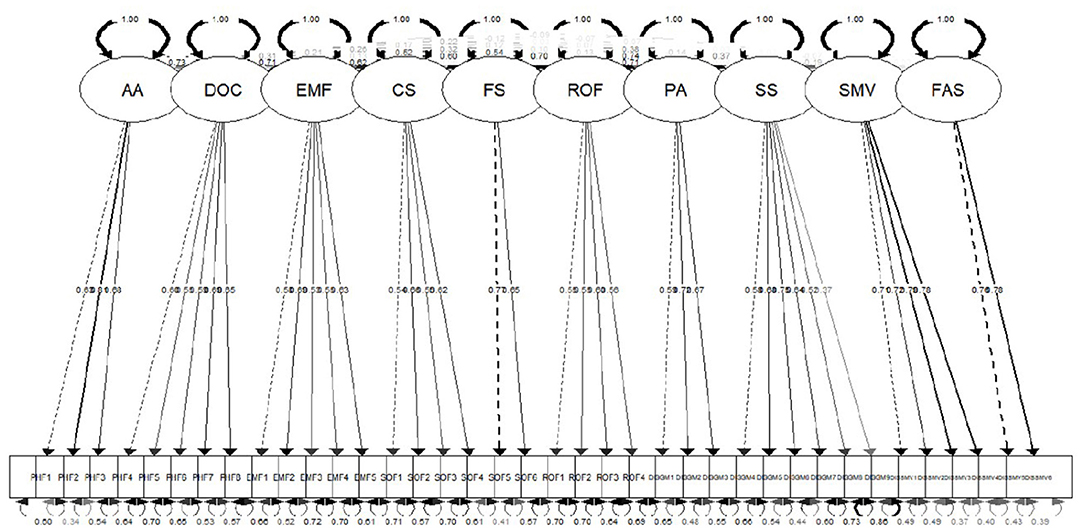
Figure 2. The confirmatory factor analysis of the Quality of Life Scale for Children with Visual Impairments.
(3) Discriminant validity: The discriminant validity results are presented in Table 6. The results of discriminant validity (P < 0.05) suggested that the QOLS-CVI was an appropriate instrument to distinguish between visually impaired children and healthy children.
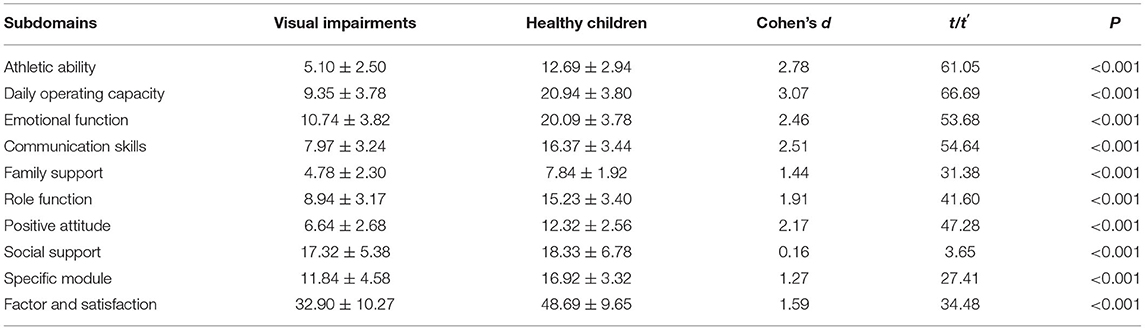
Table 6. Score comparisons between healthy children and visually impaired children (X ± s).
(4) Feasibility: The recovery rate of this scale was 100% in the pre-survey. In the formal survey, the recovery rates of the questionnaires were 99.44 and 92.18%, respectively. There were no missing items on the recovery scale, and the effective rate of the questionnaire was 100%. During the survey administration, respondents generally understood and answered the questions asked and completed the scale within 15–20 min. This shows that the content of the scale was clear, easily understood, and straightforward to complete.
Discussion
Visual impairment is considered the sixth major disability that has caused a huge social and economic burden worldwide (38). In a person's life, visual development during childhood is particularly important. Visual impairment directly affects adults' ability to work, social skills, confidence, and family pressure (39). Therefore, it is particularly important to study the visual-related quality of life of visually impaired children in China, and provide a valid and reliable research tool to comprehensively understand the health status of visually impaired children and their ability to participate in society. This is the first study to use the method of independent research and development in constructing a QOLS-CVI in China. The QOLS-CVI comprises 6 domains, 10 subdomains, and 38 items. The results of our study indicate that the QOLS-CVI is a valid instrument for measuring quality of life among visually impaired children in China.
The QOLS-CVI analyzes the quality of life of Chinese children with visual impairment from various aspects. Compared with the existing scales for visual impairment, the QOLS-CVI has a more comprehensive assessment of quality of life (6–17). In this study, QOLS-CVI was established through discussion with experts and interviews with visually impaired children and the developed scale solved the problem of applicability and language habits among Chinese patients. The scale takes the common field of disability and the specific field of disability as independent fields, which can better evaluate the health status and rehabilitation effect of visually impaired children. Other subdomains would enhance the capacity of the QOLS-CVI to assess the effect of vision loss on the specific components of QOL. In the social field, family relationships are emphasized to recognize the importance of family support in improving the quality of life of visually impaired children.
To ensure the quality of the selection and to make the selected items more representative, independent, and sensitive, we adopted a variety of methods. In the past, the CTT method was used to select the items. Recently, IRT has become an increasingly popular method used to select items (40, 41). The IRT was used to evaluate the discrimination degree of the items, the amount of information contained in the items, and the subsequent error (42). Observation of the ICC matrix of items of the scale shows that the items contain a large amount of information, have a small amount of error, and have a high degree of discrimination. Therefore, people with different QOL can be distinguished.
Our results show that the reliability of the scale can be considered high and stable over long periods of time, and the cross index of the scale was consistent. We conducted a pre-survey among a small sample (226 visually impaired children) using a 41-item questionnaire. For the formal survey, a larger sample (895 visually impaired children and 1,014 healthy children) responded to a questionnaire with a reduced number of items (38 items) to improve the rationality of the QOLS-CVI, consistent with the requirement proposed by scholars that the sample size should be 5–10 times the number of observed variables (22). Furthermore, the overall credibility of the scale was high. Thus, the internal consistency of the scale was determined to be good, and the measurement results can be considered reliable (43). Overall, the reliability of the scale can be considered satisfactory (44, 45).
Validity is the ability of a scale to evaluate a certain ability or quality of life (46). To establish the construct validity of the QOLS-CVI, the study identified 10 subdomains according to EFA coupled with CFA, which were both independent and interrelated, and there was an inherent logical association among their items; therefore, the scale can be considered to have good structural validity (47). In the development stage of the scale, we used healthy children as a control group to evaluate discriminant validity, and the results showed that the scale could distinguish between healthy children and visually impaired children.
Previous studies have shown that blind children have fewer opportunities to practice their language skills (48). Some researchers argued that social adaptation of visually impaired children is influenced by a number of factors related to both the children's environment and the visual impairment itself (49). Consequently, we suggest that further studies and sorting of the specific module of visual disability should be conducted in the future. In summary, the overall reliability and validity of the scale is good, indicating that the model fits well.
Limitations
Based on the initial expectations, this study investigated the quality of life of visually impaired children at different ages; however, in the actual investigation process, it was found that, first, visually impaired children lagged far behind normal children in the physical and psychological aspects; thus, their school age is evidently older; and second, early educational resources for disabled children in China are scarce. Most visually disabled children aged between 5 and 7 years do not attend kindergarten, but spend their time at home; therefore, there were almost no children aged between 5 and 7 years in this survey, and only the questionnaires of children aged above 8 years were collected.
Considering that only visually impaired children in two provinces were surveyed, the scope of the survey will need to be expanded in future studies to include more visually impaired children in more provinces and institutions, to strengthen the representativeness and applicability of the scale. Additional information about visually impaired children can be appropriately added to the scale, such as the basic information about additional disabilities, the causes of visual impairment, and type of eye disease. Utilizing the Braille questionnaire has been suggested so that visually impaired children can read and answer the questions independently, to improve the accuracy of the results; it is a convenient method to further verify the reliability, validity, and differentiation of the scale in future statistical analysis.
Conclusion
In summary, the QOLS-CVI has good reliability and validity and can be used to accurately evaluate the QOL of visually impaired children and can be used as an evaluation tool to study the QOL and social-participation ability of children with visual impairments.
Data Availability Statement
The raw data supporting the conclusions of this article will be made available by the authors, without undue reservation.
Ethics Statement
This study was approved by the Institutional Review Board of Shanxi Medical University (approval number: 2018LL294). Written informed consent to participate in this study was provided by the participants' legal guardian/next of kin. Written informed consent was obtained from the individual(s), and minor(s)' legal guardian/next of kin, for the publication of any potentially identifiable images or data included in this article.
Author Contributions
JLiu wrote the original draft, handled data curation, and performed the formal analysis. RE was responsible for the overall conceptualization, format, and language evaluation of the article. BH and CZ were mainly responsible for the overall investigation. YT, JLi, and SL participated in the data analysis. ZT served as a resource project administrator. LH and YW supervised and validated the information used in the study. Finally, JZ was mainly responsible for writing (reviewing and editing), and, in collaboration with colleagues, the study's overall conceptualization. All authors made a significant contribution to the work reported, whether that is in the conception, study design, execution, acquisition of data, analysis and interpretation, or in all these areas, took part in drafting, revising, or critically reviewing the article, provided final approval of the version to be published, have agreed on the journal to which the article has been submitted, and agreed to be accountable for all aspects of the work.
Funding
This study was supported by National Natural Science Foundation of China (approval number 71203126).
Conflict of Interest
The authors declare that the research was conducted in the absence of any commercial or financial relationships that could be construed as a potential conflict of interest.
Publisher's Note
All claims expressed in this article are solely those of the authors and do not necessarily represent those of their affiliated organizations, or those of the publisher, the editors and the reviewers. Any product that may be evaluated in this article, or claim that may be made by its manufacturer, is not guaranteed or endorsed by the publisher.
Acknowledgments
The author was grateful to JZ for his guidance and suggestions in the modifications of the study. And thank RE for providing support for conceptualization, format, and language evaluation; BH and CZ for their help with data collection and software support, YT, JLi, and SL for their help with the methodology and data; and my teachers LH, YW, and JZ for their supervision and validation of the study. Also, grateful for ZT's help with project administration and resources, and thank the support of Institute of the special educational schools in Shanxi and Hebei Province, and finally, to Yidji Company for improving the language of my article.
Supplementary Material
The Supplementary Material for this article can be found online at: https://www.frontiersin.org/articles/10.3389/fped.2022.739296/full#supplementary-material
References
1. Zhou TY, Chen YS. Communiqué on major statistics of the second China national sample survey on disability. Chin J Rehabil Theor Pract. (2006) 12:1013. doi: 10.1115/1.4031538
2. Zhang WH. Case Work on the Improve of Psychological State of Visually Impaired Children. Liaoning University (2015).
3. Huang R. Experience and enlightenment of expanded core curriculum for American students with visual impairments. Mod Spec Educ. (2018) 6:21–7. doi: 10.3969/j.issn.1004-8014.2018.06.005
4. Wang MM, Zhang YX. Case study on environmental adaption of college students with visual impairment. Disabil Res. (2017) 1:21–7.
5. Shaw A, Gold D, Wolffe K. Employment-related experiences of youths who are visually impaired: how are these youths faring? J Vis Impairment Blindness. (2007) 101:7–21. doi: 10.1177/0145482X0710100103
6. Lundström M, Pesudovs K. Catquest-9SF patient outcomes questionnaire: nine-item short-form Rasch-scaled revision of the Catquest questionnaire. J Cataract Refract Surg. (2009) 35:504–13. doi: 10.1016/j.jcrs.2008.11.038
7. Scott IU, Smiddy WE, Schiffman J, Feuer WJ, Pappas CJ. Quality of life of low-vision patients and the impact of low-vision services. Am J Ophthalmol. (1999) 128:54–62. doi: 10.1016/S0002-9394(99)00108-7
8. Gothwal VK, Wright TA, Lamoureux EL, Pesudovs K. Measuring outcomes of cataract surgery using the Visual Function Index-14. J Cataract Refract Surg. (2010) 36:1181–8. doi: 10.1016/j.jcrs.2010.01.029
9. Zou H, Zhang X, Xu X, Bai L, Wolffsohn JS. Development and psychometric tests of the Chinese-version Low Vision Quality of Life Questionnaire. Qual Life Res. (2005) 14:1633–9. doi: 10.1007/s11136-004-0026-5
10. Liu XJ, Zou HD, Wu XW. Vision-related quality of life and related factors in patients with age-related macular degeneration. J Shanghai Jiaotong Univ (Med Sci). (2012) 32:197–201. doi: 10.3969/j.issn.1674-8115.2012.02.016
11. Felius J Sr, Stager DR, Berry PM, Fawcett SL, Stager DR Jr, Salomão SR, et al. Development of an instrument to assess vision-related quality of life in young children. Am J Ophthalmol. (2004) 138:362–72. doi: 10.1016/j.ajo.2004.05.010
12. Gothwal VK, Lovie-Kitchin JE, Nutheti R. The development of the LV Prasad-Functional Vision Questionnaire: a measure of functional vision performance of visually impaired children. Invest Ophthalmol Vis Sci. (2003) 44:4131–9. doi: 10.1167/iovs.02-1238
13. Gothwal VK, Sumalini R, Bharani S, Reddy SP, Bagga DK. The second version of the L. V. Prasad-functional vision questionnaire. Optom Vis Sci. (2012) 89:1601–10. doi: 10.1097/OPX.0b013e31826ca291
14. Cochrane GM, Marella M, Keeffe JE, Lamoureux EL. The impact of vision impairment for children (IVI_C): validation of a vision-specific pediatric quality-of-life questionnaire using Rasch analysis. Invest Ophthalmol Vis Sci. (2011) 52:1632–40. doi: 10.1167/iovs.10-6079
15. Valerija T, Ailbhe H, Nidhi S, Rachel LK, Jugnoo SR. Patient-reported outcome measures (PROMs) in paediatric ophthalmology: a systematic review. Br J Ophthalmol. (2013) 97:1369–81. doi: 10.1136/bjophthalmol-2013-303350
16. Carlton J. Developing the draft descriptive system for the child amblyopia treatment questionnaire (CAT-Qol): a mixed methods study. Health Qual Life Outcomes. (2013) 11:174. doi: 10.1186/1477-7525-11-174
17. Chen X, Yang X, Yu X, Jie C, Chen Y, Shi Y. The development and evaluation of the quality of life scale for amblyopia children with occlusion therapy. J Nurs Sci. (2010) 20:4–6. doi: 10.3870/hlxzz.2010.20.004
18. Lu Y, Tian Q, Hao Y, Jing J, Liu Y, Hunag D. Reliability and validity for Chinese version of pediatric quality of life inventory PedsQL4.0. J Sun Yat-Sen Univ (Med Sci). (2008) 3:328–31. doi: 10.3321/j.issn:1672-3554.2008.03.018
19. Power MJ, Green AM, WHOQOL-Dis Group. Development of the WHOQOL disabilities module. Qual Life Res. (2010) 19:571–84. doi: 10.1007/s11136-010-9616-6
20. Yang Z, Huang R. Prepare of exercise assessment scale for elderly patients with diabetes and its reliability and validity test. Chin Nurs Res. (2015) 3:1578–82. doi: 10.3969/j.issn.10096493.2015.13.014
21. Halamová J, Kanovský M, Pacúchová M. Self-compassion scale: IRT psychometric analysis, validation, and factor structure – Slovak translation. Psychol Belg. (2018) 57:190–209. doi: 10.5334/pb.398
22. Anthoine E, Moret L, Regnault A, Sébille V, Hardouin JB. Sample size used to validate a scale: a review of publications on newly-developed patient reported outcomes measures. Health Qual Life Outcomes. (2014) 12:176. doi: 10.1186/s12955-014-0176-2
23. Garnefski N, Kraaij V. Cognitive emotion regulation questionnaire – Development of a short 18-item version (CERQ-short). Pers Individ Dif. (2006) 41:1045–53. doi: 10.1016/j.paid.2006.04.010
24. Streiner DL, Norman GR, Fulton C. Health measurement scales: a practical guide to their development and use. Int J Rehabil Res. (1991) 14:364. doi: 10.1097/00004356-199112000-00017
25. Meads DM, Bentall RP. Rasch analysis and item reduction of the hypomanic personality scale. Pers Individ Dif. (2008) 44:1772–83. doi: 10.1016/j.paid.2008.02.009
26. Lai JS, Cook K, Stone A, Beaumont J, Cella D. Classical test theory and item response theory/Rasch model to assess differences between patient-reported fatigue using 7-day and 4-week recall periods. J Clin Epidemiol. (2009) 62:991–7. doi: 10.1016/j.jclinepi.2008.10.007
27. Nguyen TH, Han HR, Kim MT, Chan KS. An introduction to item response theory for patient-reported outcome measurement. Patient. (2014) 7:23–35. doi: 10.1007/s40271-013-0041-0
28. Lu T, Yan L, Ping X, Zhang G, Wu D. Analysis on reliability and validity of the Pittsburgh Sleep Quality Index. Chongqing Med. (2014) 43:260–3. doi: 10.3969/j.issn.1671-8348.2014.03.002
29. Gong J, Yan Z, Miao D. Re-evaluation of the new F Scales and its reliability and validity. China J Health Psychol. (2012) 20:854–6.
30. Wink F, Arends S, Mckenna SP, Houtman PM, Brouwer E, Spoorenberg A. Validity and reliability of the Dutch adaptation of the psoriatic arthritis quality of life (PsAQoL) questionnaire. PLoS One. (2013) 8:e55912. doi: 10.1371/journal.pone.0055912
31. Cella DF, Tulsky DS, Gray G, Sarafian B, Linn E, Bonomi A, et al. The Functional Assessment of Cancer Therapy scale: development and validation of the general measure. J Clin Oncol. (1993) 11:570–9. doi: 10.1200/JCO.1993.11.3.570
32. Maydeu-Olivares A, Fairchild AJ, Hall AG. Goodness of fit in item factor analysis: effect of the number of response alternatives. Struct Equ Model Multidiscip J. (2017) 24:495–505. doi: 10.1080/10705511.2017.1289816
33. Pascolini D, Mariotti SP. Global estimates of visual impairment: 2010. Br J Ophthalmol. (2012) 96:614–8. doi: 10.1136/bjophthalmol-2011-300539
34. Yan H, Zhao JL, Guan HJ, Zhang JK. The second national sample survey on visual disability standards. Chin J Ophthalmol. (2007) 43:1055–6. doi: 10.3760/j.issn:0412-4081.2007.11.021
35. World Health Organization. Blindness and Vision Impairment [S/OL]. (2019). Available online at: https://icd.who.int/browse11/l-m/en#/http%3a%2f%2fid.who.int%2ficd%2fentity%2f1103667651 (accessed December 18, 2020).
36. Villalonga-Olives E, Kawachi I, Almansa J, Witte C, Lange B, Kiese-Himmel C, et al. Pediatric health-related quality of life: a structural equation modeling approach. PLoS One. (2014) 9:e113166. doi: 10.1371/journal.pone.0113166
37. Conte D, Smith MR, Santolamazza F, Favero TG, Tessitore A, Coutts A. Reliability, usefulness and construct validity of the Combined Basketball Skill Test (CBST). J Sports Sci. (2019) 37:1205–11. doi: 10.1080/02640414.2018.1551046
38. Chiang PP, Keeffe JE, Le Mesurier RT, Taylor HR. Global burden of disease and visual impairment. Lancet. (2006) 368:365. doi: 10.1016/S0140-6736(06)69105-8
39. Rahi JS, Dezateux C. Epidemiology of visual impairment in Britain. Arch Dis Child. (1998) 78:381–6. doi: 10.1136/adc.78.4.381
40. Reise SP, Haviland MG. Item response theory and the measurement of clinical change. J Pers Assess. (2005) 84:228–38. doi: 10.1207/s15327752jpa8403_02
41. Shen M, Hu M, Liu S, Chang Y, Sun Z. Assessment of the Chinese Resident Health Literacy Scale in a population-based sample in South China. BMC Public Health. (2015) 15:637. doi: 10.1186/s12889-015-1958-0
42. Wirth FF, Luzar EJ. A scale measure of state regulatory climate toward finfish aquaculture. J World Aquacult Soc. (2000) 31:545–57. doi: 10.1111/j.1749-7345.2000.tb00904.x
43. Sawyer M, Antoniou G, Toogood I, Rice M. A comparison of parent and adolescent reports describing the health-related quality of life of adolescents treated for cancer. Int J Cancer Suppl. (2015) 12:39–45. doi: 10.1002/(SICI)1097-0215(1999)83:12+<39::AID-IJC8>3.0.CO;2-7
44. Verrips GH, Stuifbergen MC, den Ouden AL, Bonsel GJ, Gemke RJ, Paneth N, et al. Measuring health status using the Health Utilities Index: agreement between raters and between modalities of administration. J Clin Epidemiol. (2001) 54:475–81. doi: 10.1016/S0895-4356(00)00317-6
45. Challinor JM, Miaskowski CA, Franck LS, Slaughter RE, Matthay KK, Kramer RF, et al. Somatization, anxiety and depression as measures of health-related quality of life of children/adolescents with cancer. Int J Cancer Suppl. (1999) 12:52–7. doi: 10.1002/(SICI)1097-0215(1999)83:12+<52::AID-IJC10>3.0.CO;2-J
46. Elliott DB, Pesudovs K, Mallinson T. Vision-related quality of life. Optometry Vis Sci. (2007) 84:656. doi: 10.1097/OPX.0b013e31814db01e
47. Lin Y, Zhang W, Fang J. The application of item response theory in screening item of medical scale. China Herald. (2014) 11:155–8.
48. Wherry JN, Huffhines LP, Walisky DN. A short form of the Trauma Symptom Checklist for Children. Child Maltreat. (2016) 21:37–46. doi: 10.1177/1077559515619487
Keywords: children, reliability, validity, quality of life, physical wellbeing, visual impairments
Citation: Liu J, Evans R, Wang Y, Hu B, Tong Y, Li S, Tian Z, Li J, Zhang C, He L and Zheng J (2022) Development and Evaluation of the Quality of Life Scale for Children With Visual Impairments in China. Front. Pediatr. 10:739296. doi: 10.3389/fped.2022.739296
Received: 10 July 2021; Accepted: 23 February 2022;
Published: 21 March 2022.
Edited by:
Judie Arulappan, Sultan Qaboos University, OmanReviewed by:
Shirley Wyver, Macquarie University, AustraliaYok-Chin Yap, Kuala Lumpur Hospital, Malaysia
Copyright © 2022 Liu, Evans, Wang, Hu, Tong, Li, Tian, Li, Zhang, He and Zheng. This is an open-access article distributed under the terms of the Creative Commons Attribution License (CC BY). The use, distribution or reproduction in other forums is permitted, provided the original author(s) and the copyright owner(s) are credited and that the original publication in this journal is cited, in accordance with accepted academic practice. No use, distribution or reproduction is permitted which does not comply with these terms.
*Correspondence: Lu He, aGVsdWhsMjAxM0Bob3RtYWlsLmNvbQ==; Jianzhong Zheng, emp6aG9uZzQxODNAMTYzLmNvbQ==