 Daniel Hilário Santos Genu1
 Fernanda Lima-Setta1
 José Colleti Jr2
 Daniela Carla de Souza3Sérgio D’Abreu Gama4
 Letícia Massaud-Ribeiro5
 Ivan Pollastrini Pistelli6José Oliva Proença Filho7Thaís de Mello Cesar Bernardi8Taísa Roberta Ramos Nantes de Castilho9Manuela Guimarães Clemente10Cibele Cristina Manzoni Ribeiro Borsetto11Luiz Aurelio de Oliveira12Thallys Ramalho Suzart Alves13Diogo Botelho Pedroso14Fabíola Peixoto Ferreira La Torre15Lunna Perdigão Borges16Guilherme Santos16
 Juliana Freitas de Mello e Silva1
 Maria Clara de Magalhães-Barbosa1Antonio José Ledo Alves da Cunha1,5Marcio Soares1,16,†
 Arnaldo Prata-Barbosa1,5*†The Brazilian Research Network in Pediatric Intensive Care (BRnet-PIC)
- 1Department of Pediatrics, Instituto D’Or de Pesquisa e Ensino, Rio de Janeiro, RJ, Brazil
- 2Pediatric Intensive Care Unit, Hospital Assunção, São Bernardo do Campo, SP, Brazil
- 3Pediatric Intensive Care Unit, Hospital Sírio Libanês, São Paulo, SP, Brazil
- 4Pediatric Intensive Care Unit, Urgências Pediátricas Nova Iguaçu, Nova Iguaçu, RJ, Brazil
- 5Instituto de Puericultura e Pediatria Martagão Gesteira, Universidade Federal do Rio de Janeiro, Rio de Janeiro, RJ, Brazil
- 6Pediatric Intensive Care Unit, Hospital São Luiz Morumbi, São Paulo, SP, Brazil
- 7Pediatric Intensive Care Unit, Hospital e Maternidade Brasil, Santo André, SP, Brazil
- 8Pediatric Intensive Care Unit, Hospital São Luiz Jabaquara, São Paulo, SP, Brazil
- 9Pediatric Intensive Care Unit, Hospital São Luiz Anália Franco, São Paulo, SP, Brazil
- 10Pediatric Intensive Care Unit, Hospital Esperança Olinda, Olinda, PE, Brazil
- 11Pediatric Intensive Care Unit, Hospital São Luiz São Caetano, São Caetano do Sul, SP, Brazil
- 12Pediatric Intensive Care Unit, Hospital e Maternidade Ribeirão Pires, Ribeirão Pires, SP, Brazil
- 13Pediatric Intensive Care Unit, Hospital Santa Helena, Brasília, DF, Brazil
- 14Pediatric Intensive Care Unit, Hospital Santa Luzia, Brasília, DF, Brazil
- 15Pediatric Intensive Care Unit, Hospital e Maternidade Sino Brasileiro, Osasco, SP, Brazil
- 16Department of Research & Development, Epimed Solutions Inc., Rio de Janeiro, RJ, Brazil
Objective: To validate the PIM3 score in Brazilian PICUs and compare its performance with the PIM2.
Methods: Observational, retrospective, multicenter study, including patients younger than 16 years old admitted consecutively from October 2013 to September 2019. We assessed the Standardized Mortality Ratio (SMR), the discrimination capability (using the area under the receiver operating characteristic curve – AUROC), and the calibration. To assess the calibration, we used the calibration belt, which is a curve that represents the correlation of predicted and observed values and their 95% Confidence Interval (CI) through all the risk ranges. We also analyzed the performance of both scores in three periods: 2013–2015, 2015–2017, and 2017–2019.
Results: 41,541 patients from 22 PICUs were included. Most patients aged less than 24 months (58.4%) and were admitted for medical conditions (88.6%) (respiratory conditions = 53.8%). Invasive mechanical ventilation was used in 5.8%. The median PICU length of stay was three days (IQR, 2–5), and the observed mortality was 1.8% (763 deaths). The predicted mortality by PIM3 was 1.8% (SMR 1.00; 95% CI 0.94–1.08) and by PIM2 was 2.1% (SMR 0.90; 95% CI 0.83–0.96). Both scores had good discrimination (PIM3 AUROC = 0.88 and PIM2 AUROC = 0.89). In calibration analysis, both scores overestimated mortality in the 0%–3% risk range, PIM3 tended to underestimate mortality in medium-risk patients (9%–46% risk range), and PIM2 also overestimated mortality in high-risk patients (70%–100% mortality risk).
Conclusions: Both scores had a good discrimination ability but poor calibration in different ranges, which deteriorated over time in the population studied.
Introduction
Mortality predictive models help to assess and compare the performance of pediatric intensive care units (PICUs) over time (1–3). One of the most used, the Pediatric Index of Mortality (PIM), was developed in 1997 and updated in 2003 (PIM2) and 2013 (PIM3) (4–6). External validation studies are needed for use in populations different from the original study, which may differ in the patient profile and, consequently, have different performances (7).
Since its publication, PIM3 has been validated in some countries. However, validation was carried out in studies with a few PICUs or a relatively low number of patients (8–14). In Italy, a study involving 11,109 patients (17 PICUs) demonstrated better performance of PIM3 in predicting mortality and calibration than PIM2 (15). Another study in Belgium, the Netherlands, and Canada (1,428 patients) showed that PIM3 had a lower discriminatory capacity (although good) than the Pediatric Risk of Mortality III score but better calibration (16). In Latin America, only one multicenter study conducted in Argentina (49 PICU; 6,602 patients) concluded that PIM3 underestimated mortality (14). In other low- and middle-income countries, single-center studies in Indonesia (9), India (11, 12), and Colombia (13) found similar results. Recently, one study involving nine hospitals in South Africa (17) and another study in a hospital in Saudi Arabia demonstrated acceptable discrimination but poor calibration (18). In Brazil, there is still a lack of robust evidence on the performance of PIM3. In addition, such models should be reassessed regularly, as they are subject to drift over time (19). This study aimed to validate PIM3 in a large and contemporary sample of patients admitted to Brazilian PICUs and compare its performance with the PIM2 score.
Materials and methods
Ethics approval
The study was approved by the Ethics Committee of the coordinator center (D'Or Institute for Research and Education), under the n° 3,384,961 (June 11, 2019), and by the other participating institutions (Supplementary Material - Ethics), which waived informed consent.
Study design and data setting
This retrospective multicenter cohort study used prospectively collected data from October 2013 to September 2019. We restricted the study to PICUs registered in the Brazilian Research Network in Pediatric Intensive Care (BRnet-PIC) that used the Epimed Monitor® System (Epimed Solutions®, Rio de Janeiro, Brazil), a cloud-based registry for quality improvement, performance evaluation, and benchmarking purposes (20). The number of PICUs increased over time, as they were included in the study from the moment they started recording data on this electronic platform. All patients admitted consecutively younger than 16 years old were included. Readmissions were not excluded and were considered new admissions.
Data collection
The principal collected data included demographics, admission diagnosis, source of admission, length of stay in the PICU, outcome, and all variables to calculate the PIM3 and PIM2 scores collected within the first hour of PICU admission. Scores were calculated as recommended in the original articles (5, 6). We also recorded the presence of any complex chronic condition (CCC), according to the Feudtner Classification version 2 (21), although this data was not used to calculate the scores.
Statistical analysis
Continuous variables were described as means or medians, and categorical variables as proportions. We assessed discrimination through the area under the receiver operating characteristic curves (AUROC) and its 95% confidence intervals (CI) and compared the AUROCs using a pairwise evaluation by the Delong method (22). For the calibration assessment across classes of mortality risk, we did not use the most traditionally used method, the Hosmer-Lemeshow goodness of fit (H-L GOF) statistics, due to limitations previously described (23–25). For this reason, we decided to use a new approach to assess calibration: the “calibration belt”. This technique was proposed by the “Italian Group for the Evaluation of Interventions in Intensive Care Medicine (GiViTI)” to investigate the relationship between observed and expected outcomes (26–28). This function results in a real calibration curve that shows the predicted mortality rates on the x-axis and observed mortality rates on the y-axis, plus a CI area around the calibration curve (80% and 95% limits), the “calibration belt”. For this belt, a deviation from the bisector was considered statistically significant when the 95% CI limits did not contain the bisector, the ideal line which indicates a perfect match between the PIM results and the outcomes it tries to predict (23, 25). The mean line of the calibration belt was compared to the bisector using a Wald-like statistic, testing the null hypothesis that there is no difference between this line and the bisector, as previously described (26–28). Standardized mortality ratios (SMR) with 95% CI were calculated by dividing the observed mortality rates by predicted ones. SMR below 1.0 indicates that the model overestimates mortality, while SMR above 1.0 indicates that the model underestimates mortality. Additionally, to assess the performance of the scores over time, we divided the patients into three groups: admitted from October 2013 to September 2015; from October 2015 to September 2017, and from October 2017 to September 2019, and we evaluated the SMR, discrimination, and calibration of PIM3 and PIM2 in these three periods. Statistical analysis was performed using R 4.0.3 (R Foundation for Statistical Computing, Vienna, Austria) and IBM SPSS Statistics, version 24 (IBM Corp., Armonk, NY, United States).
Results
There were 48,313 eligible patients in 26 PICUs. We excluded four centers (3,537 admissions) because of incomplete medical records that precluded the calculation of any of the PIM scores (> 5% of patients). Twenty-two PICUs remained in the study. Table 1 shows the characteristics of these PICUs. Most of them were private (n = 19, 86.4%) and exclusively pediatric (n = 14, 63.6%). Of the 44,776 admissions in these 22 PICUs, 3,235 patients (7.2%) were excluded, and 41,541 were included in the study (Figure 1). Table 2 describes the main characteristics of the study population. Most patients aged less than 24 months (58.4%) and were admitted for medical conditions (88.6%). Surgical admissions were mainly for scheduled surgery (59.9%). The origin was the emergency department in 71.1% of cases. Most had respiratory disease (53.8%), followed by neurologic disease (7.7%). CCC was present in 1,607 patients (3.9%); the most common was malignancy (1.0%), followed by gastrointestinal and neurologic/neuromuscular diseases. Upon admission, non-invasive mechanical ventilation was used in 4,378 patients (10.5%), and invasive mechanical ventilation in 2,419 patients (5.8%). The median PICU length of stay was three days (IQR, 2–5).
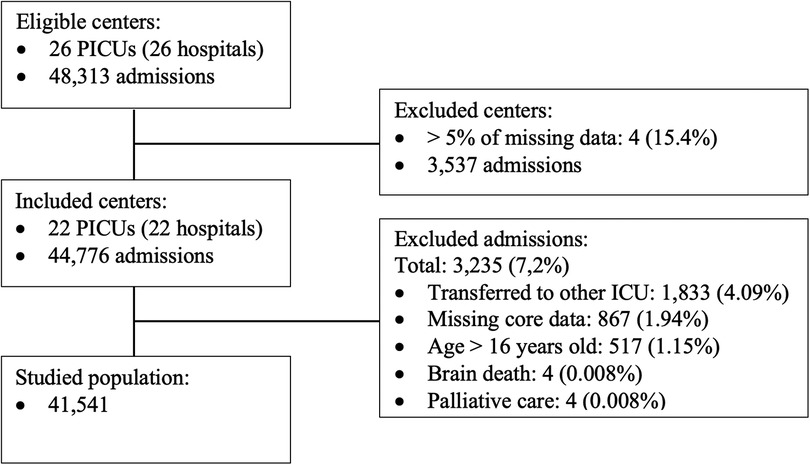
Figure 1. Study flowchart, showing eligibility, exclusion criteria, and final population included in the study.
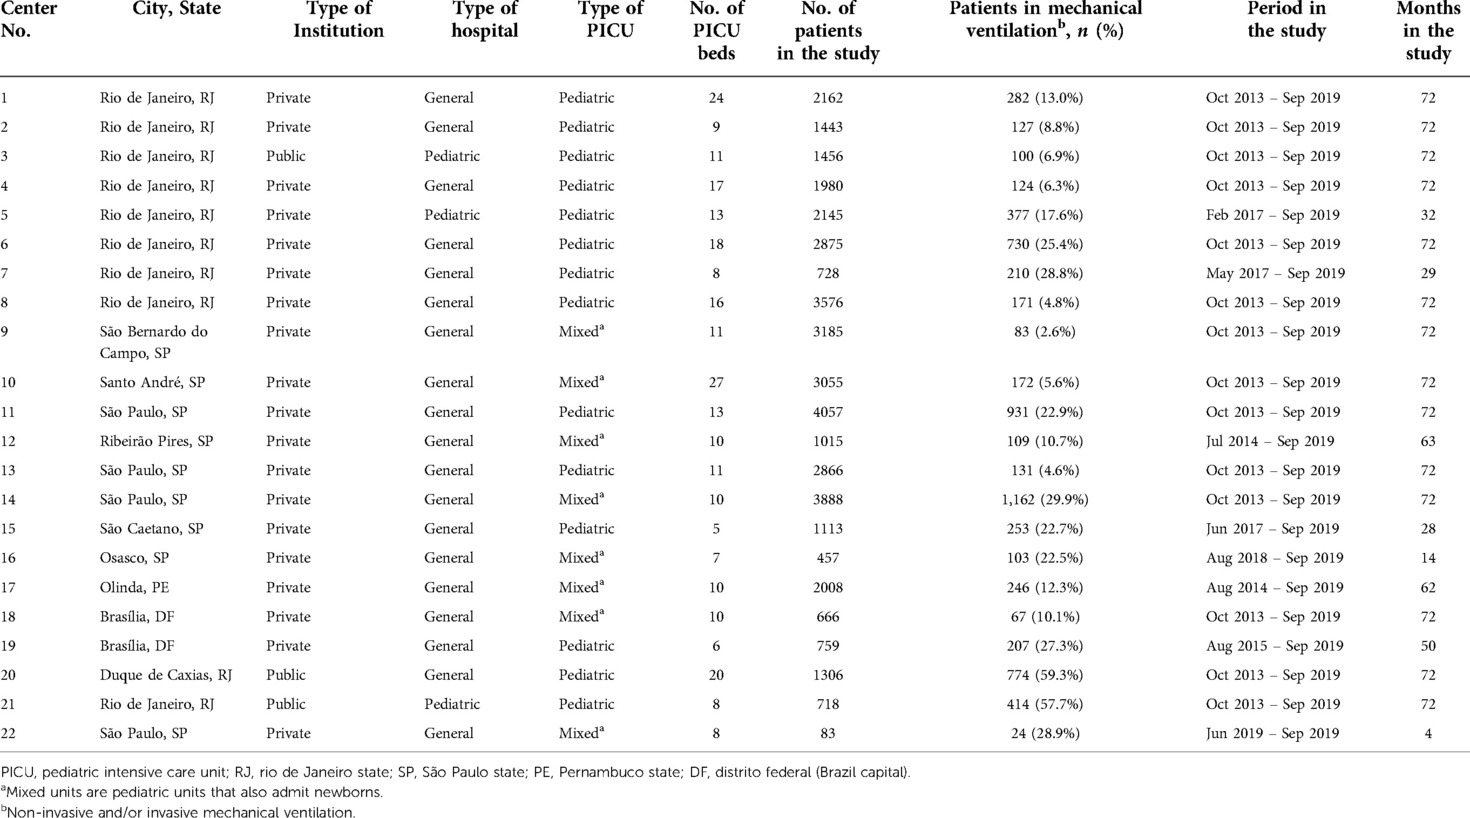
Table 1. Characteristics of the pediatric intensive care units included in the study.
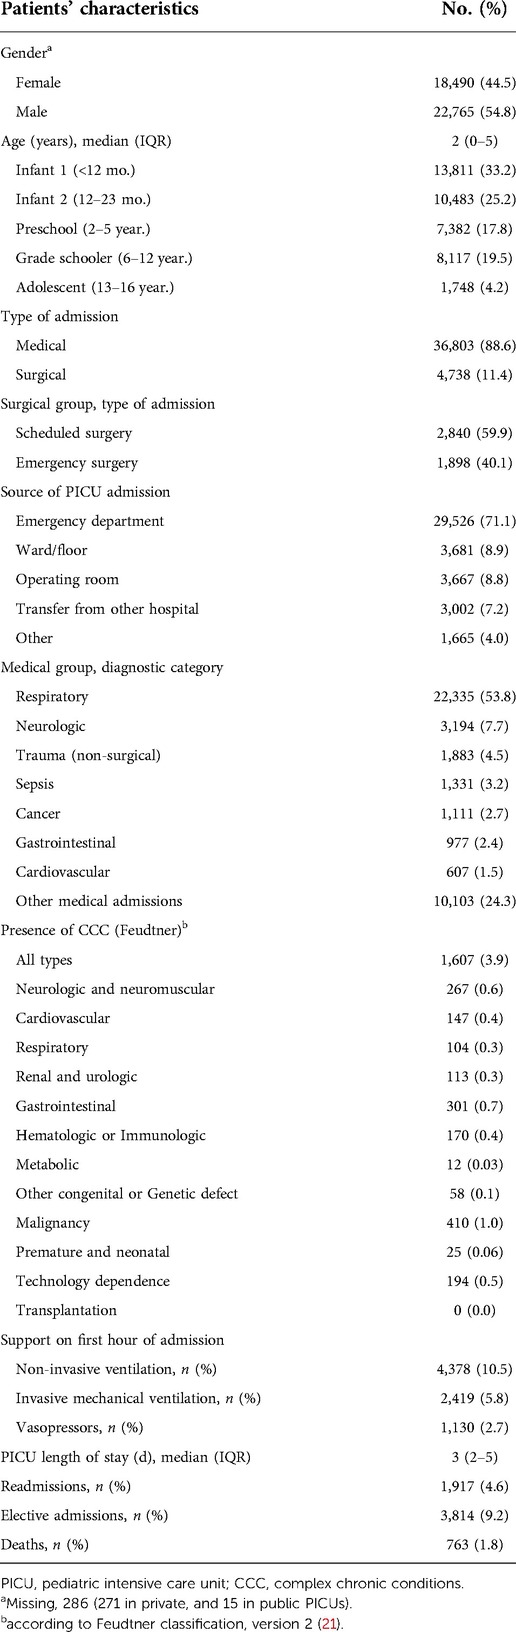
Table 2. Characteristics of the study population (n = 41,541).
Table 3 shows the performance analysis. There were 763 deaths (1.8%). The analysis of subgroups of patients who died showed a greater predominance (compared with the general proportion in the study population) among infants, patients coming from wards/rooms, operating rooms, transferred from other hospitals, and readmissions (Supplementary Material, Table S1). PIM3 predicted 757.2 (SMR 1.008, 95% CI 0.94–1.08), while PIM2 predicted 852.2 (SMR 0.896, 95% CI 0.83–0.96). The discrimination power was good for both scores, 0.88 for PIM3 and 0.89 for PIM2 (Table 3 and Figure 2). The calibration belts are shown in Figure 3. For both scores, the mean line significantly deviated from the bisector (Wald-like statistics, p-values < 0.001, Figure 3). When considering the 95% CI, the calibration belt for PIM3 was above the bisector in the predicted mortality range of 9%–46%, demonstrating poor calibration and underestimating mortality in this range. On the other hand, it was below the bisector in two narrow risk ranges, around 1%, and between 99%–100%, overestimating the risk of death only in these ranges. For PIM2, the calibration belt was never above the bisector. Still, it was totally below the bisector in two risk ranges: in the low-risk range of 0 to 2% and the high-risk range of 70 to 100%, overestimating mortality in these ranges. As 90% of the sample had a probability of death <3.3% in both scores (Supplementary Material, Table S2), to facilitate the visualization of the calibration belts in this risk range, we present (Supplementary Material, Figures S1 and S2 ), which only show the risk range from 0 to 5% death probability for both scores. In this range of probability of death, we can see that both scores had a poor calibration between 1% and 3% risk of mortality (1%–2% for PIM2% and 1%–3% for PIM3), overestimating mortality in this group of patients. On the other hand, PIM2 never underestimated mortality in this risk range (it was never above the bisector), but PIM3 started a curve above the bisector around the 5% risk range that went up to 46% (Supplementary Material, Figure S2 and Figure 3). Supplementary Material, Table S2 also shows the study population divided into ten risk groups, with the number of patients, PIM score variation, and observed and expected mortality in each risk group.
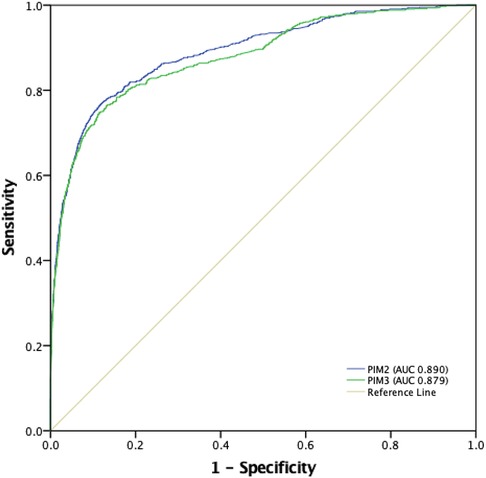
Figure 2. Receiver operating characteristic (ROC) curves for PIM3 and PIM2, and areas under the curve (AUROC). PIM2: 0.89 (95% CI 0.88-0.90); PIM3: 0.88 (95% CI 0.87-0.89) (P = 0.0018).
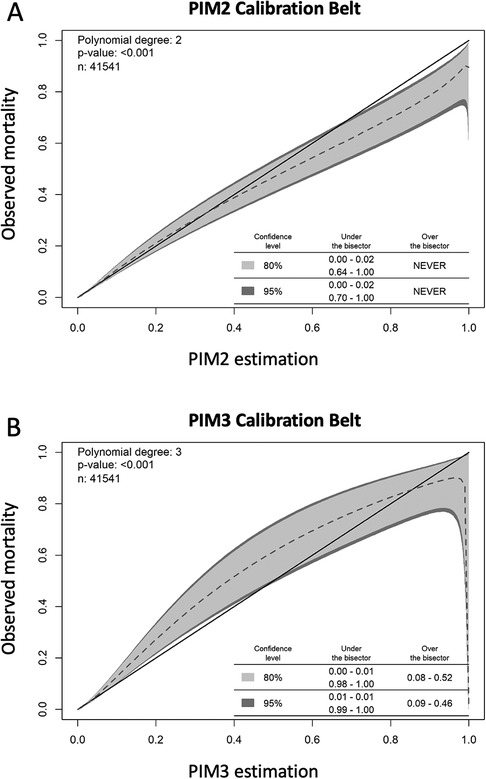
Figure 3. Calibration belts for PIM2 (A) and PIM3 (B), assessing the concordance of observed vs. expected outcome in 10 deciles of patient risk. The dashed line represents the mean line compared to the bisector, which indicates a perfect match between the PIM results and the outcomes it tries to predict. The p-value expresses a Wald-like statistic that tests the null hypothesis that there is no difference between this line and the bisector, which was rejected for PIM2 and PIM3. The inner light gray area marks the 80% CI boundary, and the dark gray outer belt marks the 95% CI boundary. For PIM2, the calibration belt is never over the bisector and is under the bisector (overestimating mortality) in a very low risk range below 2% mortality risk and over 70% predicted mortality, indicating that PIM2 overestimated the mortality for these high-risk patients. For PIM3, the calibration belt is over the bisector between 0.09 and 0.46 predicted mortality, underestimating the mortality in this risk range, and it is under the bisector (overestimating mortality) in a small range in less than 1% and above 99% mortality risk.
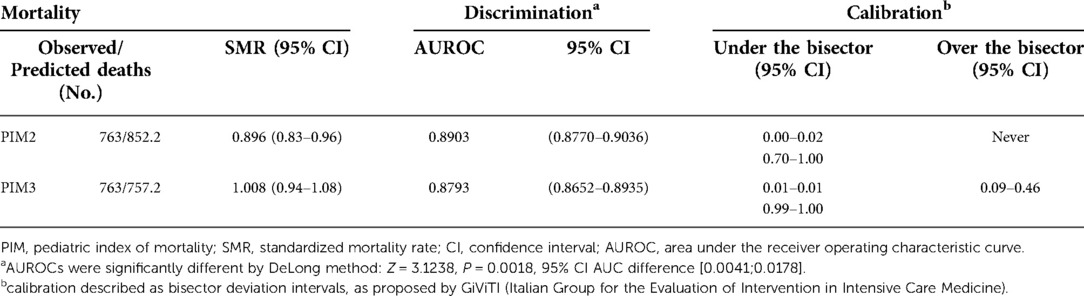
Table 3. Comparison between the performance of PIM2 and PIM3 in the study population.
In assessing the performance of the models over time, PIM3 and PIM2 maintained good discrimination in the three periods, with no difference in the AUROCs in period 3 (Table 4 and Figure 4). As for the standardized mortality ratio, the first four years studied maintained an SMR of around 1 (except for PIM3 in the first biennium, 1.20), showing reasonable adequacy. However, in the last two years, both scores overestimated mortality (PIM2 0.74 and PIM3 0.82) (Table 4). As for calibration, PIM2 maintained a good calibration for most risk ranges in all three periods, never underestimating mortality, overestimating it in the second period in the range of more than 91% risk of death and in the third period in the range of 0 to 5% risk of mortality (Table 4 and Figures 5A–C). PIM3, on the other hand, had excellent calibration in the first two years, underestimated mortality in the risk-of-death range of 8%–44% in the second period, and overestimated it in a small range of 0%–3% risk mortality in the last two years (Table 4 and Figures 5D–F). (Supplementary Material, Table S3) shows the complete statistical data generated by the GiViTI calibration test algorithm.
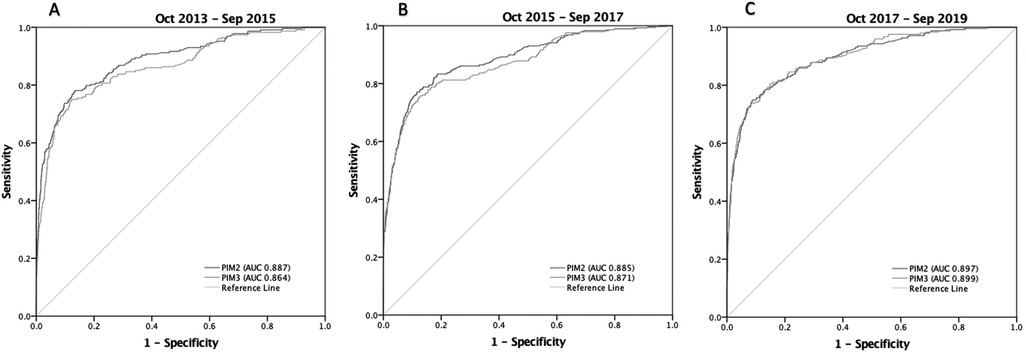
Figure 4. Receiver operating characteristic (ROC) curves for PIM3 and PIM2, and areas under the curve (AUROC) in the three periods from October 2013 to September 2019. (A) Period 1(Oct-2013 to Sep-2015): PIM2: 0.89 (95% CI 0.86-0.91); PIM3: 0.86 (95% CI 0.84-0.89) (P=0.0018); (B) Period 2 (Oct-2015 to Sep-2017): PIM2: 0.89 (95% CI 0.86-0.91); PIM3: 0.87 (95% CI 0.85-0.90) (P=0.0136); (C) Period 3 (Oct-2017 to Sep-2019): PIM2: 0.90 (95% CI 0.88-0.92); PIM3: 0.90 (95% CI 0.88-0.92) (P=0.652).
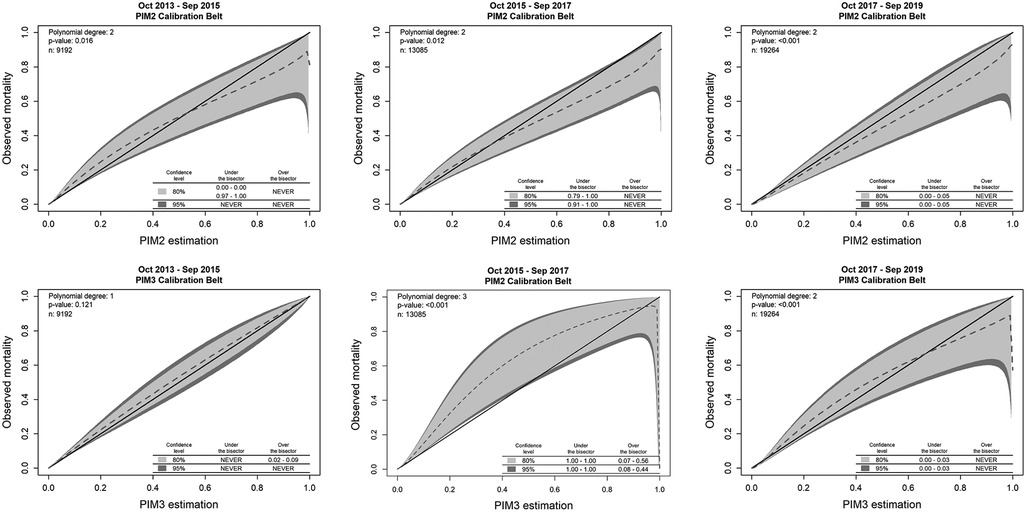
Figure 5. Calibration belts for PIM2 and PIM3 in the three periods from October 2013 to September 2019. PIM2 maintained a good calibration for most risk ranges in all three periods, never underestimating mortality, overestimating it in the second period in the range of more than 91% risk of death and in the third period in the range of 0 to 5% risk of mortality. PIM3, on the other hand, had excellent calibration in the first two years, underestimated mortality in the risk-of-death range of 8%–44% in the second period, and overestimated it in a small range of 0%–3% risk mortality in the last two years.
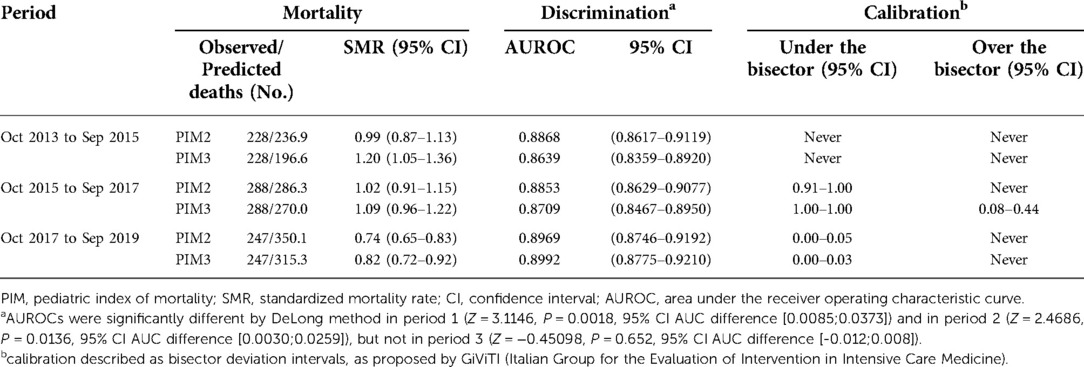
Table 4. Comparison between the performance of PIM2 and PIM3 in the in the study population in the three periods from Oct 2013 to Sep 2019.
Discussion
This study evaluated the performance of PIM2 and PIM3 in 41,541 patients admitted from 2013 to 2019 in 22 Brazilian PICUs. Both scores had a good capacity to discriminate between survivors and non-survivors, but the PIM3 showed overall better performance when evaluated only by the standardized mortality rate. However, in calibration, both overestimated mortality in the low-risk range, where more than 90% of the population studied was concentrated. PIM3 tended to underestimate mortality in medium-risk patients, and PIM2 tended to overestimate mortality in low and high-risk patients. Both scores had excellent calibration in the first two years studied, decreasing in the following four years. To our knowledge, this is the most extensive external validation study of the PIM3.
In Brazil and Latin America, PIM2 (29–35) and PIM3 (13, 14, 36, 37) validation studies were conducted in a single or a few centers and included few patients, except for the 2018 study in Argentina (14). They generally showed good discrimination but poor calibration. In these studies, PIM2 tended to underestimate mortality (29, 31, 33, 34) but overestimated in one (30). PIM3 also had good discrimination but poor calibration (13, 14, 36, 37). Only one study reported that PIM2 had good calibration using the H-L GOF test (35).
Our study population had very different characteristics from the studies that initially developed and validated PIM2 and PIM3. These had a large percentage of cardiac patients (25.5% and 26.1%), non-cardiac postoperative patients (19.2% and 21.1%), and a high percentage of trauma in the PIM2 study (9.3%). Patients with respiratory problems accounted for only 21.6% and 25.1%, respectively. In contrast, respiratory diseases accounted for 53.8% of our sample and heart disease only 1.5%. Another difference with the original PIM3 validation study was that our frequency of elective admissions was lower (9.2% vs. 41.0%), as were admissions for recovery from procedures (6.8% vs. 39.7%). In our cohort, mortality was 1.8%, a rate lower than that described in the original study (4.1% in the United Kingdom/Ireland and 2.8% in Australasia) (6). However, in our sample, among patients on invasive mechanical ventilation in the first hour, the mortality was 7.8% (9.1% for any type of ventilation), values closer to the original study of PIM3, whose mortality in this subgroup was 5.9% (United Kingdom/Ireland) and 4.8% (Australasia). Such differences can be due to the type of units (general vs. cardiac/surgical) and differences in the patient profile. The higher proportion of deaths of patients from rooms/wards, other hospitals, surgical centers, and readmissions suggests that these subgroups arrived at the ICU in worse conditions and may represent typical characteristics of these hospitals in Brazil. In our understanding, this reinforces the importance of external validation studies like ours. Still, those differences do not necessarily indicate the need to recalibrate the scores to the local setting (38).
In our sample, the SMR for PIM2 was below 1.0, indicating fewer deaths than predicted. For PIM3, it was 1.0. But looking at the SMR over time, we notice that PIM2 was more stable in the first four years (SMR around 1.0), overestimating mortality in the last two years. On the other hand, PIM3 had a progressive decline in SMR. A similar result was found by Quiñónez et al. (13). In their study, the SMR was 1.00 for PIM3 and 0.66 for PIM2. Also, the AUROC was 0.89 and 0.87, respectively, but the H-L GOF test suggested that only PIM3 had adequate calibration. In contrast, PIM3 underpredicted mortality in the other studies already cited (9, 10, 14). In any case, in our study, there was a marked reduction in the SMR for the PIM3 in the last six years (from 1.20 to 0.82). Although this is relatively expected, the intensity of the fall may be associated with some possibilities. Many participating hospitals are new. The natural maturation of teams and care processes may have positively impacted results. On the other hand, almost all hospitals participate in international accreditation programs. The PICUs managers are challenged in monthly meetings to present proposals to improve their indicators, one of them is SMR. This performance improvement may reflect a continuous improvement of processes, sentinel events handling, and hospital infrastructure investment.
Regarding the discrimination capacity, both scores had a good overall performance in our study, although we must consider that the sample had very unbalanced classes: almost 50:1 ratio of survivors vs. non-survivors. PIM2 had better discrimination power in the first four years, and PIM3 had better performance in the third study period. Two studies had similar results (12, 36).
As for calibration, the mean calibration line (without confidence intervals) for PIM2 and PIM3 deviated significantly from the ideal curve (bisector). However, the calibration belt proposed by the GiViTI group (26, 27) considers the 95% confidence interval of the calibration curve to assess the calibration. In this original approach in pediatric studies, only used in one study (16), both scores showed calibration problems, mainly in the low-risk range (0%–3%), overestimating mortality in this sample. PIM2 also overestimated mortality in the high-risk ranges (70 to 100%) but never underpredicted mortality. On the other hand, PIM3 underestimated mortality in the medium-risk range (9%–46%). These findings may have resulted from differences in the profile of the population studied in relation to the original study. Still, they may also be a result of the consolidation of results from the long period of the study.
In fact, we were able to demonstrate that the calibration varied over time. In the first two-year study period, both scores had excellent calibration. In the second period, PIM2 overestimated mortality in the high-risk range, and PIM3 underestimated in the medium-risk range. In the last period, both scores overestimated mortality in the low-risk range. This miscalibration may reflect an inadequate fit of the sample case mix or be explained by the tendency of the score calibration to drift over time (24).
Calibration was investigated in all but one study (16) using the H-L GOF test. Unlike classic statistics, in the H-L, a p-value ≥ 0.05 (i.e., not significant) indicates good calibration (24). It becomes a problem in a model with a large sample size (> 25,000), like ours, because the model can be misinterpreted as poorly calibrated even when it is not (23, 24, 28), which would happen in our study if we had used the H-L. Another criticism is the fact that the H-L result does not indicate the risk classes affected by the deviations between the observed and predicted mortality, as well as the direction of these deviations (23, 26). This has been mitigated by the use of calibrations plots between predicted and observed mortality, but these graphs are not precisely a curve, representing independent associations in each risk group; that is, the connection between the points is made only to simulate a curve, but there are no actual values in those intervals (26, 27). When using the calibration belt, the confidence intervals are calculated and plotted, allowing secure information about the statistical significance of the calibration across the entire severity spectrum (0%–100%). This can be a great advantage when populations are very different from those in which the score was developed, like ours.
One limitation of our study is that the sample was composed mainly of private hospitals and a predominance of PICUs from the southeastern region of Brazil, the most developed, which may not be representative of the entire country. However, this region concentrates most of the population and PICUs. According to the last census of the Brazilian Association of Intensive Care Medicine (39), there are 613 PICUs in Brazil, with 4,380 beds. Most are in the southeastern region, which has 52.4% of the beds. The private sector has 50% of the available beds. The country is unequal, and in large cities such as Rio de Janeiro and São Paulo, access to the private network reaches almost 50%. Still, this percentage is between 8%–22% in most of the country. Other studies evaluating a large number of patients exclusively from public PICUs in Brazil would be welcome.
In conclusion, this study showed that both scores had a good performance at discrimination ability but a poor calibration, which deteriorated over time in the population studied.
Data availability statement
The original contributions presented in the study are included in the article/Supplementary Material. Further inquiries can be directed to the corresponding author.
Ethics statement
The studies involving human participants were reviewed and approved by 1). Research Ethics Committee of the “D’Or Institute for Research and Education (IDOR)”, under the n° 3.384.961. 2). Research Ethics Committee of the “Hospital e Maternidade São Luiz)”, under the n° 3,558,506. 3). Research Ethics Committee of the Hospital Assunção, São Bernardo do Campo, SP, Brazil, under the n° 3,805,463. 4). Research Ethics Committee of the Hospital Sirio Libanês, São Paulo, SP, Brazil, under the n° 3,573,580. 5). Research Ethics Committee of the Instituto de Puericultura e Pediatria Martagão Gesteira, of the Federal University of Rio de Janeiro, Brazil, under the n° 3,707,277.. Written informed consent for participation was not provided by the participants’ legal guardians/next of kin because: The Ethics Committee of all institutions waved the informed consent, as data was retrospective and anonymized.
Author contributions
DHSG, APB, MS, FLS, MCMB and AJLAC contributed substantially to the conception and design of the study, analysis, and interpretation of the data. JCJ, DCS, SDG, LMR, IPP, JOPF, TMCB, TRRNC, MGC, CCMR, LAO, TRSA, DBP and FPFLT contributed to the acquisition, processing, and organization of the data. LPG, GS and JFMS did the statistical analysis. DHSG, MS and APB wrote the first draft. All authors critically reviewed the manuscript for important intellectual contributions and approved the final version. All authors contributed to the article and approved the submitted version.
Funding
Funding for the presented work and publishing fees was provided by the Department of Pediatrics of D'Or Institute for Research and Education (IDOR). Authors MS and AJLAC are supported by individual research grants from the National Council for Scientific and Technological Development (CNPq, grants Nº 302188/2018-5 and 306.528/2019, respectively) and Carlos Chagas Filho Foundation for Research Support of the State of Rio de Janeiro (FAPERJ, grants Nº E-26/201.057/2022 and E-26/201.121/2021, respectively). Author MCMB is supported by individual research grant from the Carlos Chagas Filho Foundation for Research Support of the State of Rio de Janeiro (FAPERJ, grant Nº E-26/201.461/2021).
Acknowledgments
We thank the following collaborating authors, from the Brazilian Research Network in Pediatric Intensive Care (BRnet-PIC), in alphabetical order (all from Rio de Janeiro state, Brazil): Simone Camera Gregory, Hospital Norte D'Or; Melissa de Lorena Jacques, Hospital Quinta D'Or; João Henrique Garcia Cobas Macedo, Hospital Copa D'Or; Rosa Jurema Moreira Novelli, Hospital Estadual da Criança; Mariana Barros Genuíno de Oliveira, Instituto D'Or de Pesquisa e Ensino (IDOR); Anderson Gonçalves Panisset, Instituto de Puericultura e Pediatria Martagão Gesteira (IPPMG-UFRJ); Lenira Medeiros de Morais Daibes Rachid, Hospital Jutta Batista; Paula Marins Riveiro, Hospital Caxias D'Or; Jaqueline Rodrigues Robaina, Instituto D'Or de Pesquisa e Ensino (IDOR); Gustavo Rodrigues-Santos, Instituto D'Or de Pesquisa e Ensino (IDOR); Ana Carolina Cabral Pinheiro Scarlato, Hospital Rios D'Or; Thiago Peres da Silva, Hospital Real D'Or; Ana Carolina Miranda C F F Souza, Hospital Oeste D'Or, and Maria Carvalho Laborne Valle, Instituto de Puericultura e Pediatria Martagão Gesteira (IPPMG-UFRJ).
Conflict of interest
MS is the founder and equity shareholder of Epimed Solutions®, which commercializes the Epimed Monitor System®. LPB and GS are employees at Epimed Solutions. The remaining authors declare that the research was conducted in the absence of any commercial or financial relationships that could be construed as a potential conflict of interest.
Publisher's note
All claims expressed in this article are solely those of the authors and do not necessarily represent those of their affiliated organizations, or those of the publisher, the editors and the reviewers. Any product that may be evaluated in this article, or claim that may be made by its manufacturer, is not guaranteed or endorsed by the publisher.
Supplementary material
The Supplementary Material for this article can be found online at: https://www.frontiersin.org/articles/10.3389/fped.2022.1036007/full#supplementary-material.
References
1. Marcin JP, Pollack MM. Review of the methodologies and applications of scoring systems in neonatal and pediatric intensive care. Pediatr Crit Care Med. (2000) 1(1):20–7. doi: 10.1097/00130478-200007000-00004
2. Lacroix J, Cotting J. Pediatric acute lung injury and sepsis investigators (PALISI) network. Severity of illness and organ dysfunction scoring in children. Pediatr Crit Care Med. (2005) 6(3 Suppl):S126–34. doi: 10.1097/01.PCC.0000161287.61028.D4
3. Slonim A, Marcin J, Pollack M. Severity-of-Illness measurement: foundations, principles, and applications. In: Nichols DG, Shaffner DH (Eds). Rogers’ textbook of pediatric intensive care. 5th edition. Riverwoods: Wolters Kluver, (2015), pp 96–102.
4. Shann F, Pearson G, Slater A, Wilkinson K, Slater A. Paediatric index of mortality (PIM): a mortality prediction model for children in intensive care. Intensive Care Med. (1997) 23:201–7. doi: 10.1007/s001340050317
5. Slater A, Shann F, Pearson G. PIM2: a revised version of the paediatric Index of mortality. Intensive Care Med. (2003) 29(2):278–85. doi: 10.1007/s00134-002-1601-2
6. Straney L, Clements A, Parslow RC, Pearson G, Shann F, Alexander J, et al. Paediatric index of mortality 3: an updated model for predicting mortality in pediatric intensive care. Pediatr Crit Care Med. (2013) 14(7):673–81. doi: 10.1097/PCC.0b013e31829760cf
7. Mourouga P, Goldfrad C, Rowan KM. Does it fit? Assessment of scoring systems. Curr Opin Crit Care. (2000) 6(3):176–80. doi: 10.1097/00075198-200006000-00006
8. Lee OJ, Jung M, Kim M, Yang HK, Cho J. Validation of the pediatric index of mortality 3 in a single pediatric intensive care unit in Korea. J Korean Med Sci. (2017) 32:365–70. doi: 10.3346/jkms.2017.32.2.365
9. Sari DSP, Saputra I, Triratna S, Saleh I. The pediatric index of mortality 3 score to predict mortality in a pediatric intensive care unit in palembang, south sumatra, Indonesia. Paediatr Indones. (2017) 57(3):164–70. doi: 10.14238/pi57.3.2017.164-70
10. Wong JJ, Hornik CP, Mok YH, Loh TF, Lee JH. Performance of the paediatric Index of mortality 3 and paediatric logistic organ dysfunction 2 scores in critically ill children. Ann Acad Med Singapore. (2018) 47(8):285–90. doi: 10.47102/annals-acadmedsg.V47N8p285
11. Sankar J, Singh A, Sankar MJ, Joghee S, Dewangan S, Dubey N. Pediatric index of mortality and PIM2 scores have good calibration in a large cohort of children from a developing country. Biomed Res Int. (2014) 2014:907871. Published online 2014 Jun 15. doi: 10.1155/2014/907871
12. Tyagi P, Tullu MS, Agrawal M. Comparison of pediatric risk of mortality III, pediatric Index of mortality 2, and pediatric Index of mortality 3 in predicting mortality in a pediatric intensive care unit. J Pediatr Intensive Care. (2018) 7(4):201–6. doi: 10.1055/s-0038-1673671
13. Quiñónez-López D, Patino-Hernandez D, Zuluaga CA, García ÁA, Muñoz- Velandia OM. Comparison of performance of the pediatric Index of mortality (PIM)-2 and PIM-3 scores in the pediatric intensive care unit of a high complexity institution. Indian J Crit Care Med. (2020) 24(11):1095–102. doi: 10.5005/jp-journals-10071-23659
14. Arias López MP, Boada N, Fernández A, Fernández AL, Ratto ME, Serrate AS, et al. Performance of the pediatric index of mortality 3 score in PICUs in Argentina: a prospective, national multicenter study. Pediatr Crit Care Med. (2018) 19:e653–61. doi: 10.1097/PCC.0000000000001741
15. Wolfler A, Osello R, Gualino J, Calderini E, Vigna G, Santuz P, et al. The importance of mortality risk assessment: validation of the pediatric Index of mortality 3 score. Pediatr Crit Care Med. (2016) 17:251–6. doi: 10.1097/PCC.0000000000000657
16. Jacobs A, Flechet M, Vanhorebeek I, Verstraete S, Ingels C, Casaer MP, et al. Performance of pediatric mortality prediction scores for PICU mortality and 90- day mortality. Pediatr Crit Care Med. (2019) 20(2):113–9. doi: 10.1097/PCC.0000000000001764
17. Solomon LJ, Naidoo KD, Appel I, Doedens LG, Green RJ, Long MA, et al. Pediatric Index of mortality 3-an evaluation of function among ICUs in South Africa. Pediatr Crit Care Med. (2021) 22(Suppl. 1 3S):279. doi: 10.1097/01.pcc.0000740584.79744.bf
18. Alkhalifah AS, Alsoqati A, Zahraa J. Performance of Pediatric Risk of Mortality III and Pediatric Index of Mortality III Scores in Tertiary Pediatric Intensive Unit in Saudi Arabia. Front Pediatr. (2022) 10:926686. doi: 10.3389/fped.2022.926686
19. Keegan MT, Gajic O, Afessa B. Severity of illness scoring systems in the intensive care unit. Crit Care Med. (2011) 39(1):163–9. doi: 10.1097/CCM.0b013e3181f96f81
20. Zampieri FG, Soares M, Borges LP, Figueira Salluh JI, Ranzani OT. The epimed monitor ICU database®: a cloud-based national registry for adult intensive care unit patients in Brazil. Rev Bras Ter Intensiva. (2017) 29(4):418–26. doi: 10.5935/0103-507X.20170062
21. Feudtner C, Feinstein JA, Zhong W, Hall M, Dai D. Pediatric Complex chronic conditions classification system version 2: updated for ICD-10 and complex medical technology dependence and transplantation. BMC Pediatr. (2014) 14:199. doi: 10.1186/1471-2431-14-199
22. DeLong ER, DeLong DM, Clarke-Pearson DL. Comparing the areas under two or more correlated receiver operating characteristic curves: a nonparametric approach. Biometrics. (1988) 44(3):837–45. doi: 10.2307/2531595
23. Poole D, Rossi C, Latronico N, Rossi G, Finazzi S, Bertolini G, et al. Comparison between SAPS II and SAPS 3 in predicting hospital mortality in a cohort of 103 Italian ICUs. Is new always better? Intensive Care Med. (2012) 38(8):1280–8. doi: 10.1007/s00134-012-2578-0
24. Kramer AA, Zimmerman JE. Assessing the calibration of mortality benchmarks in critical care: the hosmer-lemeshow test revisited. Crit Care Med. (2007) 35(9):2052–6. doi: 10.1097/01.CCM.0000275267.64078.B0
25. Paul P, Pennell ML, Lemeshow S. Standardizing the power of the hosmer- lemeshow goodness of fit test in large data sets. Stat Med. (2013) 32(1):67–80. doi: 10.1002/sim.5525
26. Finazzi S, Poole D, Luciani D, Cogo PE, Bertolini G. Calibration belt for quality-of-care assessment based on dichotomous outcomes. PLoS One. (2011) 6(2):e16110. doi: 10.1371/journal.pone.0016110
27. Nattino G, Finazzi S, Bertolini G. A new calibration test and a reappraisal of the calibration belt for the assessment of prediction models based on dichotomous outcomes. Statist Med. (2014) 33(14):2390–407. doi: 10.1002/sim.6100
28. Keegan MT, Soares M. What every intensivist should know about prognostic scoring systems and risk-adjusted mortality. Rev Bras Ter Intensiva. (2016) 28(3):264–9. doi: 10.5935/0103-507X.20160052
29. Lopez MP A, Fernández AL, Ratto ME, Saligari L, Serrate AS, Ko IJ, et al. PIM2 Latin American group. Pediatric Index of mortality 2 as a predictor of death risk in children admitted to pediatric intensive care units in Latin America: a prospective, multicenter study. J Crit Care. (2015) 30(6):1324–30. doi: 10.1016/j.jcrc.2015.08.001
30. Eulmesekian PG, Pérez A, Minces PG, Ferrero H. Validation of pediatric index of mortality 2 (PIM2) in a single pediatric intensive care unit of Argentina. Pediatr Crit Care Med. (2007) 8(1):54–7. doi: 10.1097/01.pcc.0000256619.78382.93
31. Fonseca JGD, Ferreira AR. Application of the pediatric Index of mortality 2 in pediatric patients with complex chronic conditions. J Pediatr (Rio J). (2014) 90(5):506–11. doi: 10.1016/j.jped.2014.01.010
32. Canonero I, Figueroa A, Cacciamano A, Olivier E, Cuestas E. Validación de los puntajes de mortalidad PRISM y PIM2 en una unidad de cuidados intensivos pediátricos de córdoba. Arch Argent Pediatr. (2010) 108(5):427–33. Available at: http://www.scielo.org.ar/scielo.php?script=sci_arttext&pid=S0325-00752010000500008&lng=es&nrm=iso. Accessed on November 29, 2022.21132231
33. Farias ECF, Carvalho PB, Nascimento LMPP, Mello MLFMF, de Abreu Santana A, Diniz SS, et al. Desempenho do pediatric risk of mortality (PRISM) e pediatric Index of mortality 2 (PIM2) em unidade de terapia intensiva pediátrica terciária na amazônia brasileira. Rev Pan-Amaz Saude [Online]. (2019) 10:e201900080. doi: 10.5123/s2176-6223201900080
34. Fernández AL, Arias López MP, Ratto ME, Saligari L, Siaba Serrate A, de la Rosa M. Validación del índice pediátrico de mortalidad 2 (PIM2) en Argentina: un estudio prospectivo, multicéntrico, observacional. Arch Argentin Pediatr. (2015) 113(3):221–8. doi: 10.5546/aap.2015.221
35. Netto AL, Muniz VM, Zandonade E, Maciel ELN, Bortolozzo RN, Costa NF, et al. Desempenho do pediatric Index of mortality 2 em unidade de cuidados intensivos pediátrica. Rev Bras Ter Intensiva. (2014) 26(1):44–50. doi: 10.5935/0103-507X.20140007
36. Fucks AA, Arantes KLO, Garcia PCR, de Azevedo ALT, do Canto ÊS, Costa CAD, et al. Pediatric Index of mortality 3 validation in the southeast and south of Brazil: a multicenter study. J Crit Care. (2017) 42:421. doi: 10.1016/j.jcrc.2017.09.163
37. Arantes KL, Fucks AA, Garcia PCR, Tonial CT, Einloft PR, Costa CAD, et al. Calibration and concordance between the 2 versions of pediatric Index of mortality (PIM2×PIM3) in 2 independent samples. J Crit Care. (2017) 42:421–2. doi: 10.1016/j.jcrc.2017.09.165
38. Shann F. Are we doing a good job: pRISM, PIM and all that. Intensive Care Med. (2002) 28(2):105–7. doi: 10.1007/s00134-001-1186-1
39. Brazilian Association of Intensive Care Medicine. Associação de Medicina Intensiva Brasileira. Censo AMIB 2016. [Internet]. Available at: https://www.amib.org.br/censo-amib/. Accessed on November 29, 2022.
Keywords: validation study, mortality, intensive care units, pediatric, benchmarking, PIM3, PIM2
Citation: Genu DHS, Lima-Setta F, Colleti J, de Souza DC, Gama SD, Massaud-Ribeiro L, Pistelli IP, Proença Filho JO, Bernardi Thaís de Mello Cesar, de Castilho Taísa Roberta Ramos Nantes, Clemente MG, Borsetto Cibele Cristina Manzoni Ribeiro, de Oliveira LA, Alves TRS, Pedroso DB, La Torre FPF, Borges LP, Santos G, Mello e Silva Juliana Freitas de, de Magalhães-Barbosa MC, da Cunha Antonio José Ledo Alves, Soares M and Prata-Barbosa A (2022) Multicenter validation of PIM3 and PIM2 in Brazilian pediatric intensive care units. Front. Pediatr. 10:1036007. doi: 10.3389/fped.2022.1036007
Received: 3 September 2022; Accepted: 21 November 2022;
Published: 14 December 2022.
Edited by:
Brenda M. Morrow, University of Cape Town, South AfricaReviewed by:
Lincoln John Solomon, University of the Free State, South AfricaFaruk Ekinci, Çukurova University, Turkey
© 2022 Genu, Lima-Setta, Colleti, de Souza, Gama, Massaud-Ribeiro, Pistelli, Proença Filho, Bernardi, de Castilho, Clemente, Borsetto, de Oliveira, Alves, Pedroso, La Torre, Borges, Santos, Mello e Silva, de Magalhães-Barbosa, Alves da Cunha, Soares, Prata-Barbosa and and The Brazilian Research Network in Pediatric Intensive Care (BRnet-PIC). This is an open-access article distributed under the terms of the Creative Commons Attribution License (CC BY). The use, distribution or reproduction in other forums is permitted, provided the original author(s) and the copyright owner(s) are credited and that the original publication in this journal is cited, in accordance with accepted academic practice. No use, distribution or reproduction is permitted which does not comply with these terms.
*Correspondence: Arnaldo Prata-Barbosa YXJuYWxkby5wcmF0YUBpZG9yLm9yZw==
†These authors have contributed equally to this work and share senior authorship
Specialty Section: This article was submitted to Pediatric Critical Care, a section of the journal Frontiers in Pediatrics