 Iva Pospisilova
 Helena L. Brodska3
 Marketa Bloomfield
94% of researchers rate our articles as excellent or good
Learn more about the work of our research integrity team to safeguard the quality of each article we publish.
Find out more
ORIGINAL RESEARCH article
Front. Pediatr. , 09 January 2023
Sec. Neonatology
Volume 10 - 2022 | https://doi.org/10.3389/fped.2022.1019825
Objectives: To evaluate the efficacy of presepsin (P-SEP) as a potential biomarker of early-onset neonatal sepsis (EOS) and compare it to other routinely used markers of inflammation. To establish the cut-off values of P-SEP for EOS.
Study design: 184 newborns were prospectively recruited between January 2018 to December 2020. Newborns >34th gestational week with suspected infection were included up to 72 h after delivery, and divided into three categories (i.e., unlikely, possible, and probable infection) based on risk factors, clinical symptoms and laboratory results. Values of plasma P-SEP were sequentially analyzed.
Results: Median values of P-SEP in newborns with probable infection were significantly higher compared to healthy newborns (p = 0.0000013) and unlikely infection group (p = 0.0000025). The AUC for discriminating the probable infection group from the unlikely infection group was 0.845 (95% Cl: 0.708–0.921). The diagnostic efficacy of P-SEP was highest when used in combination with IL-6 and CRP (0.97; 95% CI: 0.911–0.990). The optimal cut-off value of P-SEP was determined to be 695 ng/L.
Conclusion: P-SEP, when combined with IL-6 and CRP, may be utilized as a negative predictive marker of EOS (NPV 97.2%, 95% CI: 93.3–101), especially in newborns at low to medium risk of infection.
Inflammation is an organism's defensive response to damage to its integrity. The hallmark of innate immunity is the ability to recognize and react to a broad spectrum of pathogens mediated by pathogen-associated molecular patterns (1). An excessive, underregulated systemic inflammatory response to infectious stimuli underlies the development of sepsis (2).
Despite the decreasing incidence of early-onset neonatal sepsis (EOS) in the last 20 years, mainly owing to the EOS risk factors awareness, the implementation of group B Streptococcus (GBS) screening programs for expectant mothers and antibiotic prophylaxis during delivery, sepsis remains one of the most common causes of newborn mortality and morbidity (3). Therefore, timely diagnosis and early initiation of appropriate treatment is of utmost importance.
The diagnosis of neonatal sepsis is challenging and, to this day, neither a single over-arching definition of neonatal sepsis nor any unified diagnostic criteria exist (4). The established consensual definition put forth by the International Pediatric Sepsis Consensus Conference in 2005 defined pediatric sepsis as the presence of >2 criteria for Systematic Inflammatory Response Syndrome (SIRS) (one of which must be temperature or leukocyte count) in the setting of suspected or proven infection. However, such diagnostic criteria are suboptimal in term and premature newborn infants (5).
Aiming to increase the prognostic accuracy, a new definition of sepsis was accepted in 2016 (6). This definition moves away from nonspecific risk factors towards the emphasis on organ dysfunction quantified by a scoring system—the sequential organ failure assessment (SOFA score) or its abbreviated version (qSOFA). However, the applicability of this definition extends poorly beyond the adult population it was designed and tested for. Most importantly, it does not appropriately reflect the pediatric variations such as age-specific vital signs parameters (e.g., blood pressure, heart rate, breathing frequency, cognitive state) (7).
For these reasons, positive blood culture remains the gold standard for defining newborn sepsis in spite of its drawbacks. Blood culture process is a time-consuming method, requires a larger sample volume (8), its sensitivity is low and the results are often compromised by prenatal antibiotic use (9–11).
Due to the need to distinguish between neonatal systemic infectious response (overt sepsis) and non-infectious SIRS, new biomarkers indicating/excluding the presence of an infectious agent are highly sought-after to help guide the therapeutic decisions, especially when blood culture results are negative.
All currently available biomarkers of infection have relatively low specificity and sensitivity affected by postnatal physiology, delayed dynamics and individually variable metabolism, and disparities in reference ranges, all of which are highly dependent on the gestational age of the child.
The complete blood count with differential (CBC) is used in the diagnosis of neonatal sepsis; however, a single time-point sampling has a low predictive value. C-reactive protein (CRP) has only limited diagnostic potential in the early stages of sepsis due to the delayed induction of its hepatic synthesis and the presence of other infection-independent inductive factors. In addition, CRP levels on admission are similar in neonates with positive and negative blood cultures for suspected EOS (12). The utility of procalcitonin (PCT), one the most widely used markers of sepsis, is hampered in neonates mainly by its dependence on gestational and postnatal age, as the levels of PCT can be physiologically elevated up to 48 h after the delivery (13, 14). Lastly, the use of interleukin 6 (IL-6), a highly sensitive predictor of EOS, is limited by its low specificity due to its responsiveness to a myriad of other non-infectious conditions (3). Although the diagnostic efficacy of the aforementioned markers is improved when combined, an identification of a singular marker of EOS with a high degree of sensitivity and positive predictive value (PPV) would benefit the clinical practice.
Presepsin (P-SEP), the soluble N terminal fragment of CD14, is a novel promising biomarker with higher prognostic potential than PCT in early stages of sepsis. It is physiologically expressed on the surface of monocytes and macrophages and is excessively shed into the systemic circulation upon stimulation by exogenous antigens of bacterial origin, such as bacterial lipopolysaccharide. The concentration of P-SEP in blood starts to increase within 2 h after induction, peaks at 3 h and remains elevated for up to 4–5 h (15). As such, P-SEP induction precedes the other routinely used markers of inflammation. To practical advantage, the analysis may be performed via point-of-care testing and requires minimal amount of whole blood or plasma (120 µl).
The focus of this study is to evaluate the utility of P-SEP in the diagnosis of EOS and to compare its performance with markers of inflammation that are currently in routine clinical use.
Newborns born between 34th and 42nd week of gestation, who were admitted to the neonatal intensive care (NICU) of Thomayer University Hospital in Prague, Czech Republic, from January, 2018 to December, 2020 with clinical signs of infection developing within the first 72 postnatal hours were selected for this prospective study. Sequential sampling was performed at 12–24 h (T1) and 36–72 h (T2) intervals from the initial sampling (T0). Subjects selected for this study were sampled for an extra micro sample or „cap” (0.5 ml) during routine blood collections. Routinely used markers of inflammation (IL-6, PCT, CRP) were measured on the day of sampling from fresh serum, the CBC was measured from samples collected in EDTA-coated test tubes. For P-SEP concentration, plasma was centrifuged, aliquoted and stored frozen at −20 °C temperature to enable serial analysis.
Study subjects were divided into groups based on published criteria (16), as follows:
I. Risk factors (A)
a. mother group B Streptococcus positive
b. clinical &/or histological signs of maternal chorioamnionitis
c. premature rupture membranes ≥18 h
d. gestational age less than 37th week of pregnancy
II. Clinical symptoms (B)
a. signs of respiratory distress or apnea
b. tachycardia/bradycardia
c. arterial hypotension
d. hypothermia/hyperthermia
e. lethargy/increased irritability
f. vomiting/fluid intolerance, signs of ileus
III. Laboratory findings (C)
a. white blood cell count below 5 × 10⁹/L
b. CRP > 10 mg/L
The selection of at least 1 criterion from each of the subgroups would earn 1 point, for a total of 3 points. Newborns were divided into the following groups (see Figure 1, Table 1) based on the obtained score from the subgroups A, B & C in addition to the blood culture (BC) results:
• Unlikely infection (low-risk, R1)—BC negative + total score 0–1 point
• Possible infection (medium-risk, R2)—BC negative + total score 2 points
• Probable infection (high-risk, R3)—BC negative + total score 3 points
• Proven infection—BC positive + total score ≥ 1 point
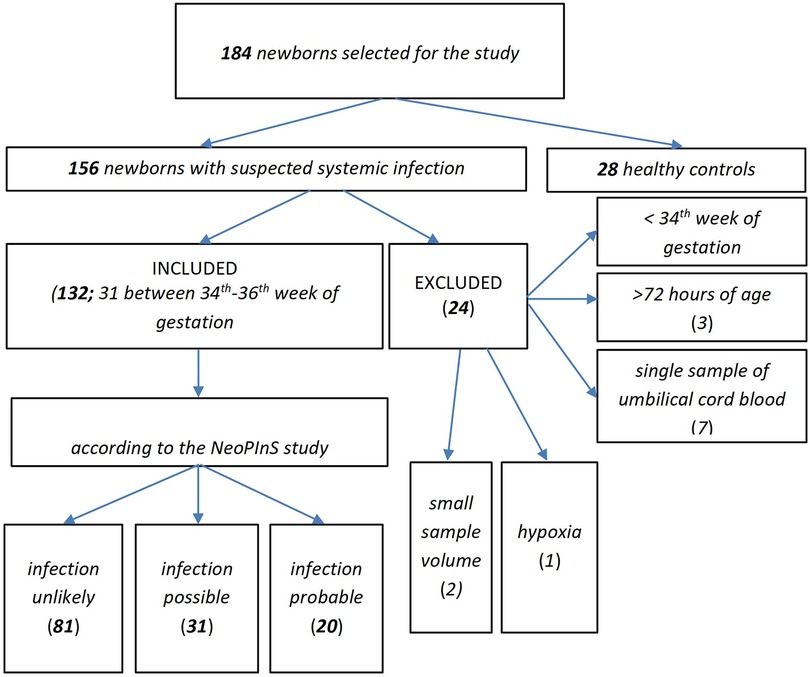
Figure 1. Representation of newborns in the study.
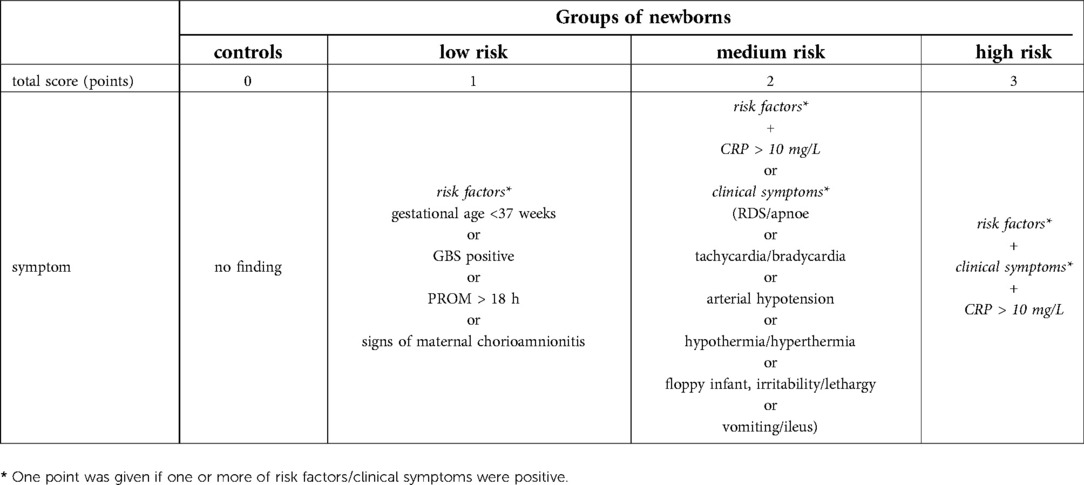
Table 1.. The clinical criteria of neonatal sepsis. GBS-group B Streptococcus, PROM-premature rupture of membranes, RDS-respiratory distress syndrome.
The control group (0 points; n = 28) was recruited from healthy newborns with physiologic postnatal period, sampled up to 9 h after delivery. Umbilical cord blood samples were obtained from the majority of the healthy subjects, venous blood was sampled in the minority. Plasma levels of P-SEP and CRP were measured.
The study was carried out according to the Declaration of Helsinki, with the consent of the local ethics committee (Docket No.: G-17–06-06). Written informed consents to participate in the study were obtained from legal guardians of all included subjects.
Serum concentrations of PCT and IL-6 were measured using the electrochemiluminescent (ECLIA) assays in the Cobas (Roche Diagnostics) analyzer. CRP was measured using immuno-turbidometry in the Cobas/Modular (Roche Diagnostics) analyzer. P-SEP plasma concentration was measured using the PATHFAST™ analytic system (Mitsubishi, MEDESA s.r.o.) based on chemiluminescent enzymatic immunoanalysis (CLEIA). Blood count and differential was measured via fluorescent flow cytometry using the XN 3000 analyzer (Sysmex).
0.5–1 ml of blood was added to cultivation media (Bactec Peds Plus/F) and incubated at a temperature of 37 °C for 7 days. Positive bottles were subcultured on blood agar and MacConkey agar. Isolated microbes were indentified using standard bacteriological methods.
Receiver operating characteristics (ROC) were used for the discrimination between the risk of infection (low, medium, high) based on the basal levels of presepsin and further markers. The relationship between the basal presepsin levels and risk of infection was further investigated by robust Kruskal-Wallis test followed Dunn's multiple comparisons with Bonferroni correction. The relationships between the time profiles of presepsin levels and degrees of infection was evaluated using the ANOVA model consisting of subject factor, between-subject factor Risk of infection (low, medium, high), within-subject factor Hour (0, 12–36, 48–72) and Risk of infection × Hour interaction followed by Bonferroni multiple comparisons. The original continuous data were transformed by a power transformation to attain constant variance and symmetric distribution. The symmetry of distribution, stability of variance and homogeneity of the transformed data and residuals were checked using diagnostic plots. This was followed by ANOVA analysis. The obtained results were transformed back to the original scale in order to be displayed graphically. The relationships between one dependent variable and the set of mutually intercorrelated explaining variables were analyzed using a multivariate regression with a reduction of dimensionality (orthogonal projections to latent structure, OPLS). To estimate the relationships between the dependent variables and the set of explaining variables independently of intercorrelations, the ordinary multiple regression was also applied. Similar to ANOVA testing, statistical analysis was carried out using OPLS analysis and multiple regression analysis was performed using the transformed data. Statistical software NCSS v. 12 from Number Cruncher Statistical Systems (Kaysville, Utah, United States), Statgraphics Centurion 18 v. 18. 1. 06 from Statgraphics Technologies Inc. (The Plains, Maryland, United States) and SIMCA v. 12. 0.0.0. from Umetrics (Umeå, Sweden) were used for the data analyses.
A total of 184 subjects were included into this study, 156 with suspicion of systemic infection and 28 healthy controls (HCs). The subjects excluded from the initial cohort of suspected infection were: newborns <34th week of gestational age (n = 11); newborns older than 72 h (n = 3); newborns with only a single time-point sampling of umbilical blood (n = 7); newborns who were sampled for insufficient quantity of blood (n = 2); and 1 newborn with abnormal EEG due to severe intrauterine hypoxia.
The remaining newborns (n = 132) were divided into 3 subgroups based on the criteria from The Neonatal PCT Intervention Study [(16), see Figure 1] which segregated as follows: unlikely infection = low-risk (R1; n = 81), possible infection = medium-risk (R2; n = 31), and probable infection = high-risk (R3; n = 20).
The “proven infection” subgroup (positive blood culture + total score ≥ 1) had to be omitted due to the absence of any positive blood culture results within the studied cohort.
There were no significant differences in birth weight, gender, gestational age, and APGAR score at 1 min among the subgroups. A significantly lower APGAR scores were observed at 5 min in the R2 group (p = 0.024) and at 10 min in the R2 & R3 subgroups (p < 0.001) compared to the HCs (R0). Higher frequency of caesarean sections was observed in groups R0 & R1 (low-risk) (Table 2).
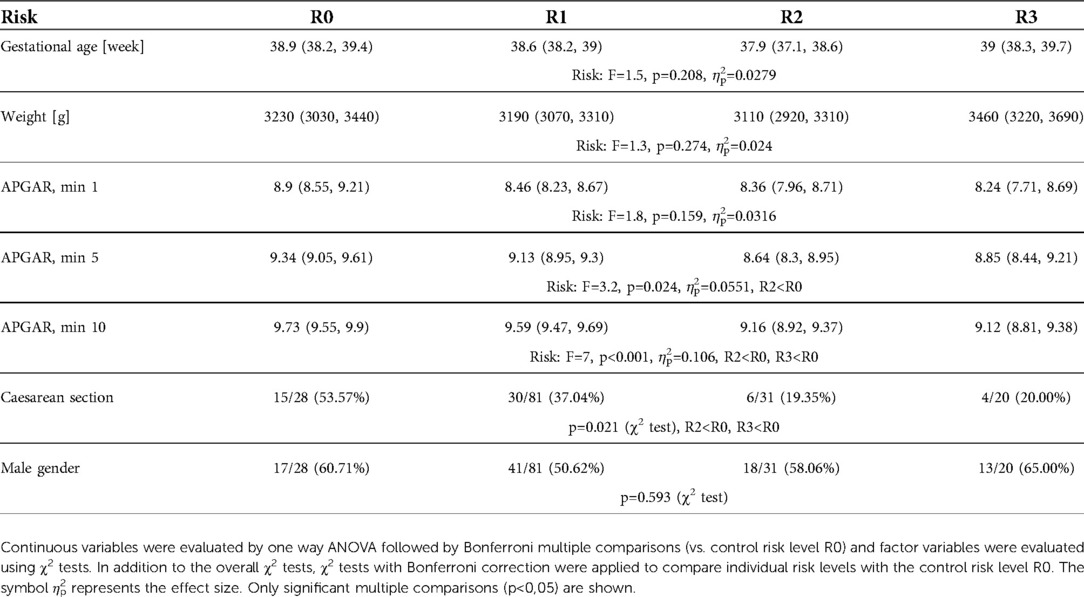
Table 2.. The selected clinical characteristics in each studied subgroup (R0 - healthy control, R1 – low-risk, R2 - medium-risk, R3 - high-risk)
At the time of first symptom onset (T0), the concentration of P-SEP was significantly higher in the high-risk group (median 766 ng/L, IQR 697–1189 ng/L) compared to the low-risk group (median 466 ng/L, IQR 363–663 ng/L; p = 0.0000025) and HCs (median 445 ng/L, IQR 339–582 ng/L; p = 0.0000013). In the medium-risk group, the P-SEP concentration (median 592 ng/L, IQR 423–720 ng/L) did not differ significantly from the low-risk group and HCs (Figure 2).
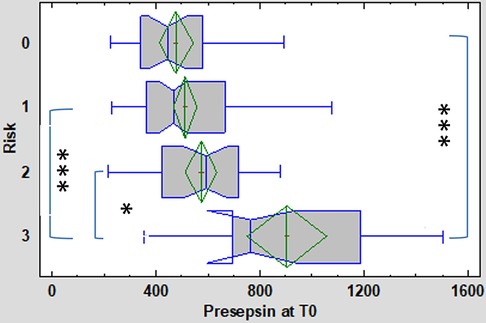
Figure 2. Presepsin (P-SEP) levels at T0 (onset of symptoms) in the 3 subgroups (low [1], medium [2], high-risk [3]) of enrolled neonates and healthy controls [0]. Kruskal-Wallis test followed by robust Dunn's multiple comparisons with Bonferroni correction was used to evaluate between group differences. Vertical lines symbolize medians, boxes indicate interquartile range, whiskers indicate the limits for data homogeneity, and crosses with rhombs symbolize means with SDs. ***p < 0.001, *p < 0.05.
CRP concentration at symptoms onset (T0) differed between the high-risk group (median 11.4 mg/L, IQR 1.6–30.6 mg/L) compared to HCs (median 0.2 mg/L, IQR 0.1–0.6 mg/L), as well as between the medium-risk (median 1 mg/L, IQR 0.6–7.4 mg/L) and low-risk groups (median 0.6 mg/L, IQR 0.6–2.0 mg/L). A significant difference was also apparent between the low-risk and high-risk groups (Figure 3). The concentration of CRP did not differ significantly between the low-risk and medium-risk group and between the medium-risk and high-risk group.
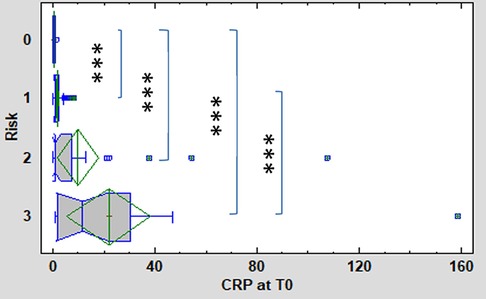
Figure 3. CRP levels at T0 (onset of symptoms) in the 3 subgroups (low [1], medium [2], high-risk [3]) of enrolled neonates and healthy controls [0]. Kruskal-Wallis test followed by robust Dunn's multiple comparisons with Bonferroni correction was used to evaluate between group differences. Vertical lines symbolize medians, boxes indicate interquartile range, whiskers indicate the limits for data homogeneity, and crosses with rhombs symbolize means with SDs. ***p < 0.001.
Figure 4 displays the association of mean levels of P-SEP, IL-6, PCT and CRP with selected variables. A-D refer to the associations of each biomarker with the degree of risk of infection at the time of symptom onset (T0), E-H illustrate the association of each biomarker with sampling timepoints, CH-K depict the resulting interaction between both variables.
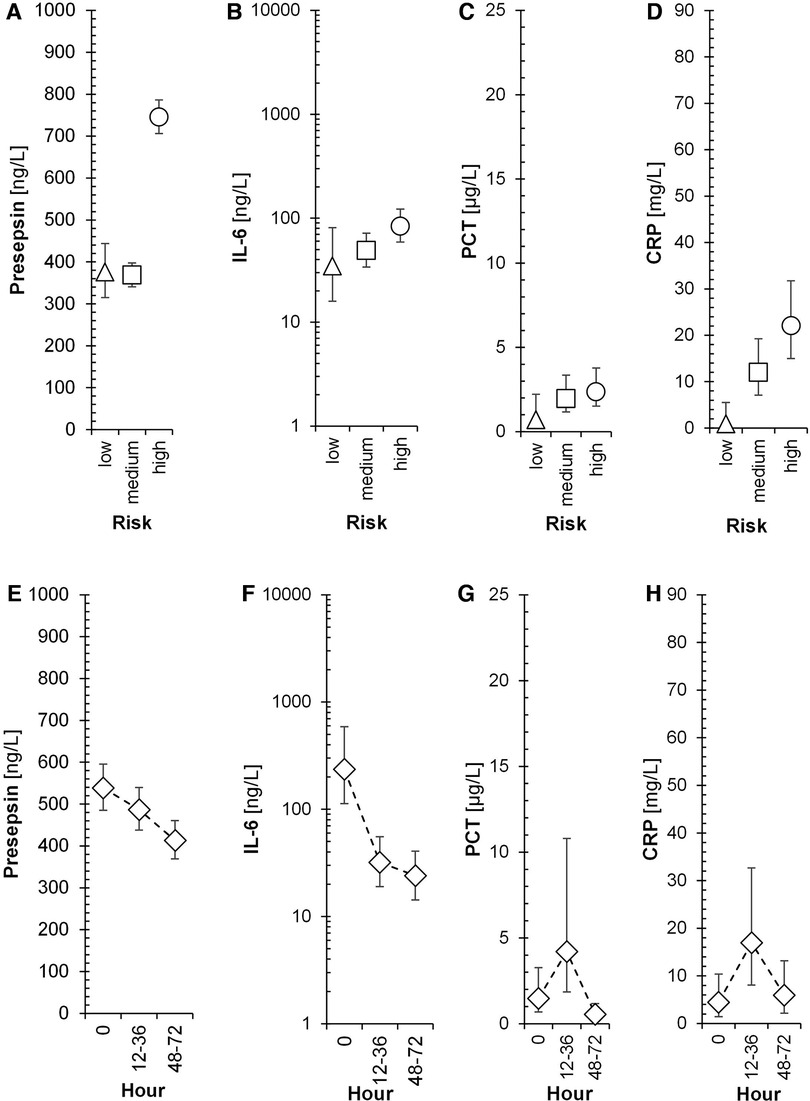
Figure 4. Time-dependent dynamics of presepsin and other biomarkers in the 3 subgroups of neonates. Triangles, squares, and circles with error bars symbolize re-transformed means with their 95% confidence intervals after Bonferroni correction for low-risk, medium-risk and high-risk group, respectively as evaluated by ANOVA model consisting of between subject factor Risk of infection, within-subject factor Hour, and Subject factor (explaining inter-individual variance) followed by Bonferroni multiple comparisons. Presepsin-Risk: F = 113.9, p < 0.001, ηp2 = 0.37; Hour: F = 5.5, p = 0.013, ηp2 = 0.0276; Risk × Hour: F = 1.6, p = 0.209, ηp2 = 0.0165; Subj(Risk): F = 8.9, p < 0.001, ηp2 = 0.186; IL-6-Risk: F = 2.8, p = 0.088, ηp2 = 0.0362; Hour: F = 13.7, p < 0.001, ηp2 = 0.157; Risk × Hour: F = 1.9, p = 0.147, ηp2 = 0.0498; Subj(Risk): F = 3, p = 0.018, ηp2 = 0.171; PCT-Risk: F = 1.7, p = 0.214, ηp2 = 0.0388; Hour: F = 5.7, p = 0.011, ηp2 = 0.121; Risk × Hour: F = 0.4, p = 0.836, ηp2 = 0.017; Subj(Risk): F = 3.9, p = 0.005, ηp2 = 0.321; CRP-Risk: F = 7.9, p = 0.003, ηp2 = 0.169; Hour: F = 2.7, p = 0.091, ηp2 = 0.0653; Risk × Hour: F = 0.5, p = 0.733, ηp2 = 0.0254; Subj(Risk): F = 2.4, p = 0.05, ηp2 = 0.233; F, p, and ηp2 represent F-statistic, p-value, and effect size, respectively; ηp2 = 0.01, 0.06, and >0.14 are small, medium, and large effect size.
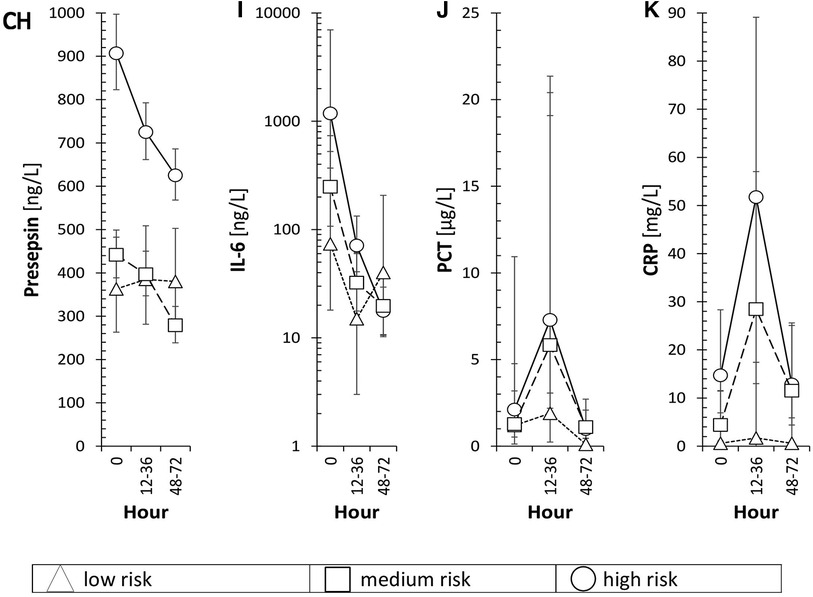
Figure 4. Risk, hour and both variables of individual inflammatory markers is in the text of Figure 4.
The association of mean levels of P-SEP, IL-6, PCT and CRP with the risk of infection at T0 was strong for P-SEP (Figure 4A, p < 0.001) and CRP (Figure 4D, p = 0.003) and weak for PCT (Figure 4C, p = 0.214) and IL-6 (Figure 4B, p = 0.088). All evaluated inflammatory parameters, except of CRP (Figure 4H, p = 0.091), demonstrated a strong dependency on the time of sampling (Figures 4E–H). The increase of PCT at 12–36 h from T0 did not reach expected statistical significance; however, the decline in its concentration at 48–72 h was significant (p < 0.05). The concentrations of P-SEP and IL-6 did not increase past T0 values at subsequent samples but, unlike PCT and CRP, their levels, at post-initial samples showed significant decreases (Figure 4E, p = 0.013; Figure 4F p < 0.001).
The sensitivity and specificity of P-SEP across the studied subgroups at T0 were evaluated, compared to the low-risk group and HCs (Table 3; Figure 5).
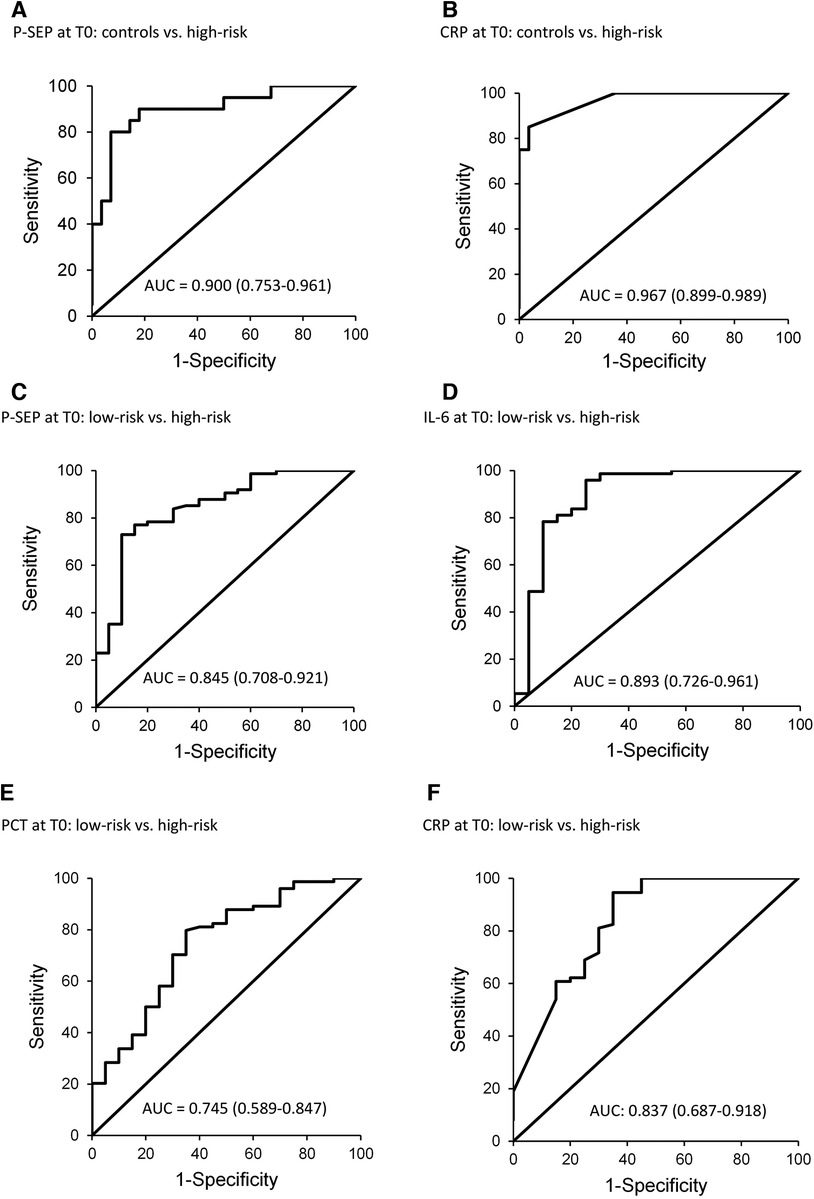
Figure 5. ROC curves for P-SEP, CRP at T0 (onset of symptoms) in healthy controls, and in the group low-risk extra PCT and IL-6 at T0 (onset of symptoms) in the group low-risk.
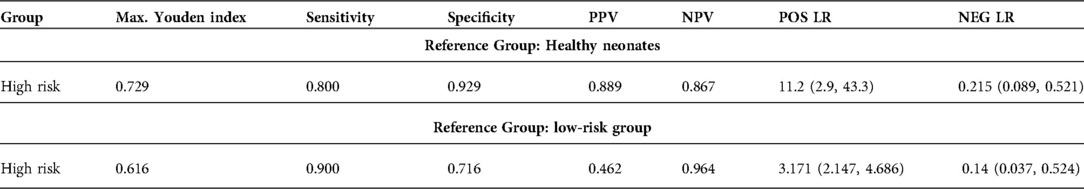
Table 3.. Diagnostic criteria of P-SEP at T0 using HCs/low-risk group as reference. PPV: positive predictive value, NPV: negative predictive value, POS LR: positive likelihood ratio. NEG LR: negative likelihood ratio. Confidence intervals are in parentheses.
Figure 5 depicts the diagnostic power of P-SEP, i.e., its ability to discriminate newborns at high-risk from healthy and low-risk newborns (Figures 5A,C). The observed differences between HCs [AUC = 0.9 (0.753–0.961)] and low-risk groups [AUC = 0.845 (0.708–0.921)] were not significant (see Figure 2).
Further, Figures 5D–F shows the diagnostic power of other inflammatory parameters compared to the low-risk group, due to the higher number of subjects in the group (n = 81) and the evaluation of all inflammatory markers compared to the control group, where only P-SEP and CRP levels were evaluated.
Only IL-6 [AUC = 0.893 (0.726–0961)] (Figure 5D) demonstrated better differentiation between the groups (low vs. high-risk). The area under the curve for CRP [AUC = 0.837 (0.687–0.918)] showed similar differentiation performance as P-SEP (Figure 5F). PCT exhibited the worst differentiation potential [AUC of 0.745 (0.589–0.847)].
The highest diagnostic efficacy was achieved when P-SEP was used in combination with IL-6 and CRP. This is illustrated in Figure 6, which compares the high-risk group to the low-risk group [AUC = 0.97 (0.911–0.99)], attaining a 90% sensitivity (76.9–103.1), 93.2% specificity (87.5–99), PPV 78.3% (61.4–95.1), negative predictive value (NPV) 97.2% (93.3–101), LR− 0.107 (0.029–0.4) and LR+ 13.32 (6.643–31.443).
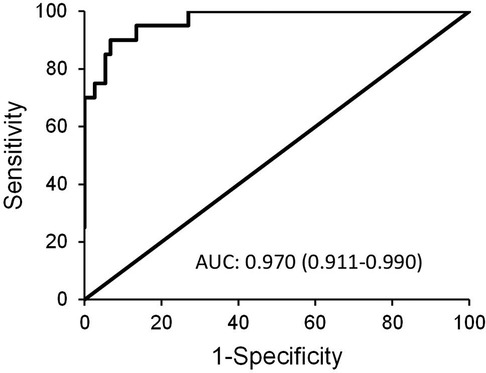
Figure 6. ROC curve depicting the diagnostic power of combined use of P-SEP with IL-6 and CRP in between-group comparison of low-risk vs. high-risk group.
A cut-off value of P-SEP at 636 ng/L (AUC 0.845; 0.708–0.921) had low PPV (46.2%) in the low-risk group comparison. Also, the value was close to the literature-published values of healthy neonates (603.5 ng/L, IQR 466.5–791 ng/L) and preterm neonates (620 ng/L, IQR 503–864 ng/L) (17). P-SEP demonstrated a better PPV when the reference group was healthy neonates. In this case, the cut-off value was set to 695 ng/L (AUC 0.9; 0.753–0.961) with sensitivity of 80% (62.5–97.5), specificity 92.9% (83.3–102.4), PPV 88.9% (74.4–103.4), NPV 86.7% (74.5–98.8), LR− 0.215 (0.089–0.521) and LR+ 11.2 (2.894–43.349) (Table 3).
Lastly, a significant difference in P-SEP concentrations between the T0 values and the samples obtained in 48–72 h interval was observed in the low-risk group. However, due to the limited number of sequentially obtained samples no further correlation was possible.
Sepsis is one of the most common causes of death in pediatric population, especially in the neonates. Early initiation of treatment reduces mortality and morbidity, thus a prompt diagnosis is essential.
The existing consensus on pediatric sepsis definitions (sepsis-3) (6, 7) have, however, limited accuracy in term neonates and are not appropriate for preterm infants. This is mainly because the organ dysfunction, the key diagnostic criterion, is rarely considered in neonatal literature, and it remains unclear how to screen neonates most accurately for organ dysfunction (4).
The gold standard method for confirming sepsis in newborns with risk factors, clinical suspicion and abnormal test results is the identification of a pathogenic organism from otherwise sterile site (blood or cerebrospinal fluid) (14). However, blood cultures lack sensitivity due to the specific characteristics of the neonatal population (18) and are positive in less than 1% of EOS cases (19, 20). The ability to detect bacteremia in neonates with EOS is significantly reduced by administering intrapartum antibiotic prophylaxis to at risk mothers, due to transplacental transfer of antibiotics to the fetus (9–11). Also, the recommended blood volume for culture in newborns is 1–3 ml, which is often impracticable to obtain in the first hours/days of life, especially when other tests have to be prioritized. In practice, the majority of samples are less than 0.5 ml (21). In addition, over half of septic newborns (68%) have low-colony count bacteremia [≤10 colony forming units (CFU)/ml], and as many as 60% of cultures will be interpreted as falsely negative with 0.5 ml sample volumes (22). In fact, even multiple blood cultures do not increase the yield of the methodology (23). Last but not least, even in the most efficient operations the culture results are typically not available sooner than in 24 h, which is an unacceptably long delay to treatment initiation in a septic infant.
For these reasons, biomarkers of sepsis are commonly used to aid early sepsis diagnosis together with the clinical signs.
In this work, the sepsis criteria of the NeoPInS study (16) were used to stratify the newborns. Correlating with previous experience (24), no positive blood culture samples were captured, as more than 1,000 newborns would have to be collected to capture 1 positive blood culture sample (19, 20). Therefore, newborns with risk factors, clinical signs and abnormal test results were classed as those with EOS, regardless of the negativity of blood culture.
Previously published data supported the use of P-SEP in the diagnosis of EOS, suggesting its similar or higher diagnostic accuracy compared to other markers of inflammation (25, 26). However, conflicting results were reported on whether P-SEP alone may be sufficient in the diagnosis of EOS (27) or whether it may be used to better advantage in combination with other inflammatory markers (28–31). According to our observations, P-SEP alone exhibited, an undisputable discriminatory potential between high and low-risk/healthy subjects, however a higher diagnostic efficacy was achieved by combining P-SEP with IL-6 and CRP (see Table 4). Comparing the individual performance of P-SEP, CRP, PCT and IL-6, IL-6 demonstrated the best discriminatory power and PCT the worst. When P-SEP was used together with IL-6 and CRP, their combined NPV was the highest. In addition, the concentration of P-SEP in the low-risk and medium-risk groups did not differ significantly from that of HCs. Therefore, by theoretical extension, which would include confirmed cases of sepsis, P-SEP can be used as a negative predictive marker of EOS, especially in neonates at low to moderate risk of infection.
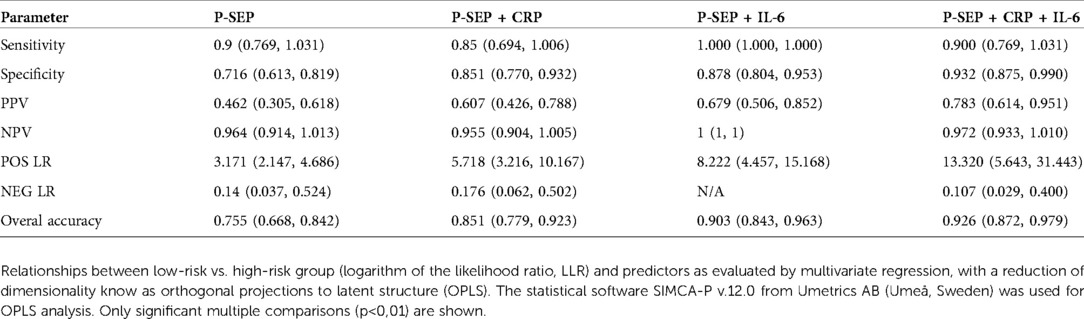
Table 4.. Sensitivity, specificity, NPV, PPV, POS LR and NEG LR for P-SEP alone and P-SEP in combination with other inflammatory markers (CRP, IL-6). NPV: negative predictive value, PPV: positive predictive value, POS LR: positive likelihood ratio, NEG LR: negative likelihood ratio (confidence intervals are in parentheses).
Thus, the introduction of P-SEP into clinical practice can help prevent false positive diagnoses of sepsis, thereby limiting neonates' exposure to antimicrobial drugs, their adverse events and invasive procedures (32).
In this study, P-SEP cut-off value at 695 ng/L has 80% sensitivity and 92.9% specificity. The positive and negative predictive values were 88.9% and 86.7%, respectively. Other studies (33, 34) suggested a higher P-SEP cut-off was associated with higher sensitivity and NPV.
Our study had several limitations. Firstly, the number of enrolled neonates is limited and the quantitative heterogeneity of the studied subgroups may influence the precision of statistical analysis. Secondly, the inability to assess a group of newborns with confirmed sepsis due to the absence of positive blood culture samples within the cohort represents a risk of an overestimation of P-SEP accuracy and may affect the P-SEP cut-off point. Thirdly, our results may be influenced by other factors which could affect P-SEP concentrations. While previous studies suggested that non-infectious sources of inflammation should not markedly alter P-SEP levels (35–37), other factors, such as the use of chemotherapeutics in the infants or their mothers, may do so. Finally, this study did not include very preterm and extremely preterm newborns. Based on our data, we suggest that the performance of P-SEP in these groups should be studied in future.
Our study showed that P-SEP may be a useful biomarker in prompt detection of early-onset sepsis in late preterm and term newborns, however it's not individually superior to IL-6. When P-SEP was used in combination with IL-6 and CRP, the best negative predictive power was achieved, especially in newborns at low to medium risk of infection. We suggest a P-SEP cut-off point at 695 ng/L. On the other hand, PCT was the least efficient amongst the studied markers, but further studies are needed to rule out any confounders.
IP, KB and JJ contributed to the conception and design of the study. IP performed the analysis and interpreted the data together with HLB. IP drafted the final version of the article. MB, JJ and HLB contributed to revising it critically for important intellectual content. All authors contributed to the article and approved the submitted version.
This work is supported by the grants from the Medical and Research Program, Ministry of Health, Czech Republic, MH CZ—DRO Thomayer University Hospital—TUH [grant number TN 0064190]; Czech Health Research Council Agency (AZV), Ministry of Health of the Czech Republic [grant number NU20-07-00109]. The author would like to thank Ing. Hill Martin, DrSc. for his help evaluating the statistical component of this study.
The authors declare that the research was conducted in the absence of any commercial or financial relationships that could be construed as a potential conflict of interest.
All claims expressed in this article are solely those of the authors and do not necessarily represent those of their affiliated organizations, or those of the publisher, the editors and the reviewers. Any product that may be evaluated in this article, or claim that may be made by its manufacturer, is not guaranteed or endorsed by the publisher.
P-SEP, presepsin; EOS, early-onset neonatal sepsis; AUC, area under curve; IL-6, interleukin-6; CRP, C-reactive protein; NPV, negative predictive value; GBS, group B Streptococcus; RDS, respiratory distress syndrome; PROM, premature rupture of membranes; SIRS, systematic inflammatory response syndrome; SOFA, sequential organ failure assessment; qSOFA, quickSOFA; CBC, blood count with differential; PCT, procalcitonin; PPV, positive predictive value; CD14, cluster of differentiation 14; NICU, neonatal intensive care; BC, blood culture; ECLIA, electrochemiluminiscence immunoassay; ROC, receiver operating characteristics; HCs, healthy controls; T0, initial sampling/time of symptom onset; LR−, negative likelihood ratio; LR+, positive likelihood ratio; N/A, not available.
1. Mogensen TH. Pathogen recognition and inflammatory signaling in innate immune defenses. Clin Microbiol Rev. (2009) 22:240–73. doi: 10.1128/CMR.00046-08
2. Molloy EJ, Wynn JL, Bliss J, Koenig JM, Keij FM, McGovern M, et al. Neonatal sepsis: need for consensus definition, collaboration and core outcomes. Pediatr Res. (2020) 88:2–4. doi: 10.1038/s41390-020-0850-5
3. Hincu MA, Zonda GI, Stanciu GD, Nemescu D, Paduraru L. Relevance of biomarkers currently in use or research for practical diagnosis approach of neonatal early-onset sepsis. Children (Basel). (2020) 7:309. doi: 10.3390/children7120309
4. McGovern M, Giannoni E, Kuester H, van den Hoogen A, Bliss JM, Koenig JM, et al. Challenges in developing a consensus definition of neonatal sepsis. Pediatr Res. (2020) 88:14–26. doi: 10.1038/s41390-020-0785-x
5. Wynn JL. Defining neonatal sepsis. Curr Opin Pediatr. (2016) 28:135–40. doi: 10.1097/MOP.0000000000000315
6. Singer M, Deutschman CS, Seymour CW, Shankar-Hari M, Annane D, Bauer M, et al. The third international consensus definitions for sepsis and septic shock (sepsis-3). JAMA. (2016) 315:801–10. doi: 10.1001/jama.2016.0287
7. Schlapbach LJ. Time for sepsis-3 in children? Pediatr Crit Care Med. (2017) 18:805–6. doi: 10.1097/PCC.0000000000001203
8. Cantey JB, Baird SD. Ending the culture of culture-negative sepsis in the neonatal ICU. Pediatrics. (2017) 140:e20170044. doi: 10.1542/peds.2017-0044
9. Escobar GJ, Puopolo KM, Wi S, Turk BJ, Kuzniewicz MW, Walsh EM, et al. Stratification of risk of early-onset sepsis in newborns ≥34 weeks’ gestation. Pediatrics. (2014) 133:30–6. doi: 10.1542/peds.2013-1689
10. Mikhael M, Brown LS, Rosenfeld CR. Serial neutrophil values facilitate predicting the absence of neonatal early-onset sepsis. J Pediatr. (2014) 164:522–8.e1–3. doi: 10.1016/j.jpeds.2013.10.080
11. Gandhi P, Kondekar S. A review of the different haematological parameters and biomarkers used for diagnosis of neonatal sepsis. EMJ Hematol. (2019) 7:85–92. doi: 10.33590/emjhematol/10313792
12. De Rose DU, Perri A, Auriti C, Gallini F, Maggio L, Fiori B, et al. Time to positivity of blood cultures could inform decisions on antibiotics administration in neonatal early-onset sepsis. Antibiotics (Basel). (2021) 10:123. doi: 10.3390/antibiotics10020123
13. Sachse C, Dressler F, Henkel E. Increased Serum procalcitonin in newborn infants without infection. Clin Chem. (1998) 44:1343–4. doi: 10.1093/clinchem/44.6.1343
14. Shane AL, Sánchez PJ, Stoll BJ. Neonatal sepsis. Lancet. (2017) 390:1770–80. doi: 10.1016/S0140-6736(17)31002-4
15. Zou Q, Wen W, Zhang XC. Presepsin as a novel sepsis biomarker. World J Emerg Med. (2014) 5:16–9. doi: 10.5847/wjem.j.issn
16. Stocker M, van Herk W, El Helou S, Dutta S, Fontana MS, Schuerman FABA, et al. Procalcitonin-guided decision making for duration of antibiotic therapy in neonates with suspected early-onset sepsis: a multicentre, randomised controlled trial (NeoPIns). Lancet. (2017) 390:871–81. doi: 10.1016/S0140-6736(17)31444-7
17. Pugni L, Pietrasanta C, Milani S, Vener C, Ronchi A, Falbo M, et al. Presepsin (soluble CD14 subtype): reference ranges of a new sepsis marker in term and preterm neonates. PLoS ONE. (2015) 10:e0146020. doi: 10.1371/journal.pone.0146020
18. Camacho-Gonzalez A, Spearman PW, Stoll BJ. Neonatal infectious diseases: evaluation of neonatal sepsis. Pediatr Clin North Am. (2013) 60:367–89. doi: 10.1016/j.pcl.2012.12.003
19. Blackburn RM, Muller-Pebody B, Planche T, Johnson A, Hopkins S, Sharland M, et al. Neonatal sepsis-many blood samples, few positive cultures: implications for improving antibiotic prescribing. Arch Dis Child Fetal Neonatal Ed. (2012) 97:F487–488. doi: 10.1136/archdischild-2012-302261
20. Sorsa A, Früh J, Stötter L, Abdissa S. Blood culture result profile and antimicrobial resistance pattern: a report from neonatal intensive care unit (NICU), asella teaching and referral hospital, asella, south east Ethiopia. Antimicrob Resist Infect Control. (2019) 8:42. doi: 10.1186/s13756-019-0486-6
21. Neal PR, Kleiman MB, Reynolds JK, Allen SD, Lemons JA, Yu PL. Volume of blood submitted for culture from neonates. J Clin Microbiol. (1986) 24:353–6. doi: 10.1128/jcm.24.3.353-356.1986
22. Kellogg JA, Ferrentino FL, Goodstein MH, Liss J, Shapiro SL, Bankert DA. Frequency of low level bacteremia in infants from birth to two months of age. Pediatr Infect Dis J. (1997) 16:381–5. doi: 10.1097/00006454-199704000-00009
23. Sarkar S, Bhagat I, DeCristofaro JD, Wiswell TE, Spitzer AR. A study of the role of multiple site blood cultures in the evaluation of neonatal sepsis. J Perinatol. (2006) 26:18–22. doi: 10.1038/sj.jp.7211410
24. Neal SR, Musorowegomo D, Gannon H, Cortina Borja M, Heys M, Chimhini G, et al. Clinical prediction models to diagnose neonatal sepsis: a scoping review protocol. BMJ Open. (2020) 10:e039712. doi: 10.1136/bmjopen-2020-039712
25. Maddaloni C, De Rose DU, Santisi A, Martini L, Caoci S, Bersani I, et al. The emerging role of presepsin (P-SEP) in the diagnosis of sepsis in the critically ill infant: a literature review. Int J Mol Sci. (2021) 22:12154. doi: 10.3390/ijms222212154
26. Bellos I, Fitrou G, Pergialiotis V, Thomakos N, Perrea DN, Daskalakis G. The diagnostic accuracy of presepsin in neonatal sepsis: a meta-analysis. Eur J Pediatr. (2018) 177:625–32. doi: 10.1007/s00431-018-3114-1
27. Ruan L, Chen GY, Liu Z, Zhao Z, Xu GY, Li SF, et al. The combination of procalcitonin and C-reactive protein or presepsin alone improves the accuracy of diagnosis of neonatal sepsis: a meta-analysis and systematic review. Crit Care. (2018) 22:316. doi: 10.1186/s13054-018-2236-1
28. Ozdemir AA, Elgormus Y. Diagnostic value of presepsin in detection of early-onset neonatal sepsis. Am J Perinatol. (2017) 34:550–6. doi: 10.1055/s-0036-1593851
29. Wu J, Hu L, Zhang G, Wu F, He T. Accuracy of presepsin in sepsis diagnosis: a systematic review and meta-analysis. PLoS One. (2015) 10:e0133057. doi: 10.1371/journal.pone.0133057
30. Zhang J, Hu ZD, Song J, Shao J. Diagnostic value of presepsin for sepsis: a systematic review and meta-analysis. Medicine (Baltimore). (2015) 94:e2158. doi: 10.1097/MD.0000000000002158
31. Memar MY, Baghi HB. Presepsin: a promising biomarker for the detection of bacterial infections. Biomed Pharmacother. (2019) 111:649–56. doi: 10.1016/j.biopha.2018.12.124
32. Poggi C, Lucenteforte E, Petri D, De Masi S, Dani C. Presepsin for the diagnosis of neonatal early-onset sepsis: a systematic review and meta-analysis. JAMA Pediatr. (2022) 176:750–8. doi: 10.1001/jamapediatrics.2022.1647
33. Tabl HA, Abed NT. Diagnostic value of presepsin in neonatal sepsis. Egypt J Immunol. (2016) 23:29–37.28502131
34. Miyosawa Y, Akazawa Y, Kamiya M, Nakamura C, Takeuchi Y, Kusakari M, et al. Presepsin as a predictor of positive blood culture in suspected neonatal sepsis. Pediatr Int. (2018) 60:157–61. doi: 10.1111/ped.13469
35. Poggi C, Bianconi T, Gozzini E, Generoso M, Dani C. Presepsin for the detection of late-onset sepsis in preterm newborns. Pediatrics. (2015) 135:68–75. doi: 10.1542/peds.2014-1755
36. Montaldo P, Rosso R, Santantonio A, Chello G, Giliberti P. Presepsin for the detection of early-onset sepsis in preterm newborns. Pediatr Res. (2017) 81:329–34. doi: 10.1038/pr.2016.217
Keywords: biomarker, inflammation, neonatal sepsis, newborns, presepsin
Citation: Pospisilova I, Brodska HL, Bloomfield M, Borecka K and Janota J (2023) Evaluation of presepsin as a diagnostic tool in newborns with risk of early-onset neonatal sepsis. Front. Pediatr. 10:1019825. doi: 10.3389/fped.2022.1019825
Received: 15 August 2022; Accepted: 16 November 2022;
Published: 9 January 2023.
Edited by:
Domenico Umberto De Rose, Bambino Gesù Children's Hospital (IRCCS), ItalyReviewed by:
Samah Bastawy, Professor of Clinical Pathology Faculty of Medicine, Egypt© 2023 Pospisilova, Brodska, Bloomfield, Borecka and Janota. This is an open-access article distributed under the terms of the Creative Commons Attribution License (CC BY). The use, distribution or reproduction in other forums is permitted, provided the original author(s) and the copyright owner(s) are credited and that the original publication in this journal is cited, in accordance with accepted academic practice. No use, distribution or reproduction is permitted which does not comply with these terms.
*Correspondence: Jan Janota amFuLmphbm90YUBmbm1vdG9sLmN6
Specialty Section: This article was submitted to Neonatology, a section of the journal Frontiers in Pediatrics
Disclaimer: All claims expressed in this article are solely those of the authors and do not necessarily represent those of their affiliated organizations, or those of the publisher, the editors and the reviewers. Any product that may be evaluated in this article or claim that may be made by its manufacturer is not guaranteed or endorsed by the publisher.
Research integrity at Frontiers
Learn more about the work of our research integrity team to safeguard the quality of each article we publish.