
94% of researchers rate our articles as excellent or good
Learn more about the work of our research integrity team to safeguard the quality of each article we publish.
Find out more
SYSTEMATIC REVIEW article
Front. Pediatr., 06 December 2021
Sec. Pediatric Gastroenterology, Hepatology and Nutrition
Volume 9 - 2021 | https://doi.org/10.3389/fped.2021.795364
 Jimena Fuentes-Servín1†
 Azalia Avila-Nava2†
 Luis E. González-Salazar3,4
 Oscar A. Pérez-González5
 María Del Carmen Servín-Rodas6
 Aurora E. Serralde-Zuñiga3,7
 Isabel Medina-Vera1,7*
 Martha Guevara-Cruz7,8*
Background and Aims: The determination of energy requirements is necessary to promote adequate growth and nutritional status in pediatric populations. Currently, several predictive equations have been designed and modified to estimate energy expenditure at rest. Our objectives were (1) to identify the equations designed for energy expenditure prediction and (2) to identify the anthropometric and demographic variables used in the design of the equations for pediatric patients who are healthy and have illness.
Methods: A systematic search in the Medline/PubMed, EMBASE and LILACS databases for observational studies published up to January 2021 that reported the design of predictive equations to estimate basal or resting energy expenditure in pediatric populations was carried out. Studies were excluded if the study population included athletes, adult patients, or any patients taking medications that altered energy expenditure. Risk of bias was assessed using the Quality Assessment Tool for Observational Cohort and Cross-Sectional Studies.
Results: Of the 769 studies identified in the search, 39 met the inclusion criteria and were analyzed. Predictive equations were established for three pediatric populations: those who were healthy (n = 8), those who had overweight or obesity (n = 17), and those with a specific clinical situation (n = 14). In the healthy pediatric population, the FAO/WHO and Schofield equations had the highest R2 values, while in the population with obesity, the Molnár and Dietz equations had the highest R2 values for both boys and girls.
Conclusions: Many different predictive equations for energy expenditure in pediatric patients have been published. This review is a compendium of most of these equations; this information will enable clinicians to critically evaluate their use in clinical practice.
Systematic Review Registration: https://www.crd.york.ac.uk/prospero/display_record.php?RecordID=226270, PROSPERO [CRD42021226270].
Energy is vital and necessary to maintain the metabolic functions of an organism. The determination of energy requirements in children and adolescents is important for their proper growth as well as for the prevention of the effects of overfeeding or underfeeding. To establish such energy requirements, it is necessary to determine the total energy expenditure (TEE), which is the amount of energy used daily by the individual (1). The largest component of TEE (60–70%) is basal energy expenditure (BEE), which represents the integration of the minimal activity of all body tissues under steady state conditions (2). Methods to determine TEE are not very accessible, and they are expensive. Therefore, the estimation of TEE from total BEE, food thermogenesis and physical activity is very common. Because techniques to measure BEE are impractical, the estimation of BEE from resting energy expenditure (REE) is the most feasible and commonly used method. A widely used reference method for determining REE is indirect calorimetry (IC) (3); however, the use of this technique is not practical due to its high cost, limited availability, long measurement time and the need for appropriate fasting (4, 5), which is why several predictive equations for energy expenditure have been developed or modified for routine clinical practice over time, with the aim of determining caloric requirements in children and adolescents with various clinical situations. Most of these equations were obtained from heterogeneous groups of children; therefore, the aims of the present review were 1) to identify the equations designed to predict energy expenditure and 2) to identify the anthropometric and demographic variables used in the design of the equations for pediatric patients who are healthy and have illness.
A systematic review of the published literature was performed according to the Preferred Reporting Items for Systematic Review and Meta-Analysis (PRISMA) guidelines (6). The protocol was registered in the International Prospective Register of Systematic Reviews (PROSPERO) (5, 7) under reference number CRD42021226270.
A comprehensive literature search was conducted independently by two authors (JFS and LGS) in the digital Medline/PubMed, EMABSE and Latin American and Caribbean Health Sciences Literature (LILACS) databases. Articles published through January 2021 were searched. The electronic search was supplemented by manual screening of reference lists of relevant articles to identify possible studies not identified in the electronic search. The population, exposure, comparator, outcome (PECO) strategy was applied in the present systematic review, and the descripts were as follows: pediatric patients (population) who are healthy and have illness, predictive equations for energy expenditure (exposure), the reference standard for measuring energy expenditure (comparator), and Pearson's correlation coefficient (R) value or the coefficient of determination (R2) value (outcome) (Table 1). The search was performed using the following terms: “energy expenditure” OR “energy Metabolism” OR “resting energy expenditure”, OR “basal metabolic rate [MeSH Major Topic],” “predictive equation,” “indirect calorimetry” and “child” OR “adolescent” OR “pediatrics” [MeSH Terms] NOT “adults” NOT “athletes” with no restrictions on the study design, date or language of publication and limited to humans.
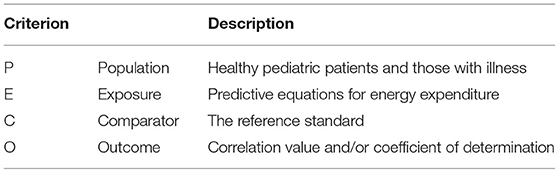
Table 1. PECO criteria for study selection.
After the removal of duplicates, titles and abstracts were independently screened by two authors (JFS and LGS) for eligibility according to the inclusion criteria. Published studies identified in the search were initially assessed considering titles and abstracts. Based on the initial assessment, studies were identified as “excluded” or as “full-text assessment for eligibility.”
Studies were included if they met the following criteria: 1) the study population included pediatric patients (age 0–18 years), 2) energy expenditure measurement was performed by IC, and 3) equations for BEE and REE were developed for patients with different clinical conditions. Studies were excluded if 1) the study population included patients with thyroid problems or patients taking medications that alter energy expenditure, 2) equations were designed for the pediatric athlete population, 3) equations were designed considering combined adult and pediatric populations, or 4) equations were designed considering a different population than the one being evaluated.
The articles that met the inclusion criteria were reviewed by two investigators, and the data were extracted in a specific format and included variables such as 1) the clinical condition of the population studied; 2) the age range of the population studied; 3) the proposed equations; 4) the R and/or the R2 value reported for the correlation between the new equation and the reference standard used; 5) the method used to determine energy expenditure; 6) the country where the models were developed; and 7) in the case of body composition measurement, the documented method to assess body composition. Any discrepancies were resolved by discussion with a third author.
Study validity was assessed independently by two authors (JFS and LGS), with potential disagreements resolved by consensus or consultation with a third author (IMV) using the “Quality Assessment Tool for Observational Cohort and Cross-Sectional Studies” developed jointly by methodologists from the National Heart, Lung and Blood Institute (NHLBI) and Research Triangle Institute International (8). The tools included fourteen items to assess potential flaws in the study methodology, including the following sources of bias: patient selection, performance, attrition and detection, confounding, study power, and other factors. A judgment of “good” indicated a low risk of bias, “fair” indicated that the study was susceptible to some bias considered not sufficient to invalidate its results, and “poor” indicated a significant risk of bias.
The search identified 769 possible studies, and among these, 300 were excluded because they were duplicates; therefore, 477 records were identified for possible inclusion in the review. When analyzing the studies on the basis of title and abstract, 281 were eliminated because they did not meet the inclusion criteria. A total of 196 records were retained for full-text assessment, and 157 studies were excluded, the main reason being that the studies did not generate a new predictive equation (n = 149), with 2 additional studies being excluded for developing an equation in an athlete population, 4 studies for not studying the appropriate age range, 1 study for not generating an equation but instead providing a secondary analysis of databases and 1 study for designing an equation in a population different from the population of interest in this study. Eight publications were further identified as relevant for this review by cross-referencing and met the selection criteria; therefore, a total of 39 articles were included. However, 40 predictive equations were analyzed because the Institute of Medicine (IOM) article presents equations for healthy populations and populations with obesity (Figure 1).
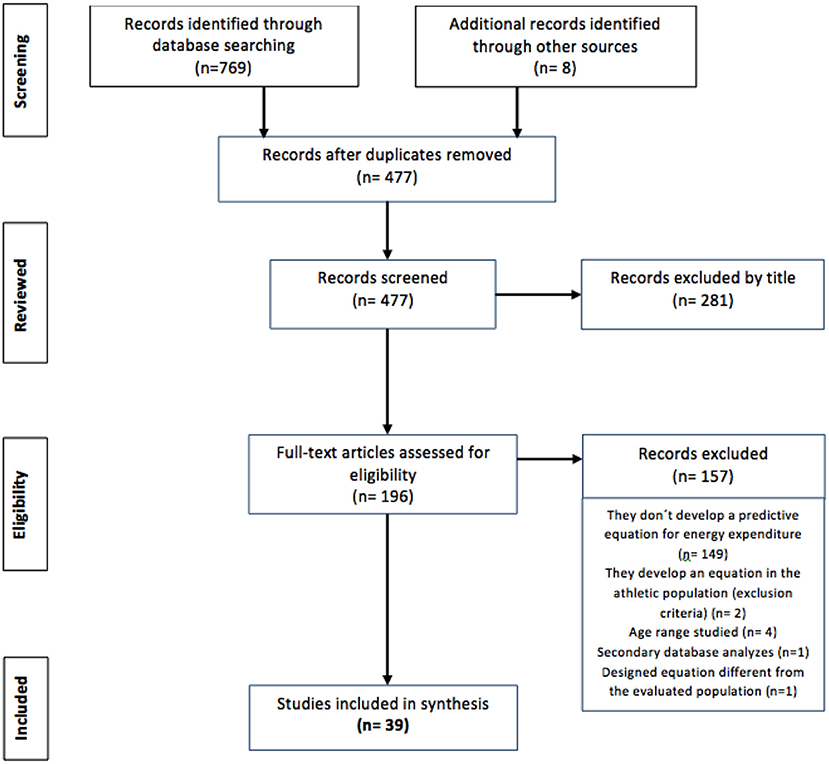
Figure 1. PRISMA flow chart of the included studies.
The quality rating was acceptable, with a moderate risk of bias, in twenty-one of the assessed studies; five studies were rated as poor, with a significant risk of bias, and thirteen studies had an overall good quality rating (Supplementary Figure S1 and Supplementary Table S1). In general, sample size calculation was not documented in the studies (sample size calculation was reported in only one study), and the number of subjects assessed varied across studies. In total, 74.3% of the articles assessed (n = 29) reported the generation of a predictive equation in the research question and/or objective (Figure 2).
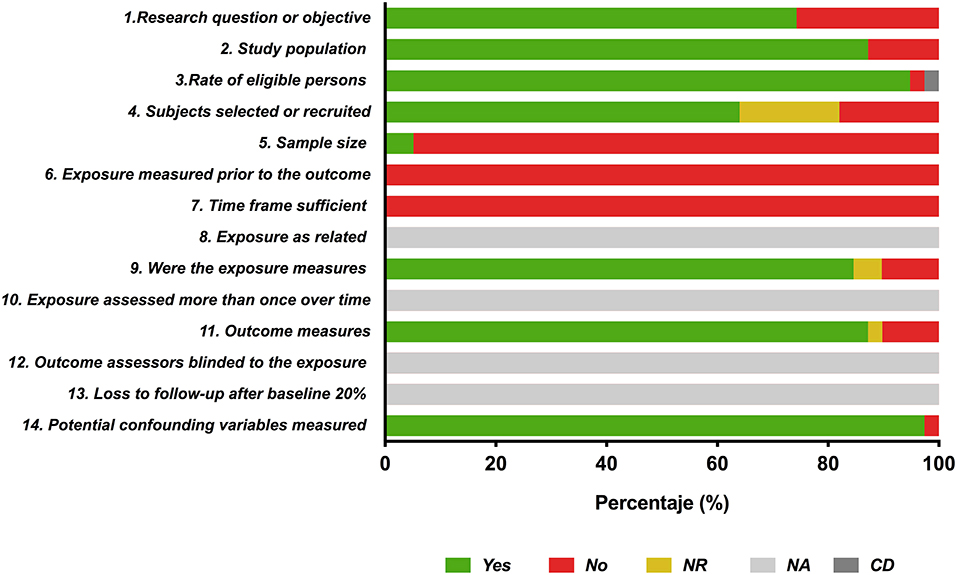
Figure 2. Report of the study quality index components in the included studies. Yes (green bar), No (red bar) NR (yellow bar): not reported; NA (light gray bar): not applicable; CD (dark gray bar): cannot determine.
Once the clinical conditions of the populations included the studies were analyzed, equations were stratified into the following three groups to obtain a better understanding of the populations being reviewed: 1) healthy children, who were described as those presenting no significant medical problems; 2) children with overweight or obesity without any other complications; and 3) patients with specific clinical situations (anemia, muscular atrophy type 1, intensive care, surgical procedures and others requiring nutritional therapy). The following is a description of each of the equations in each stratum.
Eight articles contained predictive equations with reference to a healthy pediatric population, and the predictive equations and their characteristics are presented in Table 2.

Table 2. Equations for the prediction of energy expenditure in the healthy pediatric population.
The Harris-Benedict equation was developed in 1918 (7) in Boston, MA. In a sample size of 332 healthy individuals [136 males, 103 females and 93 newborns (4 days)], athletes and vegetarians were included to represent the general population. Energy expenditure was determined by IC, and the variables studied were weight, height, pulse and body surface area (BSA). The correlation between height and heat production was documented, and the R value for the correlation between body weight and heat production was 0.80 in newborns and men and 0.60 in women. The authors determined that both height and body weight have independent significant effects on the prediction of basal metabolism.
Two equations, which included the variables of weight, height and age, were established to determine 24-h heat production, one for men and one for women. These equations were tabulated for weight values from 25.0 to 124.9 kg, for height values from 151 to 200 cm and for ages from 21 to 70 years. The authors also proposed a second equation for infants, which included the variables of weight in kilograms and height in centimeters, tabulated for weight between 2 and 4 kg and height between 46 and 54 cm.
Neither the R value nor the R2 value of the equations was documented.
The FAO/WHO equation (9) was designed in 1985. By compiling the literature (114 studies), a sample size of ~7,000 healthy people of all ages from developed and underdeveloped countries (USA, the UK, India, China, Sweden, Burma, the Netherlands, Brazil, Nepal, Hawaii, Japan, the Philippines, Korea, Jamaica, Mexico, Denmark and Austria) was obtained. A small sample of children with illness was included, which the authors reported was not a significant proportion of the sample. The number of children assessed was not mentioned.
Two different equation models were developed for the prediction of BEE. The first model takes into account the weight variable, is stratified by sex and is further subdivided by age (0–3, 3–10 and 10–18 years). The second model considers weight and height as variables, is stratified by gender and applied to only the age range of 10–18 years. The R value for the correlation of the variables with energy expenditure was not mentioned. A correlation between R = 0.97 and R = 0.77 was found for the equations, and the equation models with the highest reported R values corresponded to the equations for both males and females aged 0–3 years that take into account the weight variable; the model with the lowest reported R value was that for the equation for females aged 10–18 years that takes into account the variables of weight and height.
The authors reported significant variation in the BEE related to ethnic differences, with 10% variation in the Indian population.
The BEE prediction equations designed by Schofield (10) in 1985 were derived from databases including pediatric and adult populations that included European (mainly Italian), American and Asian subjects from developed and underdeveloped countries. From a sample of 2,359 children, two different equation models were developed for the prediction of BEE: the first model takes into account the weight variable, and the second model uses weight and height. Both models were stratified by sex and further subdivided by age (0–3, 3–10 and 10–18 years). The R value for the correlation of the variables used in the models with energy expenditure was not reported. R values between 0.97 and 0.81 were reported for the equations; the models with the highest R values were those corresponding to the equations for men and women aged 0–3 years that take into account weight and height. On the other hand, the model with the lowest R value reported was the model for women aged 3–10 years that takes into account the variables of weight and height. A small part of the database included children with illness (without specifying the number of subjects or the diseases), which the author reports was not a significant proportion of the sample.
Henry et al. (11) designed a number of adolescent BEE prediction equation models in 1999, taking into account pubertal status, based on a sample size of 195 adolescents (78 males and 117 females) aged 10–15 years in Oxford, UK. Skinfold measurements were taken from 5 areas (the biceps, triceps, subscapular, suprailiac and mid-calf areas), which were used to establish percentage body fat (%BF), fat-free mass (FFM) and fat mass (FM). In addition, measurements of mid-upper arm muscle circumference (MUAMC) and wrist breadth were obtained. Sexual development was assessed by physicians, who compared the images and descriptions described in Tanner's puberty classification (pubic hair and gonadal development in males and breast development and the onset of menarche in females). Energy expenditure was measured by IC.
The authors established several equation models. Model 1 was stratified by gender; for males, the authors designed 5 equations that included variables such as weight, FFM, height, FM and skinfold measurements in different combinations, while for females, they designed 3 equations that included variables such as weight, height, FFM, age and FM in different combinations. Model 2 was stratified by gender and pubertal status. For males, 2 equations that included the variables of weight, age, wrist width, MUAMC and the logarithm of the sum of the skinfold measurements were established. For females, 4 equations that included variables such as weight, menarche status, FM and age were established.
The equation that had the highest R2 value (0.69) was the equation for males in gonadal pubertal stage 3 (G3) compared to the following equations, which had R2 values of 0.52: model 1 for females that included the weight variable, model 2 for females in the pubertal stage (breast stage 1) and finally the model for females aged 10–15 years.
The authors concluded that the inclusion of menarche status in the regression equations improved the estimation of BEE in premenarchal females. However, in males, pubertal stage, as assessed by pubic hair and gonadal stage, did not contribute to a significant improvement in BEE estimation, except in 11-year-old boys. That is, the inclusion of pubertal stage provided only minor improvements.
In 2002, the IOM (12) developed a BEE equation for children and adolescents with normal weight from a database of 525 children and adolescents, including 167 males (73 were of Caucasian, 13 were of African American, 4 were of Hispanic and 62 were of American Indian ethnicity) and 358 females (197 were of Caucasian, 58 were of African American, 20 were of Hispanic, 10 were of Asian and 60 were of American Indian ethnicity), aged 3–18 years, who were healthy and had energy expenditure measurements taken using the doubly labeled water technique. In addition, 20, 10 and 60 children and adolescents of Hispanic, Asian, and American Indian ethnicity who were aged 3–18, healthy and underwent energy expenditure measurements using the doubly labeled water technique were evaluated to establish two equations, which were stratified by gender. Within the equations, the variables of age, height and weight were considered. The R value for the correlation of the variables with energy expenditure was not reported. The equation for males had the highest R2 value, at 0.89, compared to 0.75 for the equation for women. All data were collected in the USA.
From a compilation of 116 investigations, Henry (4) created a database of European, American and Asian populations of different age ranges in 2005. The authors evaluated a population of 10,552 persons (5,794 males and 4,702 females), including 4,018 subjects from the tropics, and excluded all Italian subjects. The number of children and adolescents included in the study was not specified.
The authors designed different BEE prediction equations models, known as the Oxford equations. Specifically, for the pediatric population, 2 equation models were derived, the first taking into account the weight variable and the second taking into account the weight and height variables. Both models were stratified by gender and subdivided by age (0–3, 3–10, and 10–18 years). The equations had R2 values between 0.964 and 0.752, corresponding to the weight and height equation for women aged 0–3 years and the weight equation for women aged 10–18 years, respectively.
Lawrence et al. (13) designed several REE prediction equation models, known as Kim's equations, in 2009. They studied a sample size of 92 apparently healthy preschool children and third and fifth graders (38 boys and 54 girls) aged 4–11 years from a rural area of South Korea. None of the girls had begun menstruation. Body fat (BF) was assessed by bioelectrical impedance analysis (BIA), muscle mass was calculated using the Heymsfield formula (15), and BSA was calculated using the Dubois formula (16). Energy expenditure was measured by IC.
Four REE prediction equations were designed with different combinations of variables. Equation 1 takes into account percent ideal body weight (PIBW), BSA and BF; the second equation takes into account only BSA; the third equation takes into account age and weight; and the fourth equation takes into account only FFM. The R value for the correlation of each variable with energy expenditure was not documented. The equations had R2 values between 0.611 and 0.556, with the highest correlation for equation 1 and the lowest correlation for the model that takes into account only FFM.
Kaneko et al. (14) established 2 of REE equation models in 2013; these models were designed from a sample of 221 Japanese children and adolescents (113 males and 108 females) aged 6–17 years who were apparently healthy and free of any condition affecting energy expenditure, such as abnormal thyroid gland function. BF was determined by two methods: BIA and skinfold measurements. FFM was calculated by subtracting BF from weight; however, this variable was not considered in the final model. Energy expenditure was measured by IC.
Two equations were obtained (one for each gender) that take into account the variables of weight, height and age. The equation designed for males had the highest R2 value, at 0.861, compared to 0.628 for the equation for women.
Seventeen articles were found with predictive equations with reference to pediatric populations with overweight and obesity. The predictive equations and their characteristics are presented in Table 3.
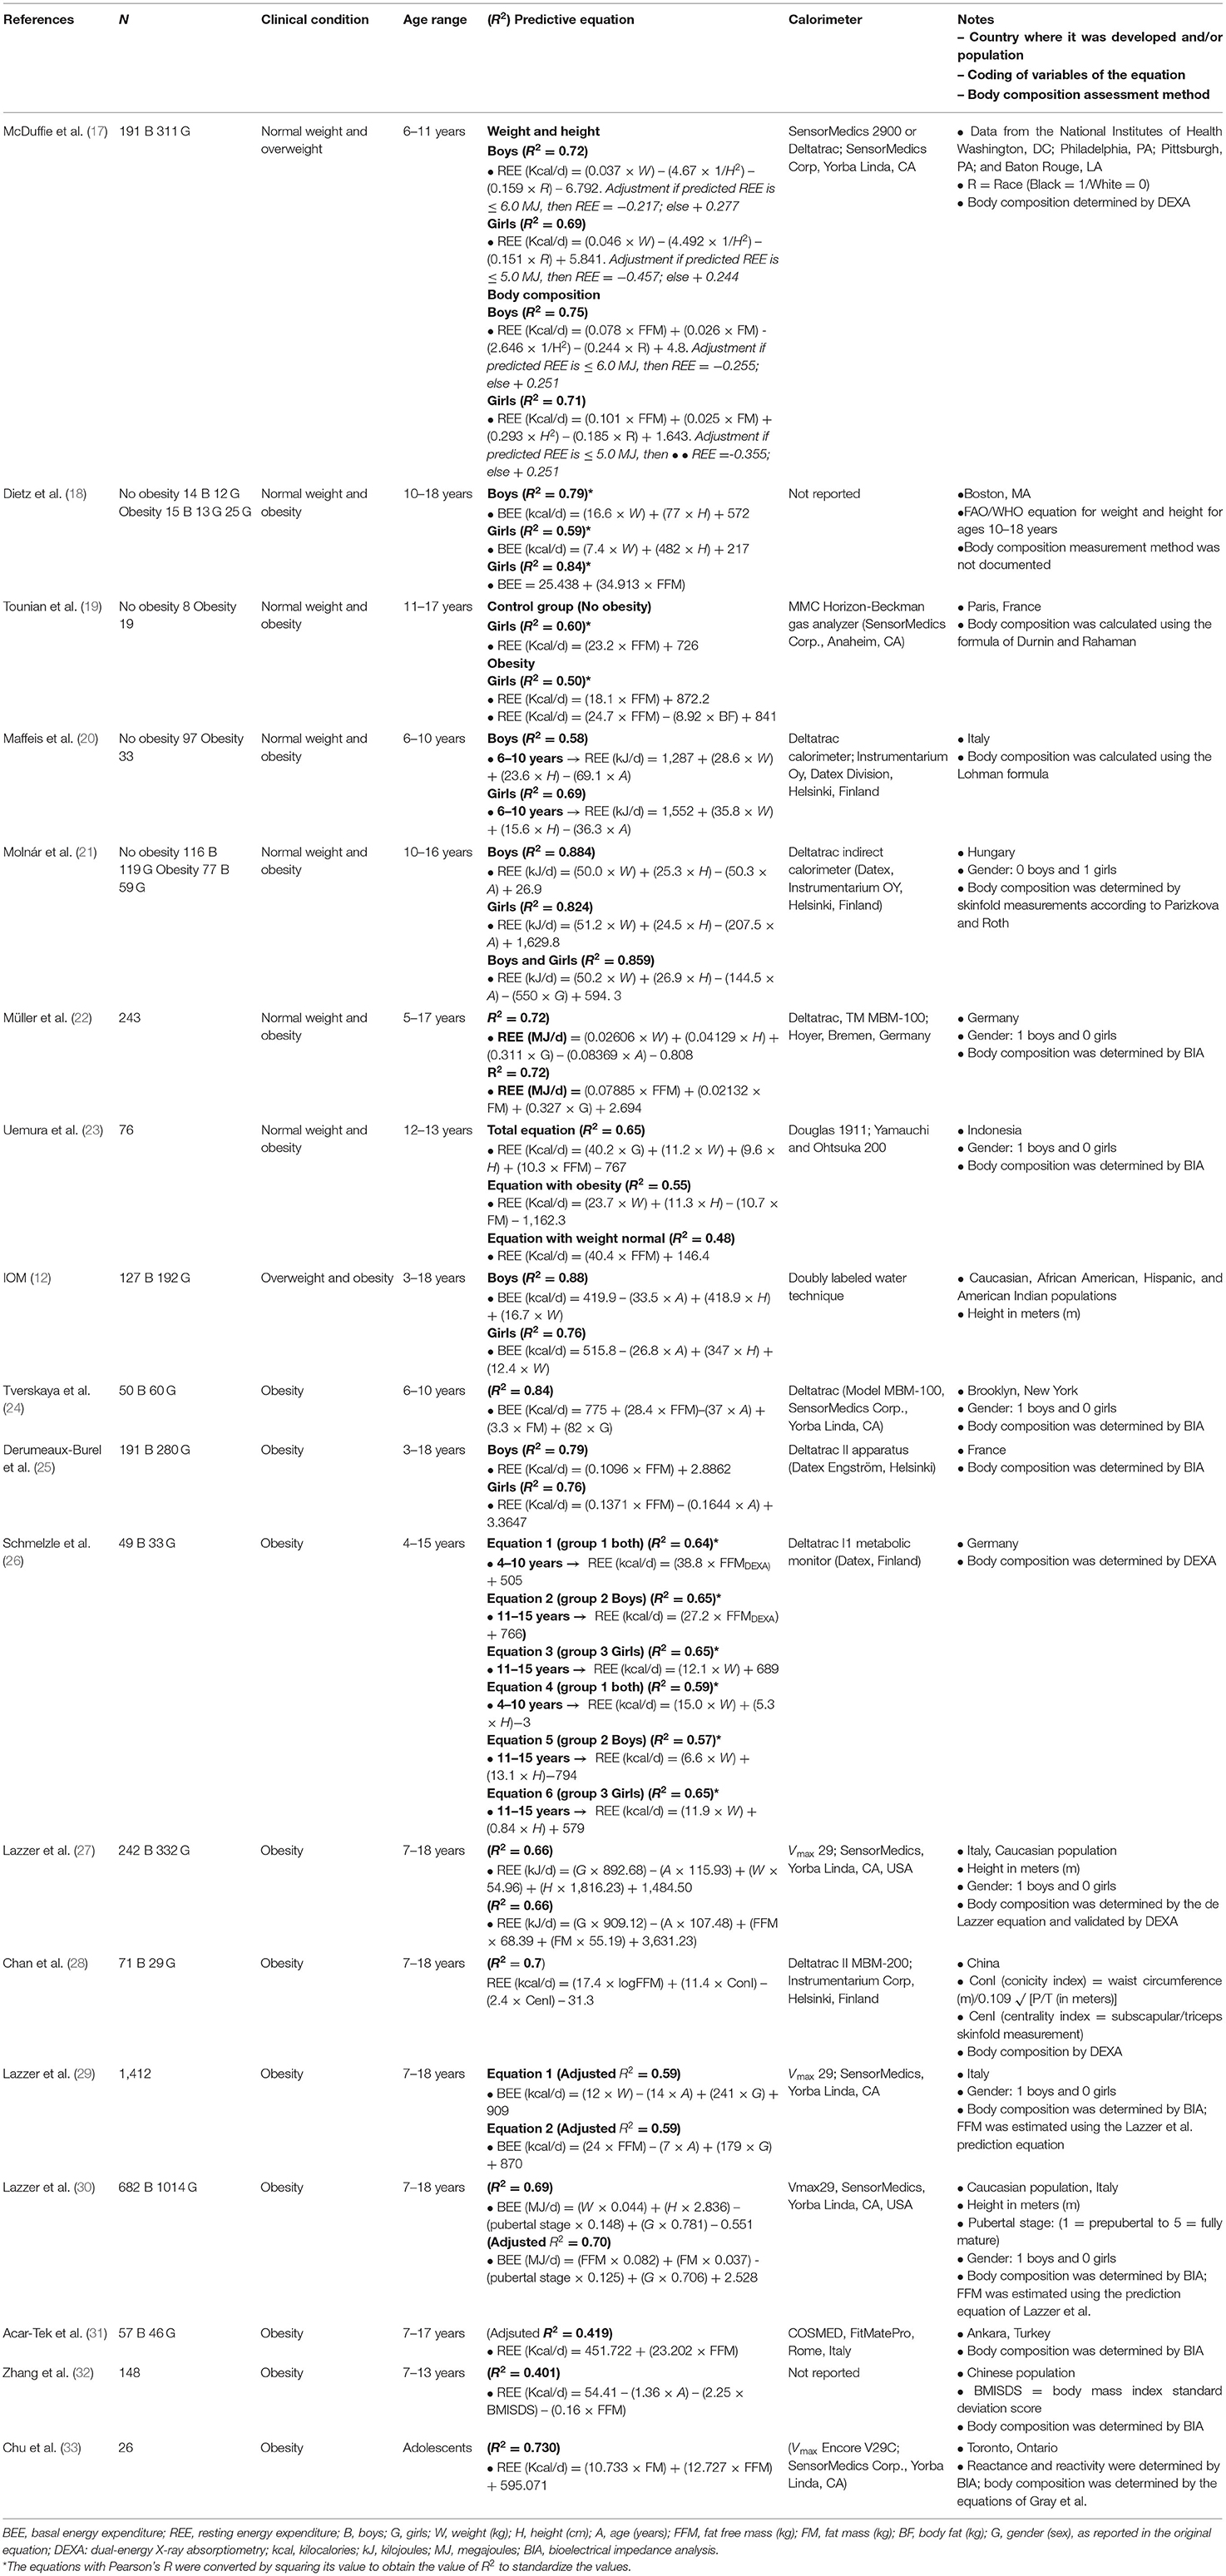
Table 3. Equations for the prediction of energy expenditure in the pediatric population with overweight or obesity.
McDuffie et al. (17) designed REE prediction equations for children with normal weight and overweight in 2004. A total of 502 children (191 males and 311 females) aged 6–11 years were studied. The data for 176 of these children (from Washington, DC) were derived from the National Institutes of Health. The data for 136 children from Philadelphia, 69 children from Pittsburgh and 121 children from Baton Rouge (LA) were derived from studies by four authors. Among the 502 children, 212 were black, and 290 were white. According to body mass index (BMI), 37.6% had normal weight (between the 5th and 84th percentiles), 10.9% had a risk of overweight (between the 85th and 95th percentiles) and 51.4% had overweight (>95th percentile) for age and gender. Disease was ruled out in the participants. Energy expenditure was measured by IC. Body composition (FM and FFM) was assessed by dual-energy X-ray absorptiometry (DEXA).
Two different models of prediction equations, stratified by gender, were developed. The first model takes into account the variables of weight, height and race, and the second model considers FFM, FM, height and race as variables. The R values for the correlations of the variables with energy expenditure was not mentioned. The equations had R2 values between 0.75 and 0.69; the highest R2 was for the equation for men that takes into account body composition, and the lowest R2 was the equation for women that considers only weight and height.
Dietz et al. (18) conducted research in Boston, MA, in 1990, in which they proposed that the FAO/WHO weight and height equation for the age range of 10–18 years is more accurate in the prediction of BEE in pediatric populations with obesity. They analyzed a sample of 54 adolescents with obesity (15 males and 13 females) and without obesity (14 males and 12 females). The degree of obesity was found to range from mild to severe; however, these values were not documented. The energy expenditure was measured by IC.
The authors also designed an equation for the prediction of BEE from a sample of 25 adolescent women with and without obesity in which FFM is the only variable; however, they did not document how FFM was assessed. The equation had an R value of 0.92.
In 1993 in Paris, Tounian et al. (19) established several REE prediction equations for girls with obesity. The authors studied 27 girls (19 with obesity and 8 controls). Among the group with obesity, the age range of the population studied was 11.8–17.1 years, and 13 of them were found to have a positive family history of obesity (defined as a BMI >90th percentile for age and gender in one or both parents). Obesity was determined by curves (not specified), and pubertal stage was determined according to Tanner staging. The diet of the group with obesity was controlled, while that of the control group was not. Skinfold measurements were taken at 4 sites (the biceps, triceps, subscapular and suprailiac areas), and FFM and BF were calculated using the Durnin and Rahaman formula for adolescent females (34). Energy expenditure was assessed by IC.
Three different equation models were developed. Two of the equations were derived from the group with obesity, with one taking into account the FFM and the other taking into account both FM and FFM. The third equation model was derived from the control group and takes only FFM into account. The latter equations had R values of 0.71 and R = 0.78, respectively.
In 1992, Maffeis et al. (20) designed different REE prediction equations for a pediatric population with obesity in Italy. These authors evaluated a population of 130 healthy white prepubertal children aged 6–10 years, who were divided into 2 groups: a group of 97 children without obesity (body weight between 90 and 119% of the expected weight for height) and a group of 33 children with obesity (weight ≥20% of the expected weight for height). Those with diabetes mellitus or other metabolic and/or endocrine diseases were excluded. Prepubertal status was assessed according to Tanner staging. Skinfold measurements (tricipital and subscapular skinfold measurement in millimeters) were determined, and Lohman's formulas (35) were used to estimate relative BF. The FFM was calculated by subtracting FM from body weight. FM was obtained by multiplying %BF by body weight. Energy expenditure was assessed by IC.
Two final equation models were established, one for each gender. In both models, the variables considered to be correlated with energy expenditure were weight (R = 0.725 and R = 0.825), height (R = 0.684 and R = 0.722), and age (R = 0.480 and R = 0.577) for males and females, respectively. The equation with the highest R2 value, at 0.69, was the equation for females, compared to 0.58 for the equation for males.
Molnár et al. (21) established 2 prediction equation models of REE in 1994 in Hungary from a sample of 371 healthy adolescents, including 235 without obesity (116 males and 119 females) and 136 with obesity (77 males and 59 females); these adolescents were between 10 and 16 years of age and thus in the pubertal and postpubertal stages. Participants without obesity had a body weight <120% of the expected weight for height, while those with obesity exceeded the expected weight for height by 20% or more.
The authors assessed pubertal stage according to Tanner staging; however, this variable was not included in the models due to its low predictive power in the regression analysis. Energy expenditure was estimated by IC. Triceps, biceps, suprailiac, subscapular, suprascapular and calf skinfold measurements were taken. Relative BF was estimated from the five skinfold measurements according to Parizkova and Roth (36). FFM was calculated by subtracting BF mass (%BF × body weight) from body weight; however, none of these variables were considered in the final equation models.
The authors designed 2 equation models: model 1 was stratified by gender and model 2 included both sexes. The variables correlated with energy expenditure that were used in model 1 were weight (R = 0.928 and R = 0.862), height (R = 0.707 and R = 0.474) and age (R = 0.431 and R = 0.175) for males and females, respectively. Likewise, for model 2, weight (R = 0.881), height (R = 0.612), age (R = 0.294) and gender were used. The equation with the highest R2 value was the equation for males, with an R2 of 0.884, while the lowest R2 value was obtained for the equation for females, with an R2 of 0.824.
The equations of model 1 were validated in a second independent cohort of adolescents (80 males and 61 females) and were found to reliably estimate REE in adolescents with or without obesity who were aged 10–16 years; an individual error of the estimate of REE of <15% was reported for both equations.
From a database covering 7 centers in Germany, Müller et al. (37) designed two equation models to predict REE in 2004. A population of 243 children and adolescents with mainly overweight and obesity aged 5–17 years was studied. Weight was classified as normal, overweight or obesity using German BMI percentiles (<10, >90, and >97, respectively). Body composition was assessed by BIA, and energy expenditure was assessed by IC.
Model 1 used the variables of weight, height, sex and age. Model 2 used the variables of FFM, MG and gender. The R values for the correlations between each of these variables and energy expenditure were not mentioned. Both equations had an R2 value of 0.72.
Uemura et al. (24) designed several REE prediction equations in 2011. These authors studied a population of 76 high school students (35 with normal weight and 41 with obesity) aged 12 and 13 years in Indonesia. Obesity was established according to BMI cutoff values developed by the International Obesity Task Force (25). High school students with a history of metabolic or endocrine diseases and taking regular medication were excluded. Energy expenditure was assessed by IC, and body composition was assessed by BIA.
Three predictive equations were established: the equation for the general population considered the variables of sex, weight, height and FFM; the equation for the population with obesity considered the variables of weight, height and FM; and the equation for the population with normal weight considered only FFM. The R value for the correlation of each variable with energy expenditure was not documented. The R2 value of the equation for the population with normal weight was 0.48, whereas that of the general-population equation was 0.65.
In 2002, the IOM (12) developed a BEE prediction equation for children and adolescents with overweight and obesity from a database of 319 children and adolescents with overweight and obesity, including 127 males (33 were of Caucasian, 20 were of African American, 2 were of Hispanic and 71 were of American Indian ethnicity) and 192 females (63 were of Caucasian, 48 were of African American, 6 were of Hispanic, 68 were of American Indian and 1 was of Asian ethnicity). Children and adolescents aged 3–18 years with BMIs >85th percentile were evaluated. Those who were receiving diet and exercise interventions were excluded. Energy expenditure was assessed using the doubly labeled water technique and stratified by gender, and two equations were established; within the equations, the variables of age, height and weight were considered. The R values for the correlations of these variables with energy expenditure were not reported. The equation for males had the highest R2 value, at 0.88, compared to 0.79 for the equation for women. All data were collected in the USA.
A BEE prediction equation for the pediatric population with obesity was designed by Tverskaya et al. (24) in Brooklyn, New York in 1998. The authors evaluated a total population of 110 pediatric patients (50 males and 60 females) aged 10–18 years with a BMI >28 kg/m2, of whom 81% were of Caucasian ethnicity, 11% were of Hispanic ethnicity, and 8% were of African American ethnicity. Of these, a sample of 100 subjects was used to design the equation, and the remaining 10 were used to validate the equation. Energy expenditure was assessed by IC, and body composition was assessed by BIA. The variables that correlated with energy expenditure and were taken into account in the equation were FFM and FM (R2 = 0.749 and R2 = 0.833, respectively), age (R2 = 0.811) and gender (R2 = 0.843). The final model of the equation had an R2 value of 0.84.
Derumeaux-Burel et al. (25) developed two REE prediction equations for children and adolescents with obesity. These equations were designed in 2004 on the basis of data from a sample of 471 French children and adolescents (191 males and 28.0 females) aged 3–18 years with a BMI Z-score ≥2 who visited the nutritionist for the first time; children and adolescents with any disease were excluded. Body composition [body mass (BM) and FFM] was assessed by BIA, and energy expenditure was assessed by IC.
Derumeaux-Burel et al. (25) established two equations. The first equation was for males and takes into account a single variable, FFM. The second equation is for females and takes into account FFM and age. The equation for males had an R2 value of 0.79, and the equation for females had an R2 value of 0.76. The equations were validated in an independent cohort of 211 children (62 males and 149 females).
In 2004, Schmelzle et al. (26) designed REE prediction equations for the pediatric population with obesity in Germany. A population of 82 subjects with obesity but who were otherwise healthy (49 males and 33 females) was studied. Obesity was diagnosed if the individual BMI exceeded the 95th percentile according to age- and sex-specific BMI tables. Individuals with underlying diseases, such as endocrinopathies or chromosomal abnormalities, were excluded. Energy expenditure was assessed by IC, and body composition (FM and FFM) was assessed by DEXA. Due to the sex-specific changes in body composition expected during puberty, the study group was divided into three groups: group 1, including boys and girls in the prepubertal stage (4–10 years); group 2, including boys aged 11–15 years; and group 3, including girls aged 11–15 years. Different REE equation models were established.
Schmelzle et al. (26) established 6 equations stratified by group and variable. The first 3 equations corresponded to groups 1, 2, and 3 and used only the FFM variable; these equations correlated with energy expenditure and had R2 values of 0.60, 0.63, and 0.55 in the whole population, male population and female population, respectively. The other 3 remaining equations used the weight and height variables; the R2 values of these variables for comparisons with energy expenditure were R2 = 0.58 and R2 = 0.50 for the whole population, R2 = 0.55 and R2 = 0.58 for the male population and R2 = 0.66 and R2 = 0.30 for the female population for weight and height, respectively. The equations had R values ranging from 0.76 to 0.81, with the highest correlation for the equation for men that takes FFM into account, followed by the equation for women that takes the weight variable into account and finally the equation for women that takes the weight and height variables into account.
In 2006, Lazzer et al. (27) designed and validated two REE prediction equations for children and adolescents with obesity in Italy on the basis of data from a sample of 574 children and adolescents with Caucasian ethnicity and obesity (242 males and 332 females) aged 7–18 years. Those with a BMI above the 97th percentile for gender and age were included. Individuals who had previously participated in weight control programs, had metabolic and/or endocrine diseases, or were taking regular medication or any medication that influenced energy metabolism were excluded. FFM and FM were estimated using the prediction equations developed by Lazzer et al. (38) and BIA in a group of 143 adolescents with obesity (BMI Z-score: 3.2; % FM: 34.5) aged 12–17 years and validated by DEXA. Energy expenditure was determined by IC.
Two models including anthropometric and body composition parameters were constructed. The variables that correlated with energy expenditure were gender (R2 = 0.19), age (R2 = 0.05), weight (R2 = 0.74) and height (R2 = 0.32). The second model included gender, age, FFM (R2 = 0.66 for each of the variables) and FM (R2 = 0.41). Both equations had R2 values of 0.66.
The equations were internally and externally validated in an independent group of 53 adolescents with obesity.
In 2009, Chan et al. (28) designed an REE prediction equation on the basis of data derived from a pediatric population with primary obesity; the authors evaluated a total population of 100 Chinese children (71 males and 29 females) aged 7–18 years. The authors included children with BMI above the 95th percentile according to local sex- and age-specific reference ranges with no evidence of underlying disease that could have caused secondary obesity detected during history taking or clinical examination. Children with obesity due to secondary causes were excluded.
The %BF was determined by skinfold measurements (from the biceps, triceps, subscapular and suprailiac areas). Assessments of obesity included the four skinfold area measurements and BMI. The measurement of central BF distribution included the waist-to-hip ratio and conicity index (ConI) (a function of waist circumference, weight and height), which was calculated as follows: waist circumference (m)/0.109 sq root [weight (kg)/height (m)]. The distribution of upper BM was demonstrated using the centrality index (CenI), which was calculated from the ratio of the subscapular skinfold measurement to the triceps skinfold measurement. The ideal BMI was considered to be in the 50th percentile according to age and sex references established by Cole, while the degree of obesity was presented as the percentage above the ideal BMI. Overweight and obesity were defined as age- and sex-specific BMIs corresponding to the cutoff points of 25 kg/m2 and 30 kg/m2, respectively, at 18 years of age. FFM was measured by DEXA, and energy expenditure was measured by IC.
A predictive equation was established with the variables FFM, ConI and CenI, and the R value for the correlation of each variable with energy expenditure was not documented; however, the R2 value for the equation was reported to be 0.7.
In 2010, Lazzer et al. (29) designed BEE prediction equations for white children and adolescents with obesity in Italy, where a population of 1,412 children and adolescents aged 7-18 years was assessed. Children and adolescents with a BMI above the 97th percentile according to Italian reference values for gender and age were included. Those with metabolic and/or endocrine diseases or taking any medication influencing energy metabolism were excluded. Energy expenditure was assessed by IC, and body composition was assessed by BIA. FFM was estimated using the prediction equation of Lazzer et al. (39), FFM was estimated using the equations developed by Lazzer et al. (39), and FM was obtained by the subtraction of FFM from total weight and %BF was calculated as (FM/total weight) × 100.
Two models were constructed, the first taking the variables of weight, age and sex into account and the second taking the variables of FFM, age and sex into account. The R values of the correlations of the variables with energy expenditure were not reported. Both equations had an adjusted R2 of 0.59.
Lazzer et al. (30) designed BEE prediction equations for children and adolescents with obesity in Italy in 2014 and included pubertal status. The authors evaluated a population of 1,696 Caucasian children and adolescents (682 males and 1,014 females) aged 7–18 years. Those with a BMI >97th percentile for gender and age were included. Those who had previously participated in weight control programs, had metabolic and/or endocrine diseases or were taking any medication that influenced energy metabolism were excluded.
Energy expenditure was assessed by IC. Pubertal stages (1 = prepubertal to 5 = fully mature) were assessed by palpation during a medical examination (pubic hair stages for both sexes, breast stages for girls and genitalia stages for boys). Body composition was assessed by BIA. FFM was estimated using the prediction equation of Lazzer et al. (39), and FM was obtained from the subtraction of FFM from total weight and %BF was calculated as (FM/total weight) × 100.
The first model takes the variables of weight (R2 = 0.56), height (R2 = 0.38), pubertal status (R2 = 0.21) and sex (R2 = 0.28) into account, and the second model takes the variables of FFM (R2 = 0.55), FM (R2 = 0.41), pubertal status at age and sex into account. Model 2 had the highest adjusted R2 value, at 0.70, compared to 0.69 for model 1.
Acar-Tek et al. (31) designed REE prediction equations on the basis of data from a population of children and adolescents with obesity in Ankara, Turkey. A sample of 103 (57 males and 46 females) children and adolescents with obesity (BMI-for-age by Z-score ≥2 according to the WHO) aged 7–17 years was studied, excluding those with metabolic and thyroid dysfunction, respiratory diseases (asthma, influenza, or cold) and medication use. Body composition (BM, % fat and FFM) was assessed by BIA, while energy expenditure was measured by IC.
The equation proposed by Acar-Tek et al. (31) in 2017 considers only FFM, and an R2 of 0.470 was reported for the correlation with energy expenditure. The equation had an adjusted R2 value of 0.419.
An internal cross-validation analysis was performed. For adolescent girls, the difference between predicted and measured energy expenditure was −42 ± 266 kcal/d, and the equation had a prediction accuracy of 39.1% in this population; in the case of boys, the difference between predicted and measured energy expenditure was −32 ± 329 kcal/d, and the equation had a prediction accuracy of 43.9% in this population.
In 2018, Zhang et al. (32) developed an REE prediction equation for Chinese children with obesity. These authors evaluated a sample of 248 children, including 148 children with obesity aged 7–13 years. The group with obesity was established according to the body mass index standard deviation (BMISD) score, as established by the WHO. Participants who did not comply with fasting or became restless during the measurement or those who were taking medications such as thyroxine and prednisone that could potentially alter metabolic rate were excluded. Energy expenditure was assessed by IC. Body composition was measured with BIA. BMI values were transformed into a standard deviation score.
A prediction equation was established with the following variables, and their correlation with energy expenditure was reported: age (R = 0.41), BMISD (R = 0.19), and FFM (R = −0.53). The equation had an R2 value of 0.401.
In 2019, Chu et al. (33) designed an REE prediction equation for adolescents with severe obesity in Toronto, Ontario, on the basis of preoperative data derived from a sample of 26 adolescents undergoing bariatric surgery. Energy expenditure was determined using IC. FM and FFM were estimated by BIA; they did not use the equation set in the device software but instead used resistance and reactance measurements for the equations developed by Gray et al. (40), as these equations more accurately predicted FM and FFM.
The equation developed takes into account the variables of FM and FFM, and although the R value for the correlation of each variable with energy expenditure was not documented, an R2 value of 0.730 was reported.
Fourteen articles with predictive equations and reference to populations with various clinical situations and nutritional therapy, including sickle cell anemia, anorexia, muscular atrophy type 1, intensive care and surgical procedures, Stevens-Johnson syndrome (SJS), toxic epidermal necrolysis (TEN) and nutritional therapy, were found. The predictive equations and their characteristics are presented in Table 4.
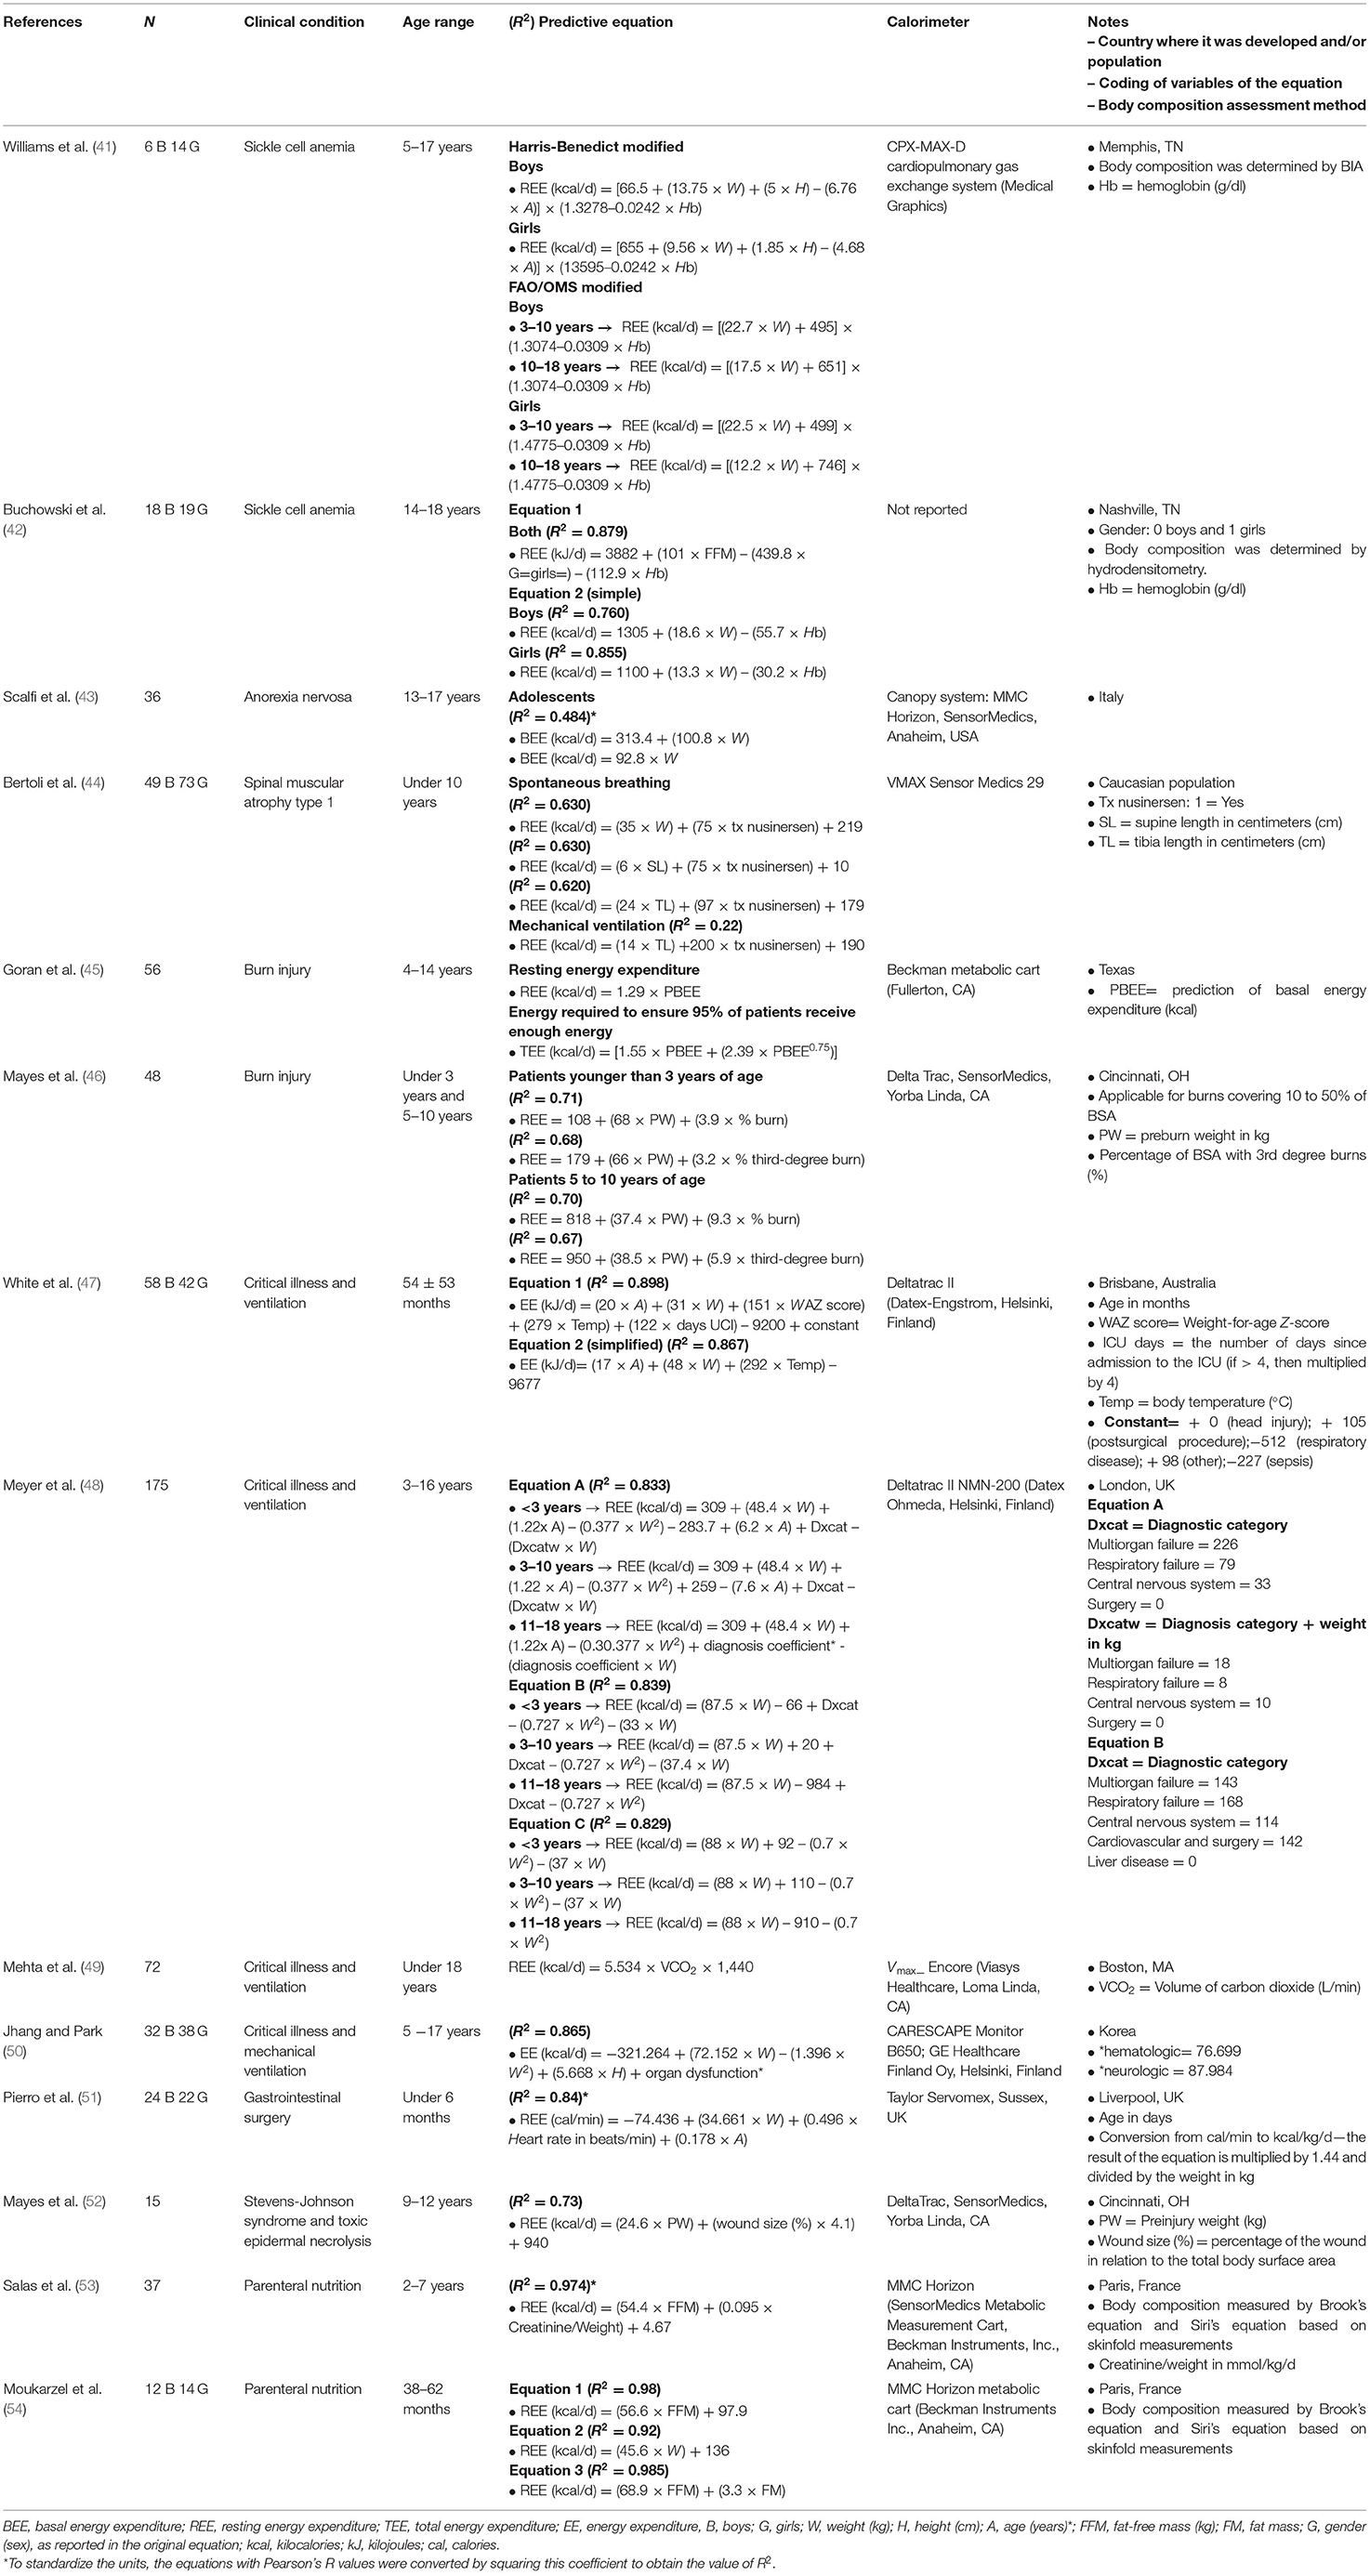
Table 4. Equations for the prediction of energy expenditure in the pediatric population with specific clinical situations.
In 2002, Williams et al. (41) developed REE prediction equations in Memphis, Tennessee, by modifying the Harris-Benedict and FAO/WHO equations. The authors evaluated a sample of 20 children (6 males and 14 females) aged 5–17 years with sickle cell disease who had their energy expenditure assessed by IC and their BM and FFM determined by BIA.
Two models based on the Harris-Benedict equations, to which the hemoglobin (Hb) variable was incorporated, were reported. Moreover, the FAO/WHO equation models for the 3–10 and 10–18-year groups were modified to include the Hb variable. However, neither the R values nor the R2 values of the variables for the equation models were reported.
Buchowski et al. (42) designed REE prediction equations for adolescent patients with sickle cell disease in Nashville, Tennessee, on the basis of data from a sample of 37 patients of African-American ethnicity (18 males and 19 females) with a confirmed diagnosis of sickle cell disease aged 14–18 years who were stable, i.e., no sickle cell crises during the study or for 28 days prior to the study and no metabolic, skeletal, hepatic or renal abnormalities. Energy expenditure was assessed by IC, and FM and FFM were determined by hydrodensitometry.
Two models were established: the first model takes into account FFM and Hb, and the second model is based on 2 equations stratified by sex and takes into account weight and Hb. The R2 value for FFM and weight in energy expenditure was documented, with R2 values of 0.805 and 0.702 for men and 0.757 and 0.825 for women, respectively. The R value for Hb was not documented. The highest R2 value, at 0.879, was reported for the equation for males.
In 2001, Scalfi et al. (43) designed a BEE prediction equation for adolescents with anorexia nervosa in Italy. A sample of 34 adolescents aged 13–17 years who met the established criteria for the diagnosis of anorexia nervosa (Diagnostic and Statistical Manual of Mental Disorders, fourth edition (DSM IV) criteria) and amenorrhea for at least 6 months prior to testing were evaluated. These adolescents did not smoke, nor did they use any contraceptives or drugs that could affect energy expenditure, and they had not received any psychiatric or dietary treatment for at least 2 months prior to testing.
Energy expenditure was measured by IC and was predicted according to the formula of Schebendach et al. (55) (a correction of the Harris-Benedict equation for this condition). Weight and height measurements were performed.
Two prediction equations were established with weight as the single variable: the first equation had an R value of 0.696, while the R value for the second equation was not reported.
In 2020, Bertoli et al. (44) designed different REE prediction equations in a population with spinal muscular atrophy type 1. With data derived from 5 reference centers in Italy, the authors evaluated a sample of 122 Caucasian children (49 males and 73 females) under 10 years of age with a clinical and genetic diagnosis of muscular atrophy type 1. Patients with a body weight >5 kg, with the absence of acute infection and who were not participating in experimental pharmacological protocols were included. Patients had received more than 4 loading doses of nusinersen. Patients with hemodynamic or respiratory instability or on ventilatory support with a fractional inspiratory oxygen fraction (FIO2) > 0.6 or positive end-expiratory pressure (PEEP) > 10 cm H2O were excluded.
The anthropometric variables assessed were weight, supine and tibial length and BMI. Clinical variables included the type of respiration (spontaneous or mechanical ventilation (non-invasive or invasive tracheostomy), the type of feeding (oral, nasogastric tube or gastrostomy) and nusinersen treatment (yes: treated (≥4 infusions) or no: untreated). Energy expenditure was assessed by IC.
Weight-, length-, and sex-specific BMI Z-scores were obtained using WHO growth standards. BMI-for-age values according to standard deviation cutoff points were classified as follows: below −1.644 (5th percentile), underweight; between −1.644 and +1.036, normal weight; between +1.036 and +1.644, overweight; and above +1.644, obesity.
The authors established 4 equation models, with nusinersen treatment as a common variable. The first 3 models were established for patients with spontaneous breathing and considers the variables of weight, supine length and tibia length. The fourth model was established for patients receiving mechanical ventilation and considers the tibia length variable. The R values for the correlations between the variables and energy expenditure were not reported.
The equations with the highest R2 value, at 0.63, were the models considering body weight, nusinersen treatment and both supine length and nusinersen treatment for patients with spontaneous breathing; the lowest R2 value, at 0.22, was reported for the equation for patients receiving mechanical ventilation.
In 1991, Goran et al. (45) designed prediction equations for TEE and REE for patients with burns on the basis of a retrospective analysis of REE data obtained from 56 children aged 4–14 years in Texas. The variables considered for the prediction of REE were predicted basal energy expenditure (PBEE), BSA, age, weight, % of BSA burned and days after burn. BEE was predicted by the Harris and Benedict equations, BSA was calculated from height and weight, and % of BSA burned was calculated by observation on admission. Energy expenditure was measured by IC when continuous feeding was administered, and conditions such as fever, infection, antibiotics, analgesics, etc., were not controlled for at the time of measurement to reflect usual clinical conditions.
It was established that the PBEE variable was the best predictor for REE, with an R2 value of 0.76. Two equations were established, one to predict REE, which considers PBEE as the only variable, and another to predict TEE, which considers PBEE as the only variable. However, in the equation to predict TEE, another equation was added to determine PBEE to predict the energy required to ensure that 95% of patients received the energy needed to achieve energy balance. The first equation uses an activity factor of 1.2, which was derived from a previous study by the authors where the doubly labeled water technique was used for burn patients. Neither the R value nor the R2 value of the final models was mentioned.
In 1996, Mayes et al. (46) designed different REE prediction equations for children with burns in Cincinnati, OH. The authors evaluated a sample of 48 children who were divided by age into two groups (under 3 years and 5–10 years) and were randomized according to the % of BSA burned and the % of BSA with 3rd degree burns. Children who met the age criterion of each group, who were admitted within the first 10 days after burn injury, who received tube feeding within 24 h of admission and who had metabolic measurements determined on admission and weekly were included. Energy expenditure was measured by IC.
Four prediction equations were developed, stratified by age (under 3 and 5–10 years). An equation was developed for each age stratum mentioned above and considers the variables of preburn weight and % of BSA burned; another equation was developed for each age stratum, but this equation considers the variables of preburn weight and the % of BSA with 3rd degree burns. The R values for the correlations of the variables with energy expenditure were not mentioned. The equations had R2 values between 0.71 and 0.67, with the highest R2 value for the equation for patients younger than 3 years that considers the burn percentage variable and the lowest R2 value for the equation for patients aged 5–10 years that considered the % of BSA with 3rd degree burns. The equations are applicable for patients with burn injury covering 10–50% of their BSA.
Prediction equations for delivered energy were designed by White et al. (47) for intensive care patients on the basis of data from a sample of 100 patients who were critically ill (58 males and 42 females), receiving mechanical ventilation and aged 54 months +/− 53 months in the pediatric intensive care unit (ICU) in Brisbane, Australia. Patients who had recent (<90 min) changes in ventilator variables or anesthetic gas administration or were receiving dialysis were excluded. The main reason for admission was classified according to clinical status: head injury, postsurgical procedure, respiratory disease, sepsis and others. Energy expenditure was measured by IC.
In 2000, White et al. (47) proposed two equation models. In the first equation, the variables that correlated with energy expenditure for which cumulative coefficients of determination were reported were age (R2 = 0.804), weight (R2 = 0.847), weight-for-age Z-score (WAZ score) (R2 = 0.867), temperature (R2 = 0.88), days in the ICU (i.e., the number of days since admission; if >4, multiplied by 4) (R2 = 0.902) and admission ratio (R2 = 891). The second equation, a simplified version of the first equation, takes into account only weight and temperature. The R2 value was 0.898 for equation 1 and 0.867 for the simplified equation.
Additionally, 16 males and 9 females (n = 25) were included in the validation dataset, and it was concluded that the equations are not suitable for children under 2 months of age.
Meyer et al. (48) designed different equation models to determine REE in children with critical illness admitted to ICUs in London, UK, from a database of three centers; of these, two specialized in cardiac disorders, infectious diseases, respiratory failure and neurodevelopmental disorders, while the third specialized in liver failure. Children with critical illness and receiving ventilation (term birth to 16 years) were included, while those receiving bolus enteral feeding; receiving renal replacement therapy; with endotracheal tube leakage of more than 10%; with an FiO2 >0.6; and ventilated with heliox, nitric oxide, or high-frequency oscillatory ventilation, were excluded. Age (<3, 3–10 and 11–18 years) and diagnosis on admission (multiorgan, respiratory, cardiac, central nervous system (CNS), gastrointestinal, surgical or hepatic failure) were categorized for analysis. The authors included a population of 175 children with IC energy expenditure assessment results, mainly with respiratory and CNS diagnoses, excluding gastrointestinal disease due to sample size.
In 2012, Meyer et al. (48) established 3 equation models (A, B, and C); the variables considered for the equations were weight, age and diagnosis. The R value for the correlation of each of them with energy expenditure was not specified. The R2 values ranged from 0.829 (simplified model C) to 0.833 (model B).
In 2015, Mehta et al. (49) designed an REE prediction equation based on a modification of the Weir equation considering a cohort from a multicenter study in Boston, MA. The authors evaluated a sample of 72 pediatric patients under 18 years of age receiving mechanical ventilation. The authors included patients in the ICUs of two centers who underwent gas exchange measurement and respiratory quotient (RQ) acquisition by IC; patients had been receiving enteral or parenteral nutrition, which was discontinued at the time of measurement. Patients with IC tests with an RQ outside the physiological range (>1.3 or <0.67) were excluded. Steady state was defined as a period of at least 5 min with <10% fluctuation in oxygen consumption (VO2) and carbon dioxide elimination (VCO2) and <5% fluctuation in the RQ.
The modified Weir equation was used to generate the simplified equation. The mean RQ was determined from the derivation data set. VO2 in the modified Weir equation was then replaced with VCO2/RQ to derive the simplified equation (VCO2-REE), which included only the VCO2 value. Validation of the equation was performed in a sample of 94 patients. Neither the R value nor the R2 value of the equation model was reported.
The prediction equation for energy expenditure constructed by Jhang and Park (50) in 2020 for intensive care patients was based on a sample of 70 Korean children (32 males and 38 females) who were critically ill, receiving mechanical ventilation and aged 5 months to 17 years. Those with an FiO2 > 60% while under mechanical ventilation, a respiratory rate >35/min, a tidal volume <35 ml, an air leak, a chest tube, continuous renal replacement therapy or extracorporeal membrane oxygenation, or severe fluid leakage by pleural or peritoneal drainage; those who were admitted to the ICU for <1 day; those with incomplete IC measurement; or those younger than 1 month or older than 18 years were excluded. Energy expenditure was measured by IC.
An energy expenditure equation was established using the variables of weight, height and organ dysfunction (hematological and neurological). The R values for the correlations of each variable with energy expenditure were not documented, but an R2 value of 0.865 was documented for the final model of the equation.
Twenty-five patients (14 males and 11 females) from a cohort were included for the validation of the equation, which showed less bias (15.51 kcal/day) and better percent agreement with the IC measurement (102.30% ± 28.10%) than other equations in use in pediatrics, such as the Schofield (10), Oxford (4), and FAO/WHO equations (9).
Pierro et al. (51) developed an REE prediction equation for stable infants undergoing surgery in Liverpool, UK, on the basis of data from a sample of 46 (24 males and 22 females) infants under 6 months of age who required a surgical procedure for gastrointestinal abnormalities and were receiving total parenteral (28 infants) or mixed parenteral and enteral (18 infants) feeding. Those with sepsis, congenital metabolic disorders, congenital heart defects and those requiring ventilatory support were excluded. Additional analyses were performed in 9 infants to validate the predictive value of the equation.
The variables that correlated with energy expenditure and are taken into account in the equation are weight (R = 0.87), heart rate (R = 0.60) and age (R = 0.49). The equation proposed by Pierro et al. (51) in 1994 had an R value for the correlation with energy expenditure of 0.92. The result is expressed in calories per minute. To convert to kcal/kg/d, the result of the equation is multiplied by 1.44 and divided by weight.
The equation can be applied to predict basal energy requirements in stable infants undergoing surgery from birth to 5 months of age.
An REE prediction equation was designed by Mayes et al. (52) in 2008 for patients with SJS and TEN in Cincinnati, OH. The data of 15 patients aged 9–12 years with a diagnosis of SJS and TEN who met the inclusion criterion of admission within 10 days of peel initiation were retrospectively evaluated. Energy expenditure was measured by IC.
A prediction equation was established with the variables of preinjury weight and wound size as a % of total BSA. The R values for the correlations of each variable with energy expenditure were not documented, but an R2 value of 0.73 was documented for the final equation model.
In 1990 in Paris, France, Salas et al. (53) designed an REE prediction equation for children receiving total parenteral nutrition (TPN). The authors studied a total sample of 37 children ranging in age from 2 to 7 years, and the population was divided into two groups, A (n = 14) and B (n = 23), who were defined according to their weight-to-height ratio (weight/height) as <90 and >90%, respectively (ideal = 100%). The weight-for-height index represents weight as the percentage of children with normal weight and the same height and is an accurate index of nutritional status. No child in this study had a weight-for-height index >110%.
Those with the following pathologies were included: intractable diarrhea of childhood, Crohn's disease, liver disease, short bowel syndrome, and others (unspecified). Those with infection or renal failure were excluded. The authors performed skinfold measurements in 3 areas (the triceps, subscapularis biceps and suprailiac areas). They used Brook's equation (56) to determine body density from the sum of skinfold measurements. The %BF was derived from body density by using Siri's (57) equations (% BF= (4.95/density)−4.5), where BF is the product of weight and % BM. BFM is the difference between body weight and BM. Twenty-four-hour urine collections were taken on the same day as the energy expenditure measurement. Creatinine in 24-h urine was measured using an analytical procedure based on the Jaffe reaction (58). Twenty-four-hour urinary nitrogen was measured by the Kjeldahl method (59).
Energy expenditure was measured by IC, and continuous REE measurements were taken for 5.9 ± 2.4 h in group A and 5.5 ± 2.2 h in group B. During the recorded days, the REE of children receiving continuous TPN was measured for three periods of 3 h each. For patients receiving cyclic TPN, recording was performed for 3–4 h at 6 h after TPN was discontinued.
Correlations with REE were reported for the variables FFM (R = 0.984) and creatinine/weight (R = 0.394); for the final equation model, an R value of 0.987 was documented.
Prediction equations for REE in patients receiving TPN were designed by Moukarzel et al. (54) in 2003. The authors evaluated a sample of 26 children (12 males and 14 females) from a department of pediatrics in Paris, France. The patients ranged in age from 38 to 62 months and were receiving TPN (at least 3 months) due to diarrhea (n = 20) or short bowel syndrome (n = 6). Patients were stable and had good nutritional status (weight-for-height index). Skinfold measurements were taken in 4 areas (the biceps, triceps, subscapular and suprailiac areas).
The authors performed skinfold measurements in 4 areas (the triceps, subscapular biceps and suprailiac areas). The authors used Brook's equation (57) to determine body density from the sum of skinfold measurements. %BF was derived from body density using Siri's equation (58). FFM was the difference between weight and BM. Energy expenditure was assessed by IC.
The authors established 3 equation models: the first model uses the variable of FFM, the second model uses the variable of weight, and the third model uses the variables of FFM and FM. The R values for the correlations between the variables and energy expenditure were not reported. The equation that had the highest R2 value was the one that used the variables of FFM and FM, with R2 = 0.985.
We present a review of 39 studies in which equations were designed to predict energy expenditure in pediatric patients. Here, the R2 value was evaluated to determine the best model. It was shown that in healthy children who were described as having no significant medical problems, the FAO/WHO and Schofield equations had the highest R2 values and were simple equations that could be applied to a wide age range (3–18 years). The FAO/WHO equation was derived from a study population including pediatric patients in developed and underdeveloped countries, including Latin American countries, unlike the Schofield equation, which was derived mostly from the Italian population (11, 12).
In adolescent children with obesity, the equation of Molnár et al. (21) had the highest R2 value and is recommended for its simplicity, as it requires only weight, height and age data. Likewise, the equation of Dietz et al. (18) is recommended for older-age pediatric patients (10–18 years), as it has easily obtainable variables (weight and height) and good correlation with energy expenditure. Other equations, such as that of Tverskaya et al. (24), had high R2 values but used variables such as FFM and FM, which require specialized equipment that is difficult to obtain.
On the other hand, in patients with specific clinical conditions, the simplified equation of Meyer et al. (48) was demonstrated to be useful in patients receiving mechanical ventilation, as it had a good R2 for patients with critical illness aged 3–18 years and was simple to use since it requires only weight. Other authors proposed two equations for patients with sickle cell disease. Buchowski et al. (2) proposed two models: one is a simple equation with a good R2 value, and the other requires FFM data. On the other hand, in children post surgery, a good R2 value was observed for the Pierro et al. (51) equation, which utilizes variables that are easy to obtain; however, the main limitation of this equation was the age range (5 months). There were two equations proposed for patients receiving parenteral nutrition support, those of Salas et al. (53) and Moukarzel et al. (54); both had high R2 values.
Of the 91 models, body weight was used in 53, height was used in 26, age was used in 26 and sex was used in 13. These variables are considered easy to obtain in a doctor's office or any hospital. Other parameters that are considered in the equations are BSA, wrist circumference, MUAMC, menarche status, skin fat, body temperature, PIBW, WAZ score, days in the ICU, diagnostic category or coefficient, Hb and heart rate, all of which can be obtained without the use of any expensive instruments. Regarding body composition, FFM was used in 30 models, and FM was used in 11; however, these measurements were performed by skinfold measurements, BIA or DEXA, and the latter are not very accessible and may require trained personnel.
It is important to note that the Harris-Benedict equation, which was developed for the adult population, was included in the present review because it is one of the earliest equations generated (1918) and is the most widely used, even in the pediatric field. Two systematic reviews documented that the Harris-Benedict equation was included for the assessment of accuracy and precision in pediatric populations with obesity and critical illness (60, 61). These reviews have even been used as a basis for designing new equations modified from the Harris-Benedict equation (7).
It is important to consider possible bias induced by variables whose estimation or measurement, in clinical practice, may be different from those proposed and consider in the equation methodology, i.e., body composition (FM and/or FFM) evaluated by DEXA, as in the equation of Schmelze et al. (26), and clinical skinfold measurements, for their estimation and subsequent application in the equation. Future studies could consider the external validity of this adaptation.
An important process in the generation of energy expenditure prediction equations is the external validation of the equation, which must be performed in a population that is different from the one in which the equation was derived but shares the characteristics of the target population; of the studies in this review, only 9 mentioned the development and validation of the formula (21, 24, 27, 31, 47, 49–51); however, equations such as the FAO/WHO, Schofield, Harris and Benedict and Henry equations have been validated post publication and in various pediatric populations (2). In this systematic review, no equations that focused on populations with cancer, renal disease or liver disease were identified; this issue is important because some of these equations have been documented to have significant bias when used in the cancer population, for example (62).
This is the first known systematic review to date that reviews most of the equations designed for healthy pediatric populations and those with disease and focuses mainly on the development of each equation, with emphasis on its value in determining the final model. Thus, a strength of the study is that it summarizes the design process of each equation, which allows clinicians to broaden the criteria for choosing which equation to use in the clinical setting. However, the limitation of this study was that some published and commonly used equations had only R values and did not determine the R2; therefore, the conversion of R values to R2 values was performed to jointly evaluate the models. Another limitation of this study is that correlation coefficients were used to compare measured and predicted values of energy expenditure. This analysis merely assesses the relationship between measured and predicted values and does not assess the closeness of the predicted values to measured values.
A wide variety of equations for the prediction of REE and BEE in the pediatric population have been published, and these equations are very heterogeneous in terms of the population in which they were established as well as the variables used in the prediction models. Although variables such as body weight, height, age, and gender were used in most equations, variables that are less accessible, such as body composition and Hb, were used in other equations. In clinical practice, precision is more important than accuracy of the equations, especially when measuring longitudinally; however, the magnitude of the accuracy of the equations should not be neglected. Important information included in this review of REE and BEE predictive equations for the pediatric population is the compendium of most of the equations; the population in which each equation was constructed (characteristics) can be observed, as well as the variables used in each equation and the values of adjustment considering the reference standard. Therefore, a critical evaluation of which equation should be used depending on the type of patient in clinical practice can be performed, allowing improvements in the estimates of energy requirements.
The original contributions presented in the study are included in the article/Supplementary Material, further inquiries can be directed to the corresponding author/s.
MG-C and IM-V designed the research. JF-S, AA-N, LG-S, OP-G, MS-R, AS-Z, IM-V, and MG-C performed the research and drafted the manuscript. JF-S, AA-N, LG-S, IM-V, and MG-C analyzed the data. All authors contributed to the article and approved the submitted version.
This work was supported by Consejo Nacional de Ciencia y Tecnología (México) Grant: CONACYT-FRONTERAS 2019 (501225/2020). Monetary sponsorship was received from Hospital Regional de Alta Especialidad de la Península de Yucatán, Mérida, Yucatán, Departamento de Fisiología de la Nutrición, Instituto Nacional de Nutrición y Ciencias Médicas y Nutrición Salvador Zubirán, Ciudad de México, México, and Departamento de Metodología de la Investigación, Instituto Nacional de Pediatría, Ciudad de México, México.
The authors declare that the research was conducted in the absence of any commercial or financial relationships that could be construed as a potential conflict of interest.
All claims expressed in this article are solely those of the authors and do not necessarily represent those of their affiliated organizations, or those of the publisher, the editors and the reviewers. Any product that may be evaluated in this article, or claim that may be made by its manufacturer, is not guaranteed or endorsed by the publisher.
The Supplementary Material for this article can be found online at: https://www.frontiersin.org/articles/10.3389/fped.2021.795364/full#supplementary-material
BEE, basal energy expenditure; BF, body fat; BIA, bioelectrical impedance analysis; BMI, body mass index; BMISD, body mass index standard deviation; BSA, body surface area; CenI, centrality index; CNS, central nervous system; ConI, conicity index; DEXA, dual-energy X-ray absorptiometry; DSM, ; Diagnostic and Statistical Manual of Mental Disorders, ; FIO2, fractional inspiratory oxygen fraction; FFM, fat-free mass, FM, fat mass; G3, gonadal pubertal stage 3; Hb, hemoglobin; IC, indirect calorimetry; ICU, intensive care unit; IOM, Institute of Medicine; MUAMC, mid-upper arm muscle circumference; NHLBI, National Heart, Lung and Blood Institute; PBEE, basal energy expenditure; %BF, percentage body fat; PEEP, positive end-expiratory pressure; PIBW, percent ideal body weight; R, Pearson's correlation coefficient; R2, coefficient of determination; REE, resting energy expenditure; RQ, respiratory quotient; SJS, Stevens-Johnson syndrome; TEE, total energy expenditure; TEN, toxic epidermal necrolysis; TPN, total parenteral nutrition; VCO2, carbon dioxide elimination; VO2, oxygen consumption; WAZ score, weight-for-age Z-score.
1. Henes ST, Cummings DM, Hickner RC, Houmard JA, Kolasa KM, Lazorick S, et al. Comparison of predictive equations and measured resting energy expenditure among obese youth attending a pediatric healthy weight clinic: one size does not fit all. Nutr Clin Pract. (2013) 28:617–24. doi: 10.1177/0884533613497237
2. Henry CJ. Basal metabolic rate studies in humans: measurement and development of new equations. Public Health Nutr. (2005) 8:1133–52. doi: 10.1079/phn2005801
3. Finan K, Larson DE, Goran MI. Cross-validation of prediction equations for resting energy expenditure in young, healthy children. J Am Diet Assoc. (1997) 97:140–5. doi: 10.1016/s0002-8223(97)00039-4
4. Rodríguez G, Moreno LA, Sarría A, Fleta J, Bueno M. Resting energy expenditure in children and adolescents: agreement between calorimetry and prediction equations. Clin Nutr. (2002) 21:255–60. doi: 10.1054/clnu.2001.0531
5. Medina-Vera I, Fuentes-Servín J, GonzáleZ-Salazar LE, Guevara-Cruz M, PéreZ-González OA. Energy expenditure prediction equations in pediatric population: a systematic review. PROSPERO 2021 CRD42021226270. Available online at: https://www.crd.york.ac.uk/prospero/display_record.php?ID=CRD42021226270 (accessed March 18, 2021).
6. Moher D, Liberati A, Tetzlaff J, Altman DG. Preferred reporting items for systematic reviews and meta-analyses: the PRISMA statement. PLoS Med. (2009) 6:e1000097. doi: 10.1371/journal.pmed.1000097
7. Harris JA, Benedict FG. A biometric study of human basal metabolism. Proc Natl Acad Sci USA. (1918) 4:370–3. doi: 10.1073/pnas.4.12.370
8. National Institution of Health. Quality Assessment Tool for Observational Cohort and Cross-Sectional Studies. Bethesda, Maryland: National Institution of Health (2014).
9. FAO/WHO/UNU. Energy and Protein Requirements, Technical Report Series 724. Geneva: World Health Organization (1985).
10. Schofield WN. Predicting basal metabolic rate, new standards and review of previous work. Hum Nutr Clin Nutr. (1985) 39 Suppl 1:5–41.
11. Henry CJ, Dyer S, Ghusain-Choueiri A. New equations to estimate basal metabolic rate in children aged 10-15 years. Eur J Clin Nutr. (1999) 53:134–42. doi: 10.1038/sj.ejcn.1600690
12. Institute Institute for Medicine of the National Academies Food and Nutrition Board. Dietary Reference Intakes for Energy, Carbohydrate, Fiber, Fat, Fatty Acids, Cholesterol, Protein, and Amino Acids. Washington, DC: The National Academies Press (2002).
13. Lawrence JC, Lee HM, Kim JH, Kim EK. Variability in results from predicted resting energy needs as compared to measured resting energy expenditure in Korean children. Nutr Res. (2009) 29:777–83. doi: 10.1016/j.nutres.2009.10.017
14. Kaneko K, Ito C, Koizumi K, Watanabe S, Umeda Y, Ishikawa-Takata K. Resting energy expenditure (REE) in six- to seventeen-year-old Japanese children and adolescents. J Nutr Sci Vitaminol. (2013) 59:299–309. doi: 10.3177/jnsv.59.299
15. Heymsfield SB, McManus C, Smith J, Stevens V, Nixon DW. Anthropometric measurement of muscle mass: revised equations for calculating bone-free arm muscle area. Am J Clin Nutr. (1982) 36:680–90. doi: 10.1093/ajcn/36.4.680
16. Du Bois D, Du Bois EF. A formula to estimate the approximate surface area if height and weight be known 1916. Nutrition. (1989) 5:303–11; discussion 12–3.
17. McDuffie JR, Adler-Wailes DC, Elberg J, Steinberg EN, Fallon EM, Tershakovec AM, et al. Prediction equations for resting energy expenditure in overweight and normal-weight black and white children. Am J Clin Nutr. (2004) 80:365–73. doi: 10.1093/ajcn/80.2.365
18. Dietz WH, Bandini LG, Schoeller DA. Estimates of metabolic rate in obese and nonobese adolescents. J Pediatr. (1991) 118:146–9. doi: 10.1016/s0022-3476(05)81870-0
19. Tounian P, Girardet JP, Carlier L, Frelut ML, Veinberg F, Fontaine JL. Resting energy expenditure and food-induced thermogenesis in obese children. J Pediatr Gastroenterol Nutr. (1993) 16:451–7. doi: 10.1097/00005176-199305000-00019
20. Maffeis C, Schutz Y, Micciolo R, Zoccante L, Pinelli L. Resting metabolic rate in six- to ten-year-old obese and nonobese children. J Pediatr. (1993) 122:556–62. doi: 10.1016/s0022-3476(05)83535-8
21. Molnár D, Jeges S, Erhardt E, Schutz Y. Measured and predicted resting metabolic rate in obese and nonobese adolescents. J Pediatr. (1995) 127:571–7. doi: 10.1016/s0022-3476(95)70114-1
22. Müller MJ, Bosy-Westphal A, Klaus S, Kreymann G, Lührmann PM, Neuhäuser-Berthold M, et al. World Health Organization equations have shortcomings for predicting resting energy expenditure in persons from a modern, affluent population: generation of a new reference standard from a retrospective analysis of a German database of resting energy expenditure. Am J Clin Nutr. (2004) 80:1379–90. doi: 10.1093/ajcn/80.5.1379
23. Uemura A, Mexitalia M, Susanto JC, Yamauchi T. Validating predictive factors for resting energy expenditure of adolescents in Indonesia. Int J Food Sci Nutr. (2012) 63:145–52. doi: 10.3109/09637486.2011.607800
24. Tverskaya R, Rising R, Brown D, Lifshitz F. Comparison of several equations and derivation of a new equation for calculating basal metabolic rate in obese children. J Am Coll Nutr. (1998) 17:333–6. doi: 10.1080/07315724.1998.10718771
25. Derumeaux-Burel H, Meyer M, Morin L, Boirie Y. Prediction of resting energy expenditure in a large population of obese children. Am J Clin Nutr. (2004) 80:1544–50. doi: 10.1093/ajcn/80.6.1544
26. Schmelzle H, Schröder C, Armbrust S, Unverzagt S, Fusch C. Resting energy expenditure in obese children aged 4 to 15 years: measured versus predicted data. Acta Paediatr. (2004) 93:739–46. doi: 10.1111/j.1651-2227.2004.tb01000.x
27. Lazzer S, Agosti F, De Col A, Sartorio A. Development and cross-validation of prediction equations for estimating resting energy expenditure in severely obese Caucasian children and adolescents. Br J Nutr. (2006) 96:973–9. doi: 10.1017/bjn20061941
28. Chan DF Li AM, Chan MH, So HK, Chan IH, Yin JA, et al. Validation of prediction equations for estimating resting energy expenditure in obese Chinese children. Asia Pac J Clin Nutr. (2009) 18:251–6. doi: 10.6133/APJCN.2009.18.2.14
29. Lazzer S, Bedogni G, Lafortuna CL, Marazzi N, Busti C, Galli R, et al. Relationship between basal metabolic rate, gender, age, and body composition in 8,780 white obese subjects. Obesity. (2010) 18:71–8. doi: 10.1038/oby.2009.162
30. Lazzer S, Patrizi A, De Col A, Saezza A, Sartorio A. Prediction of basal metabolic rate in obese children and adolescents considering pubertal stages and anthropometric characteristics or body composition. Eur J Clin Nutr. (2014) 68:695–9. doi: 10.1038/ejcn.2014.26
31. Acar-Tek N, Agagündüz D, Çelik B, Bozbulut R. Estimation of resting energy expenditure: validation of previous and new predictive equations in obese children and adolescents. J Am Coll Nutr. (2017) 36:470–80. doi: 10.1080/07315724.2017.1320952
32. Zhang L, Chen R, Li R, Chen MY, Huang R, Li XN. Evaluating the predictive factors of resting energy expenditure and validating predictive equations for Chinese obese children. World J Pediatr. (2018) 14:160–7. doi: 10.1007/s12519-017-0111-9
33. Chu L, Steinberg A, Mehta M, O'Kane C, Toulany A, Langer JC, et al. Resting energy expenditure and metabolic adaptation in adolescents at 12 months after bariatric surgery. J Clin Endocrinol Metab. (2019) 104:2648–56. doi: 10.1210/jc.2018-02244
34. Durnin JV, Rahaman MM. The assessment of the amount of fat in the human body from measurements of skinfold thickness. Br J Nutr. (1967) 21:681–9. doi: 10.1079/bjn19670070
35. Lohman TG. Applicability of body composition techniques and constants for children and youths. Exerc Sport Sci Rev. (1986) 14:325–57. doi: 10.1249/00003677-198600140-00014
36. Parizkova J, Roth Z. The assessment of depot fat in children from skinfold thickness measurements by Holtain (Tanner-Whitehouse) caliper. Hum Biol. (1972) 44:613–20.
37. Cole TJ, Bellizzi MC, Flegal KM, Dietz WH. Establishing a standard definition for child overweight and obesity worldwide: international survey. BMJ. (2000) 320:1240–3. doi: 10.1136/bmj.320.7244.1240
38. Lazzer S, Boirie Y, Meyer M, Vermorel M. Which alternative method to dual-energy X-ray absorptiometry for assessing body composition in overweight and obese adolescents? Arch Pediatr. (2005) 12:1094–101. doi: 10.1016/j.arcped.2005.03.040
39. Lazzer S, Bedogni G, Agosti F, De Col A, Mornati D, Sartorio A. Comparison of dual-energy X-ray absorptiometry, air displacement plethysmography and bioelectrical impedance analysis for the assessment of body composition in severely obese Caucasian children and adolescents. Br J Nutr. (2008) 100:918–24. doi: 10.1017/s0007114508922558
40. Gray DS, Bray GA, Gemayel N, Kaplan K. Effect of obesity on bioelectrical impedance. Am J Clin Nutr. (1989) 50:255–60. doi: 10.1093/ajcn/50.2.255
41. Williams R, Olivi S, Mackert P, Fletcher L, Tian GL, Wang W. Comparison of energy prediction equations with measured resting energy expenditure in children with sickle cell anemia. J Am Diet Assoc. (2002) 102:956–61. doi: 10.1016/s0002-8223(02)90219-1
42. Buchowski MS, Chen KY, Byrne D, Wang WC. Equation to estimate resting energy expenditure in adolescents with sickle cell anemia. Am J Clin Nutr. (2002) 76:1335–44. doi: 10.1093/ajcn/76.6.1335
43. Scalfi L, Marra M, De Filippo E, Caso G, Pasanisi F, Contaldo F. The prediction of basal metabolic rate in female patients with anorexia nervosa. Int J Obes Relat Metab Disord. (2001) 25:359–64. doi: 10.1038/sj.ijo.0801547
44. Bertoli S, De Amicis R, Bedogni G, Foppiani A, Leone A, Ravella S, et al. Predictive energy equations for spinal muscular atrophy type I children. Am J Clin Nutr. (2020) 111:983–96. doi: 10.1093/ajcn/nqaa009
45. Goran MI, Broemeling L, Herndon DN, Peters EJ, Wolfe RR. Estimating energy requirements in burned children: a new approach derived from measurements of resting energy expenditure. Am J Clin Nutr. (1991) 54:35–40. doi: 10.1093/ajcn/54.1.35
46. Mayes T, Gottschlich MM, Khoury J, Warden GD. Evaluation of predicted and measured energy requirements in burned children. J Am Diet Assoc. (1996) 96:24–9. doi: 10.1016/s0002-8223(96)00008-9
47. White MS, Shepherd RW, McEniery JA. Energy expenditure in 100 ventilated, critically ill children: improving the accuracy of predictive equations. Crit Care Med. (2000) 28:2307–12. doi: 10.1097/00003246-200007000-00021
48. Meyer R, Kulinskaya E, Briassoulis G, Taylor RM, Cooper M, Pathan N, et al. The challenge of developing a new predictive formula to estimate energy requirements in ventilated critically ill children. Nutr Clin Pract. (2012) 27:669–76. doi: 10.1177/0884533612448479
49. Mehta NM, Smallwood CD, Joosten KF, Hulst JM, Tasker RC, Duggan CP. Accuracy of a simplified equation for energy expenditure based on bedside volumetric carbon dioxide elimination measurement—a two-center study. Clin Nutr. (2015) 34:151–5. doi: 10.1016/j.clnu.2014.02.008
50. Jhang WK, Park SJ. Energy expenditure in mechanically ventilated korean children: single-center evaluation of a new estimation equation. Pediatr Crit Care Med. (2020) 21:e522–9. doi: 10.1097/pcc.0000000000002335
51. Pierro A, Jones MO, Hammond P, Donnell SC, Lloyd DA. A new equation to predict the resting energy expenditure of surgical infants. J Pediatr Surg. (1994) 29:1103–8. doi: 10.1016/0022-3468(94)90288-7
52. Mayes T, Gottschlich M, Khoury J, Warner P, Kagan R. Energy requirements of pediatric patients with Stevens-Johnson syndrome and toxic epidermal necrolysis. Nutr Clin Pract. (2008) 23:547–50. doi: 10.1177/0884533608323434
53. Salas JS, Moukarzel E, Dozio E, Goulet OJ, Putet G, Ricour C. Estimating resting energy expenditure by simple lean-body-mass indicators in children on total parenteral nutrition. Am J Clin Nutr. (1990) 51:958–62. doi: 10.1093/ajcn/51.6.958
54. Moukarzel AA, Salas JS, Goulet OJ, Ricour CC. Estimate of specific energy expenditure of fat-free mass and fat mass in children receiving total parenteral nutrition. J Med Liban. (2003) 51:206–10.
55. Schebendach J, Golden NH, Jacobson MS, Arden M, Pettei M, Hardoff D, et al. Indirect calorimetry in the nutritional management of eating disorders. Int J Eat Disord. (1995) 17:59–66. doi: 10.1002/1098-108x(199501)17:1<59::aid-eat2260170108>3.0.co;2-f
56. Brook CG. Determination of body composition of children from skinfold measurements. Arch Dis Child. (1971) 46:182–4. doi: 10.1136/adc.46.246.182
57. Siri WE. Body composition from fluid spaces and density: analysis of methods. In: Brozek J, Henschel A, editors. Techniques for Measuring Body Composition. Washington, DC: National Academy of Sciences (1961). p. 223–44.
58. Chasson A, Grady H, Stanley M. Automation of the creatinine technique. Am J Clin Pathol. (1931) 35:83–8. doi: 10.1093/ajcp/35.1_ts.83
59. Munro HN, Fleck A. Analysis of tissues and body fluids for nitrogenous constituents. In: Munro HN, editor. Mammalian Protein Metabolism. New York, NY: Academic Press (1969). p. 423–525.
60. Chima L, Mulrooney HM, Warren J, Madden AM. A systematic review and quantitative analysis of resting energy expenditure prediction equations in healthy overweight and obese children and adolescents. J Hum Nutr Diet. (2020) 33:373–85. doi: 10.1111/jhn.12735
61. Chaparro CJ, Moullet C, Taffé P, Laure Depeyre J, Perez MH, Longchamp D, et al. Estimation of resting energy expenditure using predictive equations in critically ill children: results of a systematic review. JPEN J Parenter Enteral Nutr. (2018) 42:976–86. doi: 10.1002/jpen.1146
Keywords: energy expenditure, children, adolescents, indirect calorimetry, predictive equation
Citation: Fuentes-Servín J, Avila-Nava A, González-Salazar LE, Pérez-González OA, Servín-Rodas MDC, Serralde-Zuñiga AE, Medina-Vera I and Guevara-Cruz M (2021) Resting Energy Expenditure Prediction Equations in the Pediatric Population: A Systematic Review. Front. Pediatr. 9:795364. doi: 10.3389/fped.2021.795364
Received: 15 October 2021; Accepted: 11 November 2021;
Published: 06 December 2021.
Edited by:
Fatima Cody Stanford, Massachusetts General Hospital and Harvard Medical School, United StatesReviewed by:
Thomai Karagiozoglou- Lampoudi, International Hellenic University, GreeceCopyright © 2021 Fuentes-Servín, Avila-Nava, González-Salazar, Pérez-González, Servín-Rodas, Serralde-Zuñiga, Medina-Vera and Guevara-Cruz. This is an open-access article distributed under the terms of the Creative Commons Attribution License (CC BY). The use, distribution or reproduction in other forums is permitted, provided the original author(s) and the copyright owner(s) are credited and that the original publication in this journal is cited, in accordance with accepted academic practice. No use, distribution or reproduction is permitted which does not comply with these terms.
*Correspondence: Martha Guevara-Cruz, bWFydGhhZ3VldmFyYThAeWFob28uY29tLm14; Isabel Medina-Vera, aXNhYmVsai5tZWRpbmF2QGdtYWlsLmNvbQ==
†These authors have contributed equally to this work
Disclaimer: All claims expressed in this article are solely those of the authors and do not necessarily represent those of their affiliated organizations, or those of the publisher, the editors and the reviewers. Any product that may be evaluated in this article or claim that may be made by its manufacturer is not guaranteed or endorsed by the publisher.
Research integrity at Frontiers
Learn more about the work of our research integrity team to safeguard the quality of each article we publish.