 De-Yi Li1
 Ling Li1,2†Gui-Zhou Li1,2†
 Ya-Hui Hu1
 Hong-Li Guo1Xia Jing1
 Feng Chen1*
 Xing Ji1*Jing Xu1Hao-Ran Dai1,2†
- 1Pharmaceutical Sciences Research Center, Department of Pharmacy, Children's Hospital of Nanjing Medical University, Nanjing, China
- 2School of Basic Medicine and Clinical Pharmacy, China Pharmaceutical University, Nanjing, China
There have been good amounts of population pharmacokinetics (PPK) models of vancomycin for Chinese pediatric patients, but none of them had a special focus on modeling infant population with different levels of renal function. Since renal function variability is prominent among infant population and the clearance (CL) of vancomycin is heavily related to renal excretion, it is important to establish precise PPK models based on individual renal function levels. We employed a PPK approach to develop three models of vancomycin in parallel for Chinese pediatric patients with normal renal function [estimated glomerular filtration rate (eGFR) between 30 and 86 ml/min/1.73 m2, Model 1], with augmented renal function (eGFR ≥ 86 ml/min/1.73 m2, Model 2), or with all levels of renal function (Model 3). Three one-compartment models with first-order elimination kinetics were established. The predictive ability of Model 1 and Model 2 among each certain population is comparable with that of Model 3 with no statistical difference. Our study revealed that among the infant population with augmented renal function, only body weight was included as a covariate, which indicated that for an infant whose eGFR ≥ 86 ml/min/1.73 m2, taking blood sample is not compulsory for predicting vancomycin blood concentration, which avoids unnecessary injury to vulnerable infants.
Introduction
Vancomycin is an old glycopeptide antimicrobial drug developed in the 1950s, which renders its pharmacological effects by interfering with the cell wall synthesis of Gram-positive bacteria (1). For decades, it remained in the first-line choice for the treatment of methicillin-resistant Staphylococcus aureus (MRSA), which was recommended by the guidelines issued by the Infectious Diseases Society of America and specific pediatric guidance (2). Vancomycin is a hydrophilic drug and mainly eliminated through the glomerular filtration. Approximately 90% of the drug remain unchanged during the excretion process (3). Thus, renal function plays a pivotal role in the pharmacokinetics of vancomycin.
Augmented renal function (ARC) is defined as enhanced renal elimination of solute as compared with an expected baseline. In the context of antibacterial therapy, ARC has the potential to result in subtherapeutic dosing, treatment failure, or selection of resistant microorganisms (4). One study suggested that a large proportion (67%) of critically ill children develop ARC during their stay at the intensive care unit (5). However, the mechanism of ARC has not reached a consensus, but several authors argued that systemic inflammatory response syndrome (SIRS) and renal function reserve (RFR) can be associated with ARC (6). We believe that the ARC infant population share similar physiological condition and possess their unique pharmacokinetics characteristics. Thus, it is important to establish population pharmacokinetics (PPK) models of vancomycin based on different renal function levels.
Several studies on the PPK model of vancomycin for neonates and infants have been published. However, findings from these reports varied a lot. The full characteristics of these previous results are listed in Table 1. We found that almost all of these models included weight (WT) as a covariate in the final model, but some renal function indicators, like serum creatinine (SCR) or creatinine clearance rate (CLCR), were only retained in part of these models. One of explanations is that all of these PPK models were commonly built on a mixture of patients with different renal function levels. Due to population selecting differences, some factors that should be included or excluded in certain group of people with similar physiological condition may or may not be retained in the models, which led to some missing parameters or redundancy of some parameters.
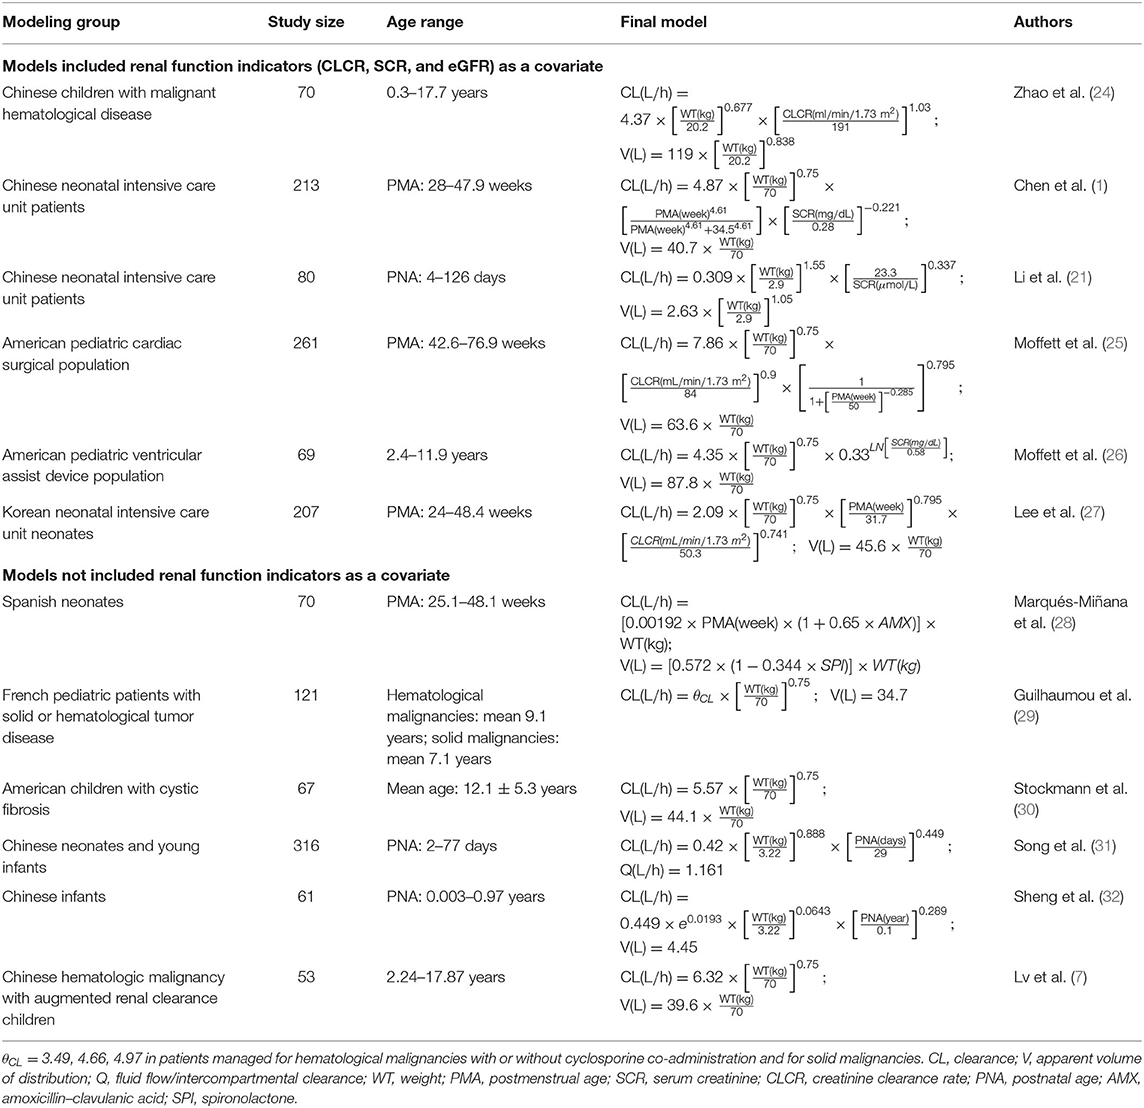
Table 1. A mini-review of previous vancomycin PPK models for pediatric patients.
The aim of this study was to develop two PPK models of vancomycin for Chinese infants with normal and ARC levels and to analyze the parameter differences between the two models. We also wanted to determine whether the predictive performance of the two final models was better or not when compared with that of a third model built on the whole population data with all levels of renal function (a traditional approach used by previous studies).
Materials and Methods
Patients
Pediatric patients who received vancomycin treatment between January 2017 and July 2021 in Children's Hospital of Nanjing Medical University were enrolled in our study. The inclusion criteria were as follows: (1) post-natal age between 1 and 24 months, (2) received vancomycin through an intravenous infusion for at least 3 days, (3) at least one trough and one peak vancomycin blood concentrations were assayed, and (4) estimated glomerular filtration rate (eGFR) ≥ 30 ml/min/1.73 m2. Age, WT, height (HT), alanine transferase (ALT), aspartate transaminase (AST), blood urea nitrogen (BUN), SCR, Cystatin C (CYSC), albumin (ALB), total protein (TP), daily dosage (DD), and concomitant medication were retrospectively collected from the electronic medical records of the hospital information system. eGFR was calculated by the modified Schwartz formula (7):
where k is 0.33 for preterm infants <1 year, 0.45 for full-term infants <1 year, and 0.55 for children between 2 and 12 years.
The external validation groups were randomly sampled from the whole population group. The rest of the patients were all recruited in the modeling group. According to Heilbron et al. normal GFR during infancy classification (8), we choose 30–86 ml/min/1.73 m2 as the threshold value for infant normal renal function level. Patients whose eGFR were between 30 and 86 ml/min/1.73 m2 were enrolled in the normal renal function group, while patients whose eGFR were ≥86 ml/min/1.73 m2 were enrolled in the ARC group. The study was conducted according to the guidelines of the Declaration of Helsinki and was approved by the Ethics Committee of the Children's Hospital of Nanjing Medical University (9). Patient consent was waived due to the nature of retrospective study.
Vancomycin (VIANEX S.A, Pallini, Greece) was administrated through intravenous infusion. For studied infants, the dosage of 40 mg/kg should be administrated two to four times per day, and the intravenous infusion time should be longer than 60 min. Dose adjustment was performed according to the results of therapeutic drug monitoring (TDM) of vancomycin, clinical efficacy, and adverse reactions.
Bioassay
Whole blood samples were collected and assayed 30 min before the fifth administration of a series of same dosage of vancomycin for the trough concentration data and 30 min after the fifth administration of vancomycin for the peak concentration data. Enzyme multiplied immunoassay technique (Emit® 2000; SIEMENS, Munich, Germany) was employed for the quantitative analysis for vancomycin. The calibration range of the assay was 2.0–50 μg/ml (1.3–34 μmol/L). Quality control samples with a deviation of ±15% were applied to ensure the accuracy and precision of the EMIT method. The accuracy and precision of quality control samples based on three concentration levels were all within the acceptable criteria. At least one trough and one peak concentrations were collected for each enrolled child.
Model Building
The NONMEN program (Version 7.4; Icon Inc., North Wales, PA, USA) compiled with gFortran (Version 4.9.2) was employed to establish the PPK models of vancomycin. R package version 3.6.1, and Xpose 4.5.3 were used to evaluate the models (10). The following model building procedure was employed to develop three models in parallel:
Model 1: Vancomycin PPK model for normal renal function (eGFR between 30 and 86 ml/min/1.73 m2) group
Model 2: Vancomycin PPK model for ARC (eGFR ≥ 86 ml/min/1.73 m2) group
Model 3: Vancomycin PPK model for the whole population group with all levels of renal function (the patient data model 3 built was generated by combining the patient data for models 1 and 2).
Base Model
According to previous PPK studies of vancomycin in pediatric patients, we chose one-compartment model with first-order elimination, specified to NONMEM by ADVAN1-TRANS2 subroutine, as the foundation of base model. The one-compartment PK parameters include clearance (CL) and apparent volume of distribution (V). Between-subject variability (BSV) was described by exponential, proportional, and additive models separately; and exponential model was chosen at last for its better fitting results. The formula is described as follows:
where Pi represents the ith patient's individual PK parameter value; TV(P) represents the typical individual parameter value; ηi is the random variable, which has zero mean and variance of ω2; and EXP(ηi) represents the deviation of TV(P) from Pi.
Then, residual variance was evaluated by the additive model, proportional model, and mixed-error model, as follows:
where Y represents the individual observed concentration and F represents the individual predictive concentration. ε is a symmetrical variable with a mean of zero and variability of σ2. Among all of three residual variance models, the one that can reach the smallest objective function values (OFVs) is retained in the base model. In addition, the final results of bootstrap analysis and the trend of goodness-of-fit (GOF) plots determined whether this expression of residual variance can be at last retained in the final model or require some modifications.
Covariate Model
Previous studies have identified that WT and (or) age were the most important variables that must be taken into consideration when establishing PPK models for young infants (11). Thus, these two covariates were evaluated at first in a series of maturation models. Maturation refers to the process of becoming mature in individual traits, like personality and behavior, and is generally considered a continuous function that achieves an asymptote at the adult value at some growth point (12). Similarly, the maturation model that can reach the smallest OFV was recognized as the intermediate model and developed further. The general maturation model expresses as follows: where COVmedian means the median of the covariate, MF means the maturation factor:
Maturation model I: MF was fixed to 1. Exponents m and n were unfixed.
Maturation model II: MF was fixed to 1. Exponent m was fixed to 0.75 empirically, and n was removed from the expression of V (12).
Maturation model III: Exponent m was fixed to 0.75 empirically. MF was calculated as the following equation, where TM50 is the age at which CL maturation reaches 50% of that of adults and Hill is a slope parameter (13).
Maturation model IV and V: θ0 was defined as an exponent at an ideal WT of 0 in maturation model IV or at an Age of 0 years in maturation model V. kmax is the maximum decrease of the exponent; k50 is the WT (maturation model IV) or Age (maturation model V) at which a 50% decrease in the maximum decrease is attained; and the Hill coefficient is used to determine the steepness of the sigmoid decline (13, 14).
Once a proper maturation model was selected, the intermediate PPK model was further developed by stepwise forward addition and backward exclusion method. In these two consecutive procedures, sex, age, HT, ALT, AST, BUN, SCR, CYSC, ALB, TP, eGFR, and concomitant medications were screened. The covariate screening criteria were as follows: (1) in the stepwise forward addition process, if OFV decreased >3.84 (χ2, df = 1, p < 0.05) after the inclusion of a candidate covariate, then this covariate can be retained in the model. (2) In the backward exclusion process, if the increase in OFV was <10.83 (χ2, df = 1, p < 0.001) after the exclusion of an in-model covariate, then the covariate was excluded from the final model.
Model Evaluation
GOF plots, which consist of observation (DV) vs. individual prediction (IPRED), DV vs. population prediction (PRED), conditional weighted residual errors (CWRES) vs. time, and CWRES vs. PRED, were utilized to visually check the performance of the final models (15). Visual predictive check (VPC) was also employed to check the predictive ability of each model. Then, bootstrap analysis was employed to check the stability of the final parameter estimates with the repetition of 1,000 NONMEM runs of the final models (16). Success rate of 1,000 NONMEN runs, 2.5–97.5% range of the bootstrap results, and bias between bootstrap results and NONMEN estimates was calculated to quantitatively evaluate the accuracy of parameter estimates. Finally, an external validation was carried out for all the final models to test and compare the predictive ability of each model. Model 1 and Model 3 were compared among a group of external infants with normal renal functions (eGFR between 30 and 86 ml/min/1.73 m2), while Model 2 and Model 3 were compared among a group of external infants with ARCs (eGFR ≥ 86 ml/min/1.73 m2). The mean prediction error (MPE), mean relative prediction error (MPE%), mean absolute prediction error (MAE), mean relative absolute prediction error (MAE%), and root mean squared prediction error (RMSE) suggested the predictive precision of the final models (17). These indicators were calculated by the following equations (18):
where n represents the number of observations, CIPRED represents individual predictive concentration, and COBS represents observed concentration. Statistical analysis was performed by SPSS 22.0 statistical software (IBM, Armonk, NY, USA). Wilcoxon signed-rank test were used to compare the external validation results.
Results
Patients
A total of 115 patients in total were enrolled in the modeling group, among whom 61 patients were enrolled in the normal renal function group and 64 patients were enrolled in the ARC group. The numbers of the two groups add up over 115 because some patients experienced renal function fluctuation during long treatment period and were counted twice in both groups. In total, 276 vancomycin concentrations were assayed, including 158 trough concentrations and 118 peak concentrations. More detailed demographic, laboratory, and clinical data for each group are summarized in Table 2.
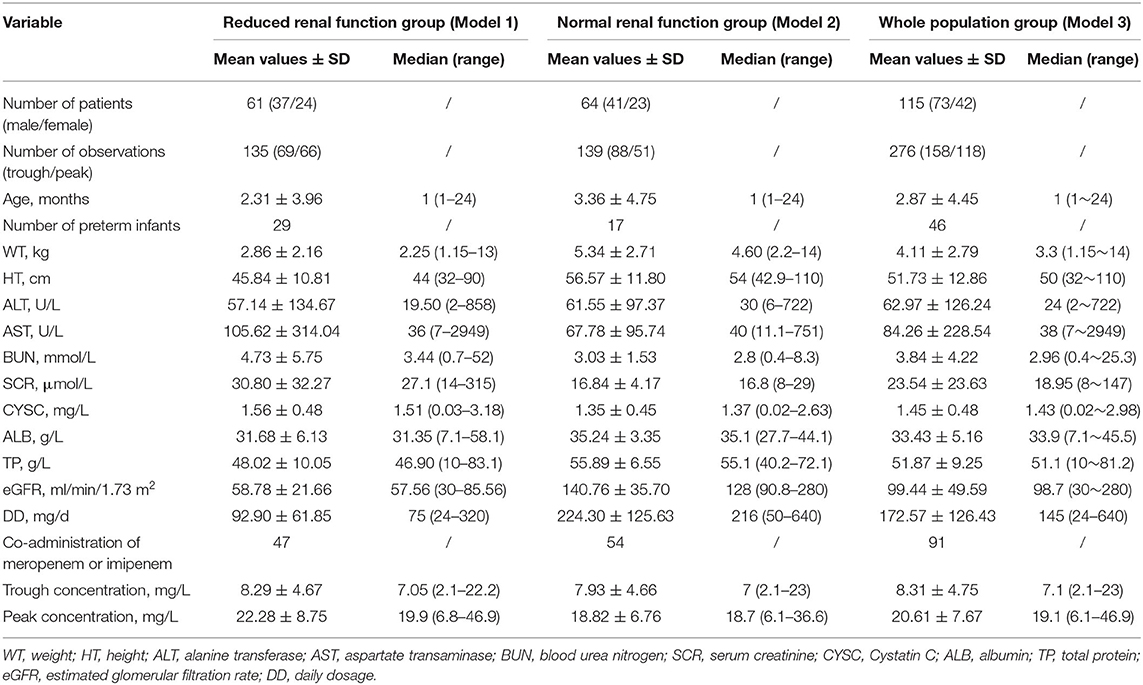
Table 2. Demographic, laboratory and clinical data of the modeling groups.
There were 55 patients in total enrolled in the external validation group, and among them, 21 belonged to the reduced renal function group, and the rest 34 belonged to the normal renal function group. More detailed demographic, laboratory, and clinical data for each group are summarized in Table 3.
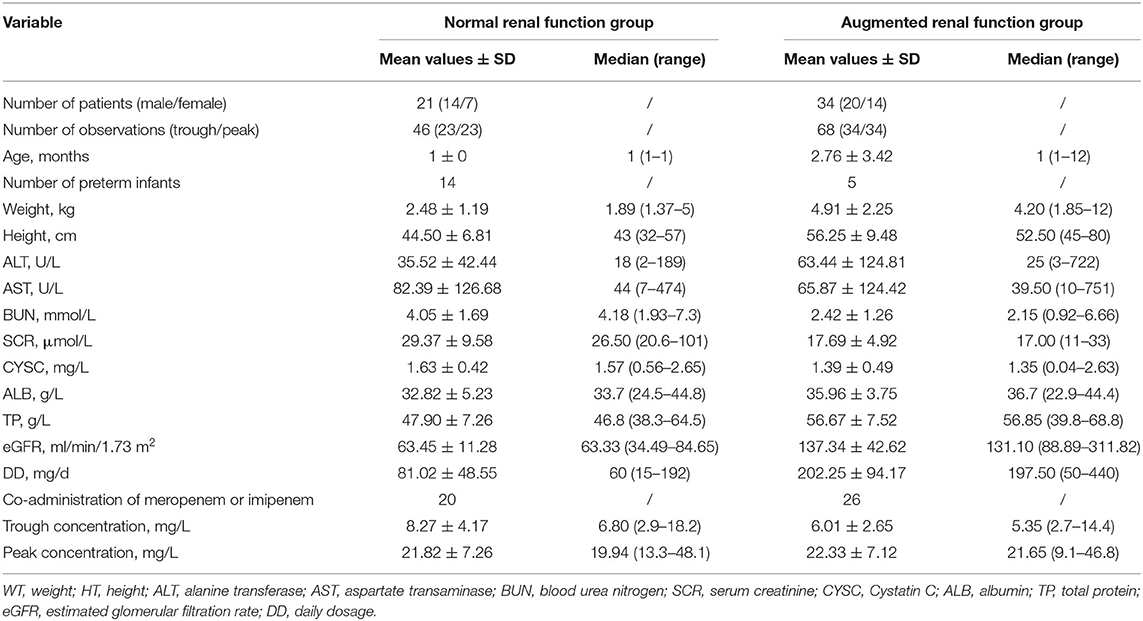
Table 3. Demographic, laboratory, and clinical data of the external validation groups.
Model Building
According to covariate screening criteria, for Model 1 and Model 3, SCR and WT were identified as significant covariates. However, for Model 2, only WT was kept in the final model. The establishment of intermediate maturation model and the covariate screening process of Model 1 were exhibited in Table 4 as an example. The parameter estimates are listed in Tables 5–7. The three final models are as follows:
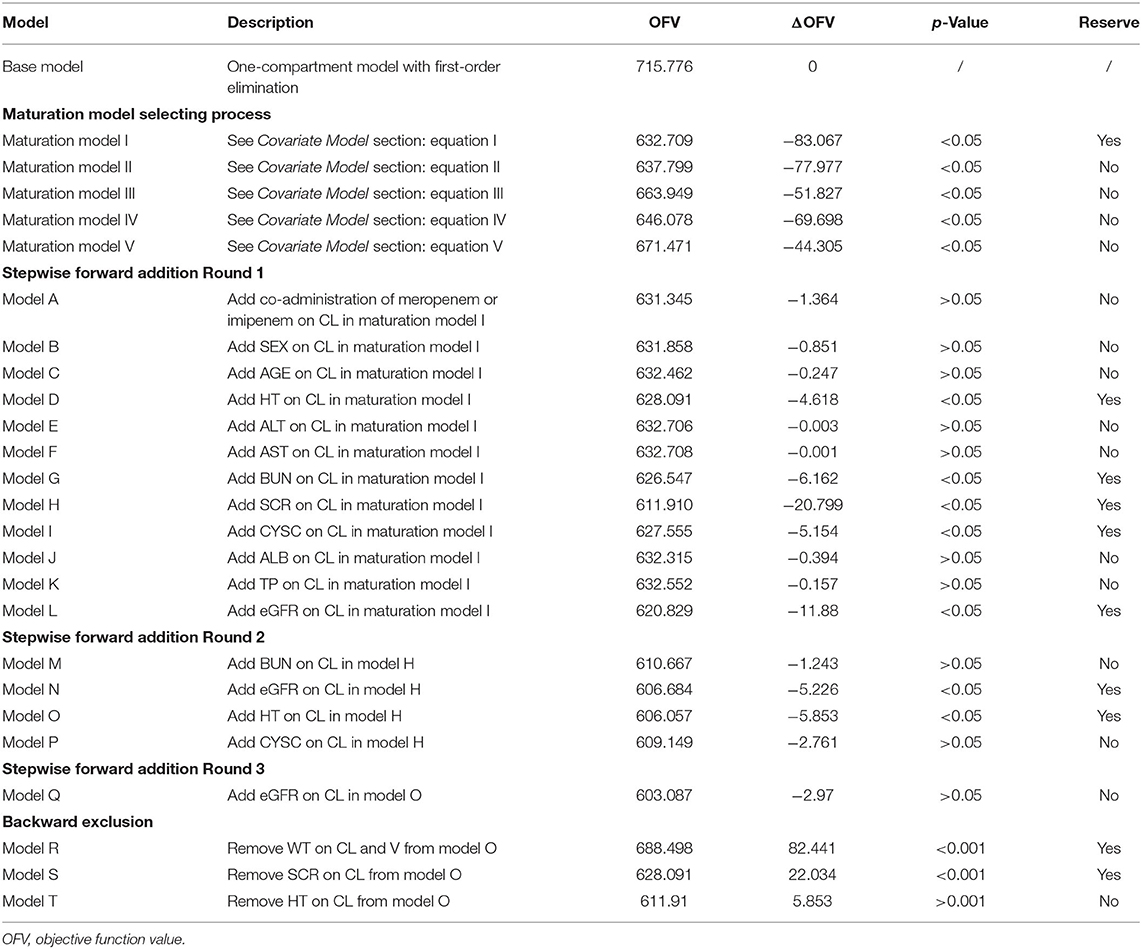
Table 4. The covariate model building process of Model 1.
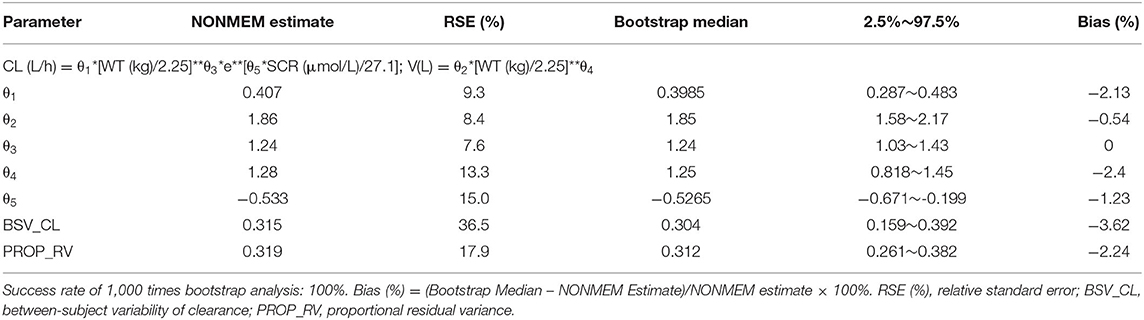
Table 5. NONMEN estimates and bootstrap analysis of Model 1.
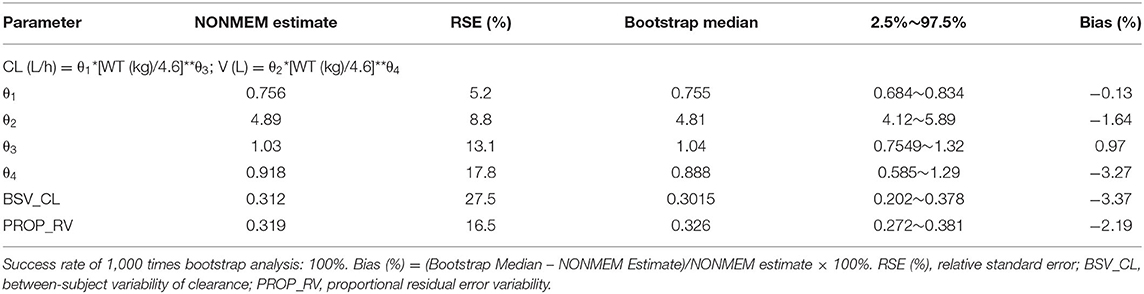
Table 6. NONMEN estimates and bootstrap analysis of Model 2.
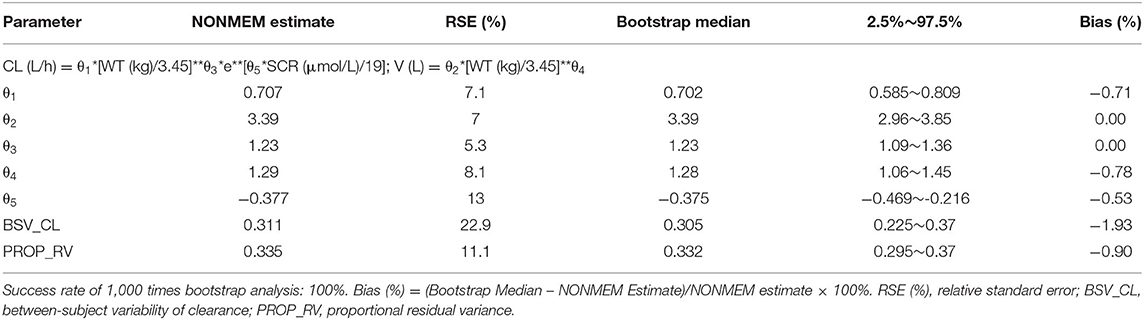
Table 7. NONMEN estimates and bootstrap analysis of Model 3.
Model 1: The PPK model of vancomycin for Chinese infants with normal renal function.
Model 2: The PPK model of vancomycin for Chinese infants with ARC.
Model 3: The PPK model of vancomycin for the whole population with all levels of renal function.
Model Evaluation and Comparison
Firstly, all three final models were inspected using GOF plots. Figures 1–3 suggest that the three final models showed no obvious bias or significant trends that are deviated from y = x or y = 0. The CWRES were randomly distributed around zero line, and most of the residuals range from −2 to 2. All these plots indicated the robustness of the final models. Figures 4–6, VPC results of the three models, suggest that the fifth and 95th (90%) percentile PIs covered most of the observations, indicating a good predictive performance of the final models. Then, bootstrap analysis was conducted for each model, and the results (Tables 5–7) suggest that the parameter estimates were close to the bootstrap results with all biases <5%. In addition, the success rate of 1,000 times bootstrap analysis was 100%, suggesting that all three models were stable. The results of shrinkage of empirical Bayes estimates (EBEs) of Model 1, Model 2, and Model 3 are listed in Table 8, which are all below 20%. Finally, the results of external validation are listed in Table 9. The external validation results indicated that the predictive performance of Model 1 and Model 2 are comparable with Model 3 with no statistical differences (p > 0.05), but not improved.
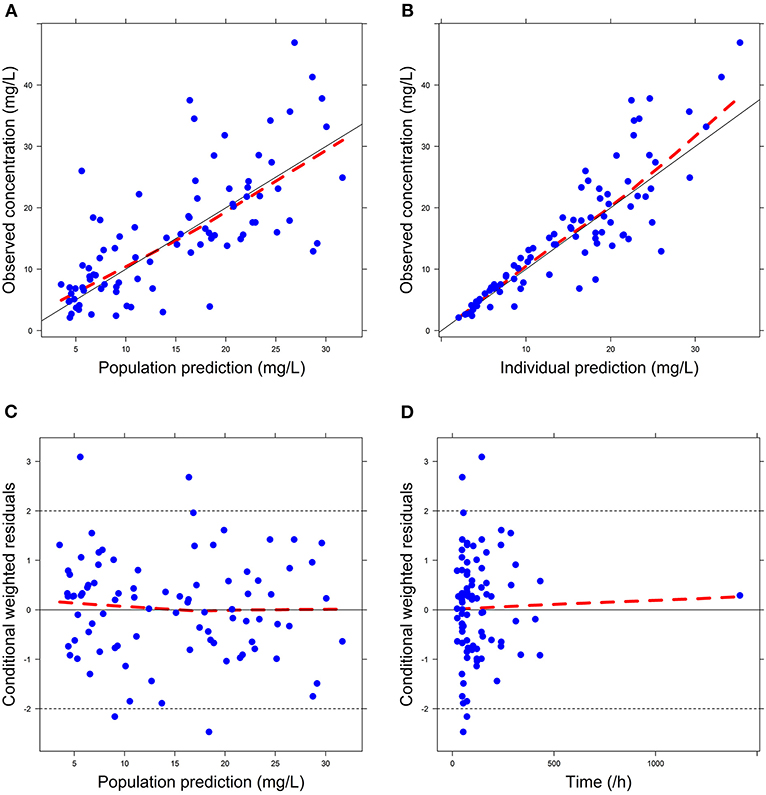
Figure 1. Goodness-of-fit (GOF) plots of Model 1: (A) observed concentration (DV) vs. population prediction (PRED); (B) DV vs. individual prediction (IPRED); (C) conditional weighted residual errors (CWRES) vs. PRED; (D) CWRES vs. Time.
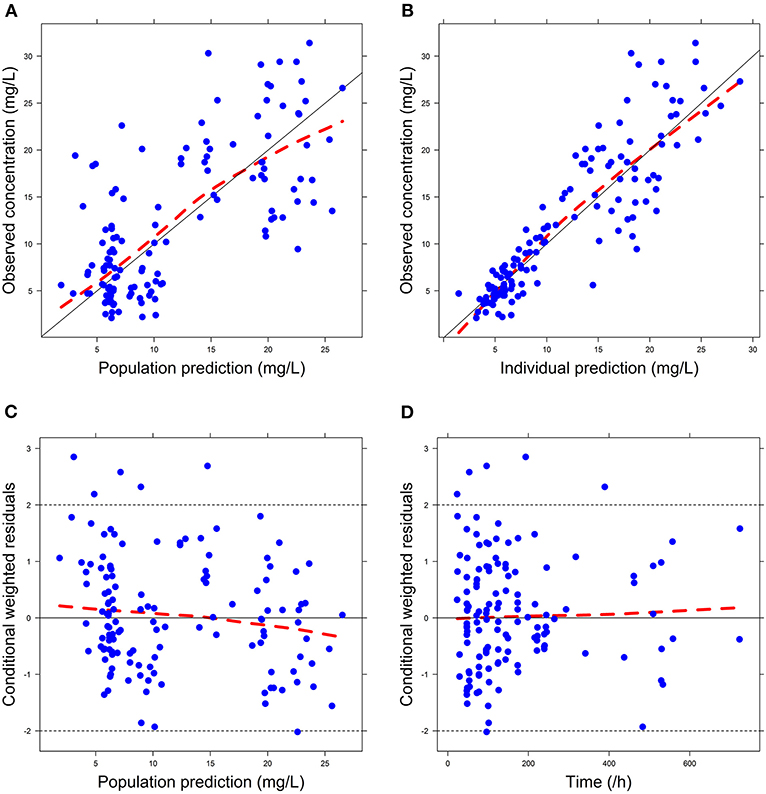
Figure 2. Goodness-of-fit (GOF) plots of Model 2: (A) observed concentration (DV) vs. population prediction (PRED); (B) DV vs. individual prediction (IPRED); (C) conditional weighted residual errors (CWRES) vs. PRED; (D) CWRES vs. Time.
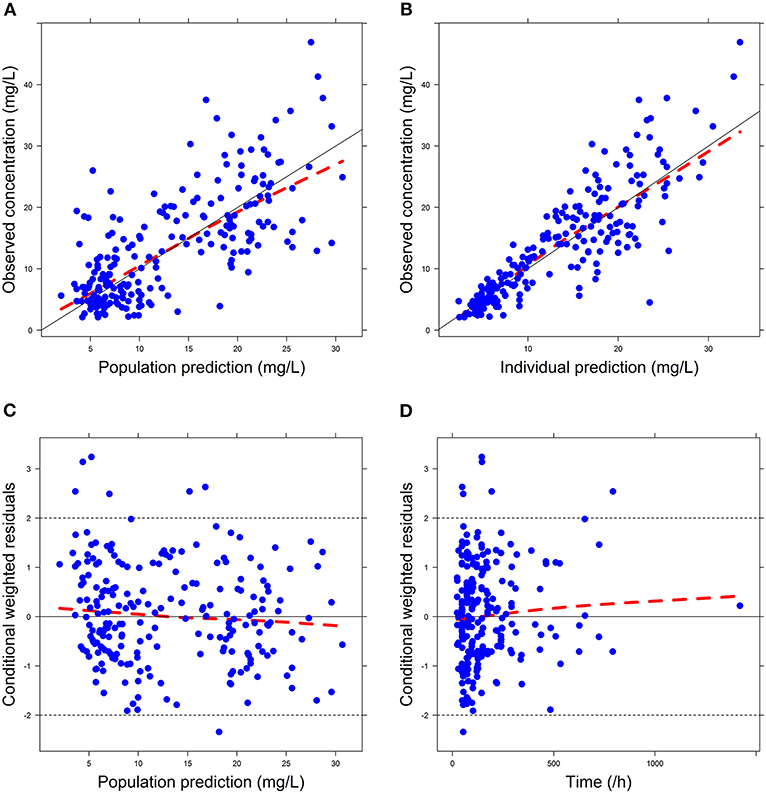
Figure 3. Goodness-of-fit (GOF) plots of Model 3: (A) observed concentration (DV) vs. population prediction (PRED); (B) DV vs. individual prediction (IPRED); (C) conditional weighted residual errors (CWRES) vs. PRED; (D) CWRES vs. Time.
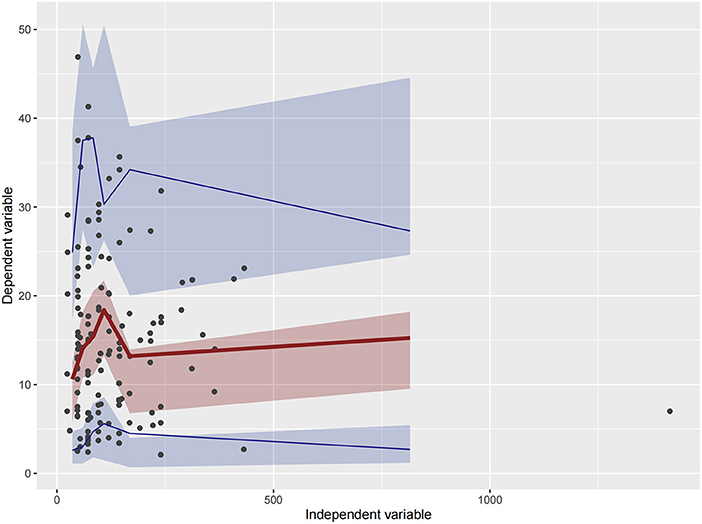
Figure 4. Visual predictive check (VPC) of Model 1. Circles represent observations. The red solid lines represent the median of simulated concentrations, and the blue solid lines represent the 90% PI (5 and 95%) of the predictive vancomycin concentrations. The shaded areas represent the 95% CI for each line.
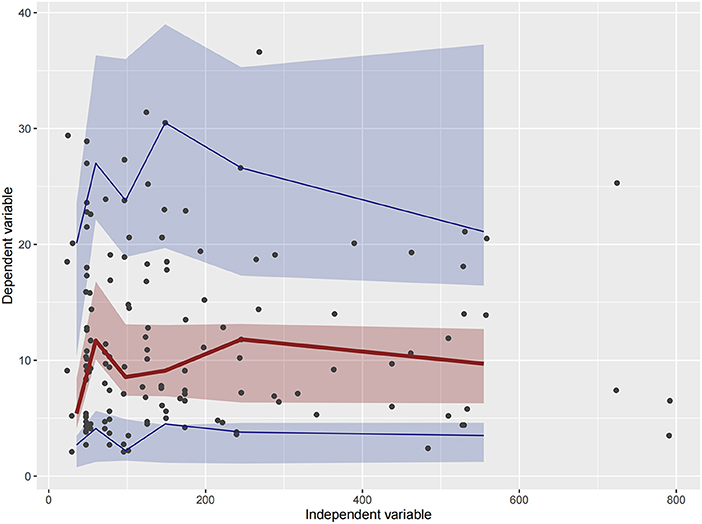
Figure 5. Visual predictive check (VPC) of Model 2. Circles represent observations. The red solid lines represent the median of simulated concentrations, and the blue solid lines represent the 90% PI (5 and 95%) of the predictive vancomycin concentrations. The shaded areas represent the 95% CI for each line.
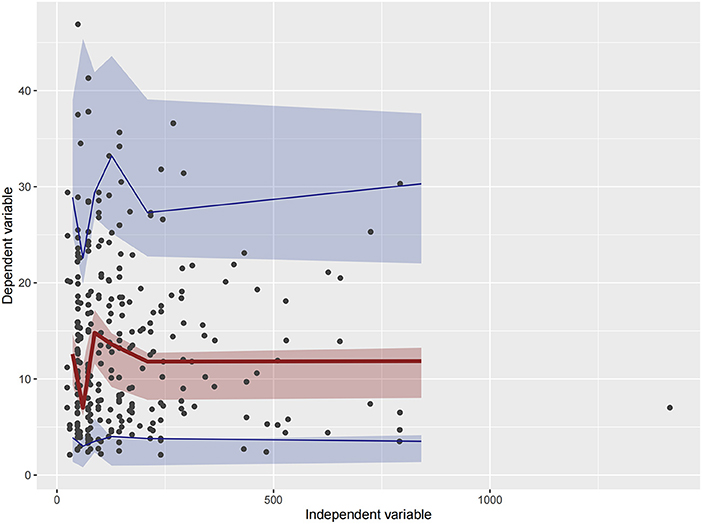
Figure 6. Visual predictive check (VPC) of Model 3. Circles represent observations. The red solid lines represent the median of simulated concentrations, and the blue solid lines represent the 90% PI (5 and 95%) of the predictive vancomycin concentrations. The shaded areas represent the 95% CI for each line.
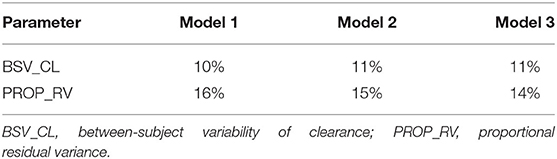
Table 8. Shrinkage of empirical Bayes estimates (EBEs) of Model 1, Model 2, and Model 3.
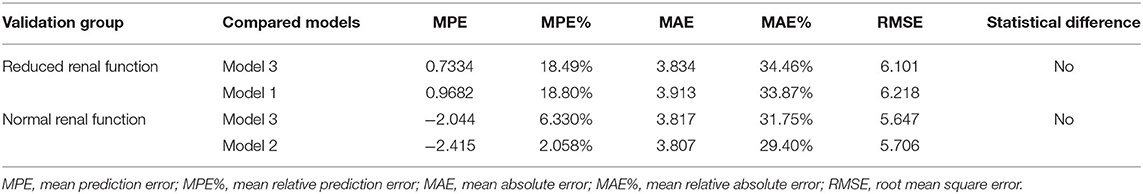
Table 9. The MPE, MPE%, MAE%, and RMSE values of the external validation.
Discussion
A good number of PPK models of vancomycin for Chinese pediatric patients have been established. However, to the best of our knowledge, the PPK model of vancomycin for Chinese infants based on different levels of renal function has not been proposed before. Zaric et al. established a PPK model of vancomycin for adult patients with different renal function levels in 2018 (19), but this method has not been investigated among Chinese infants yet. So this study was the first one to conduct such an attempt. Furthermore, after literature research, we found out that almost all PPK models of vancomycin for pediatric patients included body weight as an important covariate, but some typical physiological indicators that reflect renal function levels, such as SCR, CLCR, and eGFR, were not included in the final models. We speculated that this was because in certain group of people, out of some physiological reasons, these renal function indicators cannot synchronously reflect the change of blood vancomycin concentration, which eventually leads to the exclusion of these renal function indicators from the final models. Plus, we believe renal function level was the key factor that can define population group, whose data will later shape the PK characteristics of each final model. All of these findings and speculations led us to carry out such a study.
This study separately established the PPK models of vancomycin for Chinese infants with normal renal function and with ARC for the first time and compared the predictive ability of these two models with the whole population group model. In the model covariate optimization procedure, sex, age, WT, HT, ALT, AST, BUN, SCR, CYSC, ALB, TP, and eGFR were investigated. Among the pediatric population with normal renal function, WT and SCR are the main determinants for the vancomycin CL, which was in accordance with the model based on the whole population data. However, among the ARC group, only WT was included as a covariate, which agreed with the findings of Lv et al. in 2020, who demonstrated that body weight with allometric scaling was the only significant determinant on CL and V in the group of Chinese hematologic malignancy children with eGFR ≥130 ml/min/1.73 m2 (7), and Yamamoto et al. in 2009 observed that the clearance of vancomycin was linearly correlated to CLCR in patients with renal insufficiency (CLCR < 85 ml/min/1.73 m2), but there was no linear relationship when CLCR was ≥85 ml/min/1.73 m2 (20).
The diagnostic GOF plots, VPC, and bootstrap analysis indicated that all three models were stable. The external validation indicated not only the good predictive performance of the three models but also that the predictive performance of Model 1 and Model 2 is comparable with Model 3 with no statistical differences (p > 0.05). Additionally, Li et al. proposed a PPK model of vancomycin for Chinese ICU neonates, whose postnatal age ranged from 4 to 126 days, in 2018 (21). This was the latest model for this population prior to our study, and our model expanded the postnatal age range to 2 years.
The model for the normal renal function group included SCR as a covariate, but the model for the ARC group did not. Since vancomycin is hydrophilic with a large molecular volume and many non-ionic groups (22), the tissue distribution speed of vancomycin is expected to be limited by the lipid membrane. Moreover, Du et al., by using an established physiologically based pharmacokinetics (PBPK) model, found out that the concentration of vancomycin in renal tubules was about 40–50 times higher than that in plasma. Also, the PK characteristics of vancomycin in kidney were quite different from that in plasma and renal tubules, which showed a delay in time to peak and a much slower drug elimination speed. In the PBPK model of kidney-injury patients, they found out that concentrations of vancomycin in both the kidney tubule and the kidney decreased slightly. When the renal function of the patients changed from moderate to severe injury, both the amount of vancomycin and its concentration in kidney tubules and kidney decreased further (23).
Thus, one of the possible explanations for the difference between Models 1 and 2 is that among the pediatric population with normal renal function, due to less permeability of lipid membrane compared with the ARC population, it is a longer process for both SCR and vancomycin to be transported from plasma to kidney. So SCR level can be seen as an indicator for vancomycin clearance and should be included in the PPK model development. However, among the population with ARC, due to the augmented permeability of lipid membrane, vancomycin can be transported into kidney at a much higher speed. The vancomycin mainly exists in kidney with 90% remaining unchanged. Plus, the clearance rate of vancomycin in kidney is much slower than that in plasma and renal tubules. All these factors lead to the loss of synchronicity between the blood vancomycin concentration and SCR level. Thus, SCR as a covariate was finally excluded from the final model in Model 2.
The results of our study suggest that for infant population whose GFR ≥ 86 ml/min/1.73 m2, only body weight data are sufficient for constructing vancomycin predictive models. Thus, taking blood sample is not compulsory for predicting vancomycin blood concentrations, which avoids unnecessary injury to vulnerable infants.
There are some limitations to this study. The first question should be addressed is why Model 1 and Model 2 did not show predictive improvement over Model 3 as we expected. Before model building process, we expected that models built on population sharing similar physiological condition can perform better when predicting the same population. However, the results seem to not support our hypothesis. We believe that this does not mean that our hypothesis should be denied. Our subgroups were extracted from a larger group; thus, the larger group contains all the information that the subgroups have. Thus, they possess same predictive ability at last. We will delve into this question in our future study by separately recruiting comparable amount of patients for Model 1, Model 2, and Model 3, rather than extract Models 1 and 2 population data from Model 3. The second limitation is that the normal renal function classification for infants is quite sophisticated. We choose the range of 30–86 ml/min/1.73 m2 to carry out our research because most of our patients are in the age range of 37–95 days. Our simplification to 30–86 ml/min/1.73 m2 may lead to model inaccuracy for certain infant age groups. The third limitation is that we used a one-compartment model rather than a two-compartment model, which was reported several times in previous studies and may better fit for the PK characteristics of vancomycin, to simplify the model building process. The simplification to one-compartment model may lead to deviation of clearance estimation. However, observations from the models show that the bias is acceptable. The fourth limitation is that the influence of infectious disease type on vancomycin pharmacokinetics was not evaluated. In previous studies, disease type was included as a significant covariate (20), but in this research, disease type was not studied. This may lead to some missing important variables that should be included in the final model.
To sum up, this study proposed a set of vancomycin PPK models based on renal function levels by using data from infants who were prescribed with vancomycin. Among infants with normal renal function level, WT and SCR were identified as significant covariates, while among infants with ARC level, WT was the sole significant covariate. Based on the results, for an infant whose eGFR ≥86 ml/min/1.73 m2, taking blood sample is not compulsory for predicting vancomycin blood concentration, which avoids unnecessary injury to vulnerable infants.
Data Availability Statement
The raw data supporting the conclusions of this article will be made available by the authors, without undue reservation.
Ethics Statement
The studies involving human participants were reviewed and approved by Ethics Committee of the Children's Hospital of Nanjing Medical University. Written informed consent from the participants' legal guardian/next of kin was not required to participate in this study in accordance with the national legislation and the institutional requirements. Written informed consent was not obtained from the minor(s)' legal guardian/next of kin for the publication of any potentially identifiable images or data included in this article.
Author Contributions
D-YL, FC, and XinJ: conceptualization. D-YL, LL, and FC: methodology and investigation. D-YL and LL: software, validation, and formal analysis. G-ZL, Y-HH, H-LG, and XiaJ: resources and data curation. G-ZL, Y-HH, H-LG, XiaJ, and H-RD: data curation. D-YL: preparation of the original draft. D-YL, FC, and JX: reviewing and editing the manuscript. FC and XinJ: supervision and funding acquisition. JX: project administration. All authors have read and agreed to the published version of the manuscript.
Funding
This research was funded by the Specially Appointed Medical Expert Project of the Jiangsu Commission of Health (2019) and the Medical Science and Technique Foundation of Nanjing Health Commission (YKK20132). This study was also funded by Jiangsu Research Hospital Association for Precision Medication (JY202021).
Conflict of Interest
The authors declare that the research was conducted in the absence of any commercial or financial relationships that could be construed as a potential conflict of interest.
Publisher's Note
All claims expressed in this article are solely those of the authors and do not necessarily represent those of their affiliated organizations, or those of the publisher, the editors and the reviewers. Any product that may be evaluated in this article, or claim that may be made by its manufacturer, is not guaranteed or endorsed by the publisher.
Acknowledgments
Thanks for the technical support provided by Dr. Huaijun Zhu from the Department of Pharmacy, Nanjing Drum Tower Hospital (the Affiliated Hospital of Nanjing University Medical School), China.
References
1. Chen Y, Wu D, Dong M, Zhu Y, Lu J, Li X, et al. Population pharmacokinetics of vancomycin and AUC-guided dosing in Chinese neonates and young infants. Eur J Clin Pharmacol. (2018) 74:1–10. doi: 10.1007/s00228-018-2454-0
2. Liu C, Bayer A, Cosgrove S, Daum R, Fridkin S, Gorwitz R, et al. Clinical practice guidelines by the infectious diseases society of america for the treatment of methicillin-resistant staphylococcus aureus infections in adults and children. Clin Infect Dis. (2011) 52:e18–55. doi: 10.1093/cid/ciq146
3. Li L, Li X, Xia Y, Chu Y, Zhong H, Li J, et al. Recommendation of antimicrobial dosing optimization during continuous renal replacement therapy. Front Pharmacol. (2020) 11:786. doi: 10.3389/fphar.2020.00786
4. Udy AA, Roberts JR. Augmented renal clearance: implications for antibacterial dosing in the critically ill. Clin Pharmacokinet. (2010) 49:1. doi: 10.2165/11318140-000000000-00000
5. Heggen T, Dhont E, Peperstraete H, Delanghe JR, Cock P. Augmented renal clearance: a common condition in critically ill children. Pediatr Nephrol. (2019) 34:1099–106. doi: 10.1007/s00467-019-04205-x
6. Udy AA, Jarrett P, Stuart J, Lassig-Smith M, Starr T, Dunlop R, et al. Determining the mechanisms underlying augmented renal drug clearance in the critically ill: use of exogenous marker compounds. Crit Care. (2014) 18:657. doi: 10.1186/s13054-014-0657-z
7. Lv CL, Lu JJ, Chen M, Zhang R, Li QC, Chen YY, Liu TT. Vancomycin population pharmacokinetics and dosing recommendations in haematologic malignancy with augmented renal clearance children. J Clin Pharm Ther. (2020) 45:1278–87. doi: 10.1111/jcpt.13206
8. Heilbron DC, Holliday MA, Al-Dahwi A, Kogan BA. Expressing glomerular filtration rate in children. Pediatr Nephrol. (1991) 5:5–11. doi: 10.1007/BF00852829
9. Angell M. The Declaration of Helsinki, vol. 62. New York, NY: The New York Review of Books (2015). p. 30–2
10. Jonsson EN, Karlsson M. OXpose—an S-PLUS based population pharmacokinetic/pharmacodynamic model building aid for NONMEM. Comput Methods Programs Biomed. (1999) 58:51–64. doi: 10.1016/S0169-2607(98)00067-4
11. Jacqz-Aigrain E, Leroux S, Zhao W, van den Anker J, Sharland M. How to use vancomycin optimally in neonates: remaining questions. Expert Rev Clin Pharmacol. (2015) 8:1–14, doi: 10.1586/17512433.2015.1060124
12. Meibohm B. Applied pharmacometrics—AAPS advances in the pharmaceutical sciences series. CPT Pharmacometrics Syst Pharmacol. (2015) 4:373. doi: 10.1002/psp4.58
13. Holford N, Heo Y-A, Anderson B. A pharmacokinetic standard for babies and adults. J Pharm Sci. (2013) 102:2941–52. doi: 10.1002/jps.23574
14. Ding J, Wang Y, Lin W, Wang C, Zhao L, Li X, et al. A population pharmacokinetic model of valproic acid in pediatric patients with epilepsy: a non-linear pharmacokinetic model based on protein-binding saturation. Clin Pharmacokinet. (2014) 54:305–17. doi: 10.1007/s40262-014-0212-8
15. Hooker A, Staatz C, Karlsson M. Conditional weighted residuals (CWRES): a model diagnostic for the FOCE method. Pharm Res. (2008) 24:2187–97. doi: 10.1007/s11095-007-9361-x
16. Ette E. Stability and performance of a population pharmacokinetic model. J Clin Pharmacol. (1997) 37:486–95. doi: 10.1002/j.1552-4604.1997.tb04326.x
17. Lin Z, Chen D-y, Zhu Y-W, Jiang Z-l, Cui K, Zhang S, et al. Population pharmacokinetic modeling and clinical application of vancomycin in Chinese patients hospitalized in intensive care units. Sci Rep. (2021) 11:2670. doi: 10.1038/s41598-021-82312-2
18. Han K, Peyret T, Marchand M, Quartino A, Gosselin N, Girish S, et al. Population pharmacokinetics of bevacizumab in cancer patients with external validation. Cancer Chemother Pharmacol. (2016) 78:341–51. doi: 10.1007/s00280-016-3079-6
19. Zaric RZ, Milovanovic J, Rosić N, Milovanovic D, Zecević D, Folic M, et al. Pharmacokinetics of vancomycin in patients with different renal function levels. Open Med. (2018) 13:512–9. doi: 10.1515/med-2018-0068
20. Yamamoto M, Kuzuya T, Baba H, Yamada K, Nabeshima T. Population pharmacokinetic analysis of vancomycin in patients with gram-positive infections and the influence of infectious disease type. J Clin Pharm Ther. (2009) 34:473–83. doi: 10.1111/j.1365-2710.2008.01016.x
21. Li Z-l, Liu Y-x, Jiao Z, Qiu G, Huang J-q, Xiao Y-b, et al. Population pharmacokinetics of vancomycin in Chinese ICU neonates: initial dosage recommendations. Front Pharmacol. (2018) 9:603. doi: 10.3389/fphar.2018.00603
22. Dinu V, Lu Y, Weston N, Lithgo R, Coupe H, Channell G, et al. The antibiotic vancomycin induces complexation and aggregation of gastrointestinal and submaxillary mucins. Sci Rep. (2020) 10:960. doi: 10.1038/s41598-020-57776-3
23. Du H, Li Z, Yang Y, Li X, Wei Y, Lin Y, et al. New insights into the vancomycin-induced nephrotoxicity using in vitro metabolomics combined with physiologically based pharmacokinetic modeling. J Appl Toxicol. (2020) 40:897–907. doi: 10.1002/jat.3951
24. Zhao W, Zhang D, Fakhoury M, Fahd M, Duquesne F, Storme T, et al. Population pharmacokinetics and dosing optimization of vancomycin in children with malignant hematological disease. Antimicrob Agents Chemother. (2014) 58:3191–9. doi: 10.1128/AAC.02564-13
25. Moffett B, Resendiz K, Morris J, Arikan A, Checchia P. Population pharmacokinetics of vancomycin in the pediatric cardiac surgical population. J Pediatr Pharmacol Ther. (2019) 24:107–16. doi: 10.5863/1551-6776-24.2.107
26. Moffett B, Humlicek T, Arikan A, Anders M, Tume S. Population pharmacokinetics of vancomycin in the pediatric ventricular assist device population. Pediatr Crit Care Med. (2020) 1:566–71. doi: 10.1097/PCC.0000000000002349
27. Lee SM, Yang S, Kang S, Chang MJ. Population pharmacokinetics and dose optimization of vancomycin in neonates. Sci Rep. (2021) 11:6168. doi: 10.1038/s41598-021-85529-3
28. Marqués-Miñana M-R, Saadeddin A, Peris J-E. Population pharmacokinetic analysis of vancomycin in neonates. a new proposal of initial dosage guideline. Br J Clin Pharmacol. (2010) 70:713–20. doi: 10.1111/j.1365-2125.2010.03736.x
29. Guilhaumou R, Marsot A, Dupouey J, Galambrun C, Boulamery A, Coze C, et al. Pediatric patients with solid or hematological tumor disease: vancomycin population pharmacokinetics and dosage optimization. Ther Drug Monit. (2016) 38:559–66. doi: 10.1097/FTD.0000000000000318
30. Stockmann C, Sherwin C, Zobell J, Lubsch L, Young D, Olson J, et al. Population pharmacokinetics of intermittent vancomycin in children with cystic fibrosis. Pharmacotherapy. (2013) 33:1288–96. doi: 10.1002/phar.1320
31. Song L, He C-Y, Yin N-G, Liu F, Jia Y-T, Liu Y. A population pharmacokinetic model for individualised dosage regimens of vancomycin in Chinese neonates and young infants. Oncotarget. (2017) 8:105211–21. doi: 10.18632/oncotarget.22114
Keywords: vancomycin, pediatrics, population pharmacokinetics, renal function, external validation
Citation: Li D-Y, Li L, Li G-Z, Hu Y-H, Guo H-L, Jing X, Chen F, Ji X, Xu J and Dai H-R (2021) Population Pharmacokinetics Modeling of Vancomycin Among Chinese Infants With Normal and Augmented Renal Function. Front. Pediatr. 9:713588. doi: 10.3389/fped.2021.713588
Received: 23 May 2021; Accepted: 06 August 2021;
Published: 20 September 2021.
Edited by:
Hans Van Rostenberghe, Universiti Sains Malaysia (USM), MalaysiaReviewed by:
Jasmina Milovanovic, University of Kragujevac, SerbiaZhe Tang, Nanjing Medical University, China
Copyright © 2021 Li, Li, Li, Hu, Guo, Jing, Chen, Ji, Xu and Dai. This is an open-access article distributed under the terms of the Creative Commons Attribution License (CC BY). The use, distribution or reproduction in other forums is permitted, provided the original author(s) and the copyright owner(s) are credited and that the original publication in this journal is cited, in accordance with accepted academic practice. No use, distribution or reproduction is permitted which does not comply with these terms.
*Correspondence: Feng Chen, Y3kuY2hlbjUwOEBnbWFpbC5jb20=; Xing Ji, aml4aW5nQG5qbXUuZWR1LmNu
†Visiting graduate student from China Pharmaceutical University