- 1Department of Neonatology, Máxima Medical Center, Veldhoven, Netherlands
- 2Department of Psychology, Máxima Medical Center, Veldhoven, Netherlands
- 3Department of Child and Adolescent Studies, Utrecht University, Utrecht, Netherlands
- 4Department of Applied Physics, School of Medical Physics and Engineering, Eindhoven University of Technology, Eindhoven, Netherlands
Aim: Long-term outcome data in preterm children is often limited to cross-sectional measurement of neurodevelopmental impairment (NDI) at the corrected age of 24-36 months. However, impairments may only become overt during childhood or resolve with time, and individual trajectories in outcome over time may vary. The primary aim of this study was to describe NDI in very preterm born children at three subsequent ages of 2, 5, and 8 years of age. As a secondary aim, a longitudinal analysis was performed on the individual longitudinal trajectories in NDI from 2 to 8 years of age.
Methods: Single-center prospective cohort study including children born between 1990 and 2011 below 30 weeks' gestation and followed into 2019. The outcome measurement was NDI assessed at 2, 5, and 8 years of age. NDI is a composite score that includes cognitive, neurological, visual, and auditory functions, in which problems were categorized as none, mild, moderate, or severe. Cognitive function measured as total DQ/IQ score was assessed by standardized psychometric tests. Neurological, visual, and auditory functions were assessed by the neonatologist.
Results: In total, 921 children were eligible for follow-up, of whom 726 (79%) children were assessed. No NDI was seen in 54, 54, and 62%, mild NDI was seen in 31, 36, and 30%, and moderate-to-severe NDI was seen in 15, 9.2, and 8.6% of the children at 2, 5, and 8 years, respectively. From 2 to 8 years, 63% of the children remained in the same NDI category, 20% of the children improved to a better NDI category, and 17% deteriorated toward a worse NDI category. No differences were found in baseline characteristics of infants that improved or deteriorated. Extreme prematurity, male gender and low parental education were associated with worse NDI status at all time points. Although we observed considerable individual variation over time in NDI status, the course of the trajectories in NDI were not associated with gestation, gender, and parental education.
Conclusions: Continued follow-up until school life is essential in order to provide optimal and individually focused referrals and care when needed.
Introduction
The number of preterm deliveries below 30 weeks' gestation has increased over the last decades, with increasing survival rates of preterm children (1, 2). However, improved survival rates still raise the concern of adverse long-term outcome in the increasing number of surviving preterm children. Preterm born children are known to have a higher risk of physical disabilities as well as cognitive problems later in life (3–5). Knowledge on neurodevelopmental outcomes of children born at these early gestational ages (GA) is crucial for clinicians and families as this may influence antenatal counseling, resuscitation polices, and NICU guidelines (6–8).
As the impact of developmental impairment may be different at different stages of development, there is increasing interest in studying development as a dynamic process (9, 10). Currently available outcome data are often limited to cross-sectional measurements in toddlerhood, but longitudinal follow-up of children is important. Early suboptimal functioning may form an important signal for later problems or an indication for early intervention, and impairments may persist over childhood into adolescence and adulthood (11–16). Moreover, there may be considerable variation in individual trajectories that is not detectable in cross-sectional studies (17).
Studies evaluating developmental trajectories in preterm children often have focused on specific components of development, like cognitive, behavioral, or social problems (5, 10, 13, 18–20). However, a composite outcome score combining different domains provides a general insight in the amount and kind of disabilities of preterm born children. As developmental problems can arise over a broad spectrum of outcome measures, evaluation of developmental trajectories using a composite outcome might provide additional information. A frequently used indication of adverse long-term outcome is the composite measure of neurodevelopmental impairment (NDI), a score that takes cognitive, neurological, visual, and auditory function into account (8, 21–24). This outcome measure focuses on severe impairments and provides important prognostic information for clinicians and parents (21).
Since three decades, preterm children born below 30 weeks' gestation are eligible for an extensive follow-up program in our perinatal center. This includes outpatient clinic visits to the neonatologist and psychologist at the corrected age of 2 years and the uncorrected age of 5 and 8 years, making an NDI assessment possible at three subsequent ages. The data collected over a period of more than 20 years provides unique information on the development of very preterm children. Therefore, the primary aim of this study was to describe NDI in very preterm born children who were evaluated at three subsequent ages of 2, 5, and 8 years of age. As a secondary aim, a longitudinal analysis was performed on the individual longitudinal trajectories in NDI from 2 to 8 years of age.
Materials and Methods
Patient Population
This cohort study included all children born between 1990 and 2011 and followed into 2019, with a gestational age below 30 weeks, who were admitted within 24 h after birth to the neonatal intensive care unit (NICU) of Máxima Medical Centre (MMC). The NICU of MMC serves a 1.6 million population including antenatal and postnatal transfer from six other hospitals in the region. Children from parents living outside the adherence area of MMC and referrals from other NICUs were excluded. The ethical review board of MMC approved the study in accordance with the Dutch law on medical research with humans (WMO).
Data Collection
Data from the outpatient clinic visits were collected prospectively. Neonatal data were retrieved from the individual medical records. Individual characteristics and medical data included gender (male or female); birth weight in grams; gestational age in days (based on ultrasound findings or on the first day of last menstrual period if ultrasound data was not available); small for gestational age [defined as birth weight below the 10th percentile (25)]; multiplicity (dichotomized as single or multiple birth); mode of delivery (dichotomized as vaginal or by caesarean section); complete course of antenatal corticosteroids (defined as two doses of betamethasone given 24 h apart before the start of labor); Apgar score at 5 min postpartum; inborn or outborn NICU; rate of artificial ventilation > 12 h; days of endotracheal intubation on any mode of ventilation; surgical treatment of a persistent ductus arteriosus; intraventricular hemorrhage grade 3 or 4 based on ultrasound (26); cystic periventricular leukomalacia grade 3 (27); severe brain injury (defined as intraventricular hemorrhage grade 3 or 4 or cystic periventricular leukomalacia grade 3); laparotomy for necrotizing enterocolitis or single intestinal perforation; surgical treatment or laser therapy for retinopathy of prematurity; and total days of NICU admission. Socio-economic status was assessed using scores defined by the Netherlands Institute for Social and Cultural Research (The Hague, Netherlands) based on postal code at birth, with an average score of 0 and a positive score reflecting a higher than average status and a negative score reflecting a lower than average status (28). For children not seen for follow-up, reasons for no show were identified.
Follow-Up
All preterm children below 30 weeks' gestation were eligible for our follow-up program. This consisted of outpatient clinic visits to the neonatologist and psychologist at the corrected age of 2 years and the uncorrected age of 5 and 8 years. The neonatologist assessed the child's health and evaluated the neurological, visual, and auditory functions. Neurological outcome was scored as normal, mildly abnormal, or unilateral/bilateral CP, according to the GMFCS classification (29). The psychologist evaluated the child's cognitive function, emotional, and behavioral development. At the corrected age of 2 years cognitive development was assessed using the Mental Developmental Index of the Bayley Scales of Infant Development-II (BOS2-30 for children born in 1990-2001 or BSID-II, for children born in 2001-2007) or the Cognitive Composite score of the Bayley-III (for children born in 2007-2011). At the age of 5 years cognitive function was tested using the Total IQ score of the Revised Amsterdam Child Intelligence Test short form (RAKIT, for children born in 1990-2008), the Total IQ score of the Revised Amsterdam Child Intelligence Test-2, short form (RAKIT-2, for children born in 2008-2009) or the Total IQ score of the Dutch version of the Wechsler Preschool and Primary Scale of Intelligence Scale-III (WPPSI-III-NL, for children born after 2009). A strong correlation of 0.76 has been reported between the RAKIT and the WPPSI for total IQ scores (30). At the age of 8 years cognitive function was tested using the Total IQ score of the Revised Amsterdam Child Intelligence Test, short form (RAKIT, for children born in 1990-2005), the Total IQ score of the Revised Amsterdam Child Intelligence Test-2, short form (RAKIT-2, for children born in 2005-2006) or the Total IQ score of the Dutch version of the Wechsler Intelligence Scale for Children-III (WISC-III-NL, for children born after 2006). IQ-scores of the RAKIT and WISC have shown a strong correlation of 0.82 (30). In addition, the psychologist collected information on educational status of the parents, which was classified as low, middle, or high according to the CBS classification (31). This variable was dichotomized describing whether there was a low education or middle-to-high education. If one of the parents was classified as middle-to-high educated, parental education was classified as middle-to-high.
Neurodevelopmental Outcome
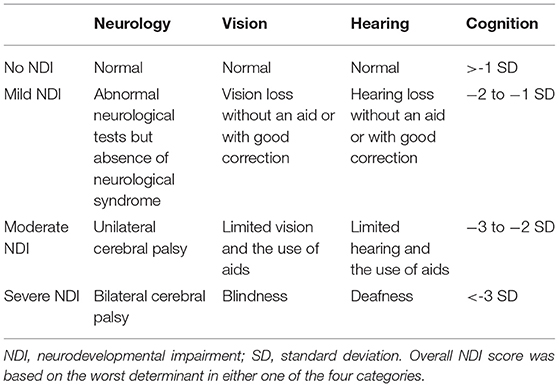
The outcome measure was neurodevelopmental impairment (NDI), a composite score based on cognition, neurological assessment, and presence of visual and/or hearing impairment (Table 1). NDI was categorized as none, mild, moderate, or severe. NDI was classified as mild if cognitive scores showed a developmental quotient (DQ) or intelligence quotient (IQ) between 70 and 84 (−2 to −1 SD); vision or hearing loss without an aid or with good correction, or abnormal neurological tests in the absence of a neurological syndrome (e.g., posture, coordination, and tone dysregulation disorders). NDI was scored as moderate if cognitive DQ/IQ scores were between 55 and 69 (−3 to −2 SD); limited vision or hearing and the use of aids or the presence of a unilateral cerebral palsy. NDI was scored as severe if cognitive DQ/IQ scores were below 55 (>-3 SD), or blindness, deafness, or bilateral cerebral palsy were present. NDI score was based on the worst determinant in either one of the four categories. If one category was missing, NDI was classified as missing. NDI was determined for examinations at 2, 5, and 8 years of age.
Statistical Analyses
Children with and without follow-up were compared using the Student's T-test or Mann-Whitney U-test for continuous variables, depending on distribution of the data, and using the Chi-square test for categorical and dichotomous variable. Parental education was missing for 25% of the children and imputed using the R multivariate imputation by chained equation (MICE) package. A continuation ratio model was used to investigate trajectories in NDI, using an interaction term between age and group to test whether NDI trajectories were different for different groups. These group terms included a dichotomized variable for gestational age [extremely preterm (EP) < 28 weeks vs. very preterm (VP) 280-296 weeks' gestation], gender (boys vs. girls), and parental education (low education vs. middle-to-high education). First, the effect of being EP was evaluated by adding this group factor to the model. Then, the effect of gender and parental education were examined by adding them separately to the model. A p-value < 0.05 was considered significant. Analyses were performed using R version 3.5.1.
Results
Study Population and Loss-to-follow-Up
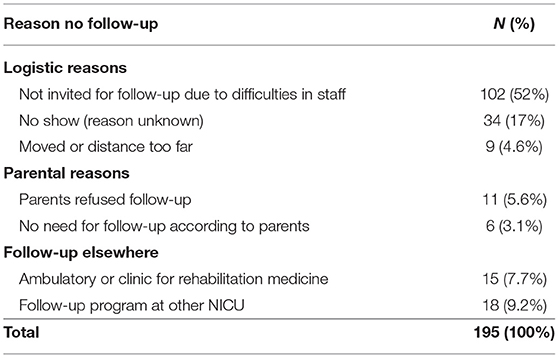
Within the study period (1990-2011), 1,107 children born below < 30 weeks' GA were admitted to the NICU. Of these children 186 (17%) died, leaving 921 children eligible for follow-up at the outpatient clinic (Figure 1). Of these children, 726 (79%) were seen for follow-up. In total, 693 (75%), 658 (71%), and 579 (63%) children had follow-up at 2, 5, and 8 years, respectively. Reasons for the total group of 195 loss-to-follow-up children are shown in Table 2. During a limited period of time, difficulties in availability of staff resulted in a group of 102 relatively low risk children who were not invited for follow-up.
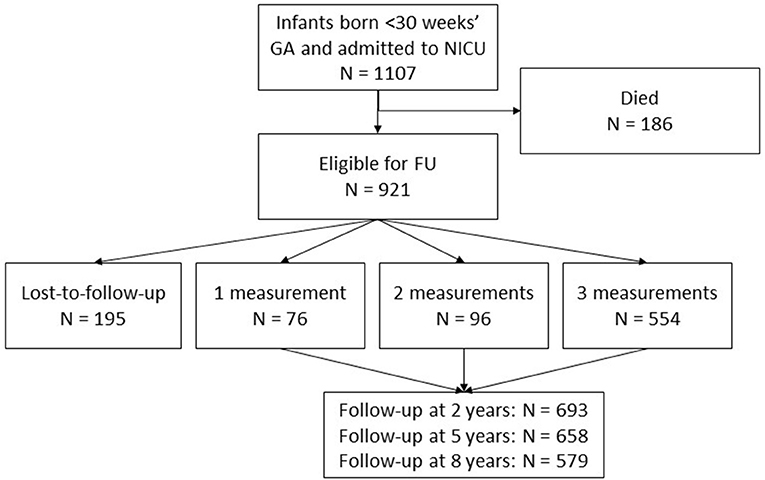
Figure 1. Flowchart of the included children. 921 children were eligible for follow-up at the outpatient clinic. In total, the results are based on 726 participants with data on 1930 follow-up moments, as presented in the gray square.
Baseline Characteristics
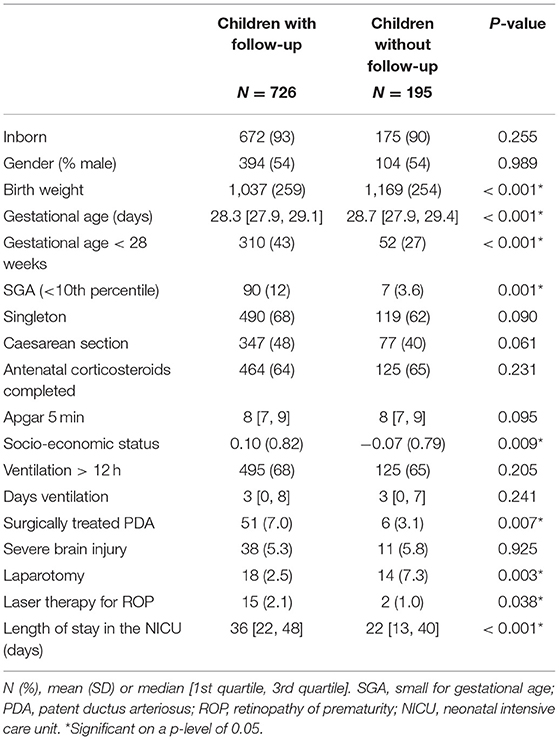
Table 3 shows the baseline characteristics, separately for children with and without follow-up. Children with follow-up were more immature at birth, compared to children without follow-up. Socio-economic status was higher in children seen for follow-up. Their NICU admission was significantly more often complicated by PDA and ROP, but less often complicated by a laparotomy. The length of NICU stay in children with follow-up was longer, compared to children without follow-up.
NDI Classification
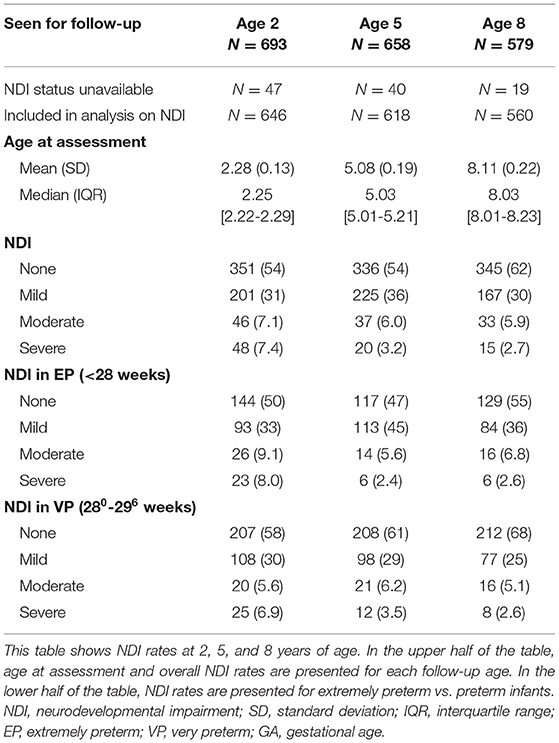
NDI could be calculated for 646, 618, and 560 children at 2, 5, and 8 years, respectively (Table 4). No NDI was seen in 54, 54, and 62%, and moderate-to-severe NDI was seen in 15, 9.2, and 8.6% of the children at 2, 5, and 8 years, respectively. Of the 201 infants with mild disabilities at 2 years of age, 25 (12.4%) had a mild disability in two domains. None of the infants had disabilities in more than two domains. Of the 225 infants with mild disabilities at 5 years of age, 49 (21.8%) had a mild disability in two domains, 7 (3.1%) had a mild disability in three domains, and 1 (0.4%) had a mild disability in all domains. Of the 167 infants with mild disabilities at 8 years of age, 29 (17.4%) had a mild disability in two domains, 1 (0.6%) had mild disability in three domains, and 1 (0.6%) had a mild disability in all domains.
When they got older, more children were seen in a clinic for rehabilitation medicine and dropped-out on follow-up. Including these children in the category moderate-to-severe NDI, the percentage at 8 years increased up to 16%. In further analysis, the original data was used categorizing this subgroup as missing. Separate presentation of NDI rates for EP and VP infants showed decreased “no NDI” and increased “mild NDI” rates in EP infants compared to VP infants, but similar moderate-to-severe NDI rates (Table 4). In Appendix 1, classifications for the separate components of NDI are presented for each follow-up age.
NDI From 2 to 8 Years of Age
In the 554 children with three follow-up contacts, NDI could be calculated at all time points for 495 children. No NDI during the complete trajectory at 2, 5, and 8 years of age was seen for 179 (36%) children and both no-or-mild NDI during the complete trajectory was seen for 427 (81%) children. Moderate-to-severe NDI during the complete trajectory was seen for 21 (4.2%) children. In these 495 children, from 2 to 8 years 314 (63%) children remained in the same NDI category, 101 (20%) children improved toward a better NDI category, and 80 (17%) children deteriorated toward a worse NDI category (Figure 2). Of all 293 children with normal NDI at 2 years, 223 (76%) remained in the normal NDI category at 8 years of age. For mild impaired infants 43% (66/152) and for moderate-to-severe impaired infants 50% (25/50) remained in the same NDI category. No differences were found in the characteristics of infants that remained in the same category, improved or deteriorated from 2 to 8 years (Table 5).
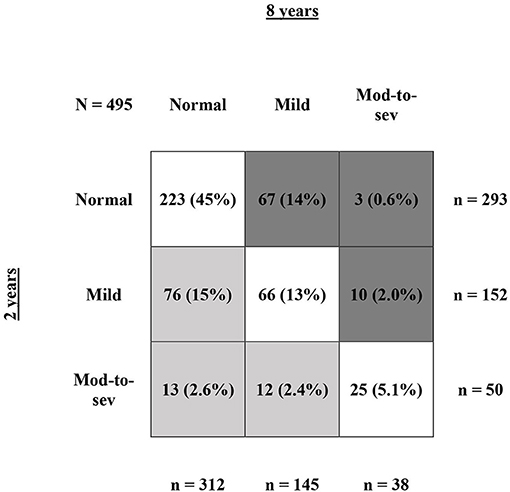
Figure 2. Shifts in NDI from 2 to 8 years of age. This figure shows NDI rate at 2 vs. 8 years of age for infants with NDI calculation at all three follow-up contacts (N = 495). The numbers are presented as N (%), with the % calculated relatively to the full group of N = 495 infants. The row sums show the total number of infants at 2 years of age for normal, mild, and moderate-to-severe NDI. The column sums show the total number of infants at 8 years of age for normal, mild, and moderate-to-severe NDI. The dark gray boxes represent all infants that deteriorated toward a worse NDI category from 2 to 8 years, the light gray boxed represent all infants that improved toward a better NDI category from 2 to 8 years, and the white boxes represent all infants that remained in the same NDI category.
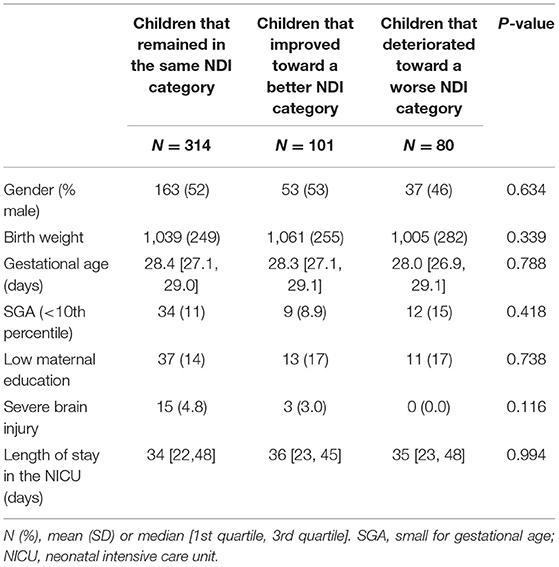
Table 5. Baseline characteristics of children that remained in the same NDI category, improved toward a better NDI category and deteriorated toward a worse NDI category.
Individual Longitudinal Trajectories in NDI
In clinical work individuals are more important than (sub)groups. Therefore Figure 3 presents the horizontal line plot for NDI at 2, 5, and 8 years of age, showing individual patterns of increasing and decreasing trajectories for all infants including patterns in missing data. Using the continuation ratio model, we found that at all time points very preterm born children had on average a 1.95 (95% CI 1.28-2.96) times higher odds on being in a better NDI category compared to extremely preterm born children. Female children had a 2.00 (95%CI 1.32-3.05) times higher odds compared to male children on being in a better NDI category, and children from parents with middle-to-high education had a 3.37 (95%CI 2.01-5.64) times higher odds compared to children from parents with low education on being in a better NDI category. Studying the trajectories in relation to these characteristics, it was found that EP and VP children showed similar trajectories, as did male and female children and children from parents with low vs. middle-high education.
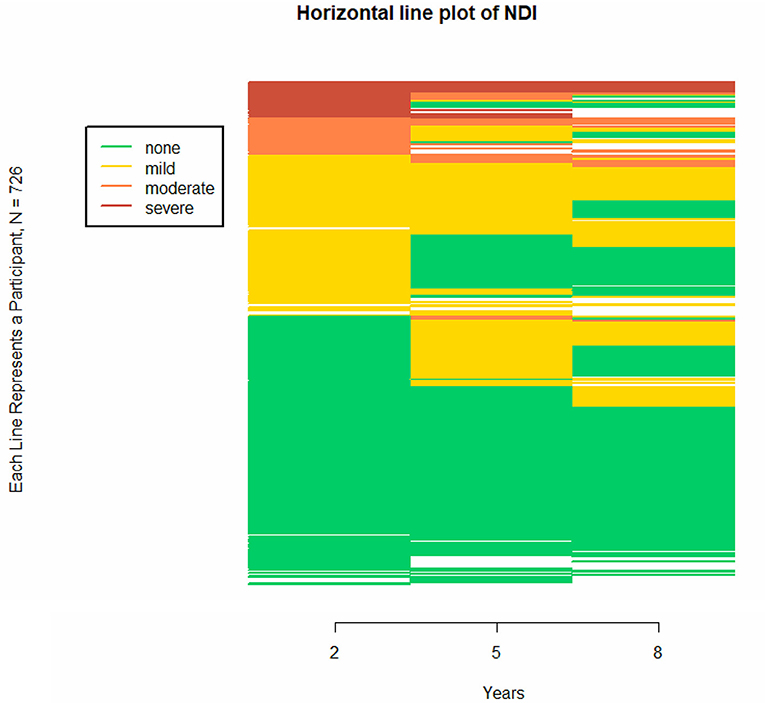
Figure 3. Individual trajectories of neurodevelopmental impairment (NDI) at different ages, presented in a horizontal line plot for all children with follow-up. The horizontal line plot uses colors to differentiate between states on a categorical longitudinal variable for multiple participants. Because categorical data defines a specific state, a trajectory for a categorical variable becomes a sequence of states rather than a continuum. The figure consists of 726 stacked horizontal line, with each horizontal line representing a participant. In this figure, NDI category is presented at 2, 5, and 8 years of age. This figure shows overall patterns of increasing and decreasing trajectories, including patterns in missing data. The blank spaces indicate missing data for that follow-up age.
Discussion
In this study, neurodevelopmental impairment at 2, 5, and 8 years was evaluated in very and extremely preterm children born below 30 weeks gestation. In addition the course of the individual longitudinal trajectories over time was studied. We observed individual variation over time in NDI status in 37% of the children, with 17% showing a change to a more worrisome category, but 20% showing an improvement. However, 63% of the children remained in the same category over time. Longitudinal analysis showed a clear association of gestation, gender, and parental education with the severity of NDI at all time points. No differences were found in the characteristics between children that improved and deteriorated, and the course of the trajectories in NDI was not affected by gestation, gender, and parental education.
Compared to other studies we observed higher rates for children without or with mild NDI. At the age of 5 and 8 years, respectively, 54 and 62% of the surviving children showed a normal neurodevelopment, and 36 and 30% of the surviving children showed a mild neurodevelopmental impairment. In EP children, normal development rates were 47 and 55%, and mild NDI rates were 45 and 36% at 5 and 8 years, respectively. The Swedish EXPRESS study found rates of 36 and 30% for children without and with mild NDI at 6.5 years in children born below 27 weeks' GA (32). The EPICure study from the UK showed a rate of 75% for children with none-to-mild NDI at 6 years and a rate of 53% for children with none-to-mild NDI in 53% at 11 years, in children born below 26 weeks' GA (3, 33). Unfortunately, international comparisons are hampered by differences in age of follow-up, definition of neurodevelopmental impairment and study population (21). For example, the EPICURE and EXPRESS studies included substantially more immature children, born at 22-24 weeks' gestation, whereas in our sample the youngest children were born at 25 weeks' gestation.
Mild neurodevelopmental problems were seen in 31, 36, and 30% of the infants at 2, 5, and 8 years of age. However, mild deficits in multiple domains might be of the same severity as one moderate-to-severe deficit in a single domain. At 2, 5, and 8 years of age, 12.4, 25.3, and 18.6% of the infants with mild NDI had mild problems in more than one domain. Apparently, at a later age more multiple mild deficits become overt. Multiple deficits across domains may have combined long-term effects, which unfortunately is not reflected by the NDI definition. The significance of milder forms of neurocognitive deficits might need additional research (34).
The moderate-to-severe disability rate in the current study initially appeared to be 8.8% at 8 years of age. However, it was found that 13% of the children lost for follow-up at 8 years of age did not attend follow-up because they were already in treatment in rehabilitation medicine. Including these children as having moderate-to-severe disability resulted in a disability rate of 16%, which is slightly higher than the severe disability rate of 13% reported in both the EPICure and EXPRESS studies (3, 32). On the other hand, children in our study were also lost-to-follow-up because they did not experience any problems. The real moderate-to-severe disability rate probably is somewhere between 8.8 and 16%. This emphasizes the importance of presenting impairment rates in the context of reasons for loss-to-follow-up.
Despite the abundancy of cross-sectional follow-up studies a paucity exists in longitudinal follow-up. This study showed that approximately two third of the children assessed at 2 years of age were classified in the same NDI category at 8 years of age, and that 16% of all children became worse at 8 years of age. Similar results have been reported before in the EXPRESS study, reporting that 47% of all children remained in the similar NDI category and 32% of all children deteriorated toward a worse NDI category from 2 to 6.5 years of age (32). Although overall NDI rates remained comparable over time, these results demonstrate considerable individual variation over time. Indeed this also shows the importance of continuing follow-up until school life for individual and specific referrals and advise.
EP/VP status, gender, and parental education were found to be associated with severity of NDI at all time points. These results were in line with previously published studies, reporting gender-differences in neurodevelopmental outcomes in the favor of girls (35–38). Moreover, these results enhance the formerly reported association between gestational age and neurodevelopmental outcome as well as the association between parental education and neurodevelopmental outcome (11, 36, 38–40).
Although EP/VP status, gender and parental education were found to be associated with NDI, these associations remained stable over time and the course of the trajectories was not affected by these factors. Children with these characteristics therefore seem to have the same developmental growth potential as children without these characteristics (18). Moreover, no differences were found in characteristics between infants that improved or deteriorated from 2 to 8 years. Nevertheless, considerable individual differences were seen in trajectories. This indicates the importance of other factors that might influence development over time, for example early childhood interventions such as an extensive physiotherapy program or special education assistance. Moreover, socio-environmental factors such as the quality of the parent-child relationship are important throughout development (16).
Although extensive evaluation of separate domains is important, the added value of a composite outcome is that it provides an overall impression of the outcomes after very preterm birth. Problems after preterm birth occur in a range of developmental domains and therefore it is important not to focus on single domains of development. Looking separately at the specific domains in this study, the majority of the children did not have any impairment. However, combining the different domains into the NDI composite outcome showed no NDI during the complete trajectory for a minority of 36% of all children. Apparently, the majority of the very preterm children do experience some clear problems at some time during childhood. Moreover, the combined outcome measure used in this study is the longer term outcome most frequently used for comparisons both within and between countries (21). International comparisons can guide clinical decision-making and provide prognostic information for families.
In this study, cognitive scores were corrected for prematurity at age 2, but not at age 5 and 8. The current Dutch national guideline on follow-up and most international guidelines recommends the use of corrected scores for preterm children up to 2–3 years. However, in very preterm children at age 5, a significant difference between corrected and uncorrected IQ was found, with corrected scores of course being higher than uncorrected scores (41). For future research, consistent reporting of cognitive outcome based on corrected scores is recommended (42).
The overall follow-up rate in this study was 79%, which is comparable to follow-up rates of other studies, showing rates varying from 71 to 92% at different ages (3, 5, 32). Moreover, more than 60% of the children completed follow-up at all time points during the longitudinal follow-up program, which demonstrates a high follow-up rate compared to other longitudinal studies such as the recently published EPICure2 study (follow-up rate 19%) (33). Our results might represent the worst-case scenario as medium risk children have not always been invited for follow-up during the study period because of limited resources as shown in Table 2. These children without follow-up were children with an appropriate birth weight, without severe brain injury and with uncomplicated NICU admission. This explains why infants seen for follow-up were more immature at birth and had an increased length of stay in the NICU compared to infants without follow-up. On the other hand, a significant difference was found in socio-economic status between infants with and without follow-up, with a higher SES score in the children that did have follow-up. This finding is similar to findings in previous studies, showing that drop-out was more likely to occur in families with social disadvantages, while preterm children from socially disadvantaged families may have poorer neurodevelopment (3, 32, 43). However, considering the high follow-up rate in this study, limited influence on the presented results is expected.
Strengths and Limitations
Strengths of our paper included the size of the cohort and the high follow-up rate with most children assessed at three ages. Moreover, the longitudinal nature of this study provides important information reading the developmental course of the children. However, this study has several limitations. First, different tests measuring cognitive performance had to be used, both at different ages to be developmentally appropriate, but also over time in order to use the most recent population norms. Use of different tests intending to measure the same constructs at different ages is inevitable when performing long-term longitudinal studies as development continues at high pace and differentiates strongly during infancy and toddlerhood as well as preschool age (5, 19, 44). In addition, tests need to be re-evaluated and updated over time to allow ecologically valid assessments (e.g., think of the appearance and use of phones in the nineties and zero's, causing the need for revision of the images used in cognitive test). As all tests were standardized however, with a mean of 100, results could be compared. Second, defining NDI based on four determinants (cognitive, neurological, auditory, and visual function) has its limitations to delineate a child's development. Additional domains such as behavioral problems could not be taken into account but may also impair children over time. Third, ideally the GMFCS classification would have been used for classifying the severity of problems in the neurological domain. However, this system was not routinely used in 1990. In order to distinguish between moderate and severe neurological problems, uni- and bi-lateral paresis was used as a proxy for GMFCS 1-2 and GMFCS 3-5, respectively. Last, in this retrospective study, no specific information on interventions was available. Improvement during the trajectories could potentially be the result of adequate interventions after detection of NDI at early age, resulting in improved NDI at early age. Future research may elaborate on the effect of interventions on the individual trajectories.
In conclusion, this study evaluated neurodevelopmental impairment at three different ages up to the age of 8 in very preterm children, next to the course of the longitudinal trajectories in these outcomes. A clear association was found of gestation, gender, and parental education with the severity of NDI at all time points. Although we observed considerable individual variation over time in NDI status, the course of the trajectories in NDI were not associated with gestation, gender, and parental education. These results point to the importance of other (unknown) influences on developmental trajectories. Continued follow-up until school life for extremely preterm born children is essential in order to provide optimal individually focused referrals and care when needed.
Data Availability Statement
The datasets presented in this article are not readily available because of privacy regulations according to the General Data Protection Regulation (GDPR). Requests to access the datasets should be directed to Pauline E. van Beek, cGF1bGluZS52YW4uYmVla0BtbWMubmw=.
Ethics Statement
The studies involving human participants were reviewed and approved by Medical Ethics Committee Máxima MC. Written informed consent from the participants' legal guardian/next of kin was not required to participate in this study in accordance with the national legislation and the institutional requirements.
Author Contributions
PB, AB, BV, and PA contributed to the conception of the study. PB, IH, JW, and BV organized the database. PB performed the statistical analysis. PB and IH wrote the first draft of the manuscript. PA was responsible for the financial funding of the project and overall supervision. All authors contributed to the interpretation of the results, critically reviewed the manuscript, and approved the submitted version.
Funding
PB was supported by an unrestricted grant from Stichting Tiny & Anny van Doorne Fonds. The funding source had no role in the design, conduct, analyses, or reporting of the study or in the decision to submit the manuscript for publication.
Conflict of Interest
The authors declare that the research was conducted in the absence of any commercial or financial relationships that could be construed as a potential conflict of interest.
Acknowledgments
The authors thank all neonatologists, physiotherapists, and psychologists of Máxima Medical Center, in particular psychologist Titia Katgert, for their contribution in examining the children's neurodevelopment at (pre)school age. The authors thank Anne Verheijen, Guusje Thijssen, Anne van Och, René Blom, and Jasmijn van Erp for their help in creating the database for research use.
Supplementary Material
The Supplementary Material for this article can be found online at: https://www.frontiersin.org/articles/10.3389/fped.2021.672214/full#supplementary-material
Abbreviations
NICU, neonatal intensive care unit; GA, gestational age; NDI, neurodevelopmental impairment; BOS 2-30, Bayley Scales 2-30 months, Dutch edition; BSID-II, Bayley Scales of Infant and Toddler Development-II; BSID-III, Bayley Scales of Infant and Toddler Development-III; RAKIT, Revised Amsterdam Child Intelligence Test; RAKIT-2, Revised Amsterdam Child Intelligence Test-II; WPPSI-III-NL, Wechsler Preschool and Primary Scale of Intelligence Scale-III Dutch Edition; WISC-III-NL, Wechsler Intelligence Scale for Children-III Dutch edition.
References
1. Stoll BJ, Hansen NI, Bell EF, Walsh MC, Carlo WA, Shankaran S, et al. Trends in care practices, morbidity, and mortality of extremely preterm neonates, 1993-2012. JAMA. (2015) 314:1039–51. doi: 10.1001/jama.2015.10244
2. Patel RM, Kandefer S, Walsh MC, Bell EF, Carlo WA, Laptook AR, et al. Causes and timing of death in extremely premature infants from 2000 through 2011. N Engl J Med. (2015) 372:331–40. doi: 10.1056/NEJMoa1403489
3. Marlow N, Wolke D, Bracewell MA, Samara M, EPICure Study Group. Neurologic and developmental disability at six years of age after extremely preterm birth. N Engl J Med. (2005) 352:9–19. doi: 10.1056/NEJMoa041367
4. Anderson P, Doyle LW, Victorian Infant Collaborative Study Group. Neurobehavioral outcomes of school-age children born extremely low birth weight or very preterm in the 1990s. JAMA. (2003) 289:3264–72. doi: 10.1001/jama.289.24.3264
5. Linsell L, Johnson S, Wolke D, O'Reilly H, Morris JK, Kurinczuk JJ, et al. Cognitive trajectories from infancy to early adulthood following birth before 26 weeks of gestation: a prospective, population-based cohort study. Arch Dis Child. (2018) 103:363–70. doi: 10.1136/archdischild-2017-313414
6. Raju TN, Mercer BM, Burchfield DJ, Joseph GF. Periviable birth: executive summary of a Joint Workshop by the Eunice Kennedy Shriver National Institute of Child Health and Human Development, Society for Maternal-Fetal Medicine, American Academy of Pediatrics, and American College of Obstetricians and Gynecologists. J Perinatol. (2014) 34:333–42. doi: 10.1038/jp.2014.70
7. Younge N, Smith PB, Gustafson KE, Malcolm W, Ashley P, Cotten CM, et al. Improved survival and neurodevelopmental outcomes among extremely premature infants born near the limit of viability. Early Hum Dev. (2016) 95:5–8. doi: 10.1016/j.earlhumdev.2016.01.015
8. Ding S, Lemyre B, Daboval T, Barrowman N, Moore GP. A meta-analysis of neurodevelopmental outcomes at 4-10 years in children born at 22-25 weeks gestation. Acta Paediatr. (2019) 108:1237–44. doi: 10.1111/apa.14693
9. Karmiloff-Smith A. Development itself is the key to understanding developmental disorders. Trends Cogn Sci. (1998) 2:389–98. doi: 10.1016/S1364-6613(98)01230-3
10. Durrant C, Wong HS, Cole TJ, Hutchon B, Collier L, Wright A, et al. Developmental trajectories of infants born at less than 30 weeks' gestation on the Bayley-III Scales. Arch Dis Child Fetal Neonatal Ed. (2020) 105:623–7. doi: 10.1136/archdischild-2019-317810
11. Eryigit Madzwamuse S, Baumann N, Jaekel J, Bartmann P, Wolke D. Neuro-cognitive performance of very preterm or very low birth weight adults at 26 years. J Child Psychol Psychiatry. (2015) 56:857–64. doi: 10.1111/jcpp.12358
12. Lohaugen GC, Gramstad A, Evensen KA, Martinussen M, Lindqvist S, Indredavik M, et al. Cognitive profile in young adults born preterm at very low birthweight. Dev Med Child Neurol. (2010) 52:1133–8. doi: 10.1111/j.1469-8749.2010.03743.x
13. Breeman LD, Jaekel J, Baumann N, Bartmann P, Wolke D. Preterm cognitive function into adulthood. Pediatrics. (2015) 136:415–23. doi: 10.1542/peds.2015-0608
14. Hack M, Flannery DJ, Schluchter M, Cartar L, Borawski E, Klein N. Outcomes in young adulthood for very-low-birth-weight infants. N Engl J Med. (2002) 346:149–57. doi: 10.1056/NEJMoa010856
15. Weisglas-Kuperus N, Hille ET, Duivenvoorden HJ, Finken MJ, Wit JM, van Buuren S, et al. Intelligence of very preterm or very low birthweight infants in young adulthood. Arch Dis Child Fetal Neonatal Ed. (2009) 94:196. doi: 10.1136/adc.2007.135095
16. Eves R, Mendonca M, Bartmann P, Wolke D. Small for gestational age-cognitive performance from infancy to adulthood: an observational study. BJOG. (2020) 127:1598–606. doi: 10.1111/1471-0528.16341
17. Johnson S, Fawke J, Hennessy E, Rowell V, Thomas S, Wolke D, et al. Neurodevelopmental disability through 11 years of age in children born before 26 weeks of gestation. Pediatrics. (2009) 124:249. doi: 10.1542/peds.2008-3743
18. Twilhaar ES, de Kieviet JF, van Elburg RM, Oosterlaan J. Academic trajectories of very preterm born children at school age. Arch Dis Child Fetal Neonatal Ed. (2019) 104:F419–23. doi: 10.1136/archdischild-2018-315028
19. Stalnacke SR, Tessma M, Bohm B, Herlenius E. Cognitive development trajectories in preterm children with very low birth weight longitudinally followed until 11 years of age. Front Physiol. (2019) 10:307. doi: 10.3389/fphys.2019.00307
20. Witt S, Weitkamper A, Neumann H, Lucke T, Zmyj N. Delayed theory of mind development in children born preterm: a longitudinal study. Early Hum Dev. (2018) 127:85–9. doi: 10.1016/j.earlhumdev.2018.10.005
21. Torchin H, Morgan AS, Ancel PY. International comparisons of neurodevelopmental outcomes in infants born very preterm. Semin Fetal Neonatal Med. (2020) 25:101109. doi: 10.1016/j.siny.2020.101109
22. Gargus RA, Vohr BR, Tyson JE, High P, Higgins RD, Wrage LA, et al. Unimpaired outcomes for extremely low birth weight infants at 18 to 22 months. Pediatrics. (2009) 124:112–21. doi: 10.1542/peds.2008-2742
23. Draper ES, Zeitlin J, Manktelow BN, Piedvache A, Cuttini M, Edstedt Bonamy AK, et al. EPICE cohort: two-year neurodevelopmental outcomes after very preterm birth. Arch Dis Child Fetal Neonatal Ed. (2020) 105:350–6. doi: 10.1136/archdischild-2019-317418
24. Blencowe H, Lee AC, Cousens S, Bahalim A, Narwal R, Zhong N, et al. Preterm birth-associated neurodevelopmental impairment estimates at regional and global levels for 2010. Pediatr Res. (2013) 74(Suppl 1):17–34. doi: 10.1038/pr.2013.204
25. Hoftiezer L, Hof MHP, Dijs-Elsinga J, Hogeveen M, Hukkelhoven CWPM, van Lingen RA. From population reference to national standard: new and improved birthweight charts. Am J Obstet Gynecol. (2019) 220:383.e1–7. doi: 10.1016/j.ajog.2018.12.023
26. Papile LA, Burstein J, Burstein R, Koffler H, Koops B. Relationship of intravenous sodium bicarbonate infusions and cerebral intraventricular hemorrhage. J Pediatr. (1978) 93:834–6. doi: 10.1016/S0022-3476(78)81096-8
27. de Vries LS, Eken P, Dubowitz LM. The spectrum of leukomalacia using cranial ultrasound. Behav Brain Res. (1992) 49:1–6. doi: 10.1016/S0166-4328(05)80189-5
28. SCP Statusscores. (2017). Available online at: http://www.scp.nl/Formulieren/Statusscores_opvragen (accessed March, 2019).
29. Palisano R, Rosenbaum P, Walter S, Russell D, Wood E, Galuppi B. Development and reliability of a system to classify gross motor function in children with cerebral palsy. Dev Med Child Neurol. (1997) 39:214–23. doi: 10.1111/j.1469-8749.1997.tb07414.x
30. Pieters S, Dek JE, Kooij AP. RAKIT-2 Psychometrische eigenschappen Deel 2. Amsterdam: Pearson Assessment & Information BV (2013).
31. Statistics Netherlands. Education level. Available online at: https://www.cbs.nl/en-gb/news/2018/20/well-being-not-distributed-equally/education-level (accessed December 24, 2020).
32. Serenius F, Ewald U, Farooqi A, Fellman V, Hafstrom M, Hellgren K, et al. Neurodevelopmental outcomes among extremely preterm infants 6.5 years after active perinatal care in Sweden. JAMA Pediatr. (2016) 170:954–63. doi: 10.1001/jamapediatrics.2016.1210
33. Marlow N, Ni Y, Lancaster R, Suonpera E, Bernardi M, Fahy A, et al. No change in neurodevelopment at 11 years after extremely preterm birth. Arch Dis Child Fetal Neonatal Ed. (2021). doi: 10.1136/archdischild-2020-320650. [Epub ahead of print].
34. Adams-Chapman I, Heyne RJ, DeMauro SB, Duncan AF, Hintz SR, Pappas A, et al. Neurodevelopmental impairment among extremely preterm infants in the neonatal research network. Pediatrics. (2018) 141:e20173091. doi: 10.1542/peds.2017-3091
35. Goldstein RF, Cotten CM, Shankaran S, Gantz MG, Poole WK, Eunice Kennedy Shriver National Institute of Child Health and Human Development Neonatal Research Network. Influence of gestational age on death and neurodevelopmental outcome in premature infants with severe intracranial hemorrhage. J Perinatol. (2013) 33:25–32. doi: 10.1038/jp.2012.91
36. Synnes A, Luu TM, Moddemann D, Church P, Lee D, Vincer M, et al. Determinants of developmental outcomes in a very preterm Canadian cohort. Arch Dis Child Fetal Neonatal Ed. (2017) 102:F235–4. doi: 10.1136/archdischild-2016-311228
37. Hintz SR, Kendrick DE, Vohr BR, Kenneth Poole W, Higgins RD, Nichd Neonatal Research Network. Gender differences in neurodevelopmental outcomes among extremely preterm, extremely-low-birthweight infants. Acta Paediatr. (2006) 95:1239–48. doi: 10.1080/08035250600599727
38. Salas AA, Carlo WA, Ambalavanan N, Nolen TL, Stoll BJ, Das A, et al. Gestational age and birthweight for risk assessment of neurodevelopmental impairment or death in extremely preterm infants. Arch Dis Child Fetal Neonatal Ed. (2016) 101:F494–501. doi: 10.1136/archdischild-2015-309670
39. Agarwal PK, Shi L, Rajadurai VS, Zheng Q, Yang PH, Khoo PC, et al. Factors affecting neurodevelopmental outcome at 2 years in very preterm infants below 1250 grams: a prospective study. J Perinatol. (2018) 38:1093–100. doi: 10.1038/s41372-018-0138-3
40. Wong HS, Edwards P. Nature or nurture: a systematic review of the effect of socio-economic status on the developmental and cognitive outcomes of children born preterm. Matern Child Health J. (2013) 17:1689–700. doi: 10.1007/s10995-012-1183-8
41. van Veen S, Aarnoudse-Moens CS, van Kaam AH, Oosterlaan J, van Wassenaer-Leemhuis AG. Consequences of correcting intelligence quotient for prematurity at age 5 years. J Pediatr. (2016) 173:90–5. doi: 10.1016/j.jpeds.2016.02.043
42. Anderson PJ, Doyle LW, Victorian Infant Collaborative Study Group. Executive functioning in school-aged children who were born very preterm or with extremely low birth weight in the 1990s. Pediatrics. (2004) 114:50–7. doi: 10.1542/peds.114.1.50
43. Venkatesh KK, Leviton A, Hecht JL, Joseph RM, Douglass LM, Frazier JA, et al. Histologic chorioamnionitis and risk of neurodevelopmental impairment at age 10 years among extremely preterm infants born less than 28 weeks of gestation. Am J Obstet Gynecol. (2020) 223:745.e1–10. doi: 10.1016/j.ajog.2020.05.001
Keywords: longitudinal follow-up, neurodevelopmental outcome, very preterm children, trajectories, NDI
Citation: van Beek PE, van der Horst IE, Wetzer J, van Baar AL, Vugs B and Andriessen P (2021) Developmental Trajectories in Very Preterm Born Children Up to 8 Years: A Longitudinal Cohort Study. Front. Pediatr. 9:672214. doi: 10.3389/fped.2021.672214
Received: 25 February 2021; Accepted: 12 April 2021;
Published: 10 May 2021.
Edited by:
Peter B. Marschik, University Medical Center Göttingen, GermanyReviewed by:
Dajie Marschik, University Medical Center Göttingen, GermanyArend Bos, University Medical Center Groningen, Netherlands
Christa Einspieler, Medical University of Graz, Austria
Copyright © 2021 van Beek, van der Horst, Wetzer, van Baar, Vugs and Andriessen. This is an open-access article distributed under the terms of the Creative Commons Attribution License (CC BY). The use, distribution or reproduction in other forums is permitted, provided the original author(s) and the copyright owner(s) are credited and that the original publication in this journal is cited, in accordance with accepted academic practice. No use, distribution or reproduction is permitted which does not comply with these terms.
*Correspondence: Pauline E. van Beek, cGF1bGluZS52YW4uYmVla0BtbWMubmw=
†These authors have contributed equally to this work and share first authorship
 Pauline E. van Beek
 Iris E. van der Horst
 Josse Wetzer
 Anneloes L. van Baar
 Brigitte Vugs2
 Peter Andriessen