 Ricards Marcinkevics
 Patricia Reis Wolfertstetter
 Sven Wellmann
 Christian Knorr
 Julia E. Vogt
94% of researchers rate our articles as excellent or good
Learn more about the work of our research integrity team to safeguard the quality of each article we publish.
Find out more
ORIGINAL RESEARCH article
Front. Pediatr., 29 April 2021
Sec. Pediatric Surgery
Volume 9 - 2021 | https://doi.org/10.3389/fped.2021.662183
Background: Given the absence of consolidated and standardized international guidelines for managing pediatric appendicitis and the few strictly data-driven studies in this specific, we investigated the use of machine learning (ML) classifiers for predicting the diagnosis, management and severity of appendicitis in children.
Materials and Methods: Predictive models were developed and validated on a dataset acquired from 430 children and adolescents aged 0-18 years, based on a range of information encompassing history, clinical examination, laboratory parameters, and abdominal ultrasonography. Logistic regression, random forests, and gradient boosting machines were used for predicting the three target variables.
Results: A random forest classifier achieved areas under the precision-recall curve of 0.94, 0.92, and 0.70, respectively, for the diagnosis, management, and severity of appendicitis. We identified smaller subsets of 6, 17, and 18 predictors for each of targets that sufficed to achieve the same performance as the model based on the full set of 38 variables. We used these findings to develop the user-friendly online Appendicitis Prediction Tool for children with suspected appendicitis.
Discussion: This pilot study considered the most extensive set of predictor and target variables to date and is the first to simultaneously predict all three targets in children: diagnosis, management, and severity. Moreover, this study presents the first ML model for appendicitis that was deployed as an open access easy-to-use online tool.
Conclusion: ML algorithms help to overcome the diagnostic and management challenges posed by appendicitis in children and pave the way toward a more personalized approach to medical decision-making. Further validation studies are needed to develop a finished clinical decision support system.
Appendicitis is among the commonest childhood diseases, accounting for a third of admissions for abdominal pain (1). Life-time risk ranges from 6 to 9%, and incidence is highest between 10 and 19 years of age (2). Perforation rates are significantly higher in preschool children than in older children or adults (3).
Diagnosis remains essentially clinical, backed by laboratory data and imaging. In a pooled analysis of serum biomarkers for diagnosing acute appendicitis and perforation, Acharya et al. reported areas under the receiver operating characteristic (AUROC) of 0.75 and 0.69, respectively, for the white blood cell (WBC) count and 0.80 and 0.78 for C-reactive protein (CRP) (4). Despite increasing research there remains no specific biomarker for predicting acute appendicitis in clinical practice (4, 5). Abdominal and, specifically, appendix ultrasonography (US) is the standard imaging modality in children, being low-cost, non-invasive and repeatable, but it remains operator-dependent. Reported sensitivities and specificities for US-based diagnosis range widely: from 87 to 100%, and from 15 to 95% (6). The scores most frequently used to assist physicians in risk-stratifying children with abdominal pain are the Alvarado Score (AS) and Pediatric Appendicitis Score (PAS) (Supplementary Table 1) (7, 8). They may help to exclude appendicitis in an emergency setting (AUROC 0.84 for AS ≤ 3 and PAS ≤ 2) (9), but neither is in widespread routine use.
There are still no consistent and widely used international guidelines for managing acute appendicitis in children. Minimally invasive appendectomy remains the standard treatment of acute appendicitis despite increasing evidence of similar results being achieved by conservative therapy with antibiotics (10, 11), not to mention the reports of spontaneous resolution in uncomplicated cases suggesting that an antibiotic-free approach might be effective in selected school-age children (1, 12).
Machine learning (ML) enhances the early detection and monitoring of multiple medical conditions (13). Supervised learning models leverage large amounts of labeled data to extract complex statistical patterns predictive of a target variable, often achieving superhuman performance levels (14). In this study we applied ML to achieve three outcomes: diagnosing appendicitis in children with abdominal pain; guiding management (conservative without antibiotics vs. operative); and risk stratifying severity (gangrene and perforation). Our aim was to develop and validate a pilot ML tool to support physicians in diagnosing appendicitis at presentation, assessing severity, and deciding management. The purpose of this paper is not to develop a finished clinical decision support system, but rather to present a pilot study for a promising research prototype based on machine learning. To the best of our knowledge, this is the first study using ML to simultaneously predict diagnosis, conservative vs. operative management, and severity in children with suspected appendicitis.
The cohort study included all children and adolescents aged 0-18 years admitted with abdominal pain and suspected appendicitis to the Department of Pediatric Surgery at the tertiary Children's Hospital St. Hedwig in Regensburg, Germany, over the 3-year period from January 1, 2016 to December 31, 2018. Non-inclusion criteria were prior appendectomy, abdominal conditions such as chronic inflammatory bowel disease or intestinal duplication, simultaneous appendectomy, and treatment with antibiotics for concurrent disease such as pneumonia, resulting in a final total of 430 patients (Table 1). The study was approved by the University of Regensburg institutional review board (no. 18-1063-101) which also waived informed consent to routine data analysis. For patients followed up after discharge, informed consent was obtained from parents or legal representatives. All methods were performed in accordance with the relevant guidelines and regulations. Conservative management was defined as intravenous fluids, enemas, analgesics, and clinical/US monitoring without antibiotics in an inpatient setting. For patients with criteria for simple appendicitis presenting clinical and sonographic improvement, non-operative therapy was maintained, otherwise they underwent operation. Appendectomy was laparoscopic in 88% of cases and traditional in 12%. Histological and intra-operative findings were assessed. The routine procedure for children and adolescents with suspected appendicitis is summarized in Supplementary Figure 1.
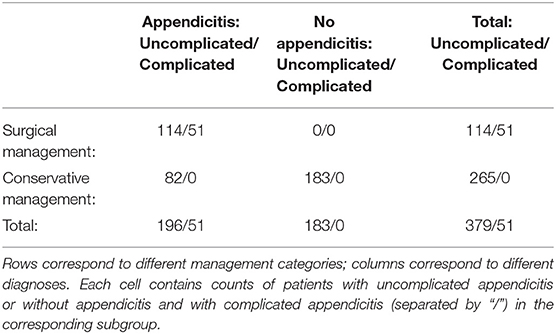
Table 1. Counts of patients in different diagnosis, management, and severity categories.
Our analysis considered predictive models for three binary response variables:
• diagnosis: appendicitis (n = 247, 57.21%) and no appendicitis (n = 183, 42.79%)
• management: surgical (n = 165, 38.37%) and conservative (n = 265, 61.63%)
• severity: complicated (n = 51, 11.86%) and uncomplicated appendicitis or no appendicitis (n = 379, 88.14%).
The “appendicitis” category included both acute and subacute cases, while “surgical” comprised primary and secondary surgical treatment. It is important to note that we could not confirm the diagnosis in every patient: histology was only possible in patients who underwent surgery. Conservatively treated patients were retrospectively assigned the “appendicitis” label only if they had AS and/or PAS values ≥ 4 and an appendix diameter ≥ 6 mm. Diagnosis was a proxy for confirmed disease status. Patients with the above criteria for appendicitis who were first treated conservatively (n = 86) were contacted at least 6 months after discharge (mean 28 months). We reached 61 individuals, five of whom had since undergone appendectomy and were therefore included in the surgical group. Appendicitis was classified as “uncomplicated” in all conservatively treated cases. The “uncomplicated” category also included patients without appendicitis since none had complications during treatment; it was almost 8 times larger than the “complicated” category. To address this major imbalance, we investigated the use of cost-sensitive classification models, e.g., by introducing prior category probabilities in random forest models (15), but performance was not markedly improved. The other two category pairs were reasonably balanced. Table 1 contains detailed counts of patients within different diagnosis, management, and severity categories.
Our analysis considered 38 predictor variables including patient and US data. Variables were continuous, binary, and categorical. All were measured before treatment was assigned and none represent intraoperative findings. Supplementary Table 2 contains explanations of all 38 predictor variables included in the model development and validation.
We computed summary statistics for patient subgroups, based on the three responses. Statistical tests for differences between subgroups were performed in the R programming language (version 3.6.2) (16). Summary and test statistics were based on non-missing data only. Chi-squared tests of independence were used for discrete variables and unpaired two-sided Mann-Whitney U-tests for continuous variables; p-values were adjusted for multiple comparisons using Hommel's method (17). A level of α = 0.05 was chosen for statistical significance. Predictors with several categories were binarized prior to the chi-squared test.
The dataset contained missing values. As a preprocessing step, we performed missing data imputation using the k-nearest neighbors (k-NN) (with k = 5) method based on Gower distance (18), as implemented in the R VIM package (19). This method imputes missing variables in every instance based on values occurring within the proximity given by Gower distance for continuous, categorical, and ordered variables (19). To avoid data leakage and the introduction of spurious associations between predictor and response variables, we performed the imputation without response variables and separately for train and test sets.
To predict the above response variables, we trained and validated three different ML models for classification in the R programming language (version 3.6.2) (16):
• logistic regression (LR), as implemented in the R glmnet package (20);
• random forest (RF) (21), as implemented in the R randomForest package (15);
• generalized boosted regression model (GBM) (22), as implemented in the R gbm package (23).
LR is only capable of learning a linear decision boundary to differentiate between classes, whereas the RF and GBM models are non-linear ensemble classification methods and can thus potentially learn more complex patterns. Both RF and GBM achieve this by training many simple classifiers and consequently aggregating their predictions into a single estimate.
To identify which variables were crucial for predictive performance, we compared classifiers trained on the following predictor subsets:
• full set of 38 predictor variables
• without US data (“US-free”)
• without the “peritonitis/abdominal guarding” variable
• without US data or the “peritonitis/abdominal guarding” variable.
It was interesting to investigate whether responses could be predicted without including the US variables that might be operator-dependent or unavailable in emergencies (24, 25). We singled out the “peritonitis/abdominal guarding” variable because detection can be unreliable, requiring an experienced examiner; our analysis considered it under three subcategories: (i) no peritonitis/abdominal guarding, (ii) localized, and (iii) generalized.
To evaluate and compare predictive models, we performed 10-fold cross-validation (CV) (26), using the k-NN method for imputing missing values separately for train and test sets. Ten-fold cross-validation is a standard procedure for the evaluation of ML models, wherein the model is repeatedly trained on 90% of data and tested on 10% of withheld data for 10 disjoint test folds. Predictive performance was assessed using AUROC and area under the precision-recall (AUPR) curve (Figure 1) (27). AUPR is particularly informative for classification problems with extreme class imbalance (27). It was therefore more appropriate for comparing models predicting appendicitis severity. We compared model performance using two-sided 10-fold cross-validated paired t-tests at a significance level α = 0.05 (28). In addition to AUROC and AUPR, sensitivity, specificity, negative and postive predictive values of the classifiers were evaluated.
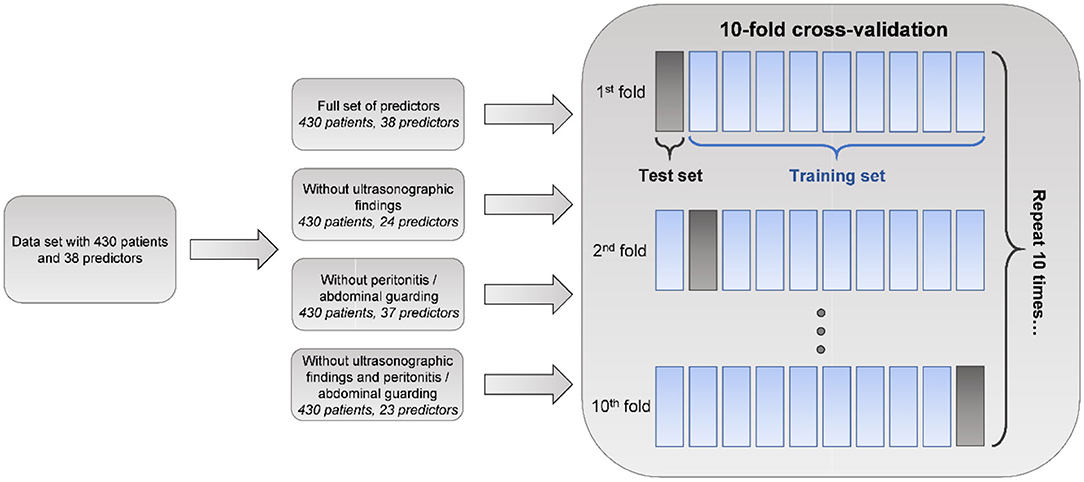
Figure 1. Machine learning analysis schematic. Machine learning models, namely logistic regression (LR), random forest (RF), and generalized boosted regression model (GBM), based on various sets of predictor variables, are evaluated using areas under receiver operating characteristic (AUROC) and precision-recall (AUPR) curves in the 10-fold cross-validation procedure. Ten-fold cross-validation is a standard procedure for evaluating the performance of predictive ML models wherein the model is trained on 90% of the data and tested on the remaining 10% repeatedly for 10 disjoint test folds. In our analysis, missing value imputation was performed separately for train and test sets using the k-nearest neighbors (k-NN) method.
In a clinical setting, variables can be systemically missing at test time. We therefore also examined the importance of predictor variables in case the number of predictors used by classifiers could be reduced without compromising their performance. Both RF and GBM provide measures of variable importance (15, 21, 23). We examined the averages of class-specific measures of variable importance given by the mean decrease in RF accuracy (15). We trained random forests on 300 bootstrap resamples of the data and used boxplots to visualize the distributions of the importance values obtained (29).
In addition, we cross-validated a variable selection procedure based on the RF importance measure to determine the minimal number of variables that could be used without compromising predictive performance. The procedure can be summarized as follows. For number of predictors q from 1 to 38, repeat:
1. Train full RF model (all predictor variables included) on the train set. Retrieve variable importance values.
2. Train RF model based on q predictors with the highest importance values, on the train set.
3. Evaluate AUROC and AUPR of on the test set.
4. Repeat steps 1-3 for all 10 folds in CV.
This procedure evaluates the performance of random forest classifiers that use varying numbers of predictors chosen on the basis of importance values.
Finally, we examined which variable subsets were chosen consistently, for each q. For q from 1 through 38, we trained random forest classifiers on 300 bootstrap resamples of the data and counted how many times each predictor was among the q most important variables. In this way, we could assess the variability of a set of q most important predictors, rather than provide a single selection which could be unstable because based on only one replication of the experiment.
Distributions of several predictors differed significantly (at level α = 0.05) for all three responses, namely, AS, PAS, appendix diameter, body temperature, WBC count, neutrophil percentage, CRP, and peritonitis/abdominal guarding. These variables had previously been identified as useful in predicting appendicitis (8, 30–32). Table 2 and Supplementary Tables 3, 4 show the summary statistics and statistical test results for patient subgroups based on response variables. In general, the descriptive statistics suggested that the data featured strong associations between some predictors and responses.
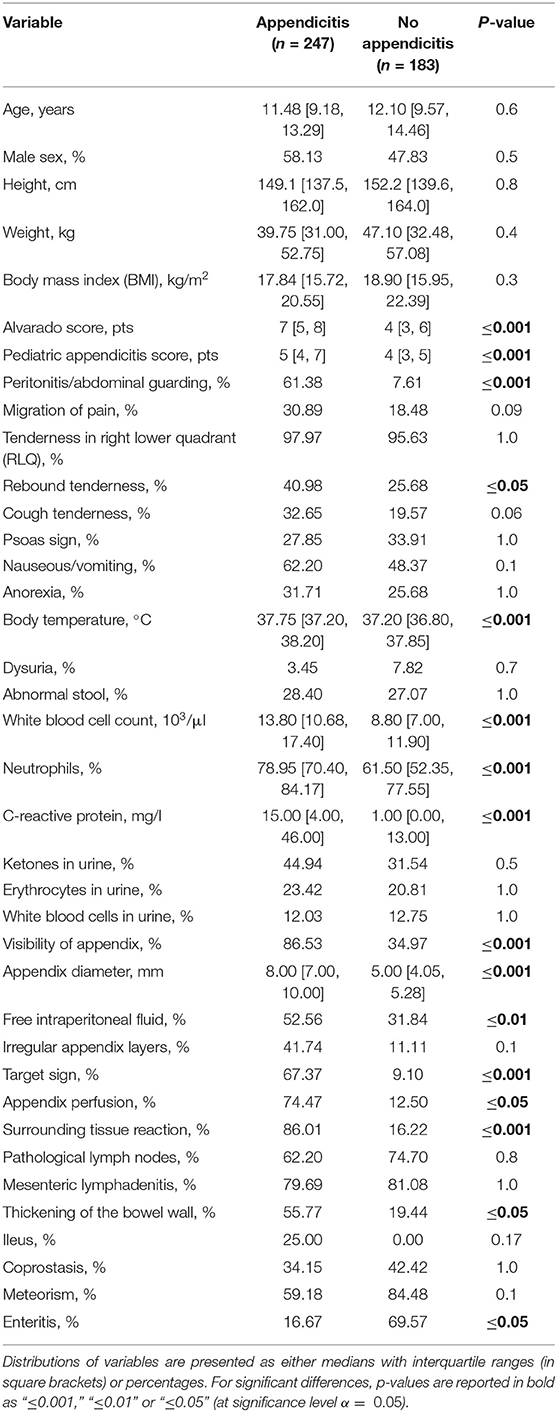
Table 2. Dataset description for patients with and without appendicitis.
Table 3 shows the 10-fold CV results for the different ML classifiers for predicting diagnosis, management, and severity. For diagnosis classification, full RF (average AUROC: 0.96, average AUPR: 0.94) and GBM (average AUROC: 0.96, average AUPR: 0.94) models significantly outperformed logistic regression (average AUROC: 0.91, average AUPR: 0.88). AUROC and AUPR p-values were 0.002 and 0.006 for RF, and 0.007 and 0.03 for GBM. This suggests benefit from using non-linear classification methods for predicting a diagnosis of appendicitis. The full GBM and RF classifiers performed equally with respect to both evaluation metrics. All ML models performed considerably better than the random classifier, that is, a random guess. On average, classifiers that used the full set of predictors had higher AUROCs and AUPRs than the clinical baselines, such as AS, PAS, and suspected diagnosis, given by hospital specialists. Based on the CV results, US input is crucial for accurately diagnosing appendicitis because average AUROC and AUPR degraded in all models when it was absent. Peritonitis had less influence on prediction quality.
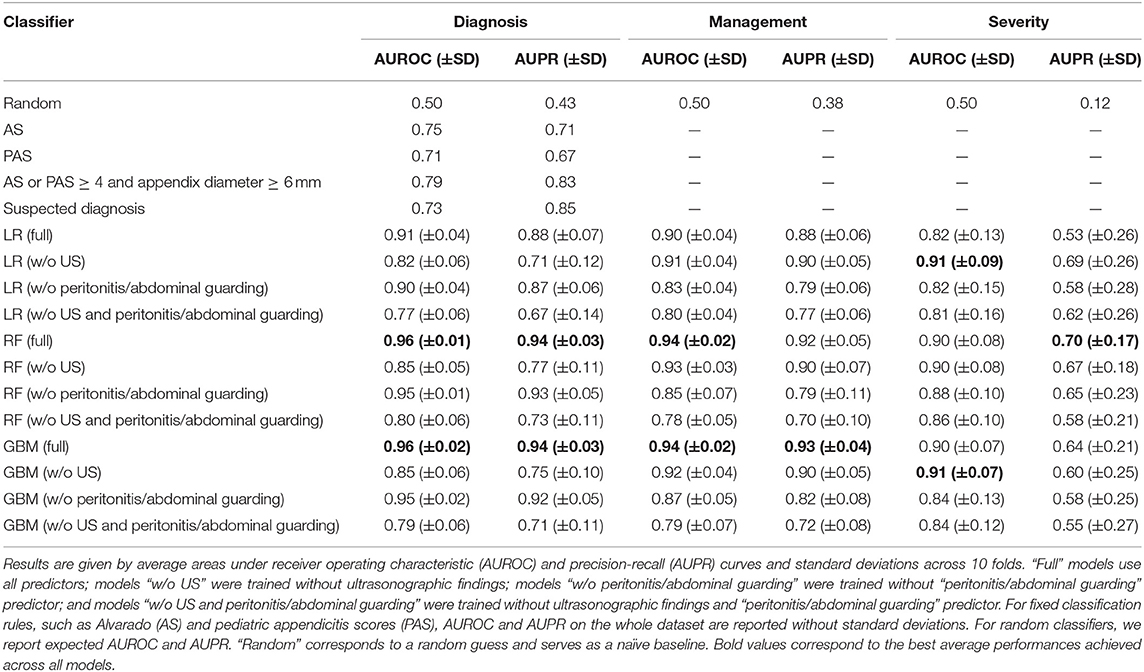
Table 3. Ten-fold cross-validation results for logistic regression (LR), random forest (RF), and generalized boosted regression (GBM) models for predicting diagnosis, management, and severity.
For predicting management, the full RF and GBM models had the highest average AUROC (0.94), while the full GBM had the highest average AUPR (0.93). Both non-linear methods significantly outperformed logistic regression (average AUROC: 0.90, average AUPR: 0.88). AUROC and AUPR p-values were 0.01 and 0.06 (non-significant) for RF, and 0.02 and 0.03 for GBM. All models had considerably better average AUROCs and AUPRs than the random classifier. Based on the CV results, peritonitis is a very important variable for predicting management. Average model performance dropped considerably when removing this variable. US findings did not affect prediction quality as much as when diagnosing appendicitis.
As for appendicitis severity, US-free logistic regression achieved the highest average AUROC (0.91) alongside US-free GBM, while full-set RF achieved the highest average AUPR (0.70) (Table 3). Although all models performed considerably better than the random classifier, complicated appendicitis appeared harder to predict than either diagnosis or management. The AUPRs were much lower, and all models had high variances across the folds. This could be due to the very low prevalence of complicated appendicitis (12% of all patients). There was little gain in performance from using non-linear classification methods. The differences in AUROC and AUPR between RF, GBM, and (US-free) logistic regression were non-significant. AUROC and AUPR p-values were 0.94 and 0.97 for RF, and 0.76 and 0.58 for GBM. US input had almost no effect on average classifier performance whereas peritonitis was important and its exclusion markedly decreased AUROC and AUPR values in all models.
We also evaluated model sensitivities, specificities, and negative and positive predictive values (NPV/PPV). Tables 4, 5 contain results of the 10-fold CV for all three responses. In this analysis, a threshold of 0.5 was used to predict labels. When incorporating any of these models into clinical decision-making, the threshold will have to be chosen based on the desired sensitivity and specificity. For diagnosis, full non-linear classifiers achieved better combinations of sensitivity, specificity, NPV, and PPV than the clinical baseline (AS or PAS ≥ 4 and appendix diameter ≥ 6 mm). Similar to the evaluation in Table 3, on average, non-linear classifiers performed noticeably better than logistic regression in predicting diagnosis.
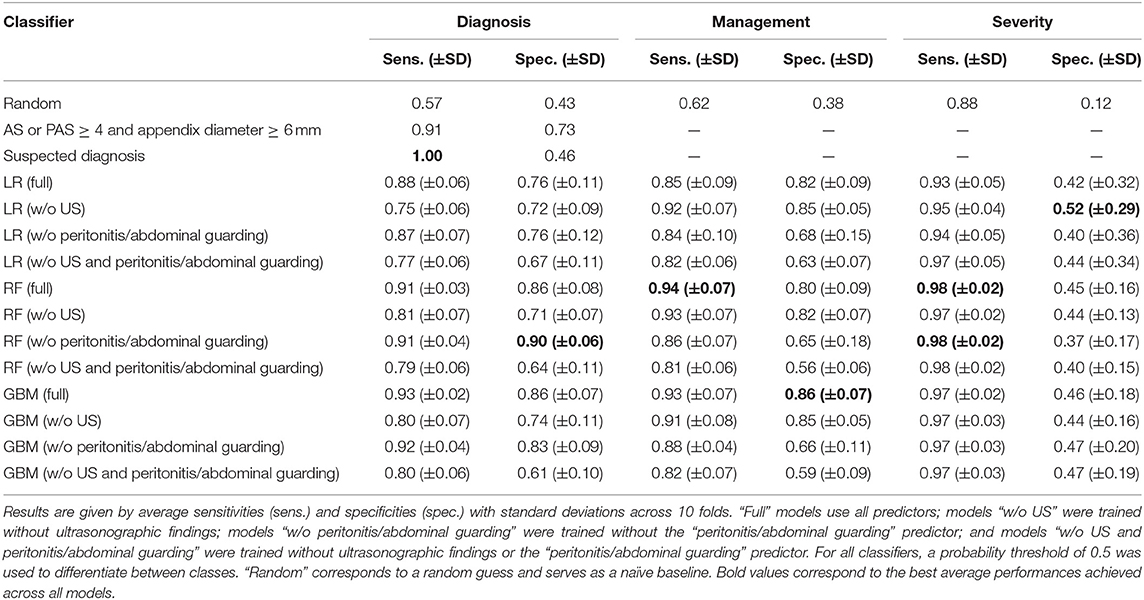
Table 4. Ten-fold cross-validation results for logistic regression (LR), random forest (RF), and generalized boosted regression (GBM) models for predicting diagnosis, management, and severity.
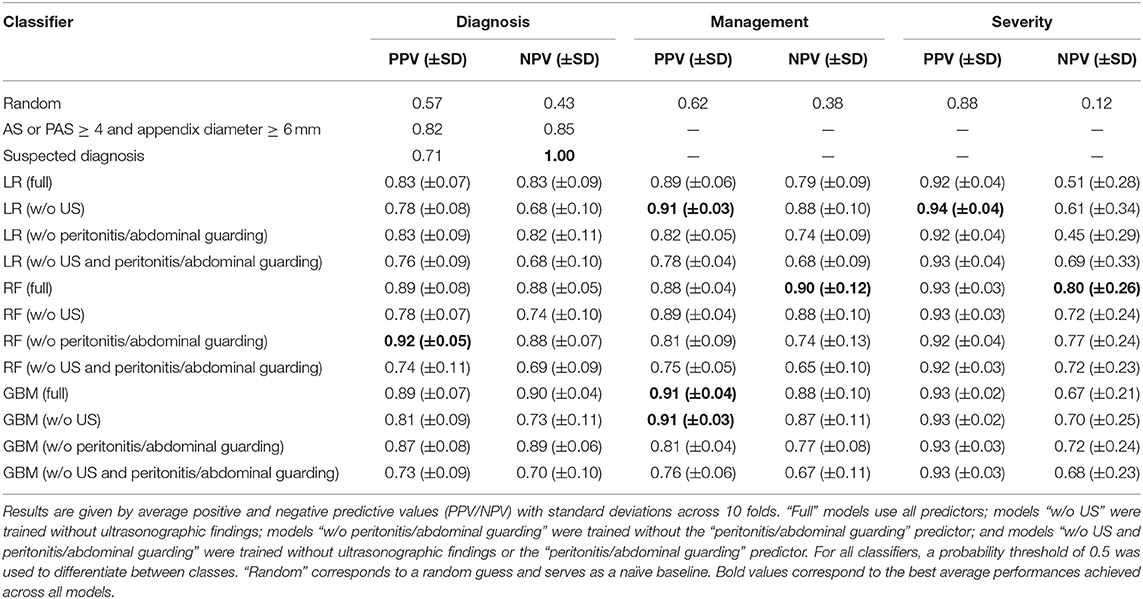
Table 5. Ten-fold cross-validation results for logistic regression (LR), random forest (RF), and generalized boosted regression (GBM) models for predicting diagnosis, management, and severity.
To identify the most crucial predictive variables, we trained RF classifiers on 300 bootstrap resamples of the dataset and obtained a distribution of importance values for every predictor. The RF variable importance quantifies how important each variable is for predicting the outcome in the random forest model. For diagnosing appendicitis, on average, the most important predictors were appendix diameter, appendix visibility on US, and peritonitis. For management, they were peritonitis, appendix diameter, and WBC count. For severity, they were CRP, peritonitis, and body temperature (details in Figure 2). Plots of importance values for the full set of predictors are shown in Supplementary Figure 2. Overall, these findings agreed with the statistical results in Table 2 and Supplementary Tables 3, 4. Predictor variables that differ significantly across patient subgroups are often among the most important features used by random forests for predictions.
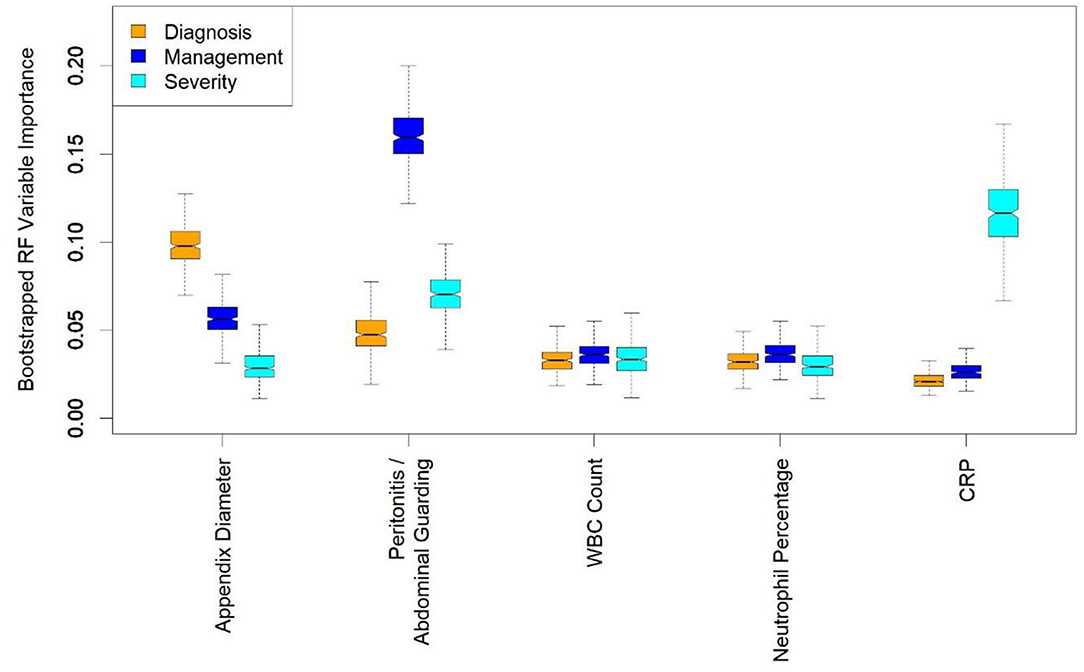
Figure 2. Boxplots of random forest (RF) importance values for a few most important predictors. RF variable importance quantifies how important each variable is for predicting the considered outcome. Appendix diameter, peritonitis/abdominal guarding, white blood cell (WBC) count, neutrophil percentage, and C-reactive protein (CRP) are among 10 most important variables for predicting diagnosis, management and severity. Distributions were obtained by training random forest classifiers on 300 bootstrap resamples of the dataset. The bootstrapping was performed to provide uncertainty about variable importance values, rather than mere point estimates.
In addition, we performed variable selection using RF importance. Figure 3 contains AUROC and AUPR plots for RF models based on varying numbers of predictors. For predicting diagnosis, classifier AUROC and AUPR values saturated at q = 3 (Figures 3A,B). Thus, a few variables suffice for accurate appendicitis risk stratification. For management, there was a steady increase in average AUROC (Figure 3C) with an increase in the number of predictor variables selected. For AUPPR, classifiers with <14 predictors (Figure 3D) had higher variances in 10-fold CV. Predictive performance stabilized at q = 14. Similarly, for predicting severity, average AUROC and AUPR increased steadily with model complexity (Figures 3E,F). AUROC saturated at q = 5, and AUPR at q = 11. For all three prediction tasks, we observed that the full set of predictors is far from necessary because full-model performance levels can be achieved with a smaller number of variables.
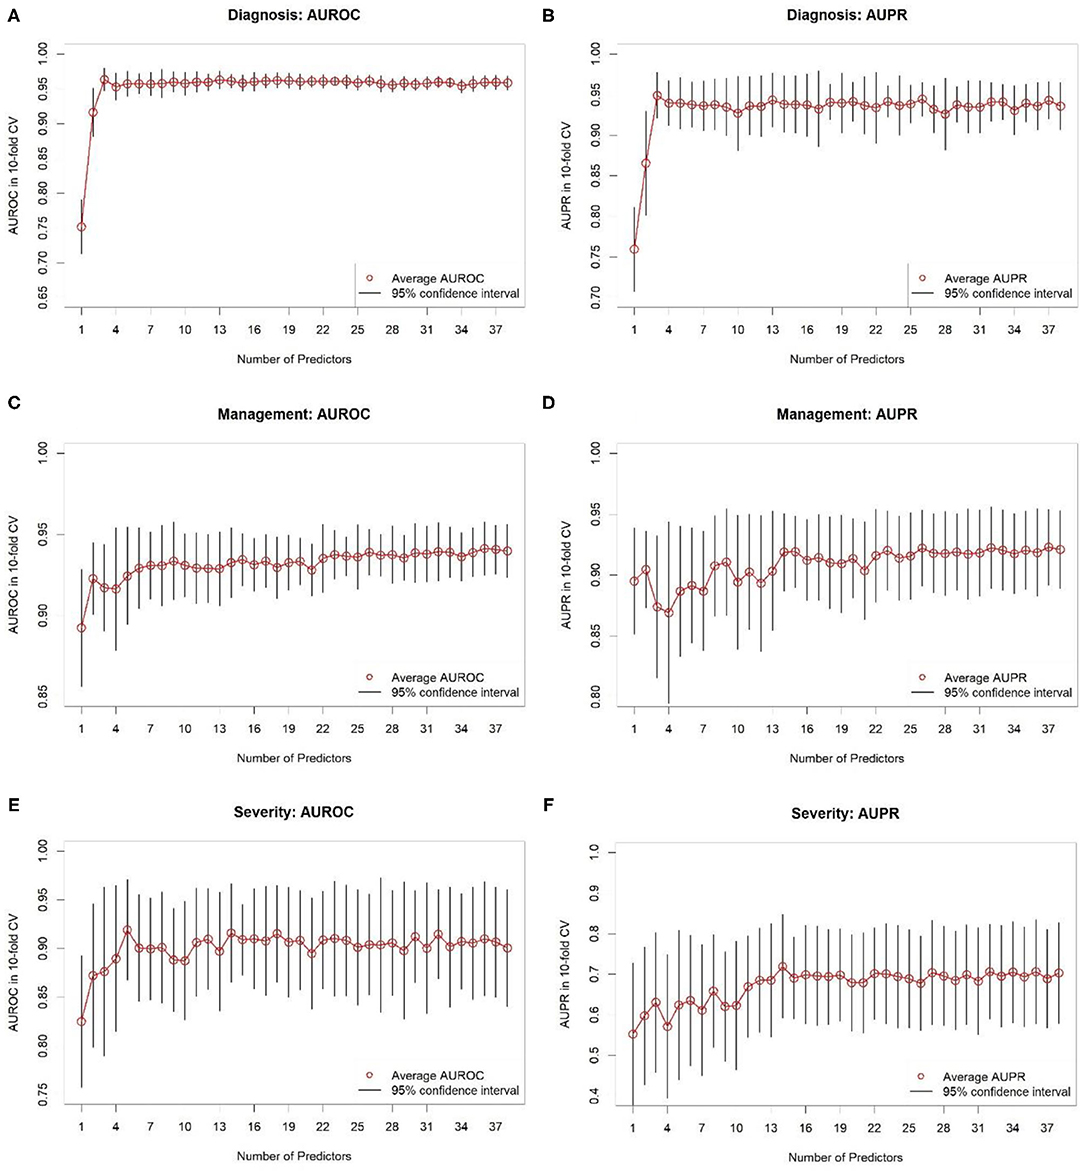
Figure 3. Results of 10-fold cross-validation for random forest classifiers based on different numbers of predictor variables selected based on variable importance. (A,B) Show areas under receiver operating characteristic (AUROC) and precision-recall (AUPR) curves, respectively, for predicting diagnosis. (C,D) Show AUROCs and AUPRs, respectively, for predicting management. (E,F) Show AUROCs and AUPRs, respectively, for predicting severity. Black-colored bars correspond to 95% confidence intervals, constructed using t-distribution; red-colored dots correspond to averages. Recall that random classifier AUROCs are 0.50 for all three targets and random classifier AUPRs are 0.43, 0.38, and 0.12 for diagnosis, treatment, and complicated appendicitis, respectively.
We used bootstrapping to determine how frequently variables were selected based on their RF importance. For predicting diagnosis, we looked at choosing q = 3 most important variables. The variables chosen in >5% of bootstrap resamples included appendix diameter, appendix visibility on US, peritonitis, target sign, WBC count, and neutrophil percentage. For management we examined a subset of size q = 14. The variables selected in ≥5% of bootstrap resamples included peritonitis, CRP, neutrophil percentage, WBC count, appendix diameter, enteritis, target sign, appendix perfusion, AS, body temperature, age, surrounding tissue reaction, appendix layer structure, weight, body mass index (BMI), height, and PAS. For severity we chose a subset of q = 11 variables. The following predictors were selected in >5% of bootstrap resamples: peritonitis, CRP, body temperature, WBC count, neutrophil percentage, appendix diameter, appendix perfusion, weight, age, bowel wall thickening, height, AS, BMI, ileus, appendix layer structure, PAS, erythrocytes in urine, and target sign. Supplementary Table 5 summarizes these variable selection results.
We provide an easy-to-use online tool for the three response variables at http://papt.inf.ethz.ch/ (33). The RF models implemented in this tool use limited sets of predictors chosen based on variable importance and 10-fold CV. We chose random forests because they outperformed logistic regression and were, in general, on a par with GBM. We included the variables selected into subsets in ≥5% of bootstrap resamples of the dataset. The tool presents a pilot status and was developed for educational use only. Even in further steps after prospective validation, practical clinical considerations must be incorporated into decision-making.
This observational study of children referred with abdominal pain to the pediatric surgical department used different ML models to predict the diagnosis, management and severity of appendicitis. Starting with a granular dataset including demographic, clinical, laboratory, and US variables, we identified a minimal subset of key predictors and trained classifiers that far outperformed conventional scores such as the AS and PAS. Since all the variables we used in this study are standardized and widely available for evaluating patients with abdominal pain, our findings are broadly relevant. We also developed the Appendicitis Prediction Tool (APT) to predict the diagnosis, management and severity of appendicitis with unlimited online access.
A basic challenge with ML models is that their performance depends largely on the quality and representativity of the training data, and their applicability in real life depends on the accessibility of required features (34). For example, assessing abdominal guarding as a sign of peritonitis can be challenging during initial presentation of small children with abdominal pain. If this finding is unclear, it is recommended that assessment be repeated during the clinical observation period, if necessary under analgesia (35, 36). Based on RF variable importance and CV results, we found that “peritonitis/abdominal guarding” had the highest importance for predicting management, but not appendicitis or appendicitis severity, for which other predictors were more important (Figure 2). The AS and PAS can be easily calculated after clinical examination and hemogram. Although abdominal and appendix US is the most suitable and cost-effective imaging modality for suspected appendicitis, it is highly operator-dependent, requiring years of training, particularly for children, and is not always on hand in every ED. That is why we also trained models without “peritonitis/abdominal guarding,” without US, and without either “peritonitis/abdominal guarding” or US. These variables are not mandatory in the prediction tool, making it easier to deploy. The predictors are imputed using the k-NN method if the user decides to omit them. Nevertheless, based on the CV results (Table 3), the models incorporating US variables performed considerably better in predicting diagnosis and management and hence are preferred, to avoid complications and misdiagnosis. Most children with missed appendicitis on presenting to the ED of a tertiary care hospital did not undergo US (67 vs. 13% of correctly diagnosed cases, p < 0.05) (37).
Several studies have used ML to support the diagnosis of appendicitis (30, 38, 39). Four recent studies have focused exclusively on the pediatric population (40–43). Reismann et al. performed feature selection and trained a logistic regression to diagnose appendicitis and differentiate between uncomplicated and complicated cases of pediatric acute appendicitis (40). They analyzed laboratory variables and appendix diameter in US and achieved AUROCs of 0.91 and 0.80 for diagnosing appendicitis and differentiating complicated appendicitis, respectively. Akmese et al. analyzed demographic and laboratory data and used a range of ML methods to predict whether pediatric patients with suspected acute appendicitis underwent surgery (41). In their analysis, gradient boosting attained the highest accuracy (95%). Similar to Akmese et al. (41) Aydin et al. detected pediatric appendicitis based on demographic and pre-operative laboratory data (42). In addition, they differentiated between complicated and uncomplicated appendicitis. Their decision tree model achieved AUROCs of 0.94 and 0.79 for predicting appendicitis and uncomplicated appendicitis, respectively. Stiel et al. applied different appendicitis scores (AS, PAS, Heidelberg, and Tzanakis Score) to a dataset of pediatric patients presenting with abdominal pain to predict diagnosis and perforated appendicitis (43). The Heidelberg Score was modified and a data-driven score was developed using decision trees and random forests, achieving AUROCs of, respectively, 0.92 and 0.86 for appendicitis diagnosis, and both 0.71 for perforation.
Our own analysis focused exclusively on the pediatric population given the particularities of appendicitis in this age range: atypical clinical course and elevated perforation rates in preschool-aged children, high prevalence, and multiple differential diagnoses (44, 45). In addition to demographic, laboratory, and ultrasonographic data, we considered clinical predictors, such as peritonitis/abdominal guarding, and appendicitis scores (AS and PAS). Moreover, we targeted the prediction of all three targets simultaneously: diagnosis, management, and severity. None of the machine learning models mentioned above were deployed as an open access online tool (40–43), whereas our models are available as an easy-to-use APT.
Our 10-fold CV results (Table 3) are overall comparable to the performance levels reported by Reismann et al. (40), Akmese et al. (41), Aydin et al. (42), and Stiel et al. (43) whose studies are similar to ours. Compared to the previous work on using ML to predict pediatric appendicitis (40–43), our analysis considers the most extensive set of variables and, to the best of our knowledge, is the first to simultaneously predict diagnosis, management, and severity of appendicitis in pediatric patients. In a retrospective study Cohen et al. found that children with a normal WBC count and an appendix non-visualized on US could initially be kept under observation (46). According to our data, appendix visibility on US is one of the most important predictors for diagnosis (Figure 2).
In the presented collective, pediatric patients with suspected simple appendicitis and persistent symptoms after initial treatment and evaluation at the ED were admitted to further observation and therapy, as shown in Supplementary Figure 1. They received initial clinical support, e.g., intravenous fluids, enemas, without antibiotics. Eighty two patients with clinical and US signs of uncomplicated appendicitis showed clinical improvement, including appendicitis regression signs in US. Therefore, they were discharged after a period of observation. Several studies indicate that simple and complicated appendicitis might have a different pathophysiology, suggesting that some forms of uncomplicated appendicitis may be reversible, and, as an alternative to operation, could be treated with or even without antibiotics (1, 47–50). Ohba et al. (12) conducted a prospective study of pediatric appendicitis based on US findings such as appendix diameter, wall structure, and perfusion. Their results support the possibility of treating pediatric patients conservatively without antibiotics if abundant blood flow in the appendix submucosal layer is still detectable.
The APT is an academic instrument whose sensitivity and specificity require further clinical testing. This prototype was developed based on our first dataset as a pilot trial with a promising application of ML as a basis for further prospective studies. It needs a larger training dataset and external blinded validation before it can be integrated into clinical decision-making. The model could be extended to differentiate patients requiring primary surgery from those suitable for conservative management with or without antibiotics by identifying the characteristics supporting spontaneous regression of acute appendicitis. Furthermore, predictive models could be used to support the decision on which surgical approach is the best suitable for the patient. Certain minimal invasive approaches such as TULAA (trans-umbilical laparoscopic-assisted appendectomy) may benefit from preoperative patient stratification, guiding the decision between single incision vs. 2-trocar technique (51).
The current dataset was acquired from patients admitted to a pediatric surgical unit with suspected appendicitis. Those with mild symptoms and/or rapid improvement had already been discharged by the emergency department. This can be assumed to have increased the probability of appendicitis among surgical admissions. The predictors for all three outcomes include clinical, laboratory, and US parameters that are readily and cost-effectively available during a patient's work-up. Limitations include certain missing variables, a limited number of patients, especially with complicated appendicitis, the lack of a definitive histological diagnosis in conservatively managed patients (we provide a more detailed discussion of this limitation in the Supplementary Material), and the current absence of external validation. Due to these limitations, the APT is merely a research prototype and must not be relied on for health or personal advice.
Pediatric appendicitis remains an important disease with a heterogeneous presentation. The APT should help clinicians identify and manage patients with potential appendicitis. It could become an important tool for clinical observation in the near future. The goal of further research should be the expanded application of ML models for the early differential diagnosis of children with abdominal pain. We see it as a valuable tool for recognizing appendicitis severity and facilitating a personalized management approach.
The dataset analyzed is available in anonymized form alongside with the code in a GitHub repository: https://github.com/i6092467/pediatric-appendicitis-ml.
The study involving human participants was reviewed and approved by the University of Regensburg institutional review board (Ethikkommission der Universität Regensburg, no. 18-1063-101), which also waived informed consent to routine data analysis. For patients followed up after discharge, written informed consent was obtained from parents or legal representatives.
All authors made substantial contributions to conception and design, analyses and interpretation of data, and revising the article. PRW and CK performed clinical data acquisition, coordination and check. PRW performed literature review and contributed to the manuscript. RM performed statistical and machine learning analysis and contributed to the manuscript. CK and SW supervised the clinical part of the project. JV supervised the machine learning part of the project. All authors have read the manuscript and approved its submission.
The authors declare that the research was conducted in the absence of any commercial or financial relationships that could be construed as a potential conflict of interest.
The authors would like to express their gratitude to Imant Daunhawer and Kieran Chin-Cheong from the Medical Data Science research group at the Department of Computer Science, ETH Zurich, for their help with the development of the online prediction tool. They also would like to thank Vivien Rimili and the physicians of the department of pediatric surgery of the Clinic Hedwig for helping with data acquisition. The authors sincerely thank Ian Young, St Bartholomew's Hospital, London, UK, and Lingua Medica for proofreading the article.
The Supplementary Material for this article can be found online at: https://www.frontiersin.org/articles/10.3389/fped.2021.662183/full#supplementary-material
1. Andersson RE. The natural history and traditional management of appendicitis revisited: spontaneous resolution and predominance of prehospital perforations imply that a correct diagnosis is more important than an early diagnosis. World J Surg. (2006) 31:86–92. doi: 10.1007/s00268-006-0056-y
2. Addiss DG, Shaffer N, Fowler BS, Tauxe RV. The epidemiology of appendicitis and appendectomy in the United States. Am J Epidemiol. (1990) 132:910–25. doi: 10.1093/oxfordjournals.aje.a115734
3. Bonadio W, Peloquin P, Brazg J, Scheinbach I, Saunders J, Okpalaji C, et al. Appendicitis in preschool aged children: regression analysis of factors associated with perforation outcome. J Pediatr Surg. (2015) 50:1569–73. doi: 10.1016/j.jpedsurg.2015.02.050
4. Acharya A, Markar SR, Ni M, Hanna GB. Biomarkers of acute appendicitis: systematic review and cost–benefit trade-off analysis. Surg Endosc. (2016) 31:1022–31. doi: 10.1007/s00464-016-5109-1
5. Shommu NS, Jenne CN, Blackwood J, Martin DA, Joffe AR, Eccles R, et al. The use of metabolomics and inflammatory mediator profiling provides a novel approach to identifying pediatric appendicitis in the emergency department. Sci Rep. (2018) 8:4083. doi: 10.1038/s41598-018-22338-1
6. Dingemann J, Ure B. Imaging and the use of scores for the diagnosis of appendicitis in children. Eur J Pediatr Surg. (2012) 22:195–200. doi: 10.1055/s-0032-1320017
7. Alvarado A. A practical score for the early diagnosis of acute appendicitis. Ann Emerg Med. (1986) 15:557–64. doi: 10.1016/S0196-0644(86)80993-3
8. Samuel M. Pediatric appendicitis score. J Pediatr Surg. (2002) 37:877–81. doi: 10.1053/jpsu.2002.32893
9. Nepogodiev D, Wilkin RJ, Bradshaw CJ, Skerritt C, Ball A, Moni-Nwinia W, et al. Appendicitis risk prediction models in children presenting with right iliac fossa pain (RIFT study): a prospective, multicentre validation study. Lancet Child Adolesc Health. (2020) 4:271–80. doi: 10.1016/S2352-4642(20)30006-7
10. Svensson JF, Patkova B, Almström M, Naji H, Hall NJ, Eaton S, et al. Nonoperative treatment with antibiotics versus surgery for acute nonperforated appendicitis in children. Ann Surg. (2015) 261:67–71. doi: 10.1097/SLA.0000000000000835
11. Svensson J, Hall N, Eaton S, Pierro A, Wester T. A review of conservative treatment of acute appendicitis. Eur J Pediatr Surg. (2012) 22:185–94. doi: 10.1055/s-0032-1320014
12. Ohba G, Hirobe S, Komori K. The usefulness of combined B mode and doppler ultrasonography to guide treatment of appendicitis. Eur J Pediatr Surg. (2016) 26:533–6. doi: 10.1055/s-0035-1570756
13. Daunhawer I, Kasser S, Koch G, Sieber L, Cakal H, Tütsch J, et al. Enhanced early prediction of clinically relevant neonatal hyperbilirubinemia with machine learning. Pediatr Res. (2019) 86:122–7. doi: 10.1038/s41390-019-0384-x
14. Rajkomar A, Dean J, Kohane I. Machine learning in medicine. N Engl J Med. (2019) 380:1347–58. doi: 10.1056/NEJMra1814259
15. Liaw A, Wiener M. Classification and regression by randomForest. R News. (2007) 2:18–22. Available online at: https://cran.r-project.org/doc/Rnews/Rnews_2002-3.pdf
16. R Core Team. R: A Language and Environment for Statistical Computing. Vienna: R Foundation for Statistical Computing (2019). Available online at: https://www.R-project.org/ (accessed January 5, 2021).
17. Hommel G. A stagewise rejective multiple test procedure based on a modified Bonferroni test. Biometrika. (1988) 75:383–6. doi: 10.1093/biomet/75.2.383
18. Gower JC. A general coefficient of similarity and some of its properties. Biometrics. (1971) 27:857–71. doi: 10.2307/2528823
19. Kowarik A, Templ M. Imputation with the R package VIM. J Stat Softw. (2016) 74:1–16. doi: 10.18637/jss.v074.i07
20. Friedman JH, Hastie T, Tibshirani R. Regularization paths for generalized linear models via coordinate descent. J Stat Softw. (2010) 33:1–22. doi: 10.18637/jss.v033.i01
22. Friedman JH. Greedy function approximation: a gradient boosting machine. Ann Stat. (2001) 29:1189–232. doi: 10.1214/aos/1013203451
23. Greenwell B, Boehmke B, Cunningham J. gbm: Generalized Boosted Regression Models. R package version 2.1.5. (2019). Available online at: https://CRAN.R-project.org/package%3DgbmCRAN.R-project.org/package=gbm (accessed January 5, 2021).
24. Sola R, Wormer BA, Anderson WE, Schmelzer TM, Cosper GH. Predictors and outcomes of nondiagnostic ultrasound for acute appendicitis in children. Am J Surg. (2017) 83:1357–62. doi: 10.1177/000313481708301218
25. Soundappan SS, Karpelowsky J, Lam A, Lam L, Cass D. Diagnostic accuracy of surgeon performed ultrasound (SPU) for appendicitis in children. J Pediatr Surg. (2018) 53:2023–7. doi: 10.1016/j.jpedsurg.2018.05.014
26. Stone M. Cross-validatory choice and assessment of statistical predictions. J R Stat Soc: B. (1974) 36:111–33. doi: 10.1111/j.2517-6161.1974.tb00994.x
27. Davis J, Goadrich M. The relationship between precision-recall and ROC curves. In: Proceedings of the 23rd International Conference on Machine learning—ICML'06. ACM Press (2006). p. 233–40.
28. Dietterich TG. Approximate statistical tests for comparing supervised classification learning algorithms. Neural Comput. (1998) 10:1895–923. doi: 10.1162/089976698300017197
29. Efron B, Tibshirani R. Bootstrap methods for standard errors, confidence intervals, and other measures of statistical accuracy. Stat Sci. (1986) 1:54–75. doi: 10.1214/ss/1177013817
30. Hsieh CH, Lu RH, Lee NH, Chiu WT, Hsu MH, Li YCJ. Novel solutions for an old disease: diagnosis of acute appendicitis with random forest, support vector machines, and artificial neural networks. Surgery. (2011) 149:87–93. doi: 10.1016/j.surg.2010.03.023
31. Owen TD, Williams H, Stiff G, Jenkinson LR, Rees BI. Evaluation of the Alvarado score in acute appendicitis. J R Soc Med. (1992) 85:87–8.
32. Wu HP, Lin CY, Chang CF, Chang YJ, Huang CY. Predictive value of C-reactive protein at different cutoff levels in acute appendicitis. Am J Emerg Med. (2005) 23:449–53. doi: 10.1016/j.ajem.2004.10.013
33. Marcinkevics R. Pediatric Appendicitis Prediction Tool. (2020). Available online at: http://papt.inf.ethz.ch/ (accessed January 5, 2021).
34. Koch G, Pfister M, Daunhawer I, Wilbaux M, Wellmann S, Vogt JE. Pharmacometrics and machine learning partner to advance clinical data analysis. Clin Pharmacol Ther. (2020) 107:926–33. doi: 10.1002/cpt.1774
35. Kim MK, Strait RT, Sato TT, Hennes HM. A randomized clinical trial of analgesia in children with acute abdominal pain. Acad Emerg Med. (2002) 9:281–7. doi: 10.1111/j.1553-2712.2002.tb01319.x
36. Green R, Bulloch B, Kabani A, Hancock BJ, Tenenbein M. Early analgesia for children with acute abdominal pain. Pediatrics. (2005) 116:978–83. doi: 10.1542/peds.2005-0273
37. Galai T, Beloosesky O, Scolnik D, Rimon A, Glatstein M. Misdiagnosis of acute appendicitis in children attending the emergency department: the experience of a large, tertiary care pediatric hospital. Eur J Pediatr Surg. (2016) 27:138–41. doi: 10.1055/s-0035-1570757
38. Deleger L, Brodzinski H, Zhai H, Li Q, Lingren T, Kirkendall ES, et al. Developing and evaluating an automated appendicitis risk stratification algorithm for pediatric patients in the emergency department. J Am Med Inform Assoc. (2013) 20:e212–20. doi: 10.1136/amiajnl-2013-001962
39. Rajpurkar P, Park A, Irvin J, Chute C, Bereket M, Mastrodicasa D, et al. AppendiXNet: deep learning for diagnosis of appendicitis from a small dataset of CT exams using video pretraining. Sci Rep. (2020) 10:1–7. doi: 10.1038/s41598-020-61055-6
40. Reismann J, Romualdi A, Kiss N, Minderjahn MI, Kallarackal J, Schad M, et al. Diagnosis and classification of pediatric acute appendicitis by artificial intelligence methods: an investigator-independent approach. PLoS ONE. (2019) 14:e0222030. doi: 10.1371/journal.pone.0222030
41. Akmese OF, Dogan G, Kor H, Erbay H, Demir E. The use of machine learning approaches for the diagnosis of acute appendicitis. Emerg Med Int. (2020) 2020:1–8. doi: 10.1155/2020/7306435
42. Aydin E, Türkmen IU, Namli G, Öztürk Ç, Esen AB, Eray YN, et al. A novel and simple machine learning algorithm for preoperative diagnosis of acute appendicitis in children. Pediatr Surg Int. (2020) 36:735–42. doi: 10.1007/s00383-020-04655-7
43. Stiel C, Elrod J, Klinke M, Herrmann J, Junge CM, Ghadban T, et al. The modified Heidelberg and the AI appendicitis score are superior to current scores in predicting appendicitis in children: a two-center cohort study. Front Pediatr. (2020) 8:592892. doi: 10.3389/fped.2020.592892
44. Nwokoma NJ. Appendicitis in children. In: Lander A, editor, Appendicitis—A Collection of Essays from Around the World. Rijeka: InTech (2011). p. 133–69.
45. Zachariou Z. Appendizitis. In: von Schweinitz D, Ure B, editors, Kinderchirurgie. Viszerale und Allgemeine Chirurgie des Kindesalters. Berlin Heidelberg: Springer (2013) p. 465–74.
46. Cohen B, Bowling J, Midulla P, Shlasko E, Lester N, Rosenberg H, et al. The non-diagnostic ultrasound in appendicitis: is a non-visualized appendix the same as a negative study? J Pediatr Surg. (2015) 50:923–7. doi: 10.1016/j.jpedsurg.2015.03.012
47. Bhangu A, Søreide K, Saverio SD, Assarsson JH, Drake FT. Acute appendicitis: modern understanding of pathogenesis, diagnosis, and management. Lancet. (2015) 386:1278–87. doi: 10.1016/S0140-6736(15)00275-5
48. Andersson R, Hugander A, Thulin A, Nystrom PO, Olaison G. Indications for operation in suspected appendicitis and incidence of perforation. BMJ. (1994) 308:107–10. doi: 10.1136/bmj.308.6921.107
49. Kiss N, Minderjahn M, Reismann J, Svensson J, Wester T, Hauptmann K, et al. Use of gene expression profiling to identify candidate genes for pretherapeutic patient classification in acute appendicitis. BJS Open. (2021) 5:zraa045. doi: 10.1093/bjsopen/zraa045
50. Migraine S, Atri M, Bret PM, Lough JO, Hinchey JE. Spontaneously resolving acute appendicitis: clinical and sonographic documentation. Radiology. (1997) 205:55–8. doi: 10.1148/radiology.205.1.9314962
51. Borges-Dias M, Carmo L, Lamas-Pinheiro R, Henriques-Coelho T, Estevão-Costa J. Trans-umbilical laparoscopic-assisted appendectomy in the pediatric population: comparing single-incision and 2-trocar techniques. Minim Invasive Ther Allied Technol. (2017) 27:160–3. doi: 10.1080/13645706.2017.1399279
Keywords: appendicitis, pediatrics, predictive medicine, machine learning, classification
Citation: Marcinkevics R, Reis Wolfertstetter P, Wellmann S, Knorr C and Vogt JE (2021) Using Machine Learning to Predict the Diagnosis, Management and Severity of Pediatric Appendicitis. Front. Pediatr. 9:662183. doi: 10.3389/fped.2021.662183
Received: 31 January 2021; Accepted: 01 April 2021;
Published: 29 April 2021.
Edited by:
Francesco Morini, Bambino Gesù Children Hospital (IRCCS), ItalyReviewed by:
José Estevão-Costa, Centro Hospitalar Universitário de São João (CHUSJ), PortugalCopyright © 2021 Marcinkevics, Reis Wolfertstetter, Wellmann, Knorr and Vogt. This is an open-access article distributed under the terms of the Creative Commons Attribution License (CC BY). The use, distribution or reproduction in other forums is permitted, provided the original author(s) and the copyright owner(s) are credited and that the original publication in this journal is cited, in accordance with accepted academic practice. No use, distribution or reproduction is permitted which does not comply with these terms.
*Correspondence: Patricia Reis Wolfertstetter, cGF0cmljaWEucmVpc3dvbGZlcnRzdGV0dGVyQGJhcm1oZXJ6aWdlLXJlZ2Vuc2J1cmcuZGU=
†These authors have contributed equally to this work and share first authorship
‡These authors have contributed equally to this work and share last authorship
Disclaimer: All claims expressed in this article are solely those of the authors and do not necessarily represent those of their affiliated organizations, or those of the publisher, the editors and the reviewers. Any product that may be evaluated in this article or claim that may be made by its manufacturer is not guaranteed or endorsed by the publisher.
Research integrity at Frontiers
Learn more about the work of our research integrity team to safeguard the quality of each article we publish.