 Zhongfan Liao
 Dashuang Luo
 Xiaoyan Tang
 Fasheng Huang
 Xuhui Zhang
94% of researchers rate our articles as excellent or good
Learn more about the work of our research integrity team to safeguard the quality of each article we publish.
Find out more
SYSTEMATIC REVIEW article
Front. Oncol., 10 March 2025
Sec. Gastrointestinal Cancers: Colorectal Cancer
Volume 15 - 2025 | https://doi.org/10.3389/fonc.2025.1550838
This article is part of the Research TopicRadiomics and artificial intelligence in oncology imagingView all 3 articles
Purpose: To evaluate the value of MRI-based radiomics for predicting pathological complete response (pCR) after neoadjuvant chemoradiotherapy (NCRT) in patients with locally advanced rectal cancer (LARC) through a systematic review and meta-analysis.
Methods: A systematic literature search was conducted in PubMed, Embase, Proquest, Cochrane Library, and Web of Science databases, covering studies up to July 1st, 2024, on the diagnostic accuracy of MRI radiomics for predicting pCR in LARC patients following NCRT. Two researchers independently evaluated and selected studies using the Quality Assessment of Diagnostic Accuracy Studies 2 (QUADAS-2) tool and the Radiomics Quality Score (RQS) tool. A random-effects model was employed to calculate the pooled sensitivity, specificity, and diagnostic odds ratio (DOR) for MRI radiomics in predicting pCR. Meta-regression and subgroup analyses were performed to explore potential sources of heterogeneity. Statistical analyses were performed using RevMan 5.4, Stata 17.0, and Meta-Disc 1.4.
Results: A total of 35 studies involving 9,696 LARC patients were included in this meta-analysis. The average RQS score of the included studies was 13.91 (range 9.00-24.00), accounting for 38.64% of the total score. According to QUADAS-2, there were risks of bias in patient selection and flow and timing domain, though the overall quality of the studies was acceptable. MRI-based radiomics showed no significant threshold effect in predicting pCR (Spearman correlation coefficient=0.119, P=0.498) but exhibited high heterogeneity (I2≥50%). The pooled sensitivity, specificity, positive likelihood ratio, negative likelihood ratio and DOR were 0.83, 0.82, 5.1, 0.23 and 27.22 respectively, with an area under the summary receiver operating characteristic (sROC) curve of 0.91. According to joint model analysis, publication year, country, multi-magnetic field strength, multi-MRI sequence, ROI structure, contour consistency, feature extraction software, and feature quantity after feature dimensionality reduction were potential sources of heterogeneity. Deeks’ funnel plot suggested no significant publication bias (P=0.69).
Conclusions: MRI-based radiomics demonstrates high efficacy for predicting pCR in LARC patients following NCRT, holding significant promise for informing clinical decision-making processes and advancing individualized treatment in rectal cancer patients.
Systematic review registration: https://www.crd.york.ac.uk/prospero/, identifier CRD42024611733.
The standard treatment for locally advanced rectal cancer (LARC) is neoadjuvant chemoradiotherapy (NCRT) combined with total mesorectal excision (TME). Study reported that approximately 15-27% of LARC patients exhibited no residual viable tumor cells upon pathological examination after NCRT, indicating a pathological complete response (pCR) (1). Some studies suggested a “watch and wait” strategy for patients achieving pCR, noting no significant differences in distant metastasis rate, disease-free survival, or overall survival compared to those who undergo surgery (2, 3). Therefore, some studies recommended preoperative evaluation for LARC patients after NCRT, allowing for a “watch and wait” approach for those who achieve pCR. This strategy can help avoid permanent stoma formation and postoperative complications, thereby improving patients’ quality of life (4, 5). Consequently, accurate preoperative prediction of pCR following NCRT can impact on clinical decision-making and enhance quality of life.
Imaging modalities are the mainstay of preoperative prediction of pCR. However, studies have shown that conventional imaging methods did not achieve ideal predictive results (6, 7). Currently, most studies focused on evaluating the efficacy of NCRT through radiomics, a machine learning approach that enables high-throughput extraction and quantitative analysis of numerous imaging features from radiographic images. Compared with the subjective analysis of conventional imaging, the advantage of radiomics lies in the ability to quantitatively analyze, identify, and reveal deep features within images that are difficult to discern with the naked eye, effectively overcoming the limitations of subjectivity in manual image recognition (8). The basic workflow of radiomics can be divided into five main steps: image acquisition, image segmentation, feature extraction and quantification, feature dimensionality reduction and selection, and model construction.
Magnetic resonance imaging (MRI) offers high-resolution imaging of soft tissues, enabling clear visualization of structures such as cancer nests and fibrosis in rectal cancer following NCRT. Numerous studies have employed MRI-based radiomics to predict whether LARC patients achieve pCR following NCRT. However, discrepancies remained among study outcomes, and there is a lack of latest research providing a comprehensive systematic review and meta-analysis of MRI-based radiomics for the prediction of pCR (9). This study aims to explore the predictive value of MRI-based radiomics for pCR by screening and evaluating relevant studies, thereby providing evidence-based guidance for clinical decision-making and prognostic management.
The Preferred Reporting Items for Systematic Reviews and Meta-Analyses of Diagnostic Test Accuracy Studies (PRISMA-DTA) guidelines were followed for conducting this systematic review (10). There was no systematic review relevant to the topic of this study that was identified in the Cochrane library.
● Population: LARC patients undergoing preoperative MRI examination, either before or after NCRT, with TRG confirmed by histopathology after TME.
● Intervention: Radiomics analysis was performed with preoperative MRI images of tumors, classifying NCRT response as pCR versus non-pCR.
● Comparison: The predictive performance of MRI-based radiomics in comparison to the pathological gold standard was evaluated.
● Outcome: The efficacy of MRI-based radiomics to predict pCR after NCRT in patients with LARC was evaluated through a diagnostic accuracy study design (e.g., ROC curve analysis).
A combination of MeSH terms and free text words was used for an online search in the PubMed, Embase, Proquest, Cochrane Library, and Web of Science databases, covering the period from database inception to July 1, 2024. Detailed search terms and strategies are provided in Supplementary Table S1. To avoid duplication and prevent omissions, the retrieved documents were cross-checked, and citation tracking was conducted.
Inclusion criteria: (1) studies involving diagnostic accuracy MRI radiomics; (2) all subjects were required to undergo preoperative rectal MRI; (3) the experimental group consisted of LARC patients achieving pCR after NCRT, while the control group included LARC patients with non-pCR after NCRT; (4) the gold standard for the diagnosis of pCR is postoperative histopathological biopsy; (5) sufficient data to directly extract or indirectly calculate the numbers of true positives (TP), false positives (FP), true negatives (TN), and false negatives (FN) cases.
Exclusion criteria: (1) non-diagnostic studies, including reviews, case reports, experimental studies, or conference abstracts; (2) duplicate publications; (3) studies with inaccessible full text or incomplete data; (4) studies with a sample size of 20 or fewer cases; (5) studies with a RQS score below 5.
Initially, two researchers (each with over three years of experience in radiomics analysis) independently screened the titles and abstracts of the retrieved articles, excluding irrelevant studies. Each excluded study was re-evaluated by the different researcher. Subsequently, relevant studies were included in this systematic review after a careful and thorough full-text review.
Data extraction was conducted for the included studies, including general data and detailed radiomics data. General data included: (1) first author, (2) publication year, (3) publication country, (4) study type, (5) sample size, (6) average age, (7) chemoradiotherapy regimen, (8) imaging acquisition timing, (9) MRI field strength, sequence, and slice thickness, and (10) 2x2 table (TP, FP, TN, FN). Detailed radiomics data included: (1) ROI delineation software, method, and structure, (2) ROI contour consistency assessment, (3) feature extraction software, (4) feature types, (5) feature quantity after feature dimensionality reduction, (6) normalization methods, (7) feature dimensionality reduction and selection methods, (8) modeling algorithms, (9) model validations, and (10) optimal predictive model with AUC. In case of discrepancies, the decision will be referred to a senior researcher (with over ten years of experience in systematic review) for adjudicating, or consensus will be reached through consultation. When multiple modeling algorithms were applied to the same sample in a study, the model with the best classification performance was considered the optimal predictive model. If the optimal predictive model in a study was developed using data beyond MRI alone (such as PET-CT, ultrasound, pathological features, or clinical features), only data based on MRI and clinical features were extracted.
The quality of the included studies was evaluated using the Quality Assessment of Diagnostic Accuracy Studies 2 (QUADAS-2) tool, specifically including patient selection, index test, reference standard, and flow and timing (11). If any item within a section was answered as “No”, it was rated as “high risk of bias”, which indicated potential methodological flaws that could impact diagnostic accuracy. If all items in a section were answered as “Yes”, it was rated as “low risk of bias”, which indicated that the study followed a sound methodological design unlikely to introduce bias. If the content reported was difficult to evaluate, it was rated as “unclear”, indicating insufficient information to judge the risk of bias. Supplementary Table S2 provided detailed scoring criteria for each QUADAS-2 item.
The rigor and reproducibility of the included studies were assessed using the Radiomics Quality Score (RQS) proposed by Lambin (12). The RQS provides a meticulous assessment of 16 aspects across five key steps in the radiomics analysis, including data selection, medical imaging, feature extraction, exploratory analysis, and modeling. RQS both rewards and penalizes the methodology and statistical analysis of research, thereby promoting best scientific practices. The total score is 36, representing a 100% RQS score. Two researchers independently assessed the RQS score of each study, with disagreements resolved through consensus. Supplementary Table S3 showed detailed scoring criteria for each RQS item.
Review Manager (Cochrane; version 5.4) software was used to perform methodological quality assessment with built-in QUADAS-2 tool and to plot the risk of bias and applicability graphs. Meta-Disc (XI Cochrane Colloquium, Barcelona, Spain; version 1.4) software was used to calculate the Spearman correlation coefficient between the logit of sensitivity and the logit of 1-specificity. Summary receiver operator characteristic (sROC) curve was plotted to assess threshold effects in the pooled results. A Spearman correlation coefficient with P < 0.05 or a “shoulder arm” shape in the sROC curve scatters distribution indicated a threshold effect. If there was no threshold effect, heterogeneity among studies was analyzed using the inconsistency index (I2) and Cochrane Q test. When I2 > 50% and P < 0.05, which indicated the presence of heterogeneity, a random effects model was applied to analyze sampling error and variance across studies, and potential sources of heterogeneity should be explored. When I2 < 50% or P > 0.05, which indicated lack of heterogeneity, a fixed effects model should be used, which assumed that all effect sizes come from a single population and differences are due to chance.
In this study, a random effects model was applied, and the pooled effect sizes were calculated using Meta-Disc software, including sensitivity, specificity, positive likelihood ratio, negative likelihood ratio, diagnostic odds ratio (DOR), and area under the sROC curve (AUC). All analyses were conducted on the validation or test cohorts. Forest plots and sROC curves were plotted to visually display pooled effect sizes results. To further investigate the sources of heterogeneity, the MIDAS module in Stata (Stata Corporation, College Station, TX, USA; version 17.0) was used for meta-regression and subgroup analyses, which incorporated covariates into a dichotomy model to assess the impact of various factors on the predictive performance. The following factors were considered as potential sources of heterogeneity: publication year (≥2021 vs. <2021), publication country (China vs. other), multicenter study (yes vs. no), sample size (≥200 vs. <200), post-NCRT features (whether post-NCRT MRI images were included), multi-MRI field strength (whether multiple field strengths were used), multi-MRI sequence (whether multiple sequences were used), ROI structure (2D vs. 3D), contour consistency (whether ROI delineation consistency was evaluated), feature extraction software (Pyradiomics vs. others), feature quantity after feature dimensionality reduction (≥10 vs. <10), multi-modeling algorithm (whether multiple methods were used for model construction), model validation (external validation vs. others), radiomics type (deep learning-based vs. machine learning-based), and RQS score (≥14 vs. <14).
Deeks’ asymmetry test was used to assess statistical significance, and potential publication bias was evaluated by plotting Deeks’ funnel plot. The trim-and-fill method was used to calculate the publication bias when a significant publication bias was found. Fagan plot was used to assess the clinical utility of MRI-based radiomics for predicting pCR in LARC patients after NCRT. All P-values under 0.05 were considered statistically significant.
A total of 735 studies were retrieved through online search of PubMed, Embase, Proquest, Cochrane Library, and Web of Science databases, with an additional 45 articles identified through reference tracing. Detailed search results were shown in Supplementary Table S1. Following the removal of 282 duplicate studies, the titles and abstracts of the remaining articles were screened, and 325 articles were excluded. Subsequently, 122 articles were excluded for not meeting eligibility criteria. Eleven articles were excluded due to the inability to construct a 2x2 table, and five articles were excluded due to low RQS scores. Ultimately, 35 articles were included in this systematic review for analyses (13–47). The literature selection process is shown in Figure 1.
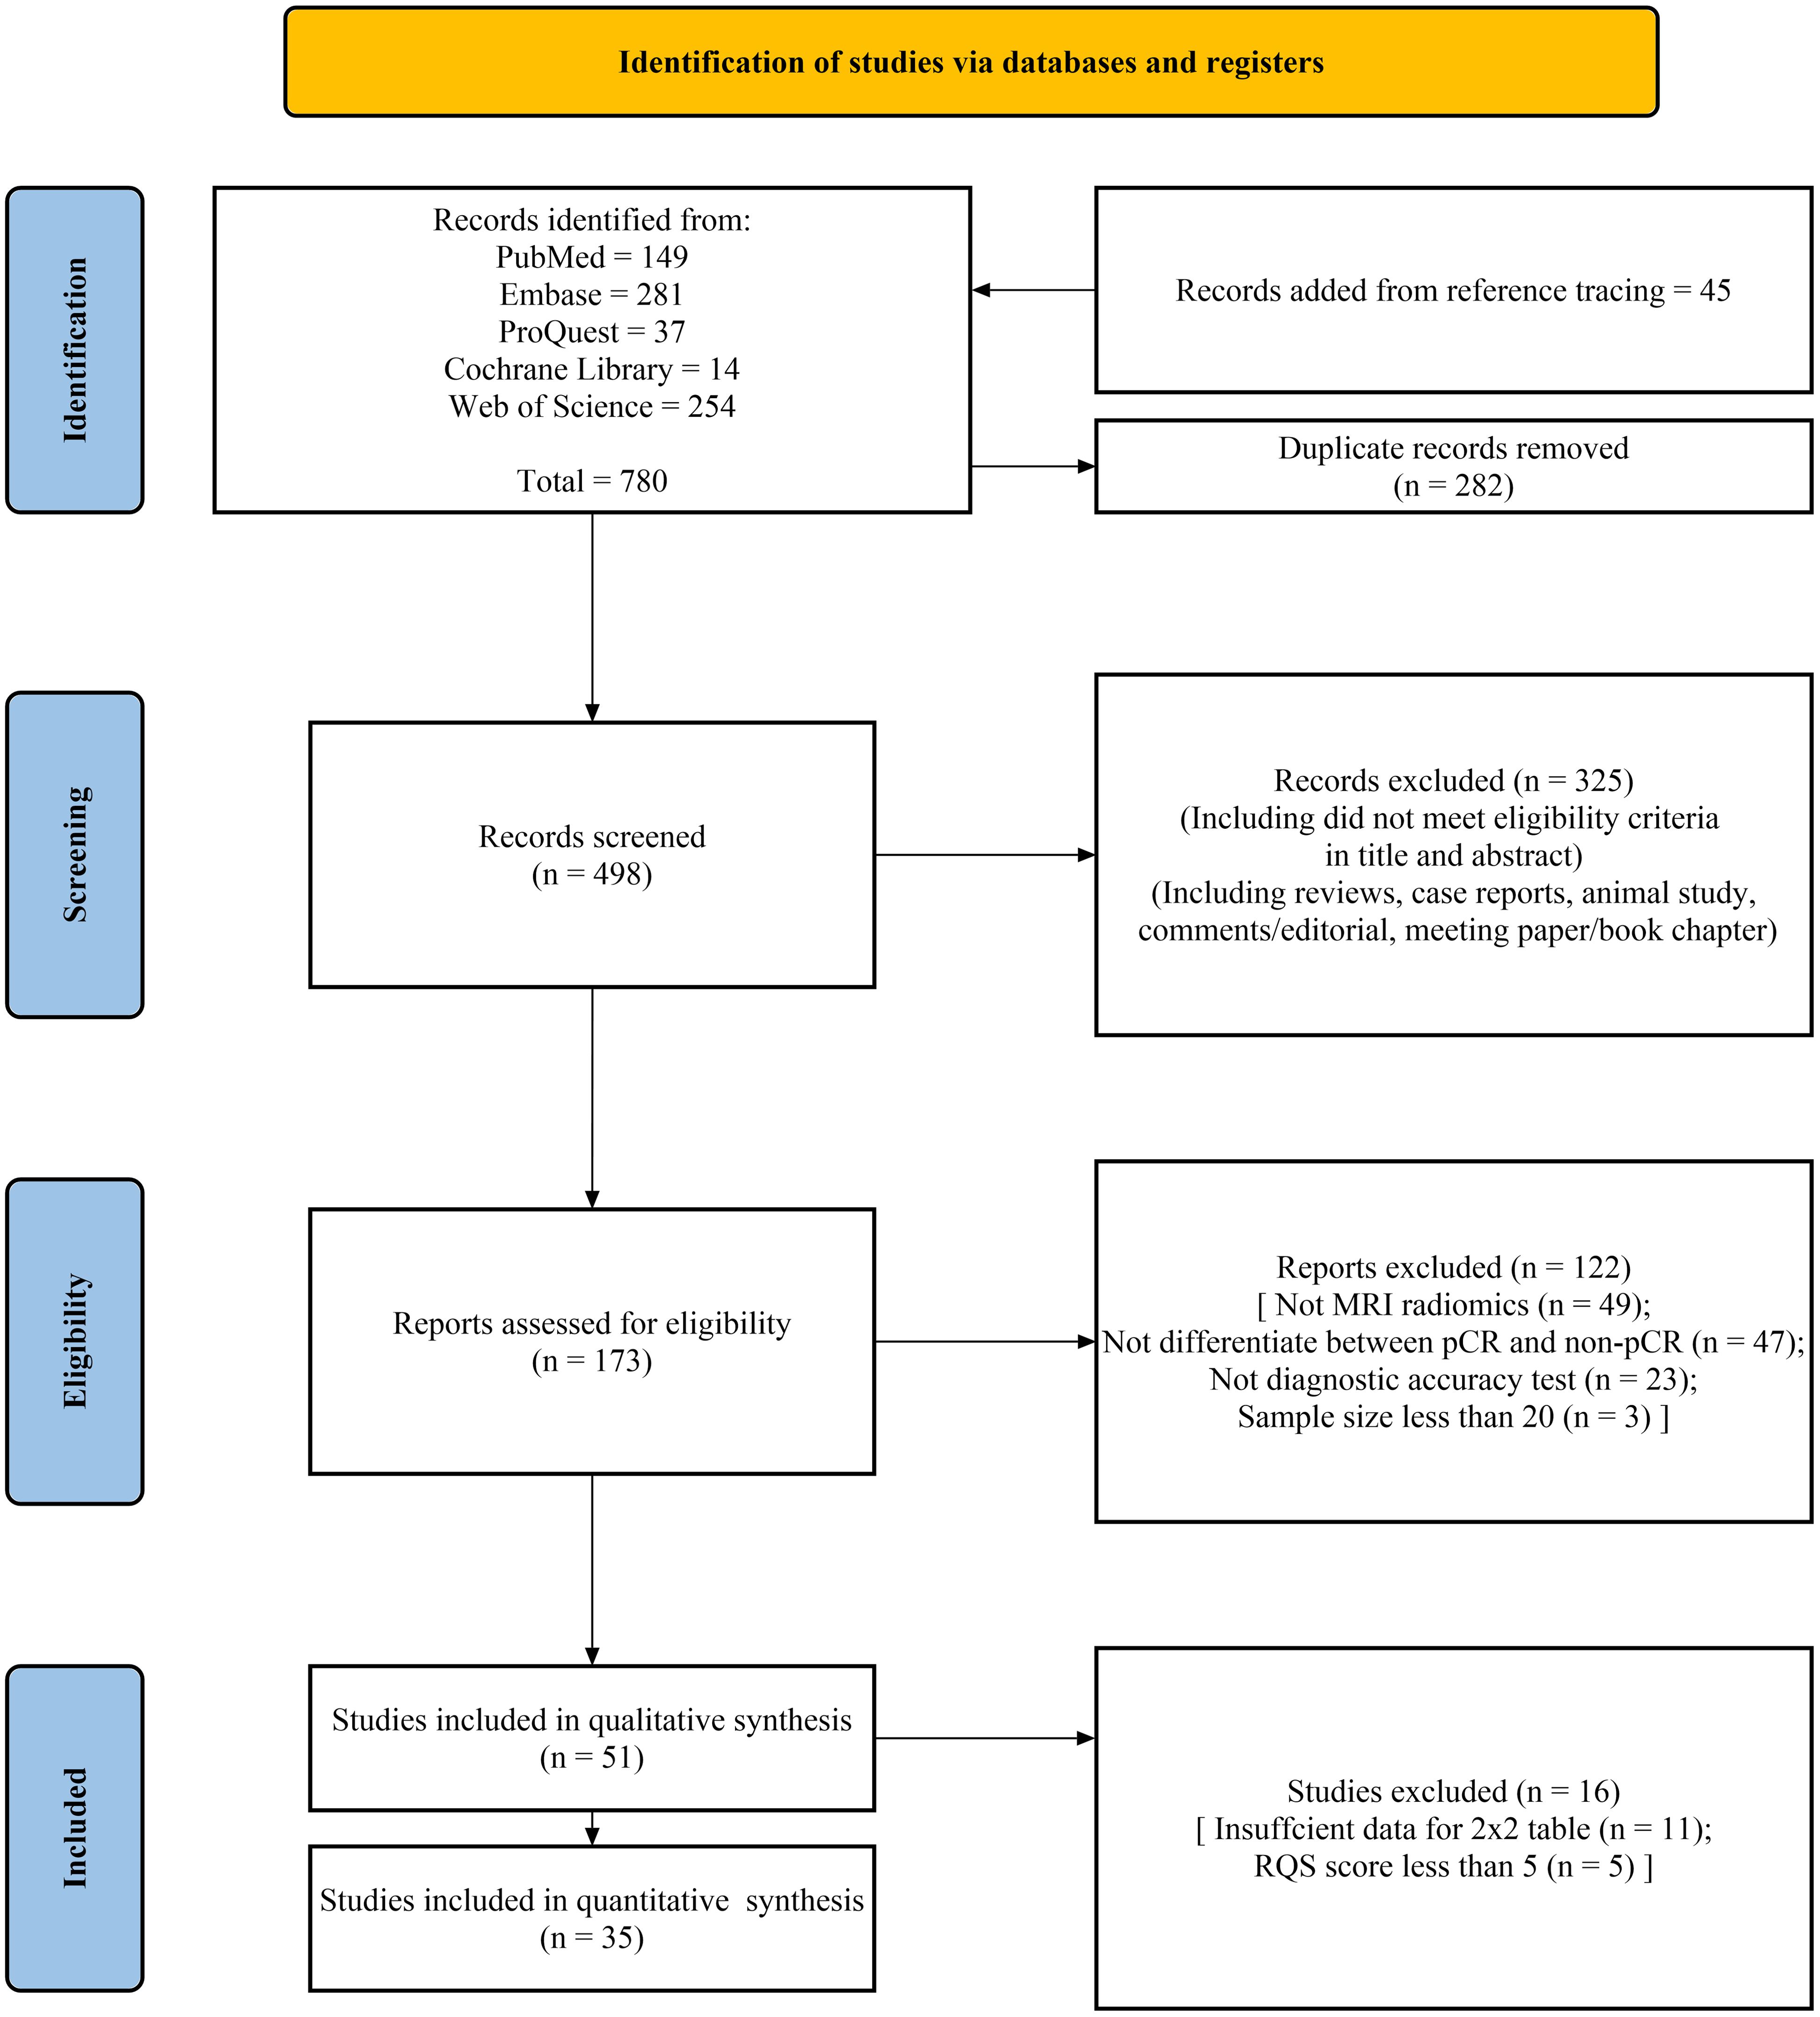
Figure 1. PRISMA flow chart of the study selection procedure for this systematic review and meta-analysis.
Table 1 showed the general characteristics of the studies included in the systematic review. The 35 studies, published between 2017 and 2024, included a total of 9,696 patients, with sample sizes ranging from 38 to 1,033. Among them, 2,102 cases were pCR patients, and 7,594 were non-pCR patients. The training sets included 5,822 cases, and the validation sets included 3,874 cases. The overall average age was 58.6 years, with a range from 50.5 to 70 years. Approximately 69% of studies (24/35) were published in 2021 or later. About 57% of studies were conducted in China (13, 15, 17, 19, 22–26, 28, 30, 33, 37, 40–45, 47) (20/35), five in the United States (18, 20, 32, 35, 38), four in Italy (16, 31, 36, 39), three in South Korea (27, 29, 34), and one each in Belgium, Brazil, and Turkey (14, 21, 46). Approximately 54% of studies were monocentric studies (19/35), 10 studies included data from two centers, four studies included data from three centers, and two studies included data from four centers. Most studies (approximately 83%) were retrospective, with three studies being prospective. Additionally, three studies conducted both retrospective model construction and validation, as well as prospective validation of the predictive performance of models. The magnetic field strength of scanners was 3.0T in 16 studies, accounting for about 46% (16/35), 1.5T in 5 studies, a combination of both in 12 studies, with one study using 1.5T and 1.0T and not reporting in one study. T2-weighted imaging (T2WI) and diffusion weighted imaging (DWI) were commonly used MRI sequences, accounting for 94% and 57%, respectively. Two studies used diffusion kurtosis imaging (DKI). The above imaging sequences were also often used simultaneously. Slice thicknesses of 3.0mm, 4.0mm, and 5.0mm were the most commonly used, accounting for 80%. Seventeen studies (about 49%) used pre-NCRT MRI images to predict pCR, four studies used images acquired after NCRT, and 13 studies used both pre- and post- NCRT images. Notably, one study used MRI images taken before, during, and after NCRT. Six studies utilized deep learning-based radiomics for analysis. The 2x2 table for the included studies were shown in Supplementary Table S4.
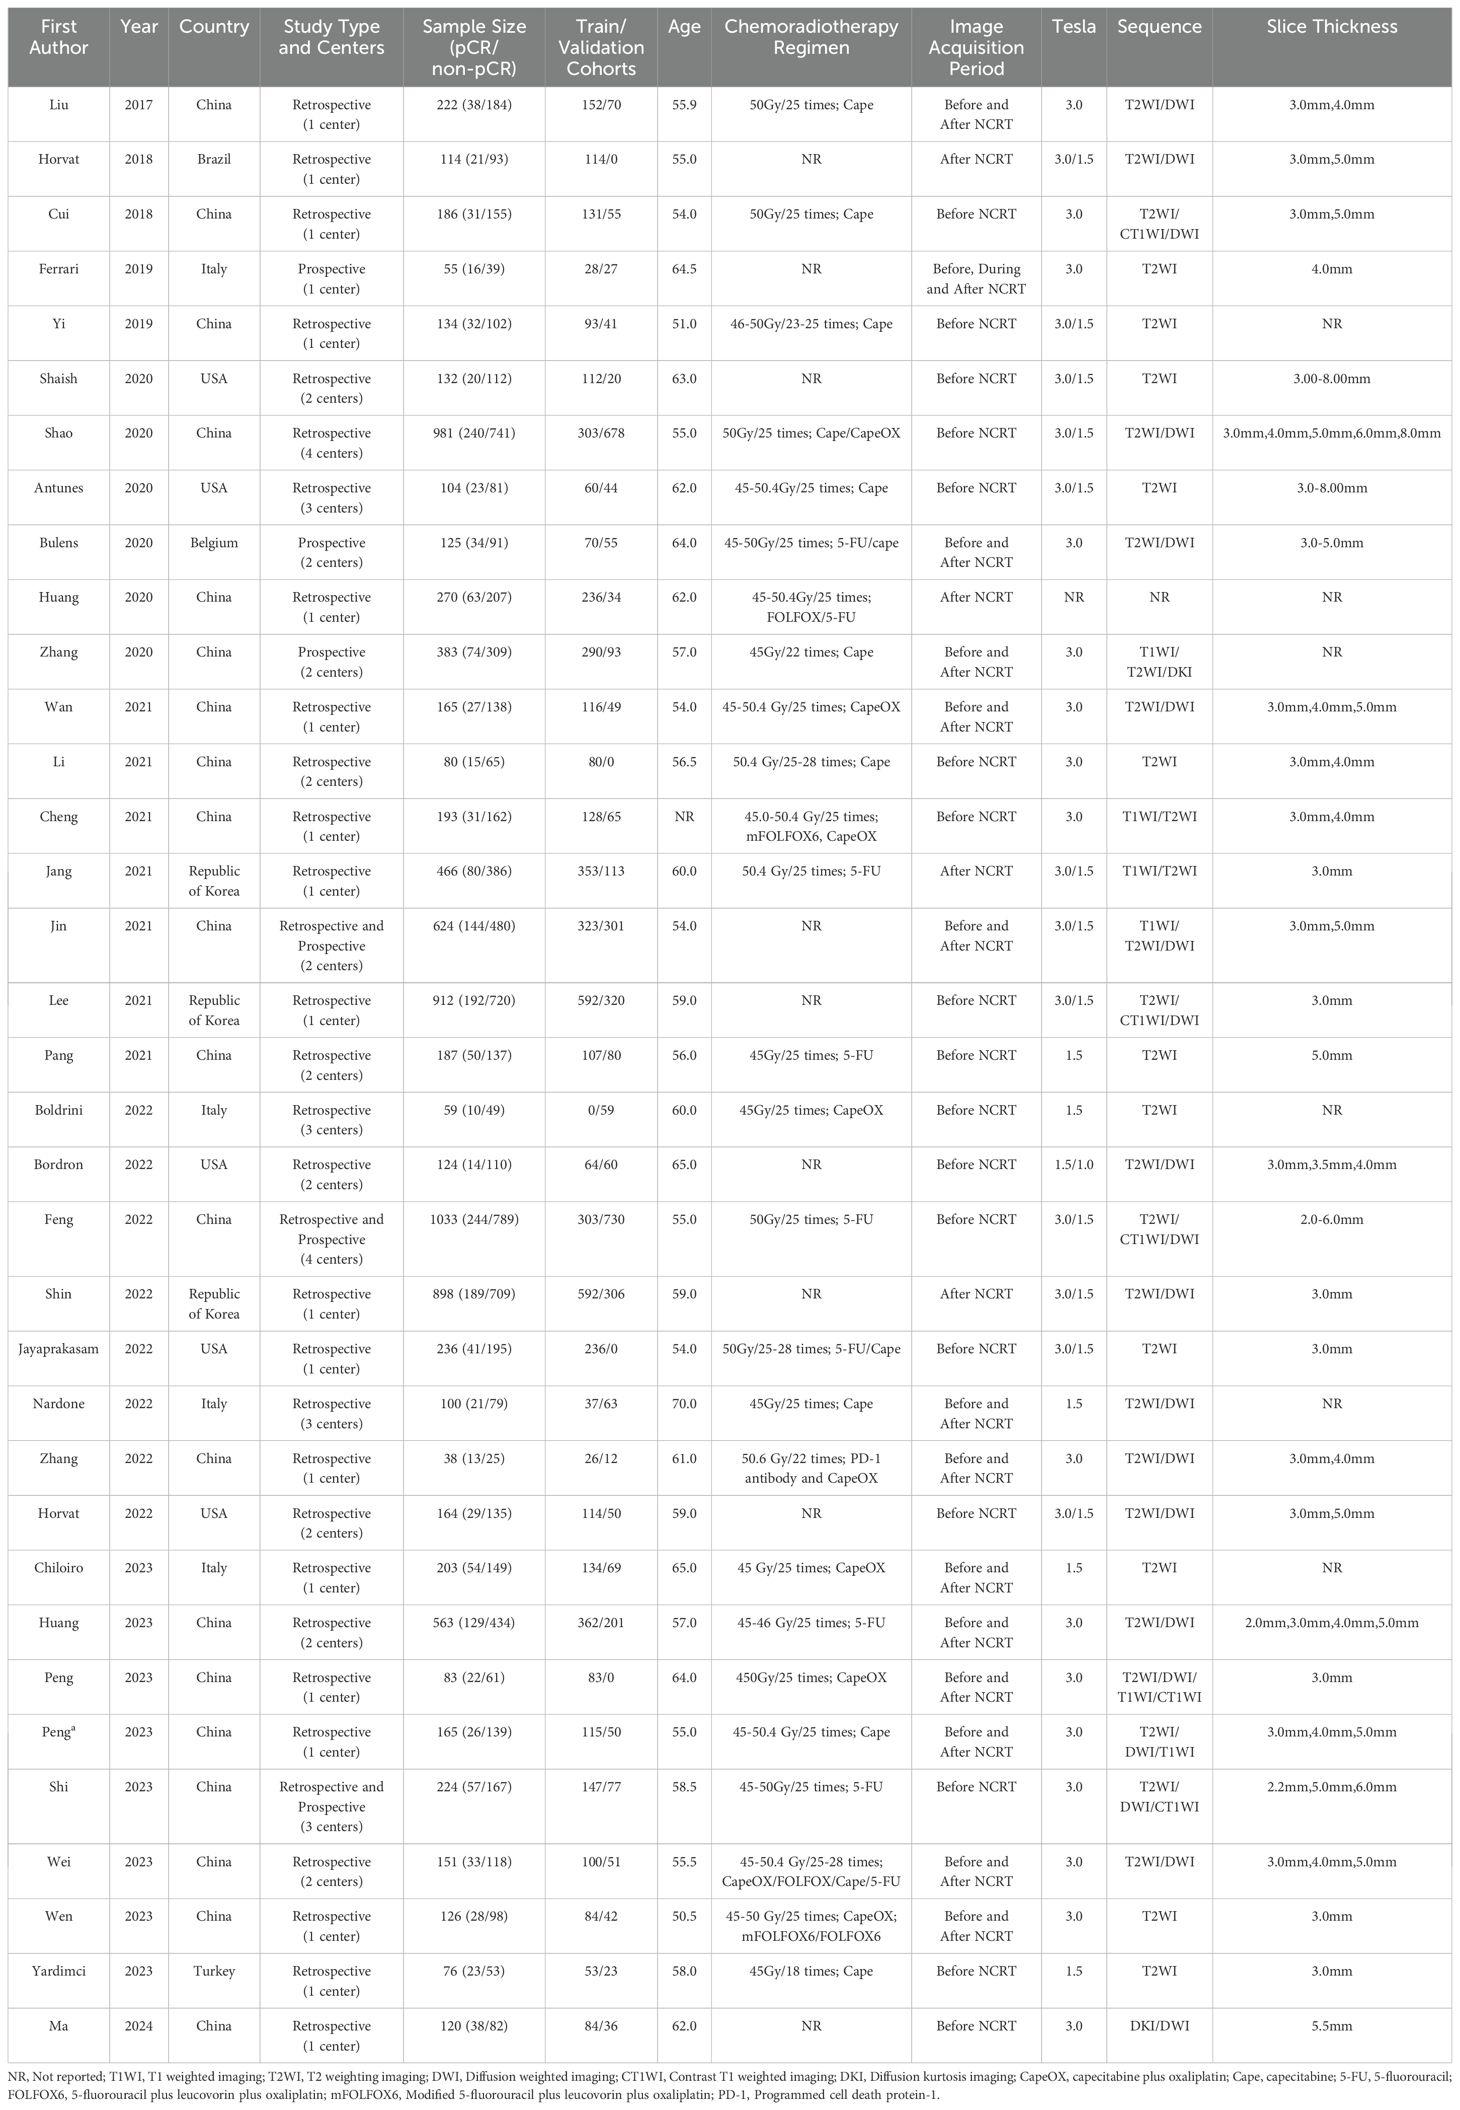
Table 1. The general characteristic of included studies.
Detailed radiomics characteristics of the included studies were mentioned in Table 2. Eleven studies used ITK-SNAP software for radiomic feature extraction, and 7 used 3D Slicer. Approximately 77% of studies manual delineated the region of interest (ROI) (27/35), followed by automated (1/35) and semi-automated (2/35) delineation, with 3 studies not reporting and 2 not applicable. The ROI structure was 3D in 20 studies, 2D in 14 studies, and unspecified in 1 study. Most of studies (approximately 63%) conducted contour consistency assessments for ROI delineation. Pyradiomics was the most commonly used feature extraction software (14/35), followed by MATLAB (6/35). The vast majority of studies (29/35) extracted texture features, with first-order statistics (27/35), shape features (19/35), and wavelet features (11/35) also frequently extracted. In 24 studies, the number of features decreased by more than 90% after dimensionality reduction. Ten studies used the Z-score method for feature normalization, while 18 studies did not report the method. About 40% of the studies used least absolute shrinkage and selection operator (LASSO) for feature dimensionality reduction and selection (14/35). Similarly, logistic regression (LR) was the most commonly used algorithm for model construction (15/35), followed by support vector machine (SVM) (11/35), random forest (RF) (10/35), and neural networks (8/35). About 40% of studies performed external validation (14/35), followed by split sample (13/35) and cross-validation (11/35).
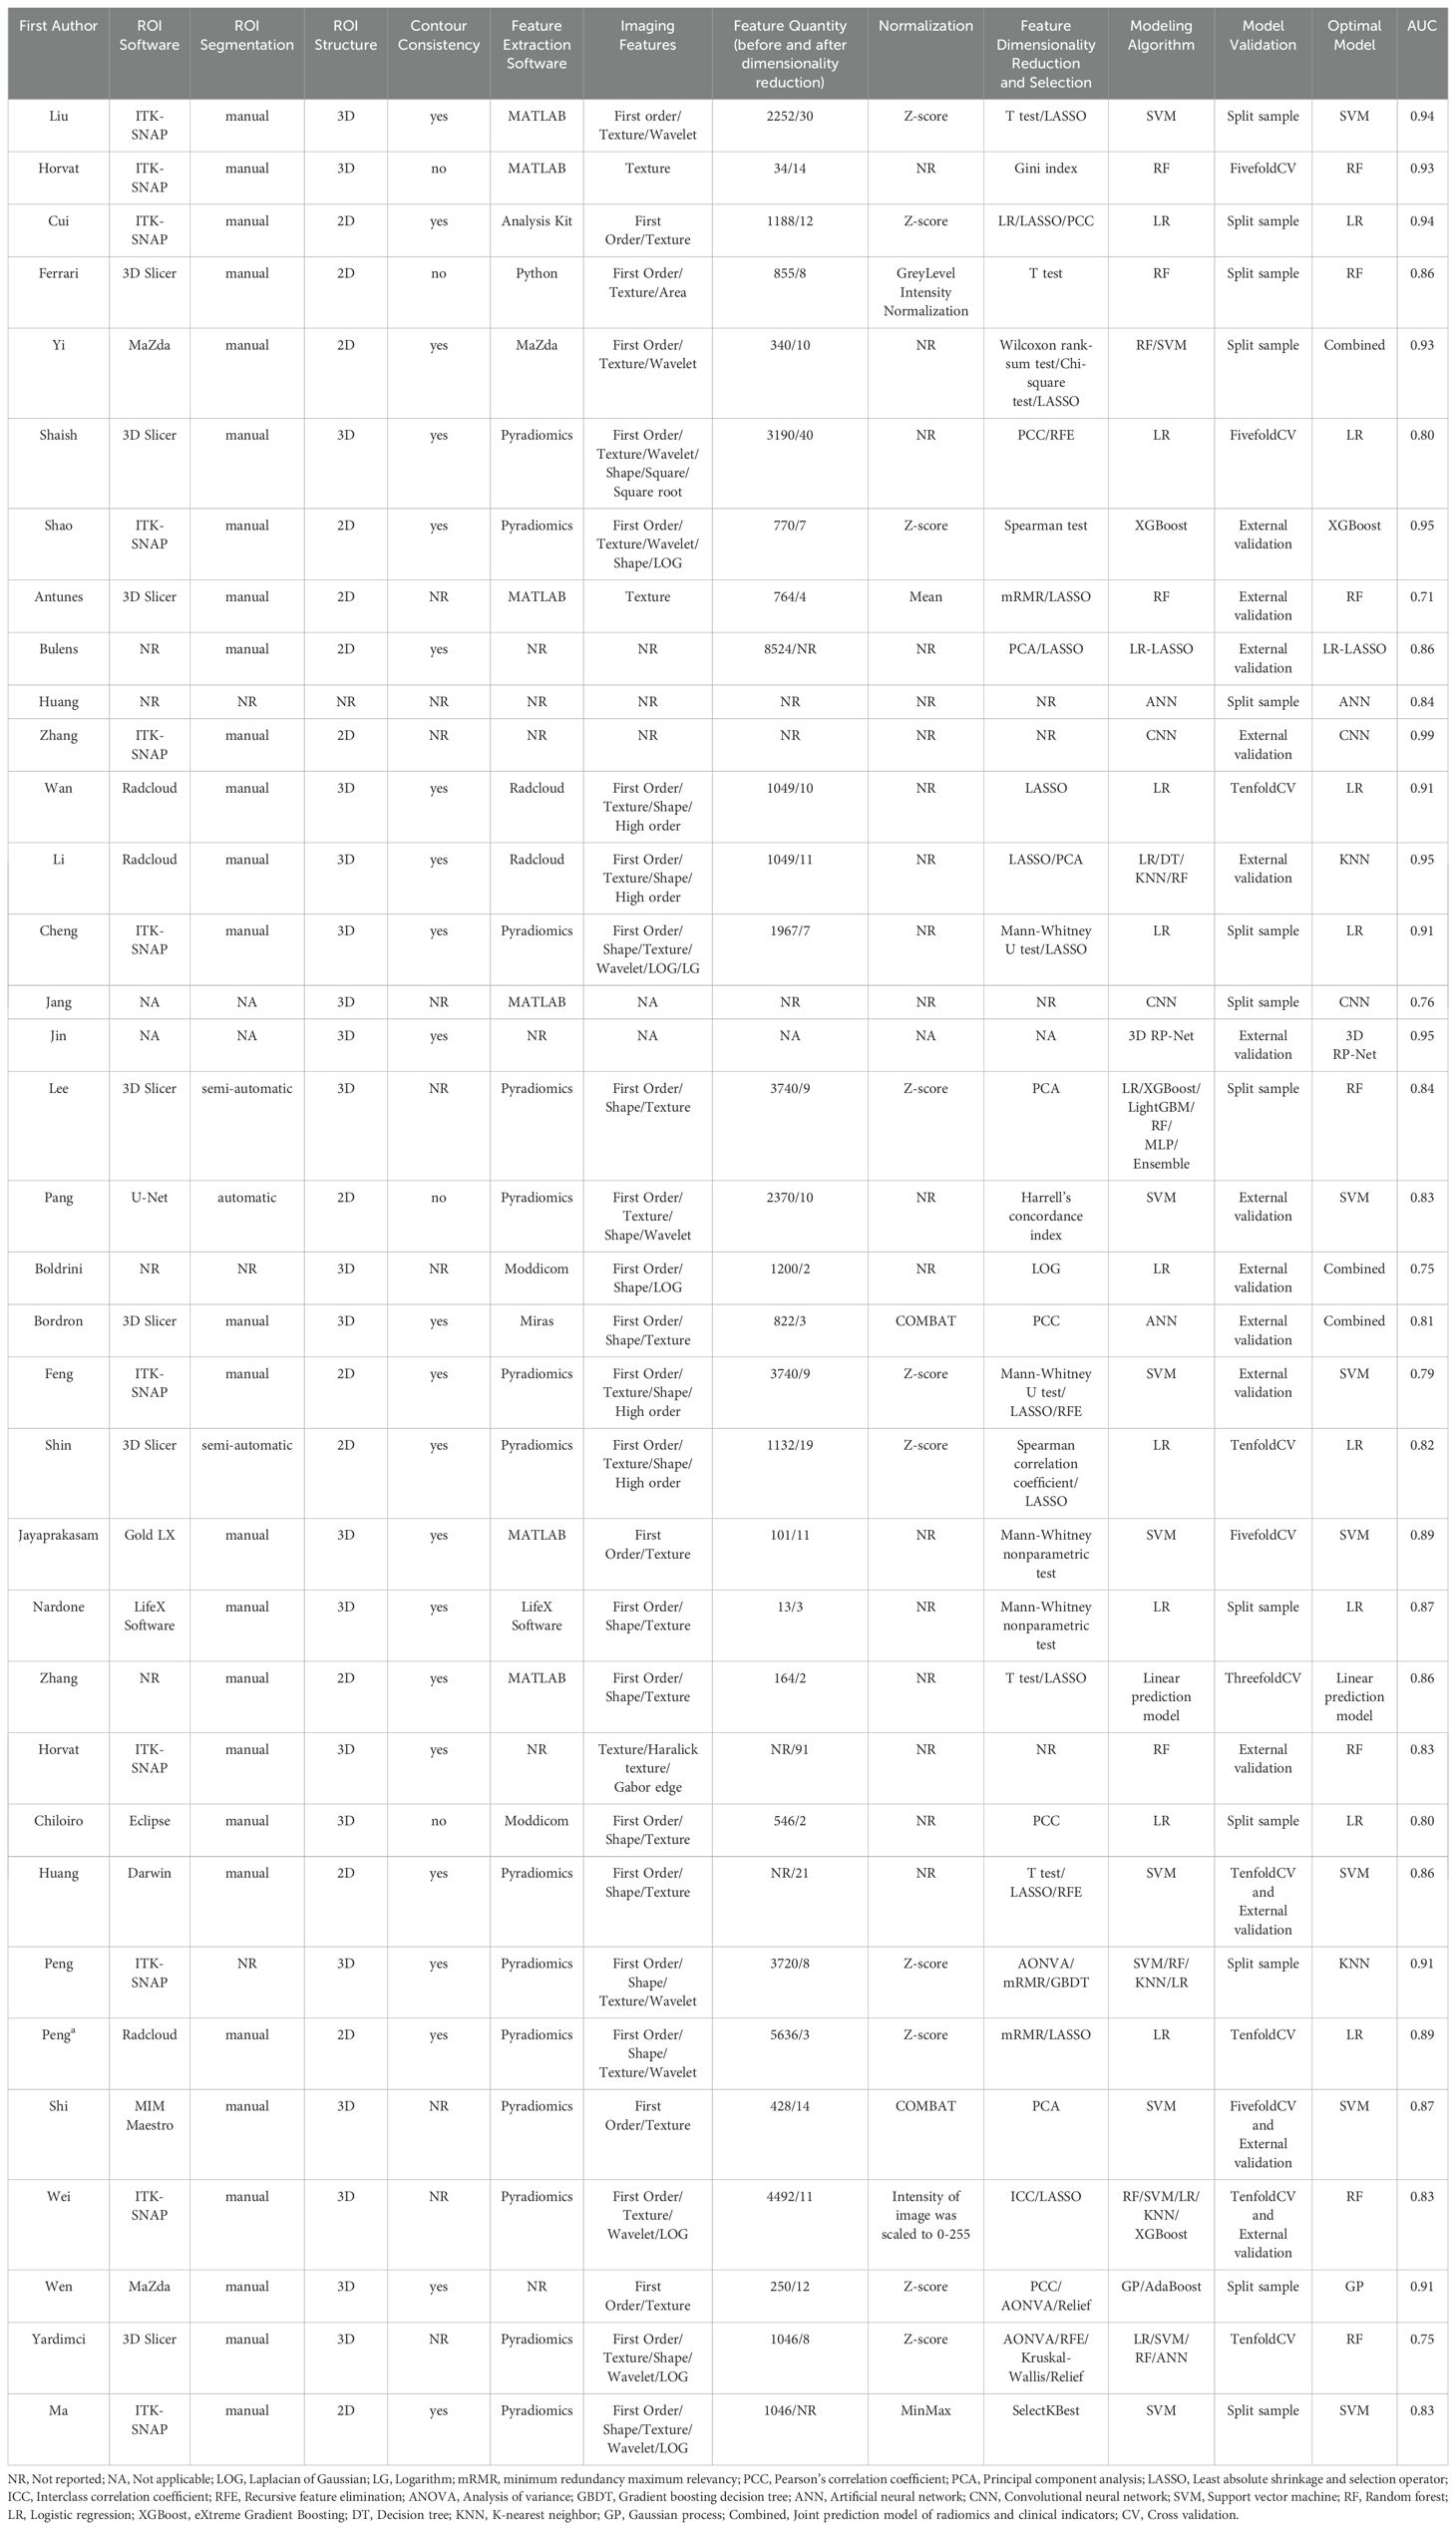
Table 2. Detailed radiomics characteristic of included studies.
According to QUADAS-2, the risk of bias and applicability concerns for the included studies were shown in Figure 2. In the patient selection domain, the overall risk of bias was relatively low (<25%). Only a few studies showed a high risk of bias due to not specifying the timeframe for case inclusion or difficulty in determining whether the study was case-controlled (Figure 2a). Additionally, the applicability concerns in this domain were generally low (Figure 2b). Two studies did not explicitly specify the severity of rectal cancer in patients, and four studies lacked relevant research background or relatively intact demographic characteristics. Similarly, the overall risk of bias in the index test domain was less than 25%, although 1 study owned a high risk of bias due to not using a predefined threshold. Three studies did not report whether the index test was conducted with blinding, leading to some applicability concerns in this domain. Since the treatment efficacy of NCRT for all study subjects included was confirmed through postoperative histopathological biopsy, the risk of bias in the reference standard domain was relatively low. Furthermore, postoperative histopathological biopsy is considered as the gold standard for determining pCR (1), resulting in low applicability concerns in this domain. Two studies did not specify the time interval between MRI examinations and the reference standard. However, the overall risk of bias in the flow and timing domain was low, as all cases in the included studies were subject to radiomics analysis. Detailed quality assessment results were shown in Supplementary Table S5. Taken together, the quality of the articles included was acceptable according to the QUADAS-2 assessment.
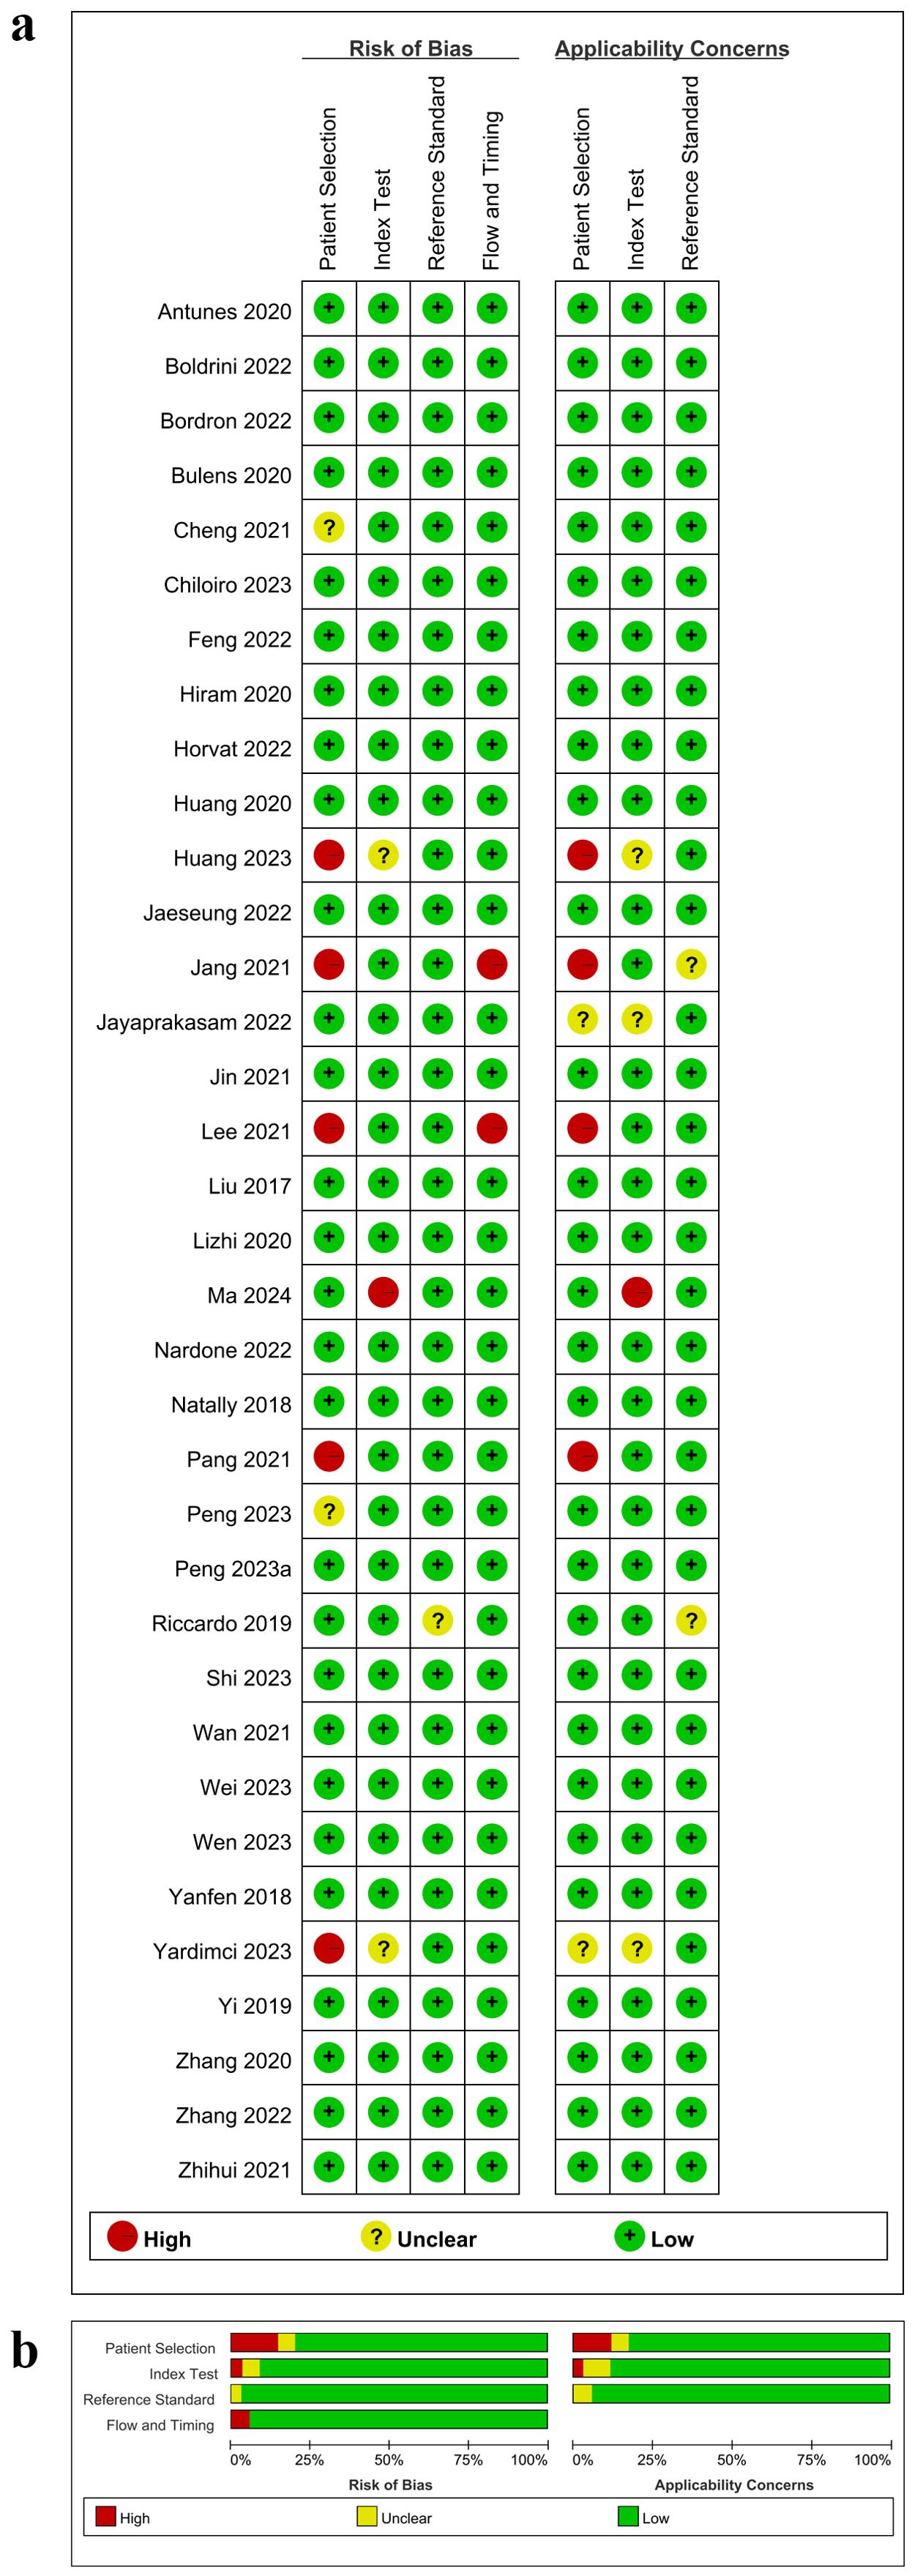
Figure 2. Risk of bias and applicability concerns according to Quality Assessment of Diagnostic Accuracy Studies-2 tool. (a) Per study assessment; (b) Per domain summary.
The average RQS score of 35 included studies was 13.91, approximately 38.64% of the total score. The median score was 13, with a range from 9 (25%) to 24 (67%). Over half of the studies (about 51%) scored between 30% and 40% (Figure 3). All included studies conducted “Feature reduction or adjustment for multiple testing”, “Discrimination statistics”, “Validation” and “Open science and data” items. Additionally, 75% and over 86% of studies conducted “Multiple segmentations” and “Well-documented image protocols” items respectively. Approximately 58% of studies performed multivariable analysis, incorporating non-radiomics features, which is expected to provide a more holistic model. About 44% of studies reported potential clinical utility and provided clinical decision curves. Only one study conducted a cost-effectiveness analysis for the clinical application of the model. Only five studies registered prospective cohort studies in trial databases, providing the highest level of evidence supporting the clinical validity and usefulness of the radiomics biomarker. Only three studies conducted phantom studies, which help detect inter-scanner differences and vendor-dependent features. Detailed RQS scores for all included studies were provided in Supplementary Table S6.
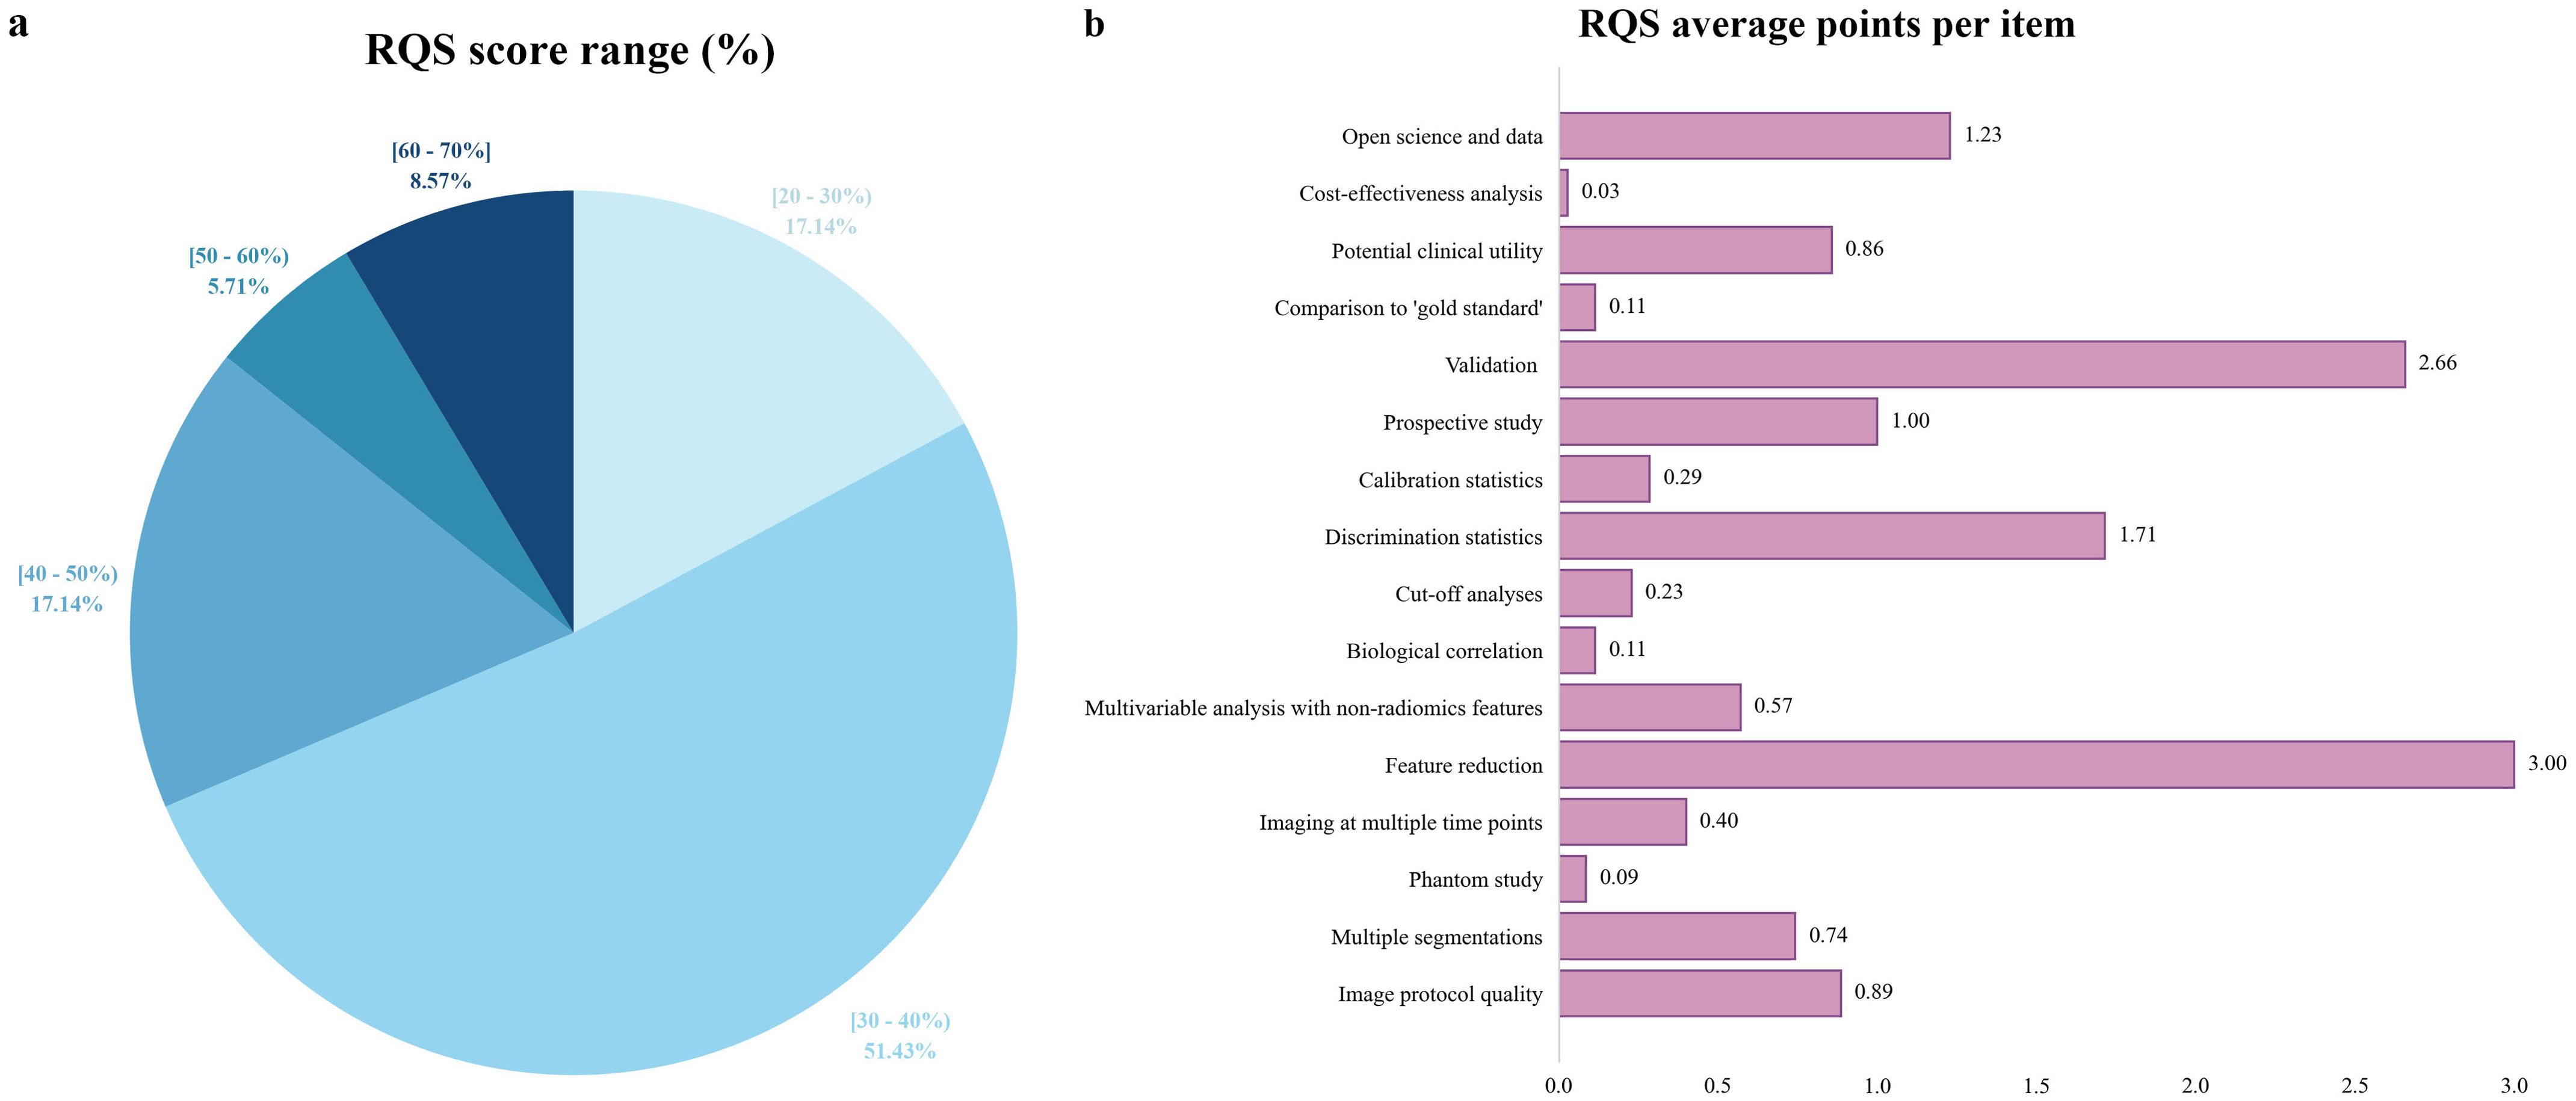
Figure 3. Methodological quality assessment based on the RQS tool. (a) Proportion of studies per different RQS range percentages. (b) Average points per each RQS item. RQS, radiomics quality score.
The threshold effect across studies was examined by calculating the Spearman correlation coefficient between the logit of sensitivity and logit of 1-specificity. The results showed a Spearman correlation coefficient of 0.119 (P = 0.498), with the scatter points corresponding to the included studies distributing in a non- “shoulder arm” pattern on the sROC curve, indicating no significant threshold effect. The I2 statistic indicated significant heterogeneity in sensitivity (I2 = 78.5%, P < 0.001) and specificity (I2 = 92.1%, P < 0.001) across the study cohorts.
A total of 35 studies were included in this meta-analysis, and only the validation or test cohorts with superior predictive performance were evaluated. The pooled sensitivity, specificity, positive likelihood ratio, negative likelihood ratio and DOR were 0.83 (95% CI: 0.80-0.84), 0.82 (95% CI: 0.81-0.83), 5.10 (95% CI: 3.92-6.63), 0.23 (95% CI: 0.17-0.31), and 27.22 (95% CI: 16.92-43.79), respectively. The AUC was 0.91. The forest plots and sROC curve for the pooled effect sizes were shown in Figure 4.
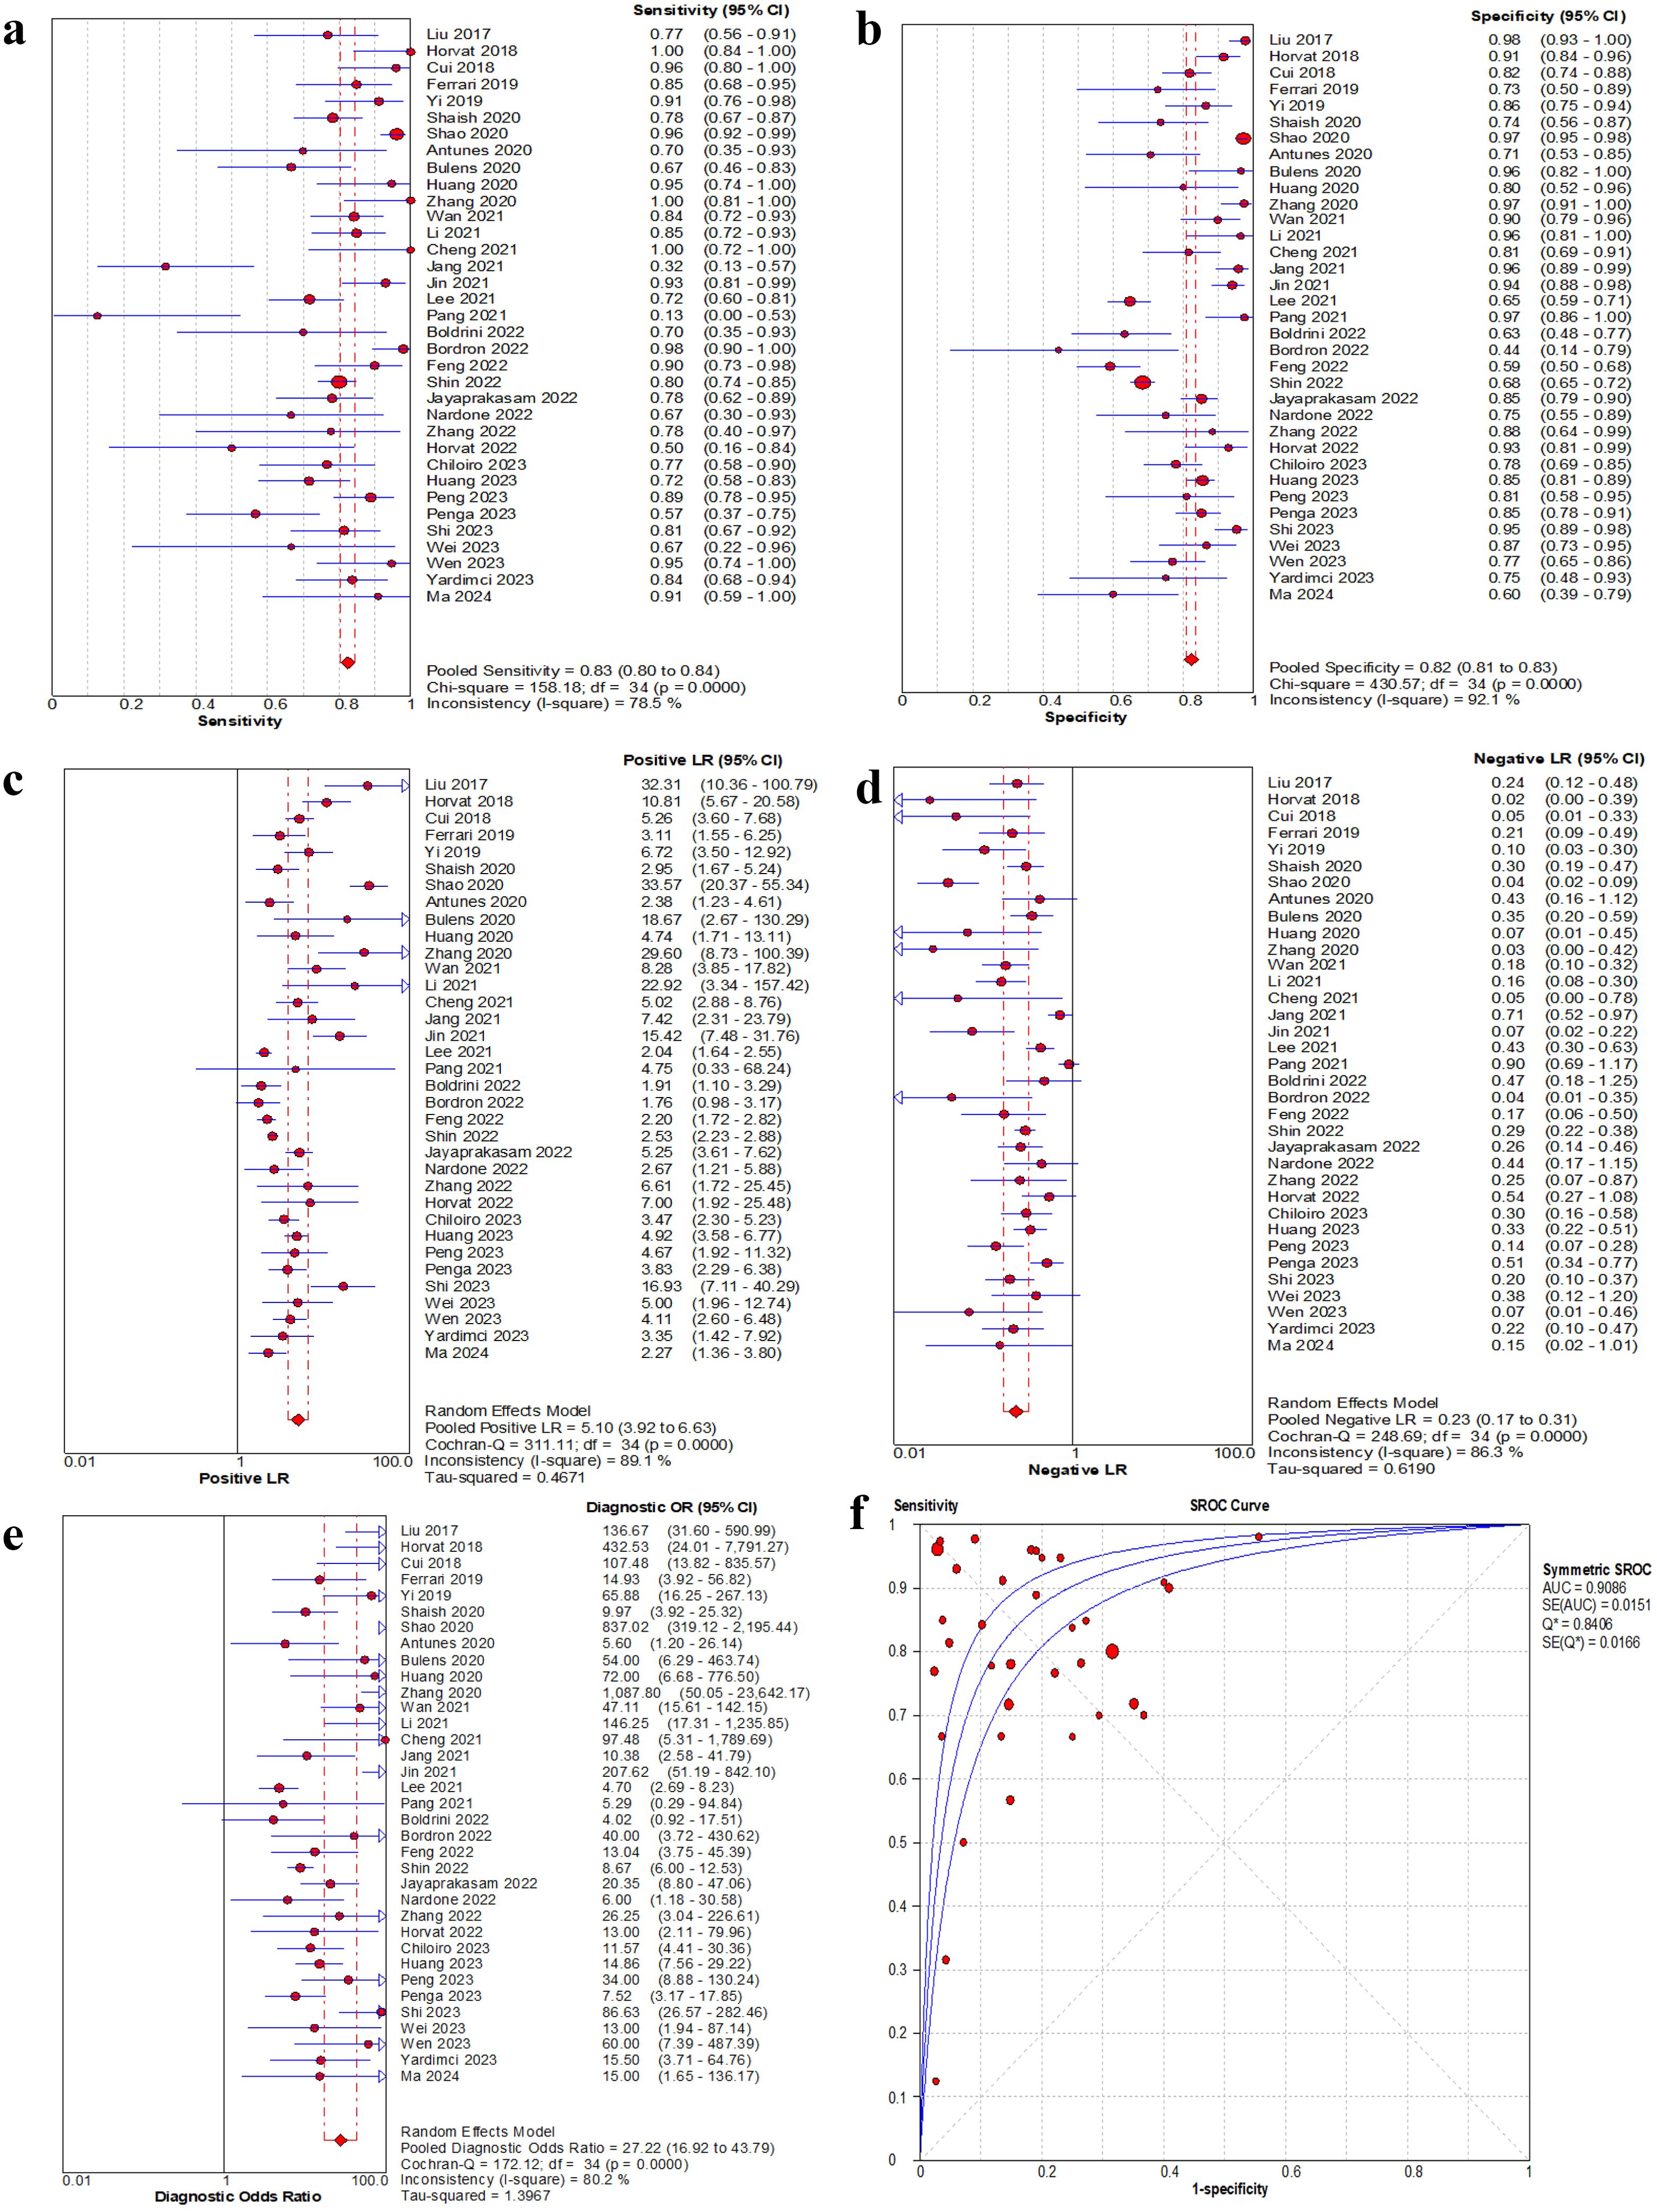
Figure 4. Forest plot of sensitivity, specificity, positive LR, negative LR and DOR, and sROC curve of MRI-based radiomics for prediction of pathological complete response. (a) Sensitivity for MRI. (b) Specificity for MRI. (c) Positive LR for MRI. (d) Negative LR for MRI. (e) DOR for MRI. (f) The sROC plane for heterogeneity test of threshold effect of each independent study. Corresponding indices, 95% CI and the pooled indices are represented by red circles, horizontal lines and red diamonds, respectively. The sROC (middle line) with 95% CI (the other two lines). LR, likelihood ratio; DOR, diagnostic odds ratio; sROC, summary receiver operator characteristic; AUC, area under the curve; Q*, Q index value; SE, standard error; CI, confidence interval.
As shown in Table 3, 15 covariates were used to explore potential sources of heterogeneity. Meta-regression and joint model analysis indicated the following factors as contributors to significant heterogeneity in the meta-analysis: publication year (≥ 2021 vs. < 2021) (P = 0.02), publication country (China vs. others) (P = 0.01), multi-magnetic field strength (multi-Telsa vs. mono-Telsa) (P = 0.02), multi-MRI sequence (multi-sequence vs. mono-sequence) (P = 0.01), ROI structure (3D vs. 2D) (P = 0.02), contour consistency (evaluated vs. unevaluated) (P < 0.001), feature extraction software (Pyradiomics vs. others) (P < 0.001), and feature quantity after feature dimensionality reduction (≥ 10 vs. <10) (P < 0.001).
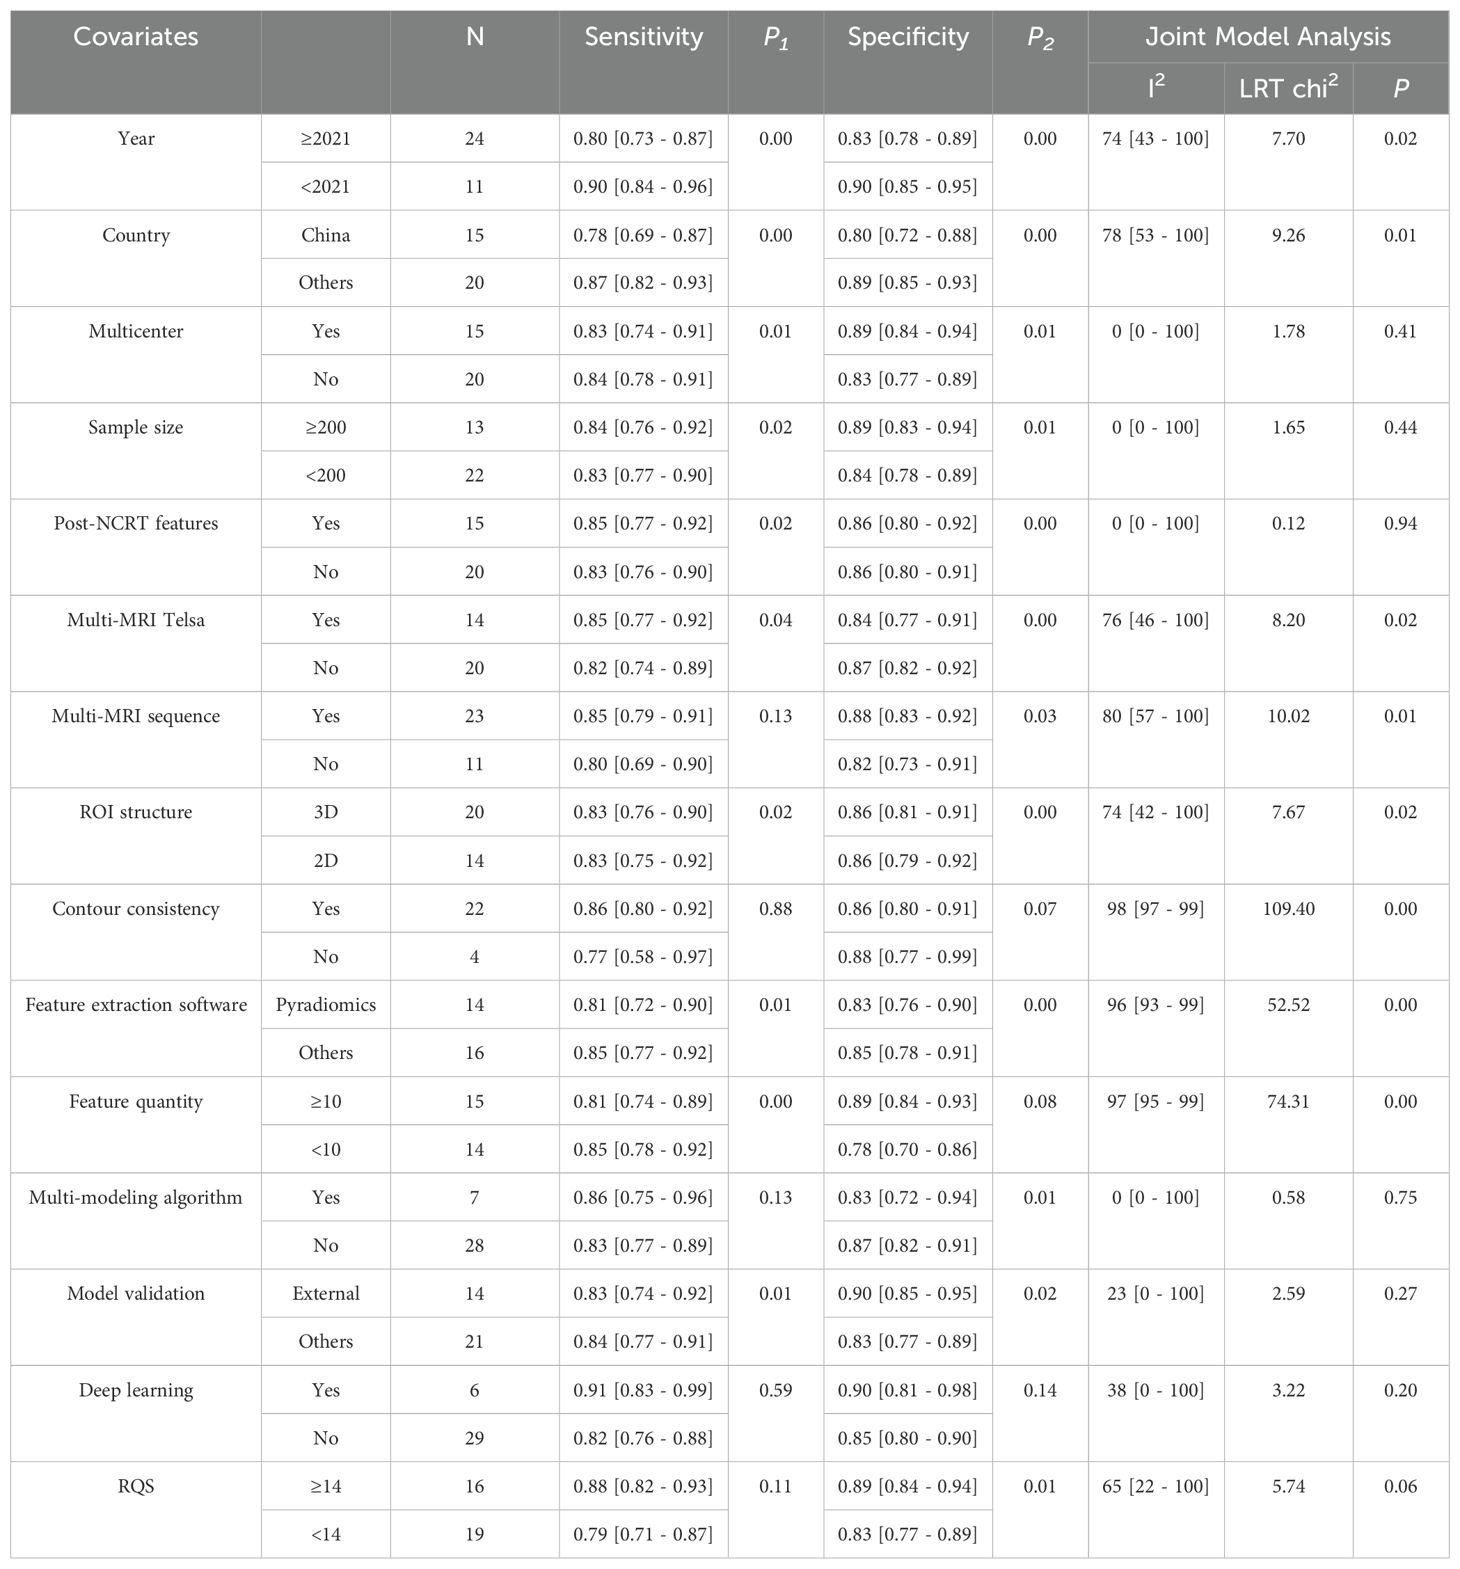
Table 3. Investigation of heterogeneity using meta-regression and subgroup analysis.
According to subgroup analysis results (Figure 5), studies from China showed lower pooled sensitivity (78% vs. 87%, P < 0.001) and specificity (80% vs. 89%, P < 0.001) compared to studies from other countries. Studies using multicenter cohorts for model development and validation owned higher specificity (89% vs. 83%, P = 0.01). Studies with a sample size of 200 or more demonstrated higher sensitivity (84% vs. 83%, P = 0.02) and specificity (89% vs. 84%, P = 0.01). Studies incorporating multiple MRI imaging sequences showed higher sensitivity (85% vs. 80%, P = 0.13, not significant) and specificity (88% vs. 82%, P = 0.03) compared to those using only one sequence. Studies that performed consistency evaluations for lesion contouring showed higher sensitivity (86% vs. 77%, P = 0.88, not significant), which helped analyze the robustness of radiomic features to segmentation variability. Studies with using Pyradiomics software for feature extraction showed lower sensitivity (81% vs. 85%, P = 0.01) and specificity (83% vs. 85%, P < 0.001). Studies that validated the predictive performance of the model on external validation cohorts manifested lower sensitivity (83% vs. 84%, P = 0.01) and higher specificity (90% vs. 83%, P = 0.02). Deep learning-based radiomics studies showed higher sensitivity (91% vs. 82%, P = 0.59, not significant) and specificity (90% vs. 85%, P = 0.14, not significant) compared to conventional radiomics, although these differences were not statistically significant. From the overall score, studies with higher RQS scores demonstrated higher sensitivity (88% vs. 79%, P = 0.11, not significant) and specificity (89% vs. 83%, P = 0.01).
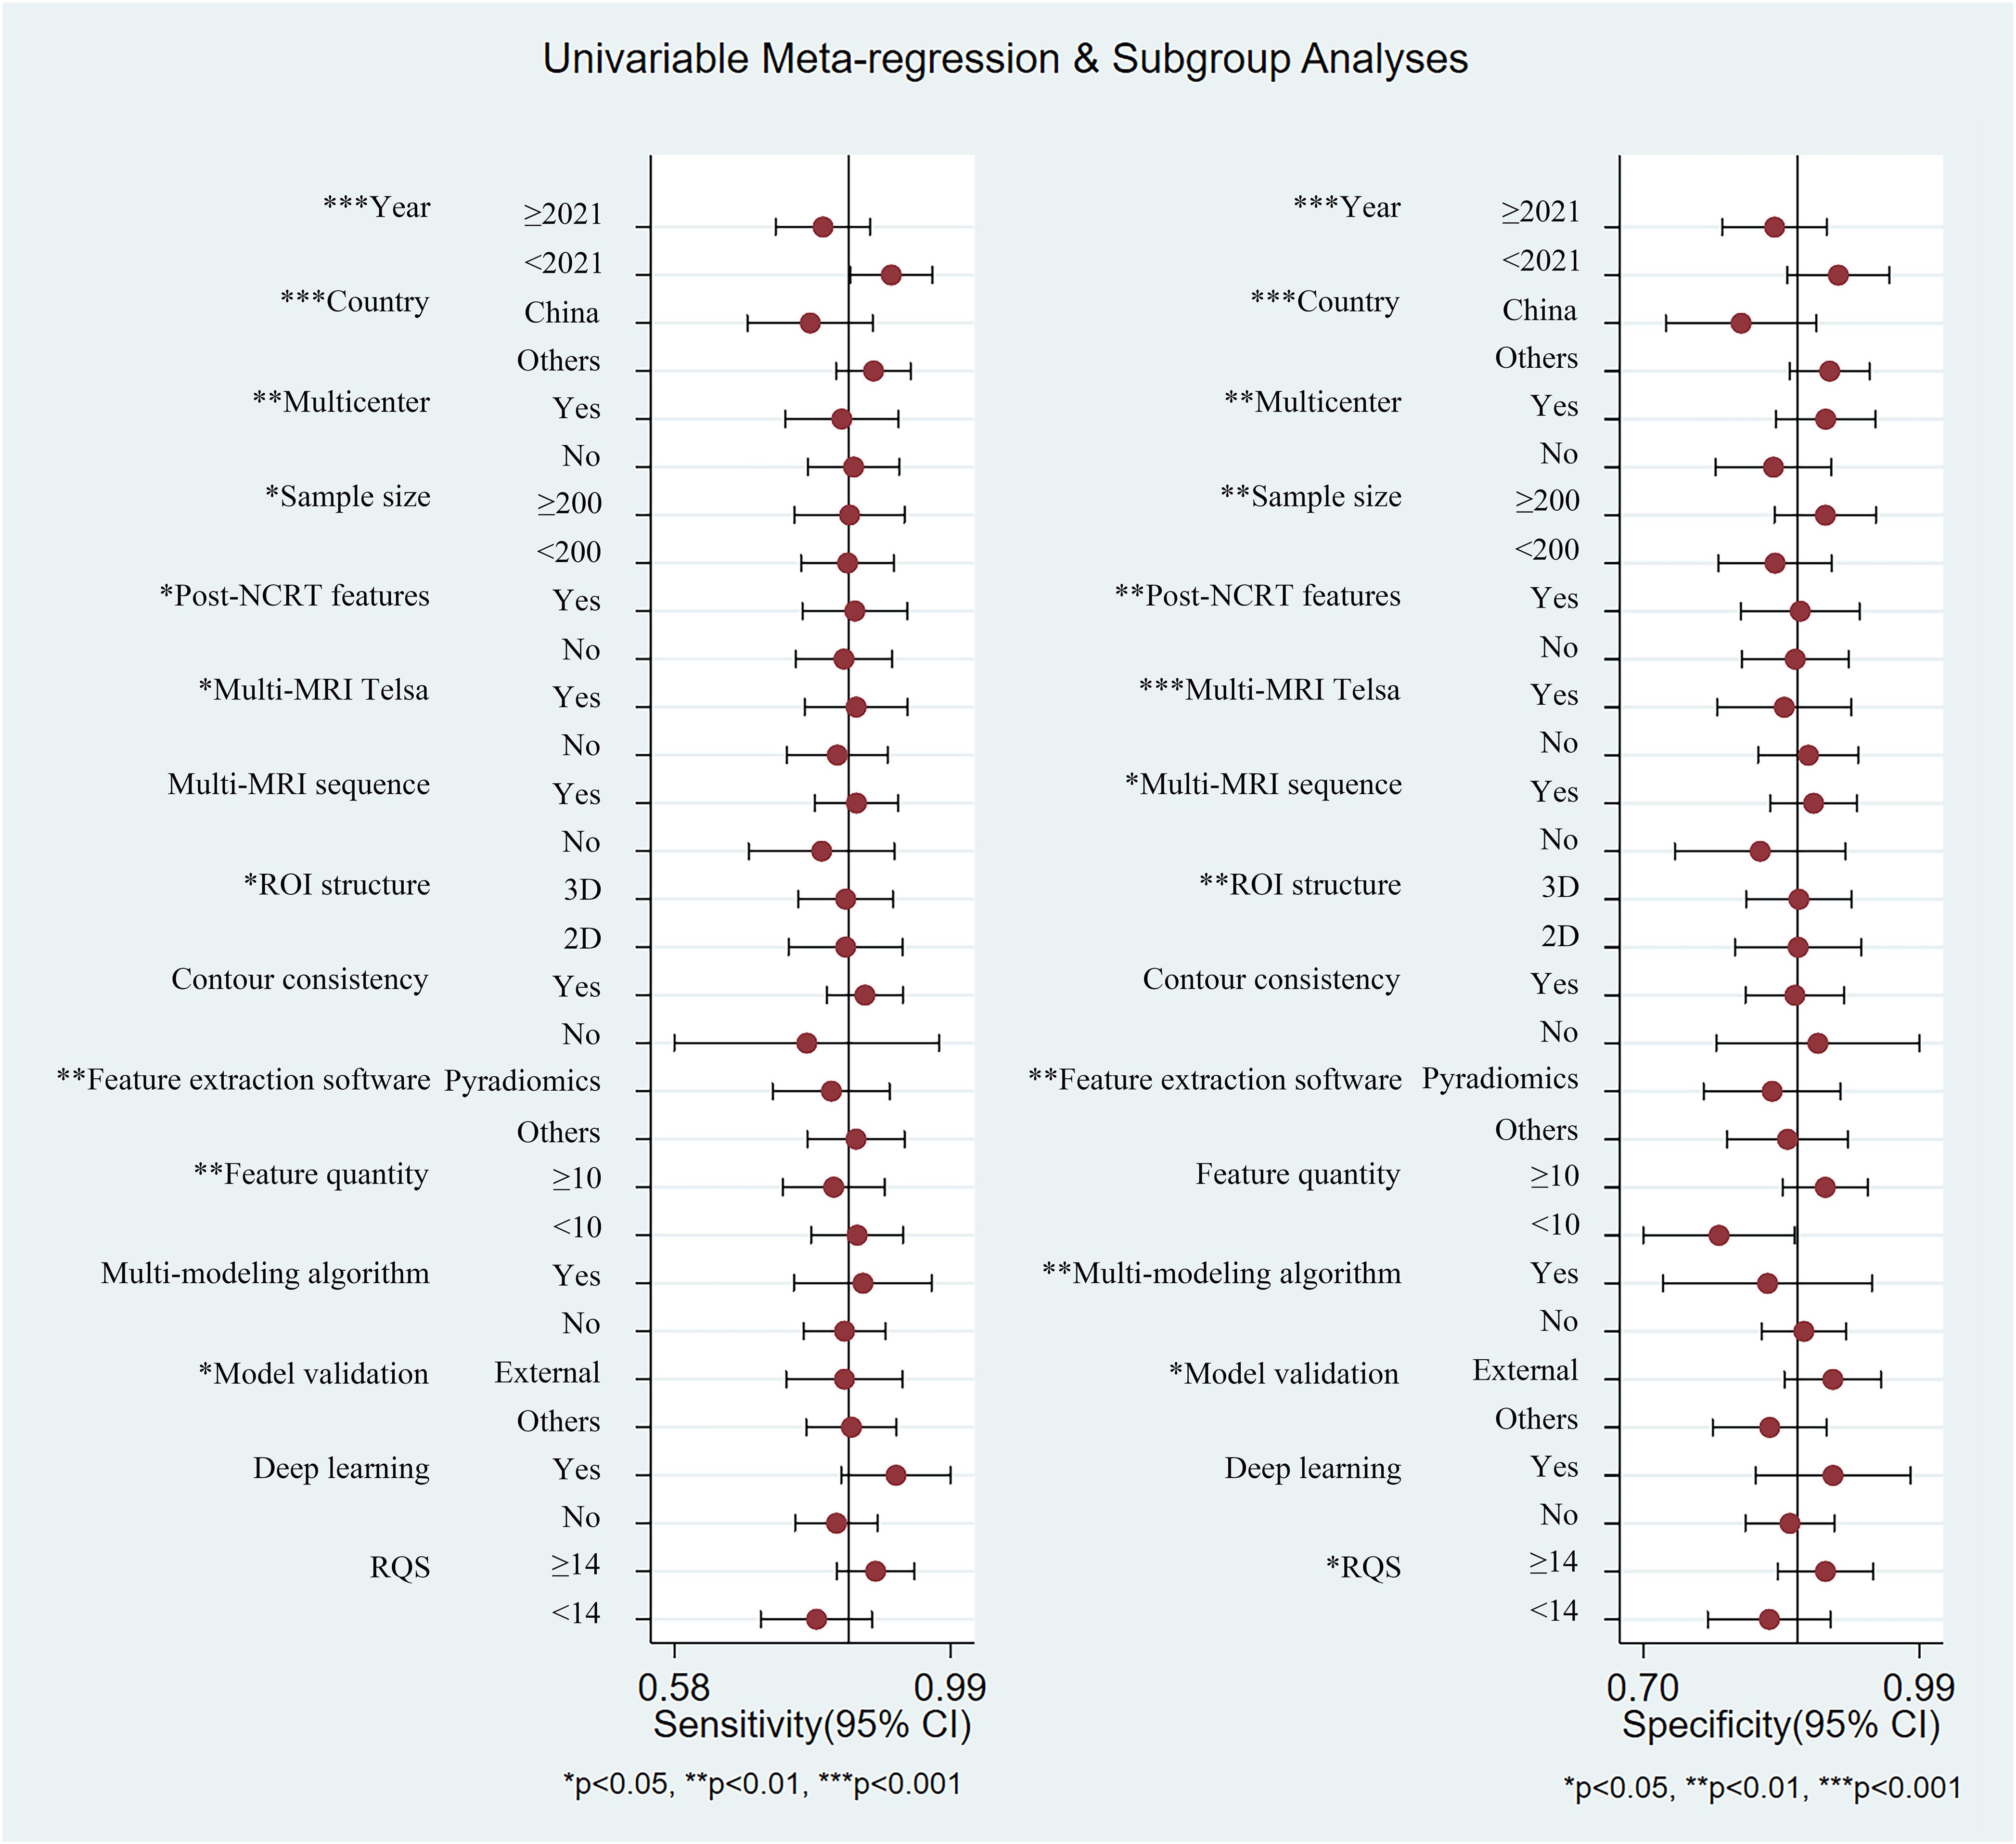
Figure 5. Summary plot of sensitivity and specificity of each subgroup using univariable meta-regression and subgroup analyses.
Deeks’ test was used to explore potential publication bias in the included studies. The funnel plot (Figure 6) showed a generally symmetrical distribution around the regression line, suggesting no significant publication bias (P = 0.69).
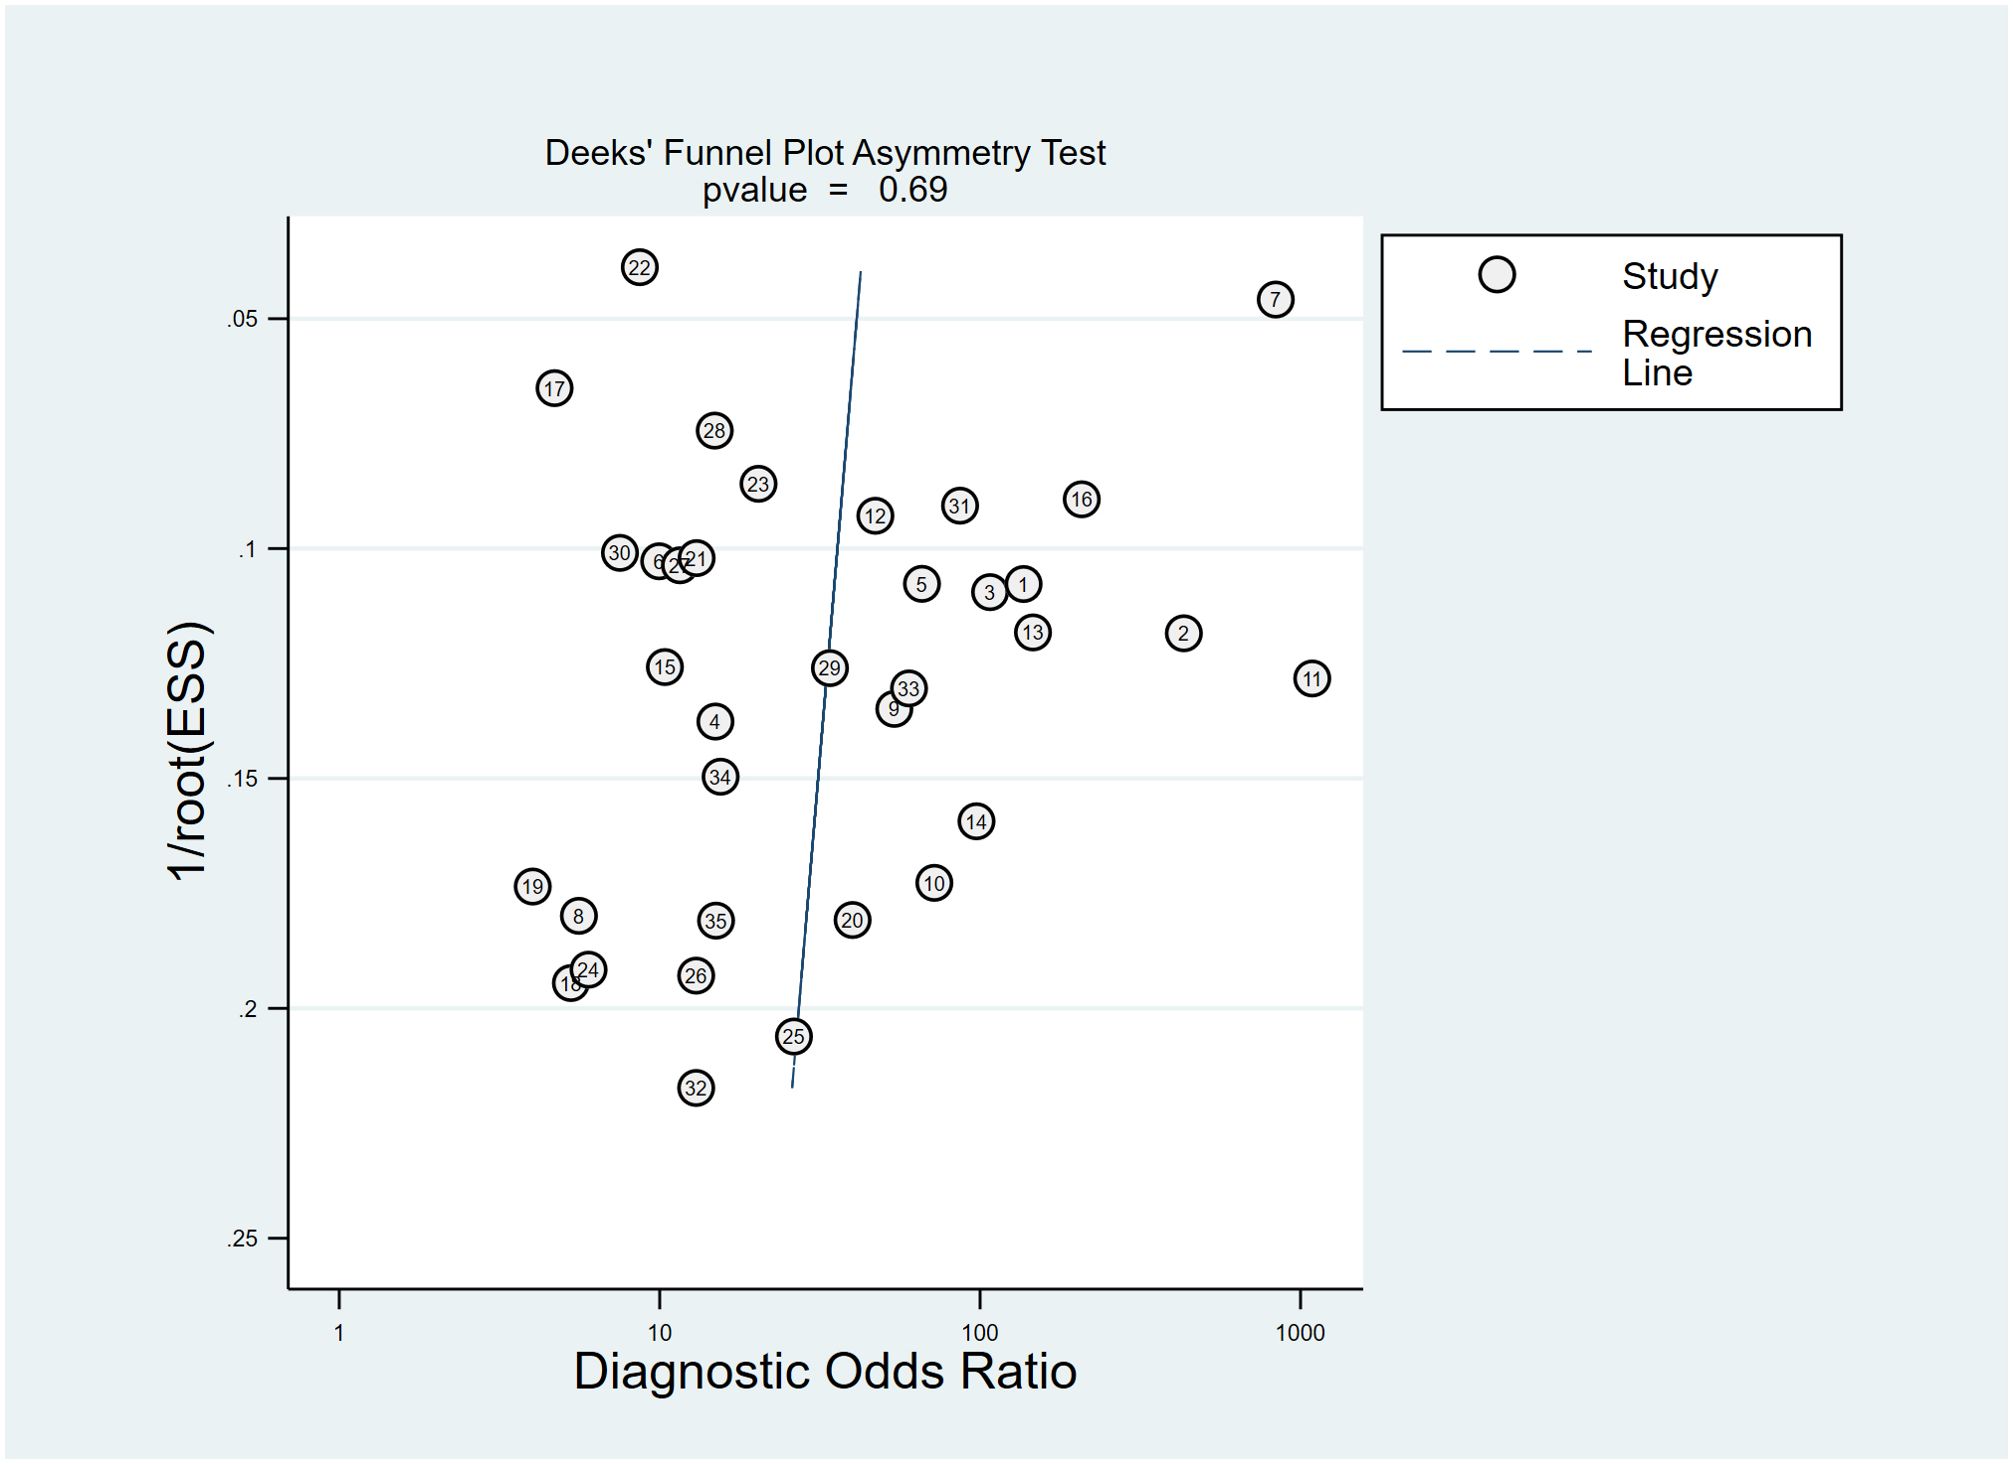
Figure 6. The Deeks’ funnel plot asymmetry test for publication bias in the literature evaluation. Each study is shown as a circle, and the regression line is shown.
According to the Fagan plot of the study cohort (Figure 7), the pre-test probability of predicting pCR in LARC patients was 30%. The positive likelihood ratio for MRI radiomics in predicting pCR was 6, and the negative likelihood ratio was 0.19, which increased the post-test probability of a positive result to 72% and decreased the post-test probability of a negative result to 8%.
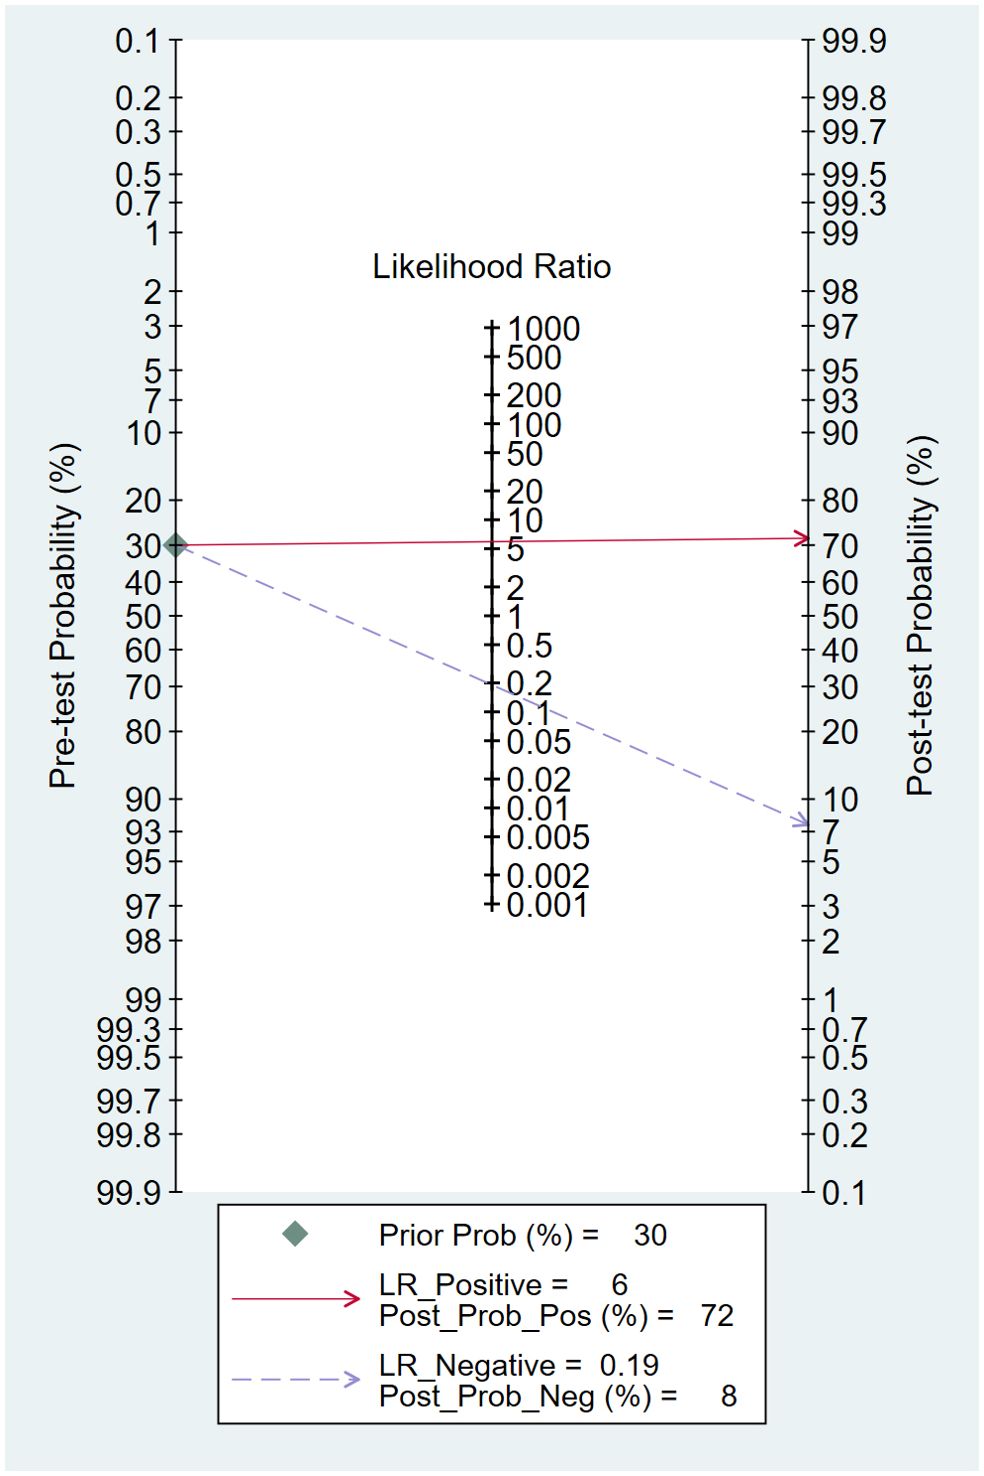
Figure 7. Fagan plots for assessing clinical utility.
Accurate assessment of NCRT efficacy in LARC patients after receiving NCRT can provide critical information for subsequent treatment decisions. Studies have shown that if accurate prediction of pCR in LARC patients receiving NCRT could be made preoperatively, a “watch and wait” strategy may be adopted. This approach could help avoid surgical complications and permanent stoma formation, ultimately helping to improve quality of life and achieve precision medicine (48). Currently, the predictive value of conventional imaging methods for pCR is limited (6, 7), whereas the efficacy of pCR prediction has been significantly improved by MRI-based radiomics in recent years. By extracting numerous features from MRI images, identifying correlations between image features and predictive outcomes, and using machine learning methods to build predictive models, MRI-based radiomics offers a new approach for predicting pCR (49).
This study conducted a meta-analysis of 35 relevant studies, showing that MRI-based radiomics owned a high AUC (0.91) for predicting pCR in LARC patients following NCRT, with pooled sensitivity and specificity of 0.83 (95% CI: 0.80-0.84) and 0.82 (95% CI: 0.81-0.83), respectively. These findings are consistent with previous reviews and systematic reviews (50, 51). The Fagan plot demonstrated that MRI-based radiomics can raise the post-test probability of a positive result to 72% and reduce the post-test probability of a negative result to 8%. Compared to previous studies using conventional imaging methods for pCR prediction, MRI-based radiomics showed significantly enhanced predictive performance, indicating that MRI-based radiomics provided a new approach for predicting pCR and may offer valuable guidance for treatment planning in LARC patients (52). Compared with the previous study by Jia et al., the predictive performance of MRI radiomics for pCR is largely consistent. However, this study demonstrated superiority from 4 aspects: (1) an increased number of included studies (35 vs. 21); (2) higher quality of included studies (RQS 13.91 vs. 10.95); (3) exploration of potential sources of heterogeneity using meta-regression; and (4) additional subgroup analysis (9).
We assessed the quality of included studies using the QUADAS-2 and RQS tools. Since all study subjects were confirmed by postoperative histopathological biopsy, the risk of bias and overall applicability concerns in the reference standard domain were low. Some studies did not clearly specify whether cases were enrolled consecutively, performed ROI delineation without implementing blinding, or did not report the interval between MRI examination and pathological biopsy, resulting in certain risks of bias and overall applicability concerns in domains other than the reference standard. Phantom study was designed to detect potential feature differences across scanners and vendors. Many studies used MRI imaging data from different vendors (e.g., Siemens, Philips) and multiple medical centers, making phantom study a suitable approach to measure these uncertainties and identify vendor-dependent features. Cost-effectiveness analysis was a health economics approach that advocated for cost-quality-adjusted life-year comparison, with or without the use of radiomics, to more accurately evaluate the economic potential of such studies. Future study reports should consider incorporating the above details of quality assessment.
We emphasized the role of various feature extraction software, including Pyradiomics, in contributing to the heterogeneity of results. This variability stemmed from the diversity of algorithmic approaches and parameter settings across software. While not inherently detrimental but rather highlighted the subtle impact of the choice of feature extraction software on research outcomes. Given this variability, we underscored the importance of understanding and transparently reporting the software used, as it significantly impacted on the overall radiomics analysis. Likewise, contour consistency is another critical source of heterogeneity that cannot be ignored. Evaluating the consistency of ROI delineation helped to ensure high concordance in the outlining of lesion contours among different observers or by the same observer at different time points. This was crucial for radiomics studies, as feature extraction relied on precise lesion regions. Large variations in contour could lead to fluctuations in extracted features, thereby impacting stability and predictive performance of model. Different observers may interpret lesion boundaries differently, especially when the lesion morphology is complex, or boundaries are indistinct. These discrepancies can affect the conclusions of individual studies and potentially introduce greater bias in multicenter studies, thereby undermining the quality of evidence.
Subgroup analysis results indicated that studies published in 2021 or later showed slightly lower predictive performance compared to those published before 2021. The reasons may be analyzed as a result of the lack of robust validation, resulting in potential model overfitting. Studies with a sample size greater than 200, using multicenter cohorts, incorporating post-NCRT MRI features, or employing multiple MRI sequences, showed higher predictive performance. This could be that larger sample sizes allow for more comprehensive training and validation of the model, and richer imaging information provides a greater chance of extracting features that can accurately distinguish pCR from non-pCR during the feature extraction phase, thus better reflecting the efficacy of NCRT and enhancing model predictive performance. Deep learning-based radiomics studies showed higher sensitivity (91% vs. 82%, P = 0.59, not significant) and specificity (90% vs. 85%, P = 0.14, not significant) than those of machine learning-based, though the differences were not statistically significant. In terms of feature extraction, traditional machine learning methods typically rely on manually designed and selected features. This requires experts to predetermine useful features based on domain knowledge, such as edges or textures in image processing. This process is time-consuming, depends on expert experience, and may miss some potentially important features. Deep learning, particularly convolutional neural networks, can automatically extract multi-level features from raw data. Through multiple layers of nonlinear transformation, deep learning models can detect complex and abstract patterns in data without the need of manually designed features. This automated feature extraction not only improves efficiency but also reveals deep features that traditional methods may overlook. The primary characteristic of deep learning methods is the emphasis on feature learning, namely autonomously learning data representations (53). This is the key distinction between deep learning and more “traditional” machine learning methodologies. However, this meta-analysis included only six deep learning studies, and more research is needed to confirm this conclusion. Additionally, studies with RQS scores ≥14 demonstrated higher predictive performance compared to those with RQS <14, suggesting that studies with a more standardized radiomics workflow have fewer confounding factors, which reduces bias while enhances the predictive performance and robustness of the model.
While current systematic review has focused specifically on locally advanced rectal cancer (LARC), it is noteworthy that colorectal cancer (CRC) as a broader entity remains the third most prevalent malignancy worldwide, with colon cancer accounting for approximately 70% of all CRC cases (54). The integration of the Internet of Things (IoT) into surgical practice has revolutionized CRC management by enabling real-time data acquisition, remote monitoring, and enhanced intraoperative precision. IoT-driven devices, such as smart surgical instruments and wearable biosensors, facilitate continuous postoperative surveillance of physiological parameters (e.g. bowel motility, inflammatory markers) to detect complications early. Furthermore, IoT platforms enhance multidisciplinary collaboration by synchronizing imaging, pathology, and clinical data, thereby optimizing preoperative planning and personalized therapeutic strategies (55).
Deep learning algorithms have emerged as transformative tools in CRC diagnosis, particularly in histopathology image analysis. Recent studies demonstrate that convolutional neural networks can classify colorectal adenocarcinoma with accuracy comparable to expert pathologists, reducing interobserver variability and diagnostic delays (56). For example, Deep learning models trained on whole-slide images (WSIs) excel in detecting subtle morphological features, such as tumor budding and lymph vascular invasion, which are critical for staging and prognosis. Bousis et al. highlighted that Deep learning-based systems achieve >90% sensitivity in differentiating benign polyps from malignant lesions, minimizing unnecessary biopsies (57). Similarly, Chlorogiennis et al. emphasized the utility in predicting microsatellite instability status directly from H&E-stained slides, potentially bypassing costly molecular testing (58).
Postoperative complications, such as infection, anastomotic leakage, bowel obstruction, and postoperative bleeding, remain significant challenges in colorectal surgery, impacting morbidity and long-term survival. Emerging biomarkers, including butyrylcholinesterase (BChE), show promise in predicting these adverse outcomes. BChE, an enzyme involved in detoxification and inflammation modulation, correlates with systemic stress responses. Recent evidence suggests that preoperative BChE levels inversely associate with postoperative ileus and sepsis risk, potentially reflecting impaired cholinergic anti-inflammatory pathways (59). Patients with low BChE activity (<1,900 IU/L) exhibit a higher risk of anastomotic dehiscence, likely due to dysregulated tissue repair and prolonged inflammation (60). While these findings underscore the prognostic utility of BChE, further validation in prospective cohorts is needed to establish standardized cutoff values and evaluate interactions with comorbidities (e.g. hepatic dysfunction). Combining BChE with clinical risk scores may refine perioperative decision-making, enabling targeted interventions for high-risk patients. Overall, despite these advances, clinical implementation faces hurdles, including model generalizability across diverse populations and regulatory standardization. Future integration with radiomics may yield multimodal predictive frameworks, further enhancing CRC management.
This systematic review and meta-analysis has several limitations that are necessary to mention: (1) Most of the included studies were retrospectively designed (approximately 83%). Prospective studies are generally regarded as superior to retrospective studies due to standardized imaging protocols, timely and relevant radiomic feature extraction, standardized and blinded data collection, and optimized study design. These factors can all enhance the quality and relevance of the study results. (2) Only a small number of studies used deep learning methods for model establishment. Deep learning and convolutional neural network offer a more automated and efficient approach to feature extraction, allowing for extracting high-level features from images. This makes them particularly suitable for radiomics studies, where the complexity and volume of medical imaging data can be high. (3) There was substantial heterogeneity among studies due to non-threshold effects (for sensitivity, I2 = 78.5%, P < 0.001). Although meta-regression was used to explore numerous potential sources of heterogeneity, it was not possible to identify all sources. (4) We only evaluated pCR studies and did not include studies on tumor regression grading and T downstaging. It is known that pathological evaluation of TRG and T downstaging is more subjective than pCR evaluation. (5) Only the predictive performance of MRI-based radiomics models and their combination with clinical factors were evaluated. In actual clinical practice, other imaging modalities (e.g., PET-CT, ultrasound), as well as pathological and biochemical indicators, are commonly used to assess NCRT efficacy, relying on a multidisciplinary comprehensive judgment.
In summary, MRI-based radiomics demonstrates a high efficacy in predicting whether LARC patients achieve pCR following NCRT, providing valuable guidance for treatment planning and potentially enhancing patients’ quality of life. However, there is still a lack of large-sample, prospective, multicenter external validation studies, and the external applicability of MRI-based radiomics models requires further investigation. With the advancement of big data and resource sharing, alongside the innovation and enhancement of computational and artificial intelligence methodologies, the predictive performance of MRI-based radiomics for pCR stands to be significantly augmented, holding promise for the realization of precision medicine tailored to patients with LARC.
The original contributions presented in the study are included in the article/Supplementary Material. Further inquiries can be directed to the corresponding author.
ZL: Formal analysis, Investigation, Methodology, Software, Validation, Visualization, Writing – original draft, Writing – review & editing. DL: Data curation, Methodology, Resources, Validation, Writing – original draft. XT: Formal analysis, Investigation, Methodology, Writing – original draft. FH: Conceptualization, Investigation, Supervision, Visualization, Writing – original draft. XZ: Conceptualization, Data curation, Investigation, Methodology, Project administration, Software, Supervision, Validation, Visualization, Writing – original draft, Writing – review & editing.
The author(s) declare that no financial support was received for the research, authorship, and/or publication of this article.
The authors declare that the research was conducted in the absence of any commercial or financial relationships that could be construed as a potential conflict of interest.
The author(s) declare that no Generative AI was used in the creation of this manuscript.
All claims expressed in this article are solely those of the authors and do not necessarily represent those of their affiliated organizations, or those of the publisher, the editors and the reviewers. Any product that may be evaluated in this article, or claim that may be made by its manufacturer, is not guaranteed or endorsed by the publisher.
The Supplementary Material for this article can be found online at: https://www.frontiersin.org/articles/10.3389/fonc.2025.1550838/full#supplementary-material
LARC, locally advanced rectal cancer; NCRT, neoadjuvant chemoradiotherapy; pCR, pathological complete response; TME, total mesorectal excision; QUADAS-2, Quality Assessment of Diagnostic Accuracy Studies 2; RQS, Radiomics Quality Score; AUC, area under the curve; MRI, magnetic resonance imaging; PRISMA-DTA, Preferred Reporting Items for Systematic Reviews and Meta-Analyses of Diagnostic Test Accuracy; ROI, region of interest.
1. Trakarnsanga A, Gonen M, Shia J, Nash GM, Temple LK, Guillem JG, et al. Comparison of tumor regression grade systems for locally advanced rectal cancer after multimodality treatment. J Natl Cancer Inst. (2014) 106:dju248. doi: 10.1093/jnci/dju248
2. Renehan AG, Malcomson L, Emsley R, Gollins S, Maw A, Myint AS, et al. Watch-and-wait approach versus surgical resection after chemoradiotherapy for patients with rectal cancer (the OnCoRe project): a propensity-score matched cohort analysis. Lancet Oncol. (2016) 17:174–83. doi: 10.1016/S1470-2045(15)00467-2
3. Martin ST, Heneghan HM, Winter DC. Systematic review and meta-analysis of outcomes following pathological complete response to neoadjuvant chemoradiotherapy for rectal cancer. Br J Surg. (2012) 99:918–28. doi: 10.1002/bjs.8702
4. Dossa F, Chesney TR, Acuna SA, Baxter NN. A watch-and-wait approach for locally advanced rectal cancer after a clinical complete response following neoadjuvant chemoradiation: a systematic review and meta-analysis. Lancet Gastroenterol Hepatol. (2017) 2:501–13. doi: 10.1016/S2468-1253(17)30074-2
5. Custers PA, van der Sande ME, Grotenhuis BA, Peters FP, van Kuijk SM, Beets GL, et al. Long-term quality of life and functional outcome of patients with rectal cancer following a watch-and-wait approach. JAMA Surg. (2023) 158:e230146. doi: 10.1001/jamasurg.2023.0146
6. Patel UB, Taylor F, Blomqvist L, George C, Evans H, Tekkis P, et al. Magnetic resonance imaging-detected tumor response for locally advanced rectal cancer predicts survival outcomes: MERCURY experience. J Clin Oncol. (2011) 29:3753–60. doi: 10.1200/JCO.2011.34.9068
7. van den Broek JJ, van der Wolf FS, Lahaye MJ, Heijnen LA, Meischl C, Heitbrink MA, et al. Accuracy of MRI in restaging locally advanced rectal cancer after preoperative chemoradiation. Dis Colon Rectum. (2017) 60:274–83. doi: 10.1097/DCR.0000000000000743
8. Lambin P, Rios-Velazquez E, Leijenaar R, Carvalho S, van Stiphout RG, Granton P, et al. Radiomics: extracting more information from medical images using advanced feature analysis. Eur J Cancer. (2012) 48:441–6. doi: 10.1016/j.ejca.2011.11.036
9. Jia LL, Zheng QY, Tian JH, He DL, Zhao JX, Zhao LP, et al. Artificial intelligence with magnetic resonance imaging for prediction of pathological complete response to neoadjuvant chemoradiotherapy in rectal cancer: A systematic review and meta-analysis. Front Oncol. (2022) 12:1026216. doi: 10.3389/fonc.2022.1026216
10. Page MJ, McKenzie JE, Bossuyt PM, Boutron I, Hoffmann TC, Mulrow CD, et al. The PRISMA 2020 statement: An updated guideline for reporting systematic reviews. J Clin Epidemiol. (2021) 134:178–89. doi: 10.1016/j.jclinepi.2021.03.001
11. Whiting PF, Rutjes AW, Westwood ME, Mallett S, Deeks JJ, Reitsma JB, et al. QUADAS-2: a revised tool for the quality assessment of diagnostic accuracy studies. Ann Intern Med. (2011) 155:529–36. doi: 10.7326/0003-4819-155-8-201110180-00009
12. Lambin P, Leijenaar RTH, Deist TM, Peerlings J, de Jong EEC, van Timmeren J, et al. Radiomics: the bridge between medical imaging and personalized medicine. Nat Rev Clin Oncol. (2017) 14:749–62. doi: 10.1038/nrclinonc.2017.141
13. Liu Z, Zhang XY, Shi YJ, Wang L, Zhu HT, Tang Z, et al. Radiomics analysis for evaluation of pathological complete response to neoadjuvant chemoradiotherapy in locally advanced rectal cancer. Clin Cancer Res. (2017) 23:7253–62. doi: 10.1158/1078-0432.CCR-17-1038
14. Natally H, Harini V, Monika K, Ivana B, Junting Z, Marinela C, et al. MR imaging of rectal cancer: radiomics analysis to assess treatment response after neoadjuvant therapy. Radiology. (2018) 287:833–43. doi: 10.1148/radiol.2018172300
15. Yanfen C, Xiaotang Y, Zhang S, Zhao Y, Xiang-ke DU, Zhikai Z, et al. Radiomics analysis of multiparametric MRI for prediction of pathological complete response to neoadjuvant chemoradiotherapy in locally advanced rectal cancer. Eur Radiol. (2018) 29:1211–20. doi: 10.1007/s00330-018-5683-9
16. Riccardo F, Mancini-Terracciano C, Voena C, Marco R, Marta Z, Andrea C, et al. MR-based artificial intelligence model to assess response to therapy in locally advanced rectal cancer. Eur J Radiol. (2019) 118:1–9. doi: 10.1016/j.ejrad.2019.06.013
17. Yi X, Pei Q, Zhang Y, Zhu H, Wang Z, Chen C, et al. MRI-based radiomics predicts tumor response to neoadjuvant chemoradiotherapy in locally advanced rectal cancer. Front Oncol. (2019) 9:552. doi: 10.3389/fonc.2019.00552
18. Hiram S, Andrew A, Vanguri R, Antonino S, Paul MA, Sachin J, et al. Radiomics of MRI for pretreatment prediction of pathologic complete response, tumor regression grade, and neoadjuvant rectal score in patients with locally advanced rectal cancer undergoing neoadjuvant chemoradiation: an international multicenter study. Eur Radiol. (2020) 30:6263–73. doi: 10.1007/s00330-020-06968-6
19. Lizhi S, Zhenyu L, Lili F, Xiaoying L, Zhenhui L, Xiao Yan Z, et al. Multiparametric MRI and whole slide image-based pretreatment prediction of pathological response to neoadjuvant chemoradiotherapy in rectal cancer: A multicenter radiopathomic study. Ann Surg Oncol. (2020) 27:4296–306. doi: 10.1245/s10434-020-08659-4
20. Antunes JT, Ofshteyn A, Bera K, Wang EY, Brady JT, Willis JE, et al. Radiomic features of primary rectal cancers on baseline T(2) -weighted MRI are associated with pathologic complete response to neoadjuvant chemoradiation: A multisite study. J Magn Reson Imaging. (2020) 52:1531–41. doi: 10.1002/jmri.27140
21. Bulens P, Couwenberg A, Intven M, Debucquoy A, Vandecaveye V, Van Cutsem E, et al. Predicting the tumor response to chemoradiotherapy for rectal cancer: Model development and external validation using MRI radiomics. Radiother Oncol. (2020) 142:246–52. doi: 10.1016/j.radonc.2019.07.033
22. Huang CM, Huang MY, Huang CW, Tsai HL, Su WC, Chang WC, et al. Machine learning for predicting pathological complete response in patients with locally advanced rectal cancer after neoadjuvant chemoradiotherapy. Sci Rep. (2020) 10:12555. doi: 10.1038/s41598-020-69345-9
23. Zhang XY, Wang L, Zhu HT, Li ZW, Ye M, Li XT, et al. Predicting rectal cancer response to neoadjuvant chemoradiotherapy using deep learning of diffusion kurtosis MRI. Radiology. (2020) 296:56–64. doi: 10.1148/radiol.2020190936
24. Wan L, Peng W, Zou S, Ye F, Geng Y, Ouyang H, et al. MRI-based delta-radiomics are predictive of pathological complete response after neoadjuvant chemoradiotherapy in locally advanced rectal cancer. Acad Radiol. (2021) 28 Suppl 1:S95–S104. doi: 10.1016/j.acra.2020.10.026
25. Zhihui L, Shuai L, Shuqin Z, Xiaolu M, Fangying C, Yuwei X, et al. Predicting treatment response to neoadjuvant chemoradiotherapy in rectal mucinous adenocarcinoma using an MRI-based radiomics nomogram. Front Oncol. (2021) 24:671636. doi: 10.3389/fonc.2021.671636
26. Cheng Y, Luo Y, Hu Y, Zhang Z, Wang X, Yu Q, et al. Multiparametric MRI-based Radiomics approaches on predicting response to neoadjuvant chemoradiotherapy (nCRT) in patients with rectal cancer. Abdom Radiol (NY). (2021) 46:5072–85. doi: 10.1007/s00261-021-03219-0
27. Jang BS, Lim YJ, Song C, Jeon SH, Lee KW, Kang SB, et al. Image-based deep learning model for predicting pathological response in rectal cancer using post-chemoradiotherapy magnetic resonance imaging. Radiother Oncol. (2021) 161:183–90. doi: 10.1016/j.radonc.2021.06.019
28. Jin C, Yu H, Ke J, Ding P, Yi Y, Jiang X, et al. Predicting treatment response from longitudinal images using multi-task deep learning. Nat Commun. (2021) 12:1851. doi: 10.1038/s41467-021-22188-y
29. Lee S, Lim J, Shin J, Kim S, Hwang H. Pathologic complete response prediction after neoadjuvant chemoradiation therapy for rectal cancer using radiomics and deep embedding network of MRI. Appl Sci. (2021) 11:9494. doi: 10.3390/app11209494
30. Pang X, Wang F, Zhang Q, Li Y, Huang R, Yin X, et al. A pipeline for predicting the treatment response of neoadjuvant chemoradiotherapy for locally advanced rectal cancer using single MRI modality: combining deep segmentation network and radiomics analysis based on “Suspicious region. Front Oncol. (2021) 11:711747. doi: 10.3389/fonc.2021.711747
31. Boldrini L, Lenkowicz J, Orlandini LC, Yin G, Cusumano D, Chiloiro G, et al. Applicability of a pathological complete response magnetic resonance-based radiomics model for locally advanced rectal cancer in intercontinental cohort. Radiat Oncol. (2022) 17:78. doi: 10.1186/s13014-022-02048-9
32. Bordron A, Rio E, Badic B, Miranda O, Pradier O, Hatt M, et al. External validation of a radiomics model for the prediction of complete response to neoadjuvant chemoradiotherapy in rectal cancer. Cancers (Basel). (2022) 14:1079. doi: 10.3390/cancers14041079
33. Feng L, Liu Z, Li C, Li Z, Lou X, Shao L, et al. Development and validation of a radiopathomics model to predict pathological complete response to neoadjuvant chemoradiotherapy in locally advanced rectal cancer: a multicentre observational study. Lancet Digit Health. (2022) 4:e8–e17. doi: 10.1016/S2589-7500(21)00215-6
34. Jaeseung S, Nieun S, Song-Ee B, Nak-Hoon S, Joon Seok L, Nam Kyu K, et al. MRI radiomics model predicts pathologic complete response of rectal cancer following chemoradiotherapy. Radiology. (2022) 303:351–8. doi: 10.1148/radiol.211986
35. Jayaprakasam VS, Paroder V, Gibbs P, Bajwa R, Gangai N, Sosa RE, et al. MRI radiomics features of mesorectal fat can predict response to neoadjuvant chemoradiation therapy and tumor recurrence in patients with locally advanced rectal cancer. Eur Radiol. (2022) 32:971–80. doi: 10.1007/s00330-021-08144-w
36. Nardone V, Reginelli A, Grassi R, Vacca G, Giacobbe G, Angrisani A, et al. Ability of delta radiomics to predict a complete pathological response in patients with loco-regional rectal cancer addressed to neoadjuvant chemo-radiation and surgery. Cancers (Basel). (2022) 14:3004. doi: 10.3390/cancers14123004
37. Zhang XY, Zhu HT, Li XT, Li YJ, Li ZW, Wang WH, et al. A prediction model of pathological complete response in patients with locally advanced rectal cancer after PD-1 antibody combined with total neoadjuvant chemoradiotherapy based on MRI radiomics. Zhonghua Wei Chang Wai Ke Za Zhi. (2022) 25:228–34. doi: 10.3760/cma.j.cn441530-20211222-00527
38. Horvat N, Veeraraghavan H, Nahas CSR, Bates DDB, Ferreira FR, Zheng J, et al. Combined artificial intelligence and radiologist model for predicting rectal cancer treatment response from magnetic resonance imaging: an external validation study. Abdom Radiol (NY). (2022) 47:2770–82. doi: 10.1007/s00261-022-03572-8
39. Chiloiro G, Cusumano D, Romano A, Boldrini L, Nicolì G, Votta C, et al. Delta radiomic analysis of mesorectum to predict treatment response and prognosis in locally advanced rectal cancer. Cancers. (2023) 15:3082. doi: 10.3390/cancers15123082
40. Huang H, Han L, Guo J, Zhang Y, Lin S, Chen S, et al. Multiphase and multiparameter MRI-based radiomics for prediction of tumor response to neoadjuvant therapy in locally advanced rectal cancer. Radiat Oncol. (2023) 18:1–11. doi: 10.1186/s13014-023-02368-4
41. Peng J, Wang W, Jin H, Xue Q, Hou J, Zhang Y, et al. Develop and validate a radiomics space-time model to predict the pathological complete response in patients undergoing neoadjuvant treatment of rectal cancer: an artificial intelligence model study based on machine learning. BMC Cancer. (2023) 23:1–11. doi: 10.1186/s12885-022-10466-x
42. Peng W, Wan L, Wang S, Zou S, Zhao X, Zhang H. A multiple-time-scale comparative study for the added value of magnetic resonance imaging-based radiomics in predicting pathological complete response after neoadjuvant chemoradiotherapy in locally advanced rectal cancer. Front Oncol. (2023) 13:1234619. doi: 10.3389/fonc.2023.1234619
43. Shi L, Zhang Y, Hu J, Zhou W, Hu X, Cui T, et al. Radiomics for the prediction of pathological complete response to neoadjuvant chemoradiation in locally advanced rectal cancer: A prospective observational trial. Bioengineering. (2023) 10:634. doi: 10.3390/bioengineering10060634
44. Wei Q, Chen Z, Tang Y, Chen W, Zhong L, Mao L, et al. External validation and comparison of MR-based radiomics models for predicting pathological complete response in locally advanced rectal cancer: a two-centre, multi-vendor study. Eur Radiol. (2023) 33:1906–17. doi: 10.1007/s00330-022-09204-5
45. Wen L, Liu J, Hu P, Bi F, Liu S, Jian L, et al. MRI-based radiomic models outperform radiologists in predicting pathological complete response to neoadjuvant chemoradiotherapy in locally advanced rectal cancer. Acad Radiol. (2023) 30 Suppl 1:S176–84. doi: 10.1016/j.acra.2022.12.037
46. Yardimci AH, Kocak B, Sel I, Bulut H, Bektas CT, Cin M, et al. Radiomics of locally advanced rectal cancer: machine learning-based prediction of response to neoadjuvant chemoradiotherapy using pre-treatment sagittal T2-weighted MRI. Jpn J Radiol. (2023) 41:71–82. doi: 10.1007/s11604-022-01325-7
47. Ma Q, Liu Z, Zhang J, Fu C, Li R, Sun Y, et al. Multi-task reconstruction network for synthetic diffusion kurtosis imaging: Predicting neoadjuvant chemoradiotherapy response in locally advanced rectal cancer. Eur J Radiol. (2024) 174:111402. doi: 10.1016/j.ejrad.2024.111402
48. Li J, Li L, Yang L, Yuan J, Lv B, Yao Y, et al. Wait-and-see treatment strategies for rectal cancer patients with clinical complete response after neoadjuvant chemoradiotherapy: a systematic review and meta-analysis. Oncotarget. (2016) 7:44857–70. doi: 10.18632/oncotarget.v7i28
49. Zhang S, Yu M, Chen D, Li P, Tang B, Li J. Role of MRIbased radiomics in locally advanced rectal cancer (Review). Oncol Rep. (2022) 47:34. doi: 10.3892/or.2021.8245
50. Bourbonne V, Schick U, Pradier O, Visvikis D, Jean-Philippe M, Badic B. Radiomics approaches for the prediction of pathological complete response after neoadjuvant treatment in locally advanced rectal cancer: ready for prime time? Cancers. (2023) 15:432. doi: 10.3390/cancers15020432
51. Tanaka MD, Geubels BM, Grotenhuis BA, Marijnen CA, Peters FP, Van der Mierden S, et al. Validated pretreatment prediction models for response to neoadjuvant therapy in patients with rectal cancer: A systematic review and critical appraisal. Cancers. (2023) 15:3945. doi: 10.3390/cancers15153945
52. Sclafani F, Brown G, Cunningham D, Wotherspoon A, Mendes LST, Balyasnikova S, et al. Comparison between MRI and pathology in the assessment of tumour regression grade in rectal cancer. Br J Cancer. (2017) 117:1478–85. doi: 10.1038/bjc.2017.320
53. Parekh VS, Jacobs MA. Deep learning and radiomics in precision medicine. Expert Rev Precis Med Drug Dev. (2019) 4:59–72. doi: 10.1080/23808993.2019.1585805
54. Bray F, Laversanne M, Sung H, Ferlay J, Siegel RL, Soerjomataram I, et al. Global cancer statistics 2022: GLOBOCAN estimates of incidence and mortality worldwide for 36 cancers in 185 countries. CA: Cancer J Clin. (2024) 74:229–63. doi: 10.3322/caac.21834
55. Pandurangan P, Rakshi AD, Sundar MSA, Samrat AV, Meenambiga S, Vedanarayanan V, et al. Integrating cutting-edge technologies: AI, IoT, blockchain and nanotechnology for enhanced diagnosis and treatment of colorectal cancer-A review. J Drug Delivery Sci Technol. (2024) 91:105197. doi: 10.1016/j.jddst.2023.105197
56. Sharkas M, Attallah O. Color-CADx: a deep learning approach for colorectal cancer classification through triple convolutional neural networks and discrete cosine transform. Sci Rep. (2024) 14:6914. doi: 10.1038/s41598-024-56820-w
57. Bousis D, Verras G-I, Bouchagier K, Antzoulas A, Panagiotopoulos I, Katinioti A, et al. The role of deep learning in diagnosing colorectal cancer. Gastroenterol Review/Przegląd Gastroenterologiczny. (2023) 18:266–73. doi: 10.5114/pg.2023.129494
58. Chlorogiannis DD, Verras G-I, Tzelepi V, Chlorogiannis A, Apostolos A, Kotis K, et al. Tissue classification and diagnosis of colorectal cancer histopathology images using deep learning algorithms. Is the time ripe for clinical practice implementation? Gastroenterol Review/Przegląd Gastroenterologiczny. (2023) 18:353–67. doi: 10.5114/pg.2023.130337
59. Distelmaier K, Winter M-P, Rützler K, Heinz G, Lang IM, Maurer G, et al. Serum butyrylcholinesterase predicts survival after extracorporeal membrane oxygenation after cardiovascular surgery. Crit Care. (2014) 18:1–7. doi: 10.1186/cc13711
Keywords: magnetic resonance imaging, radiomics, rectal neoplasms, neoadjuvant chemoradiotherapy, meta-analysis
Citation: Liao Z, Luo D, Tang X, Huang F and Zhang X (2025) MRI-based radiomics for predicting pathological complete response after neoadjuvant chemoradiotherapy in locally advanced rectal cancer: a systematic review and meta-analysis. Front. Oncol. 15:1550838. doi: 10.3389/fonc.2025.1550838
Received: 24 December 2024; Accepted: 20 February 2025;
Published: 10 March 2025.
Edited by:
Morgan Michalet, Institut du Cancer de Montpellier (ICM), FranceReviewed by:
Giulio Aniello Santoro, Ospedale di Treviso, ItalyCopyright © 2025 Liao, Luo, Tang, Huang and Zhang. This is an open-access article distributed under the terms of the Creative Commons Attribution License (CC BY). The use, distribution or reproduction in other forums is permitted, provided the original author(s) and the copyright owner(s) are credited and that the original publication in this journal is cited, in accordance with accepted academic practice. No use, distribution or reproduction is permitted which does not comply with these terms.
*Correspondence: Xuhui Zhang, enhoMjEwOUAxNjMuY29t
Disclaimer: All claims expressed in this article are solely those of the authors and do not necessarily represent those of their affiliated organizations, or those of the publisher, the editors and the reviewers. Any product that may be evaluated in this article or claim that may be made by its manufacturer is not guaranteed or endorsed by the publisher.
Research integrity at Frontiers
Learn more about the work of our research integrity team to safeguard the quality of each article we publish.