 Yan Deng1,2†
 Haopeng Yu
 Zixing Huang
 Bin Song
94% of researchers rate our articles as excellent or good
Learn more about the work of our research integrity team to safeguard the quality of each article we publish.
Find out more
ORIGINAL RESEARCH article
Front. Oncol. , 04 March 2025
Sec. Gastrointestinal Cancers: Hepato Pancreatic Biliary Cancers
Volume 15 - 2025 | https://doi.org/10.3389/fonc.2025.1525835
Purpose: To develop a nomogram based on CT radiomics features for preoperative prediction of perineural invasion (PNI) in pancreatic ductal adenocarcinoma (PDAC) patients.
Methods: A total of 217 patients with histologically confirmed PDAC were enrolled in this retrospective study. Radiomics features were extracted from the whole tumor. Univariate analysis, least absolute shrinkage and selection operator and logistic regression were applied for feature selection and radiomics model construction. Finally, a nomogram combining the radiomics score (Rad-score) and clinical characteristics was established. Receiver operating characteristic curve analysis, calibration curve analysis and decision curve analysis (DCA) were used to evaluate the predictive performance of the nomogram.
Results: According to multivariate analysis, CT features, including the radiologists evaluated PNI status based on CECT (CTPNI) (OR=1.971 [95% CI: 1.165, 3.332], P=0.01), the lymph node status determined on CECT (CTLN) (OR=2.506 [95%: 1.416, 4.333], P=0.001) and the Rad-score (OR=3.666 [95% CI: 2.069, 6.494], P<0.001), were significantly associated with PNI. The area under the receiver operating characteristic curve (AUC) for the nomogram combined with the Rad-score, CTLN and CTPNI achieved favorable discrimination of PNI status, with AUCs of 0.846 and 0.778 in the training and testing cohorts, respectively, which were superior to those of the Rad-score (AUC of 0.720 in the training cohort and 0.640 in the testing cohort) and CTPNI (AUC of 0.610 in the training cohort and 0.675 in the testing cohort). The calibration plot and decision curve showed good results.
Conclusion: The CT-based radiomics nomogram has the potential to accurately predict PNI in patients with PDAC.
Pancreatic ductal adenocarcinoma (PDAC) is the third leading cause of cancer-related death, and 66,440 new cases and 51,750 new deaths are estimated to occur in 2024 (1). Radical resection is the only effective means for treatment, but fewer than 20% of patients are able to undergo surgery at the time of diagnosis, and early recurrence and metastasis frequently occur after radical resection (2).
PDAC is characterized by perineural growth, and its incidence is 43.2%-100% (3). Perineural invasion (PNI) is related to the dissemination and metastasis of PDAC and is an independent risk factor for patient prognosis (4–6). A previous study showed that patients who received neoadjuvant therapy had a significantly lower PNI than did those who did not receive neoadjuvant therapy (7). Felsenstein et al. demonstrated that adjuvant chemotherapy improved the prognosis in patients with PNI-positive PDAC but not in those with PNI-negative disease (8). In addition, the PNI status affects whether the Heidelberg procedure is performed (9). The assessment of PNI currently relies on histopathology following surgery; however, preoperative knowledge of PNI status holds clinical significance because it has the potential to aid clinicians in identifying high-risk categories beforehand, formulating personalized treatment plans, and ultimately improving patient outcomes.
Contrast-enhanced CT (CECT) is the first-line imaging method for the diagnosis, staging and evaluation of the therapeutic effect of PDAC (10) and has been applied for operatively evaluating PNI in PDAC (11). Previous studies (12–14) have evaluated PNI of PDAC via qualitative methods and established criteria for CECT; however, few study objectively evaluated PNI on CECT. Guo et al. (15) established a quantitative method based on the minimum distance between the tumor boundary and adjacent arteries, but the tumor boundary is difficult to define and may affect the measurement results.
Radiomics can noninvasively and rapidly obtain diagnostic, prognostic and treatment information from medical images to support clinical decision-making. This information can be used as a complementary tool to verify clinical and imaging results (16–18). Radiomics has been applied to evaluate lymph node (LN) metastasis and assess the prognosis of PDAC patients (19–21). Several CT/MRI-based radiomics models for predicting PNI have been introduced for rectal cancer and gastric cancer patients, and they have achieved satisfactory results (22, 23). However, few studies evaluated PNI preoperatively in patients with PDAC based on CT radiomics.
The aim of this study was to develop and validate a nomogram based on CT radiomics features and clinical characteristics for the preoperative prediction of PNI in PDAC patients.
This retrospective study was approved by the institutional review board at West China Hospital, Sichuan, China (IRB number: 2023-0003), and the requirement for written informed consent was waived. It performed in accordance with Declaration of Helsinki.
A total of 335 patients with PDAC who underwent CT at our hospital between September 2021 and February 2023 were enrolled in this retrospective study. The inclusion criteria were as follows: (1) underwent radical resection, and preoperative CECT images were available at our institution, (2) primary PDAC and definite PNI were confirmed by histopathology, and (3) complete clinicopathological information was available. The exclusion criteria were as follows: (1) lesions that were too small (less than 1 cm) or of poor image quality that did not meet diagnostic criteria, (2) preoperative neoadjuvant therapy such as radiotherapy or chemotherapy, (3) more than 30 days between the preoperative CT scan and surgery, or (4) other retroperitoneal tumors. Finally, 217 patients with PDAC were enrolled (99 PNI-negative patients and 118 PNI-positive patients), and the patients were randomly divided into a training cohort (n = 151) and a validation cohort (n = 66) at a ratio of 7:3 (Figure 1).

Figure 1. Flow chart of patient recruitment. CECT, contrast-enhanced computed tomography; PDAC, Pancreatic ductal adenocarcinoma; PNI, Perineural invasion.
Demographic information, including age and sex, was collected. The carbohydrate antigen 19-9 (CA19-9) and carcinoembryonic antigen (CEA) levels before surgery were recorded.
PNI is defined as a tumor located near a nerve, with tumor cells located in at least 33% of the nerve perimeter or in any of the three layers of the nerve sheath (24–26).
The abdominal CT scanning parameters and contrast agents used are described in detail in Supplementary A1 in Supplementary Data Sheet 1.
Two radiologists with six and eight years of experience in abdominal imaging who were blinded to the pathologic details reviewed the CT images and evaluated the following features: radiologists evaluated PNI status based on CECT (CTPNI), lymph node status determined on CECT (CTLN), location and size of the tumor, and dilatation of the common bile duct and the main pancreatic duct. Discrepancies between observers were resolved by consensus, and further analysis was performed using consensus interpretation. Interagreement between the two reviewers was evaluated by calculating the intraclass correlation coefficient (ICC) for continuous variables and Cohen’s kappa value for categorical variables.
CTPNI was defined as the disappearance of the peripancreatic fat space or peripancreatic vascular space (including the common hepatic artery, superior mesenteric artery, superior mesenteric vein, celiac artery and splenic vessels) or the appearance of ribbon-like, reticular soft tissue density shadows or irregular mass shadows (27).If any of the following conditions were met, the CTLN was evaluated as positive: the short diameter of the LN was more than 10 mm, the density was uneven, the enhancement was uneven, internal necrosis occurred, the LN was fused, the boundary of the LN was unclear, or the LN invaded adjacent organs or blood vessels (28).
The location and size of the tumor were recorded based on preoperative CT. The location of the tumor was defined as the head on the right side, the neck in front, or the body or tail on the left side according to the confluence of the portal vein and the superior mesenteric vein. The size of the tumor was measured at the axial level according to the largest cross section of the lesion. Tumor size was calculated as the mean of two measurements for further analysis.
A common bile duct (CBD) diameter greater than 10 mm and a main pancreatic duct (MPD) diameter greater than 2 mm were defined as dilated (29).
Two experienced radiologists in abdominal imaging (with six and eight years of experience from Reader 1 and Reader 2, respectively) manually and independently and blindly sketched the lesion slice by slice along the edge to the results from 30 randomly selected patients based on the arterial and portal venous images of CECT, avoiding the CBD and vessels. Reader 1 sketched the lesion twice, with an interval of more than 1 week, for calculating intra-agreement. Reader 1 and Reader 2 blindly and independently delineated the lesion to measure the interagreement. Then, the sketch of all patients was completed by reader 1. This process was implemented on the open source software IBEX (β1.0, http://bit.ly/IBEX_MDAnderson), which runs on MATLAB 2013a. Due to the variability problems caused by voxel size and gray level dependence, it is unrealistic that all radiomics features achieve satisfactory agreement. The ICC was used to assess intraobserver and interobserver agreement. An ICC greater than 0.75 was considered to indicate good consistency.
The gray level cooccurrence matrix (GLCM), gray level runlength matrix (GLRLM), intensity histogram (IH), intensity direct (ID) and shape feature groups were extracted from IBEX. Based on the arterial and portal venous phase, 404 radiomics features were extracted respectively and a total of 808 radiomics features were extracted for analysis. The detail of Feature extraction in Supplementary S1 in Supplementary Data Sheet 1. Resampling was applied for preprocessing to eliminate images with different scanning parameters and slice thicknesses (30). The Z score was used to eliminate the effect of the data dimension. The radiomics workflow is shown in Figure 2. The detail of preprocessing methods for the image and data in Supplementary S2 in Supplementary Data Sheet 1.
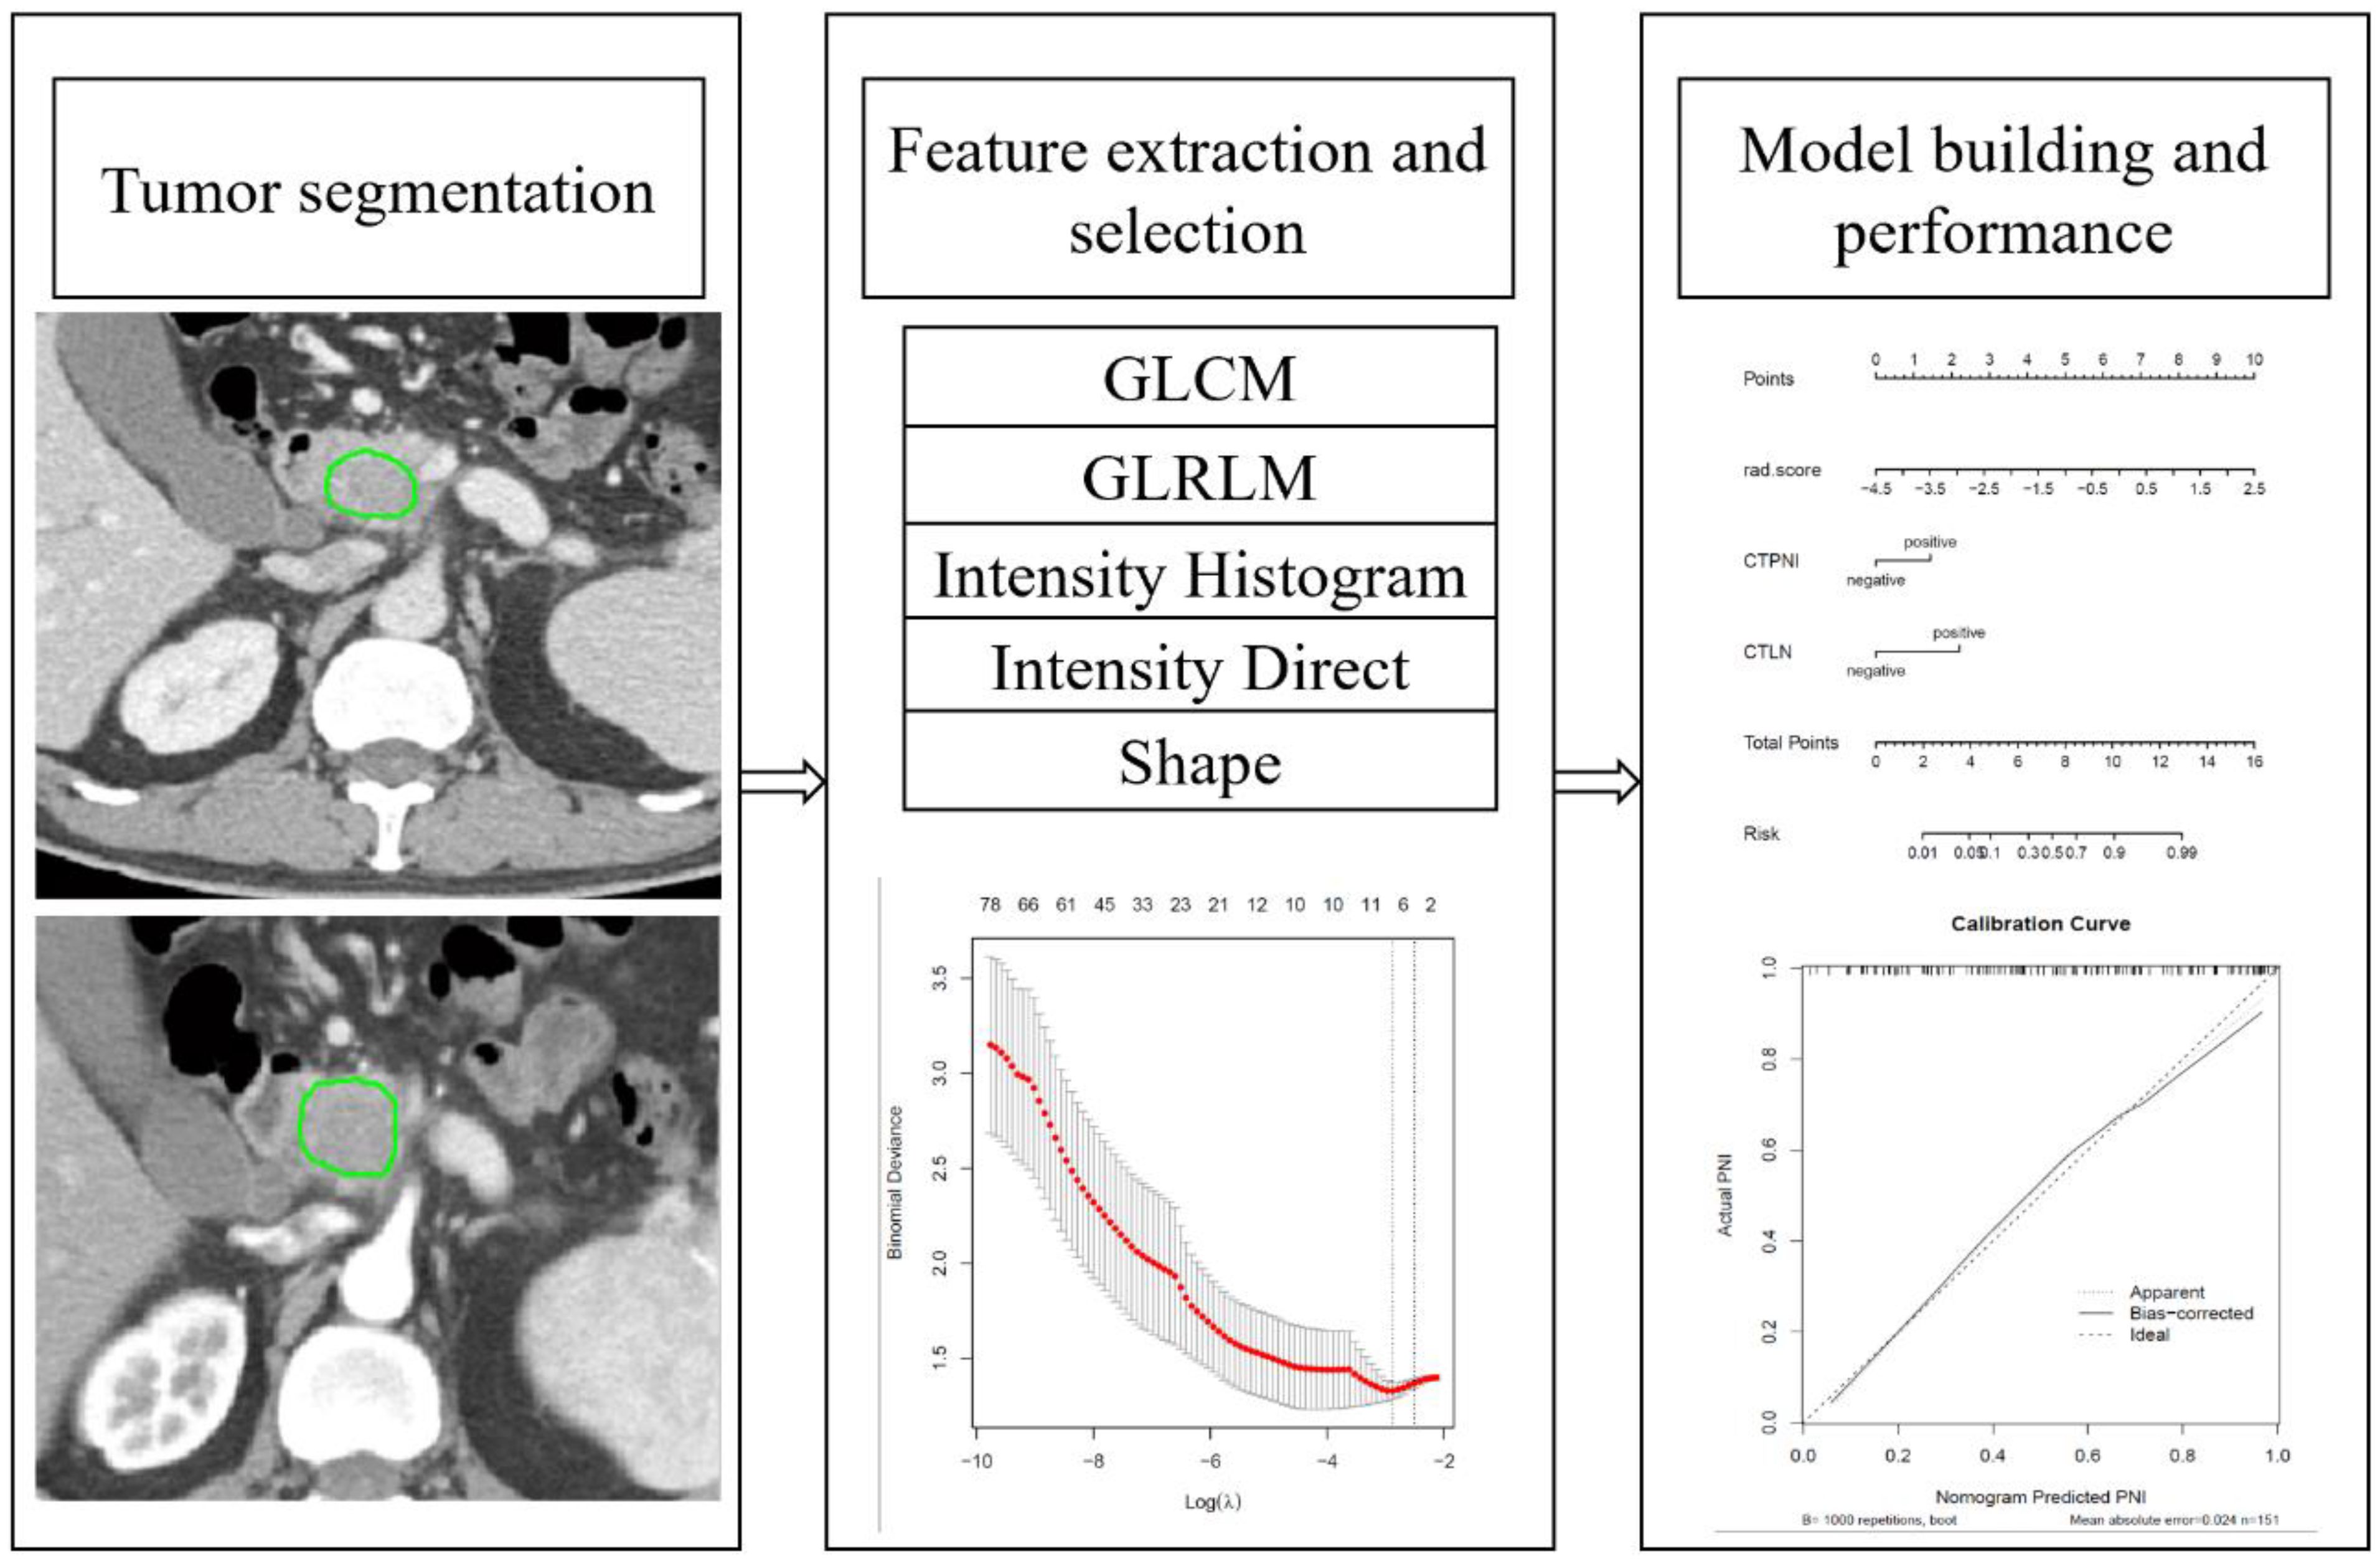
Figure 2. Radiomics workflow. GLCM: Gray-level cooccurrences matrix. GLRLM: Gray-level run-length matrix.
The features extracted from arterial phase and portal phase were combined for dimension reduction analysis. Two steps were adopted for reducing the dimensions and identifying robust radiomics features in the training cohort. Univariate analysis with an independent samples t test or the Mann-Whitney U test was first applied to select potentially important features. Subsequently, the least absolute shrinkage and selection operator (LASSO) method was applied using tenfold cross-validation for feature selection. Lambda was selected according to the 1-standard error of the minimum criterion (1-SE criterion, a simpler model). The selected optimal radiomics features were weighted by their respective coefficients and a linear combination to obtain the corresponding radiomics score (Rad-score) in the training and testing cohorts.
The significantly different features were used to construct a nomogram for both the training and testing cohorts. The area under the receiver operating characteristic (ROC) curve (AUC), accuracy, sensitivity and specificity were calculated to assess the performance of the nomogram model. A calibration curve was used to evaluate the agreement between the predicted probability of PNI and the actual probability of PNI. The clinical utility of the model was evaluated by a decisive curve.
Statistical analyses of clinical characteristics were conducted with SPSS (statistics 26). The remaining statistical analyses were implemented in R (version 4.3.1, https://www.r-project.org/). A significant difference was considered at P<0.05. Categorical variables were analyzed using the chi-square test or Fisher’s exact test. Continuous variables were analyzed by the independent samples t test or the Mann-Whitney U test, depending on the type of data distribution. Univariate and multivariate logistic regression analysis were used to identify independent predictors that were significantly associated with PNI.
The “glmnet” PDACkage was used for LASSO regression analysis. The “rms” PDACkage was applied for nomogram construction and calibration curve plotting. The “pROC” PDACkage and “dca. R” were used for the ROC curve and decision curve plot, respectively.
Table 1 showed the clinical data for patients in the training cohort and testing cohort. The LN status and tumor histopathological grade were significantly different between the two groups in the training cohort (P<0.05), while there was no significant difference in the testing cohort (P>0.05). The CTLN and CTPNI were significantly different in both the training and testing cohorts (P<0.05).
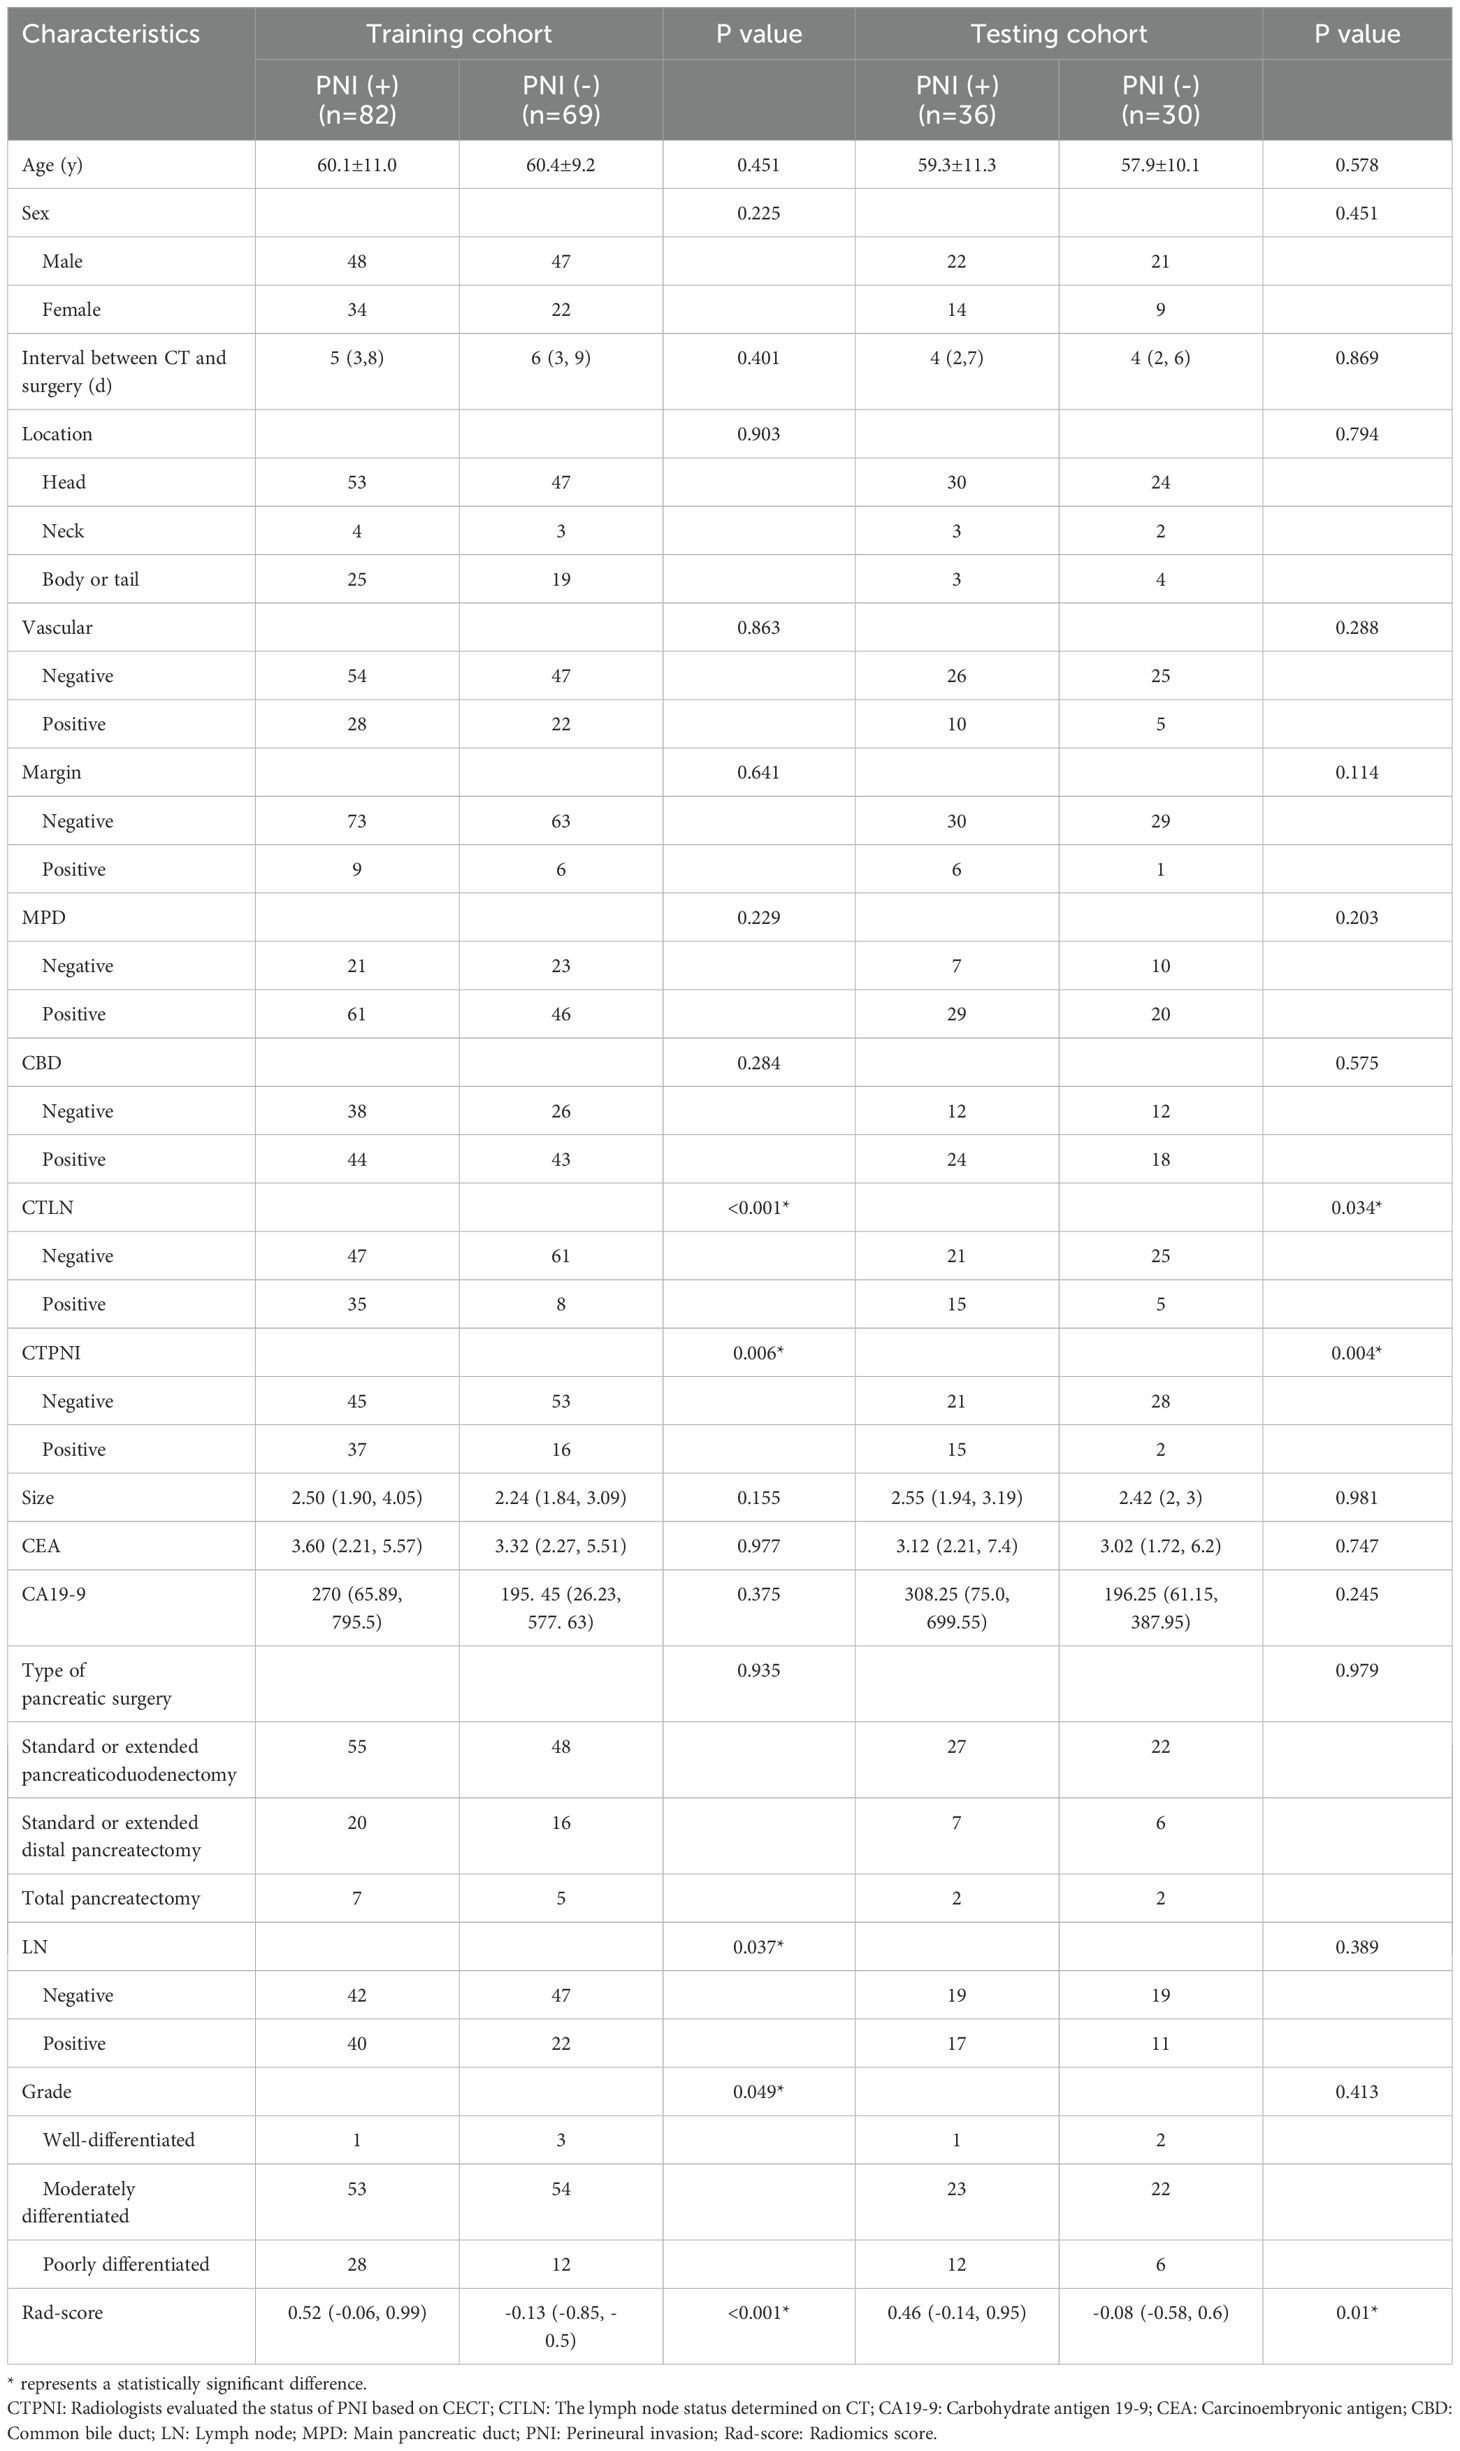
Table 1. The patients’ characteristics in the training and testing cohorts.
There was no significant difference between the training and validation cohorts in terms of the percentage of PNI-positive patients. There was no significant difference between the PNI-positive and PNI-negative groups in age, sex, CEA, CA19-9, tumor size or location, CBD or MPD dilation status, or vascular invasion or margin status in either the training or testing cohort. The ICC of the tumor size was 0.936, indicating good consistency. The kappa values of the CTPNI and CTLN were 0.723 and 0.741, respectively, with moderate consistency.
According to the univariate analysis of the training cohort, the CTPNI and CTLN were significantly associated with PNI (Table 2). According to multivariate analysis, CT features, including the CTPNI positive (OR=1.971 [95% confidence interval [CI]: 1.165, 3.332], P=0.01) and CTLN positive (OR=2.506 [95%: 1.416, 4.333], P=0.001), were significantly associated with PNI.
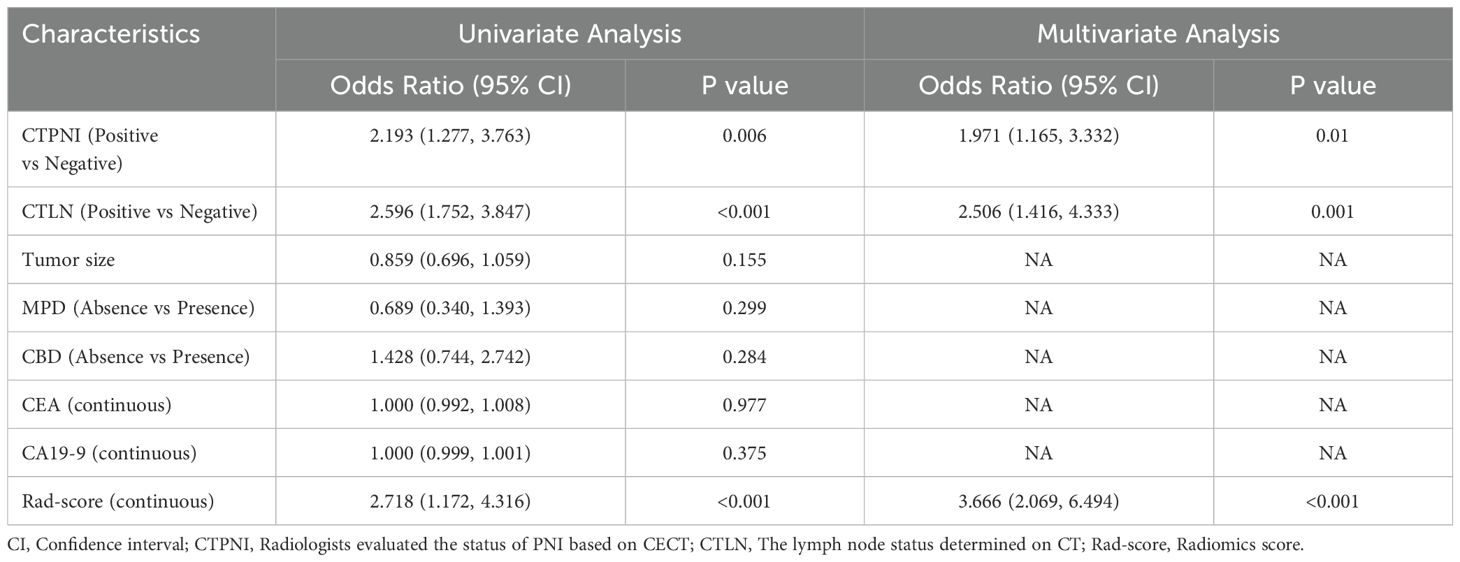
Table 2. Univariate and multivariate logistic regression analysis for PNI of PDAC.
The mean ICCs for intraobserver agreement and interobserver agreement were 0.889 (range from 0.103 to 0.995) and 0.843 (range from 0.002-0.993), respectively (Supplementary S3 and Supplementary Figure S1 in Supplementary Data Sheet 1). Ninety radiomics features were excluded because of intraobserver agreement, and 141 radiomics features were excluded because of interobserver agreement. For features with suboptimal agreement, 68 intraobserver-excluded features were included among 141 interobserver-excluded features. Ultimately, 163 radiomics features were excluded due to inferior reproducibility, and the remaining 645 radiomics features were used for the next analysis.
After univariate analysis, 91 radiomics features were significantly different between the PNI-positive and PNI-negative groups in the training cohort. The LASSO regression method with 10-fold cross-validation was applied for the remaining features selected, and 8 optimized features were chosen for constructing the model (Supplementary S4 in Supplementary Data Sheet 1). The selected radiomics features were quantitatively integrated into the Rad-score in the training and testing cohorts. According to the univariate and multivariate logistic regression analysis, the Rad-score (OR=3.666 [95% CI: 2.069, 6.494], P<0.001) was significantly related to PNI.
The Rad-score was independently associated with PNI. The AUC for the Rad-score in the training cohort (0.720, 95% CI: [0.639, 0.802]) was close to that in the testing cohort (0.640, 95% CI: 0.499, 0.781). The AUC of the CTPNI was 0.610 (95% CI: 0.536, 0.684) in the training cohort and 0.675 (95% CI: 0.582, 0.768) in the testing cohort. Using the Rad-score combined with the CTLN and CTPNI, a nomogram (Figure 3) for predicting PNI was constructed, and it achieved favorable performance both in the training cohort, with an AUC of 0.846 (95% CI: 0.785, 0.907), and in the testing cohort, with an AUC of 0.778 (95% CI: 0.666, 0.889). Comparing the AUCs of the nomogram model with those of the Rad-score and CTPNI through the DeLong test, the nomogram model achieved the best performance (P<0.05) (Figure 4). The diagnostic performance of the nomogram model, Rad-score and CTPNI in both the training and testing cohorts is summarized in Table 3. The calibration plot indicated that the predicted PNI based on the nomogram was consistent with the actual PNI (i.e., the status perineural invasion based on pathological result) probability (Figure 5A). The decision curve suggested that the nomogram model outperformed CTPNI at any threshold probability (Figure 5B). Figure 6 shows examples of the clinical application of the nomogram.
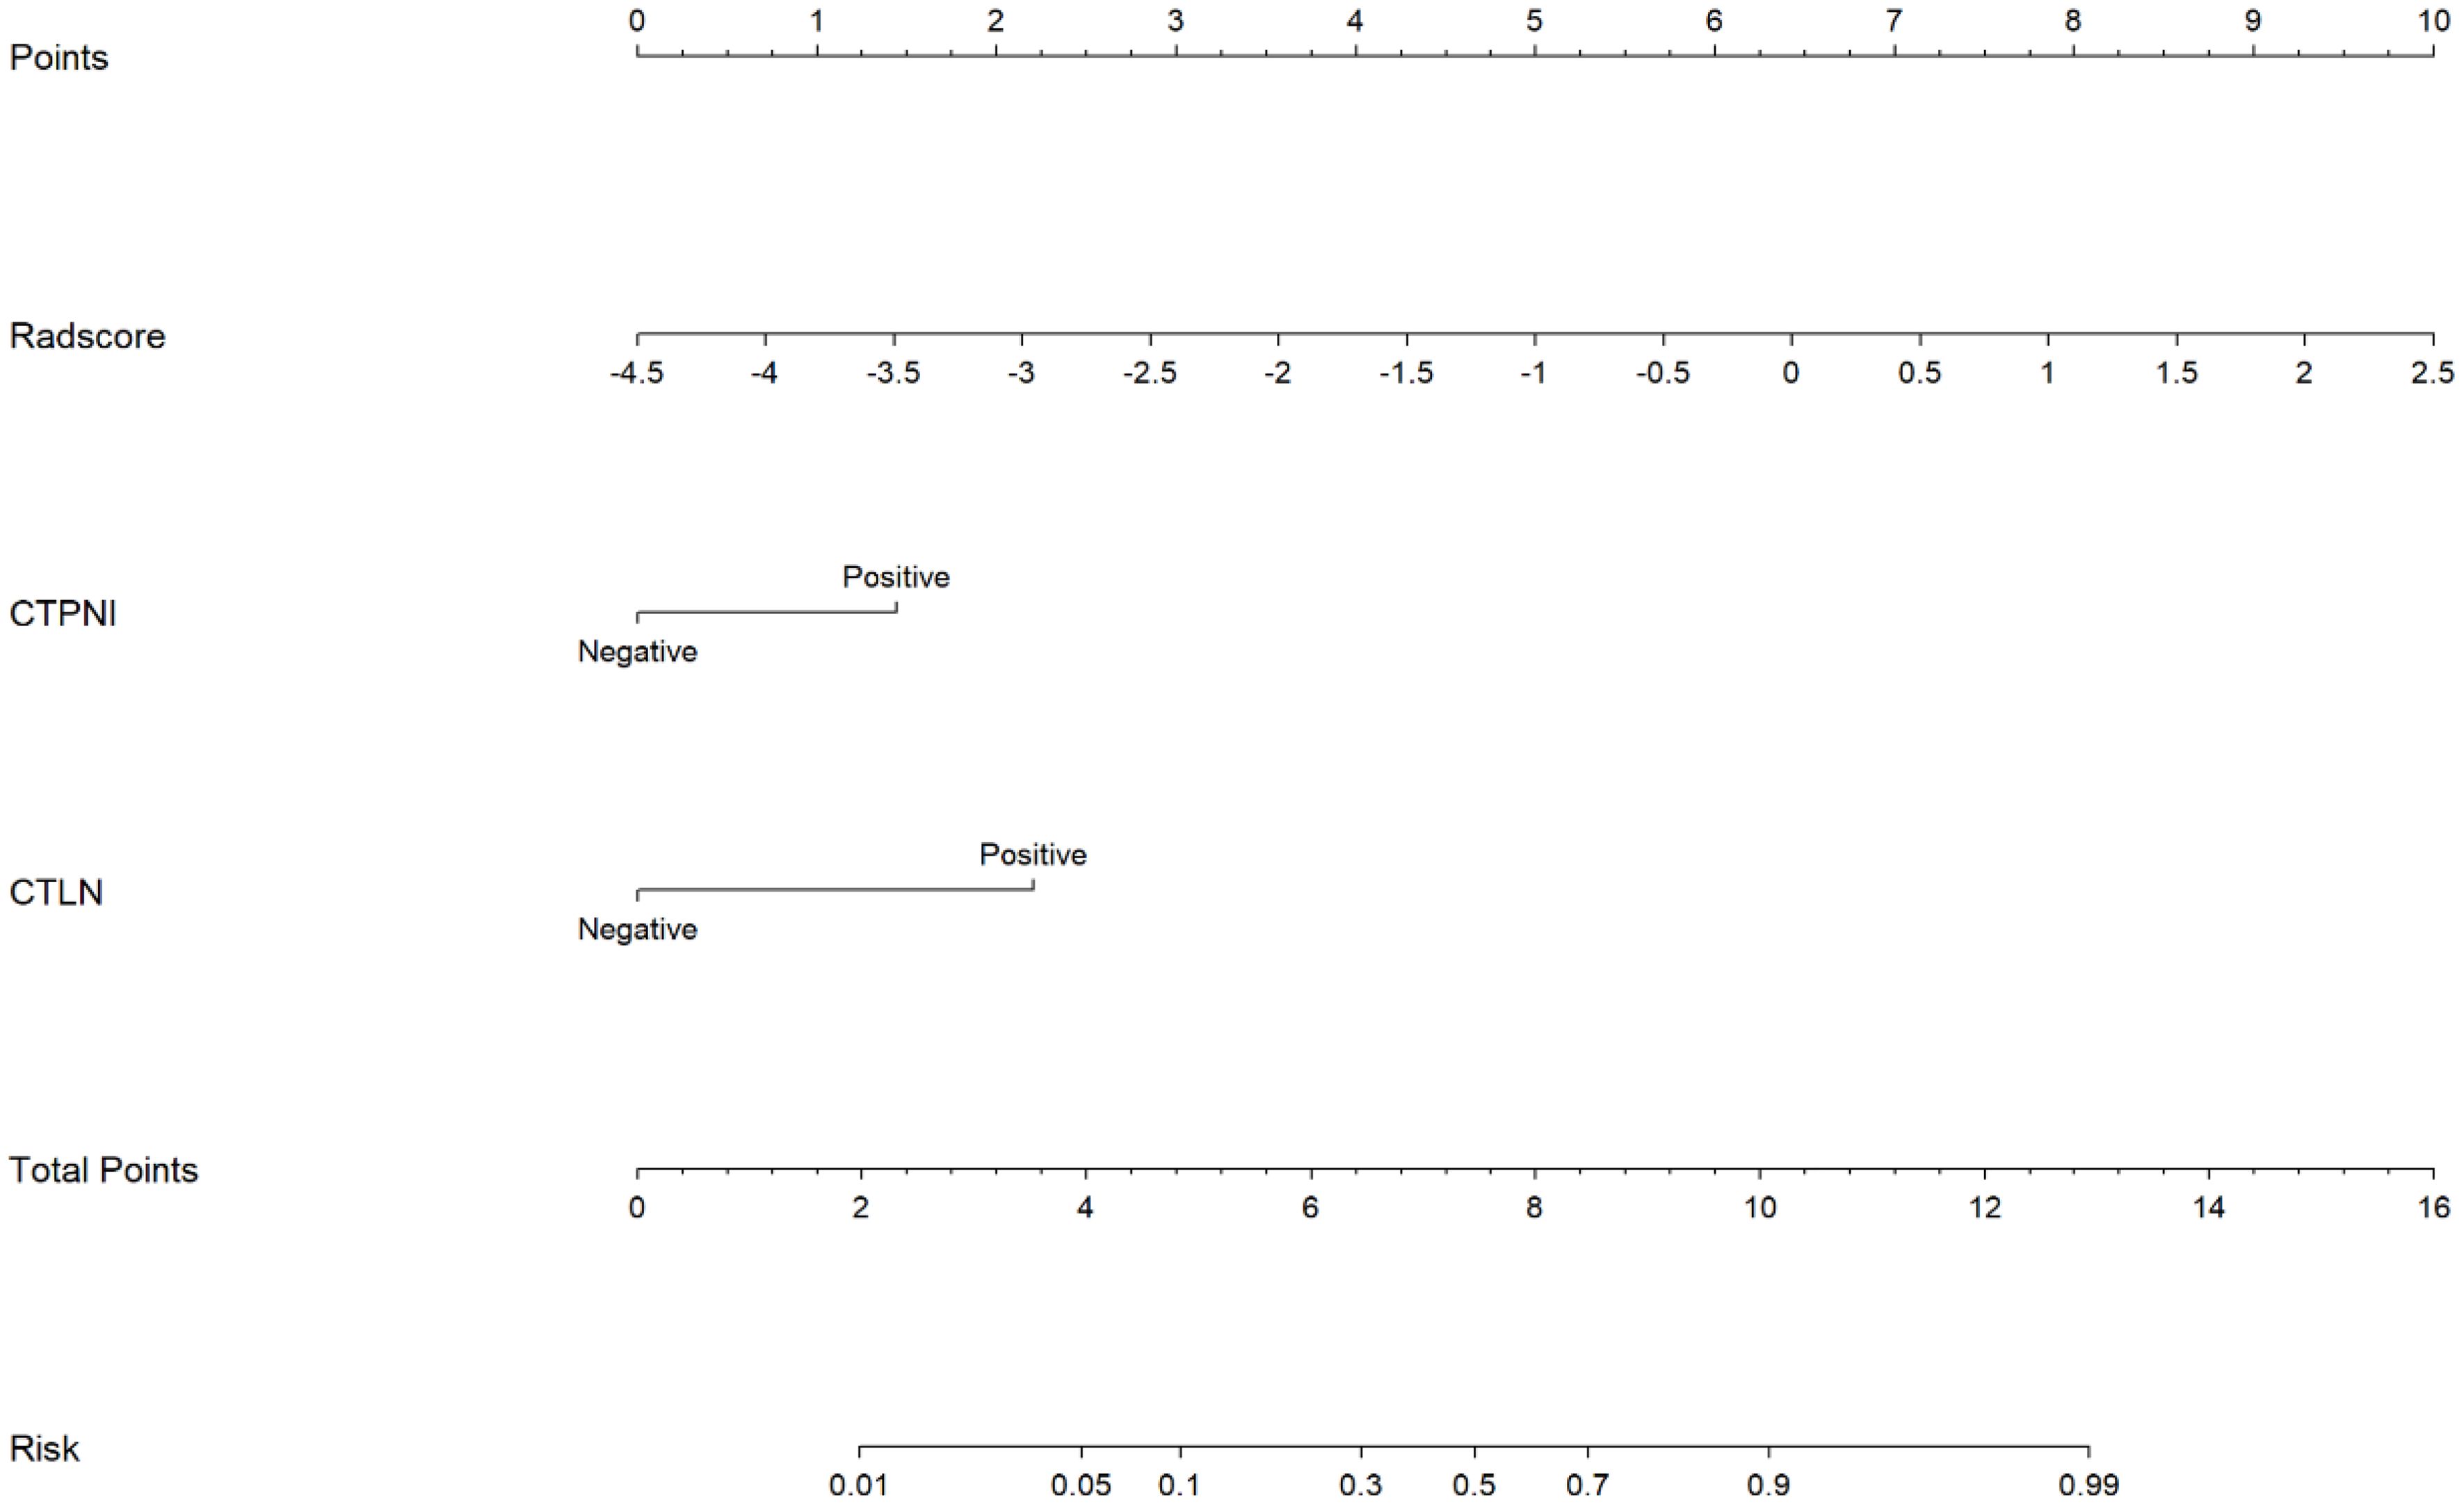
Figure 3. The nomogram for preoperatively evaluating the PNI status of PDAC patients. A nomogram combining the Rad-score, CTLN, and CTPNI for preoperative evaluation of PNI in PDAC patients. The Radscore, CTPNI and CTLN are summed to obtain the total points on the scale, and the risk of PNI in the PDAC is the corresponding number on the Risk axis. Radscore, Rad-score. CTLN; Lymph node status determined on CT; CTPNI, Radiologists evaluated the status of PNI based on CECT; PNI, Perineural invasion; PDAC, Pancreatic ductal adenocarcinoma.
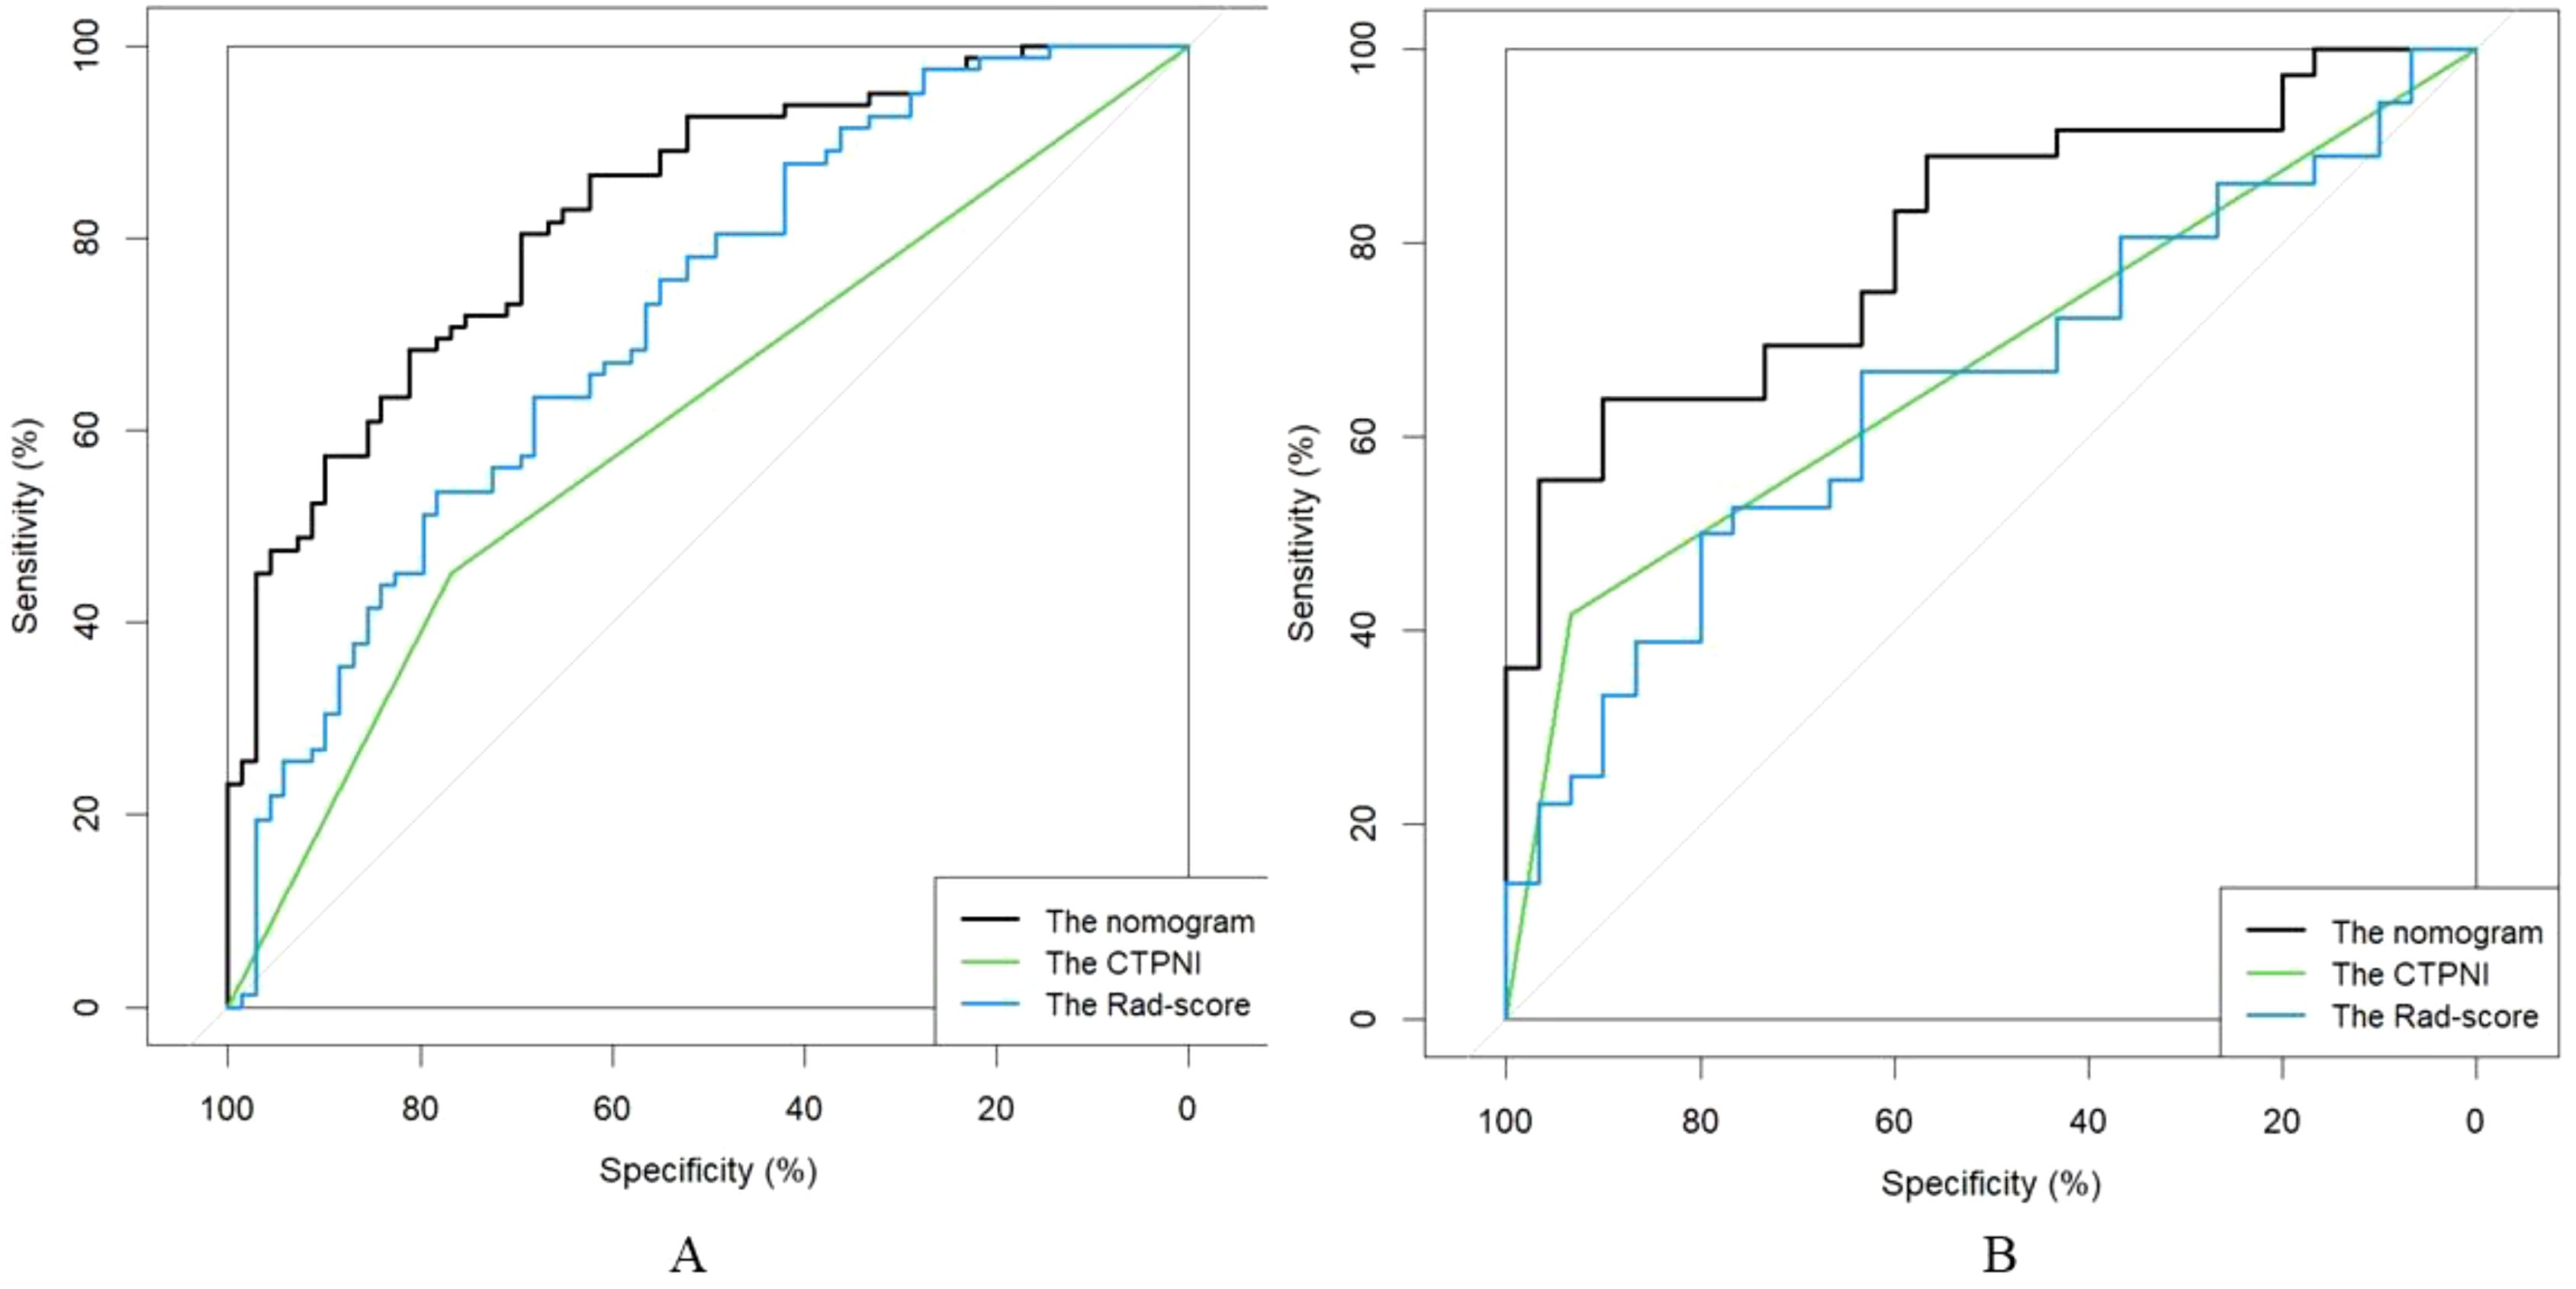
Figure 4. The ROC curve of the AUC comparison among the CTPNI model, radiomics model and Rad-clinical model. (A) The training cohort; (B) The testing cohort. ROC, Received operating characteristic; AUC, Area under the receiver operating characteristic curve; CTPNI, Radiologists evaluated the status of PNI based on CECT.
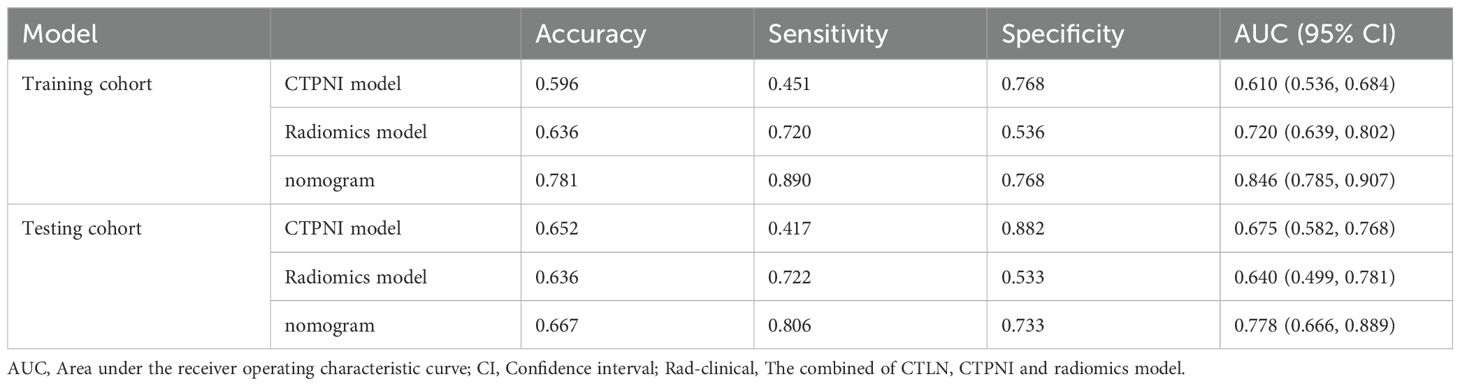
Table 3. The performance of the training and testing cohorts.
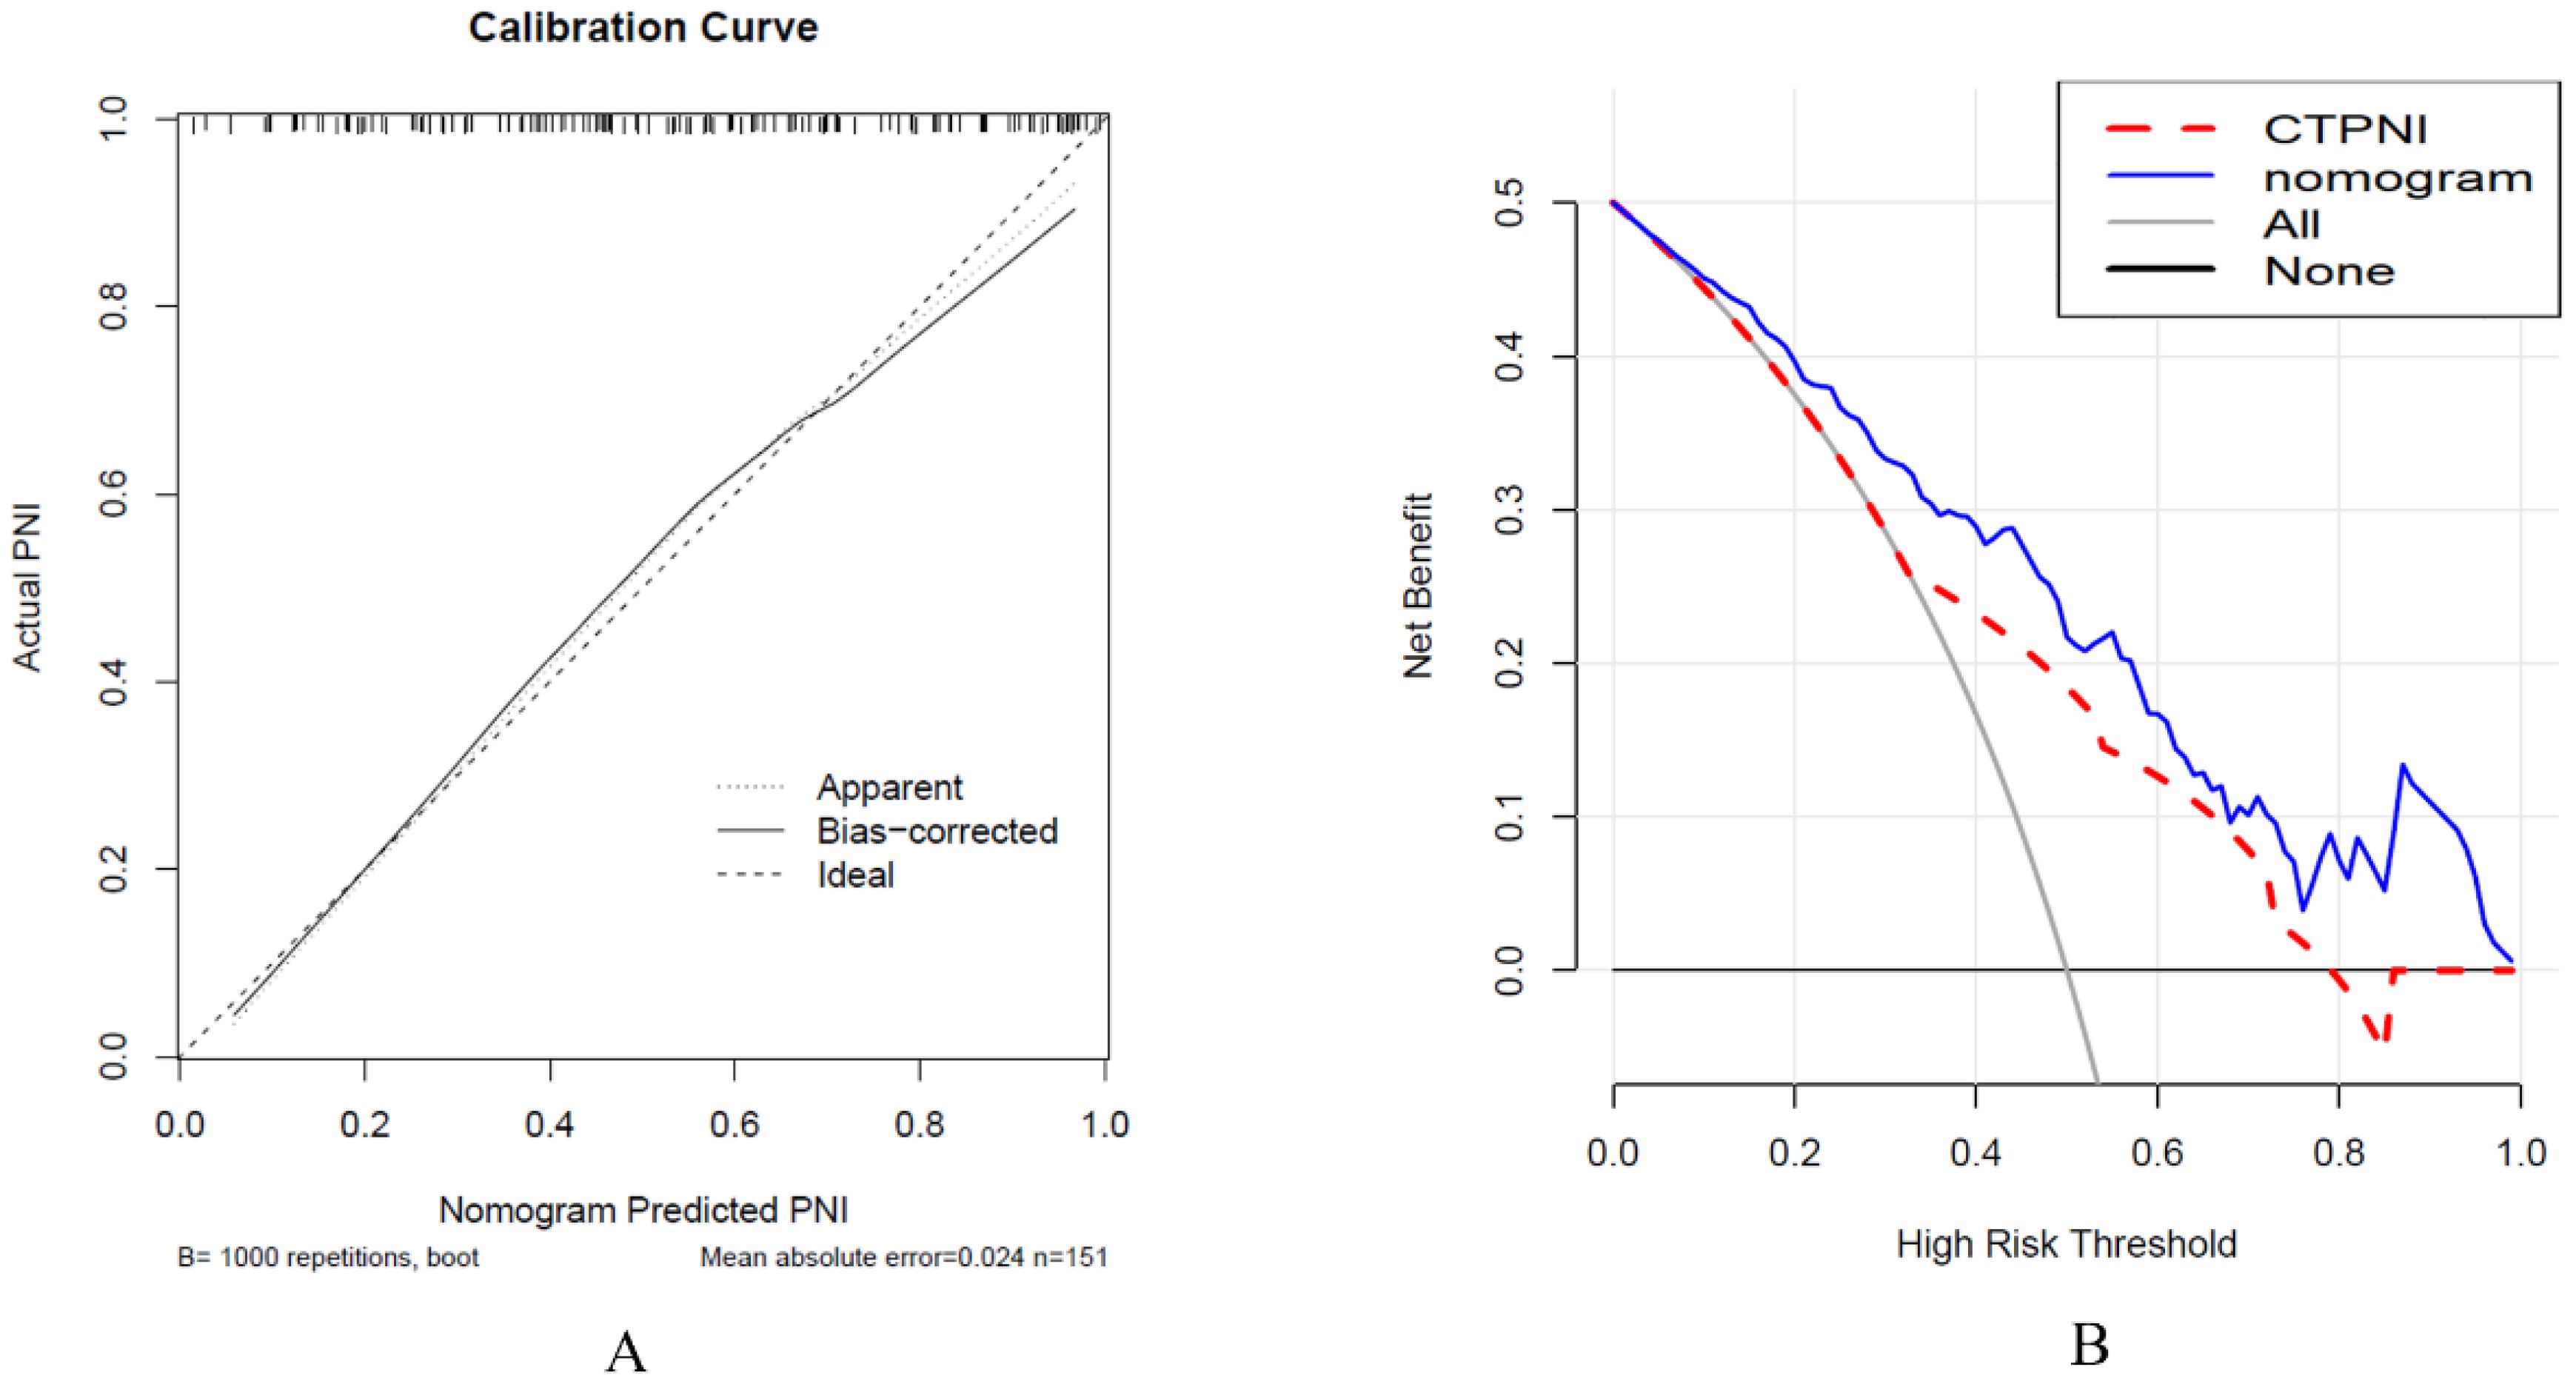
Figure 5. Calibration curve analysis was used to evaluate the nomogram performance (A), and decision curve analysis was used (B). (A) The x-axis represents the predicted PNI, and the y-axis represents the actual PNI. (B) The x-axis represents the threshold probability, and the y-axis represents the net benefit to the patient. PNI: Perineural invasion. CTPNI: Radiologists evaluated the status of PNI based on CECT.
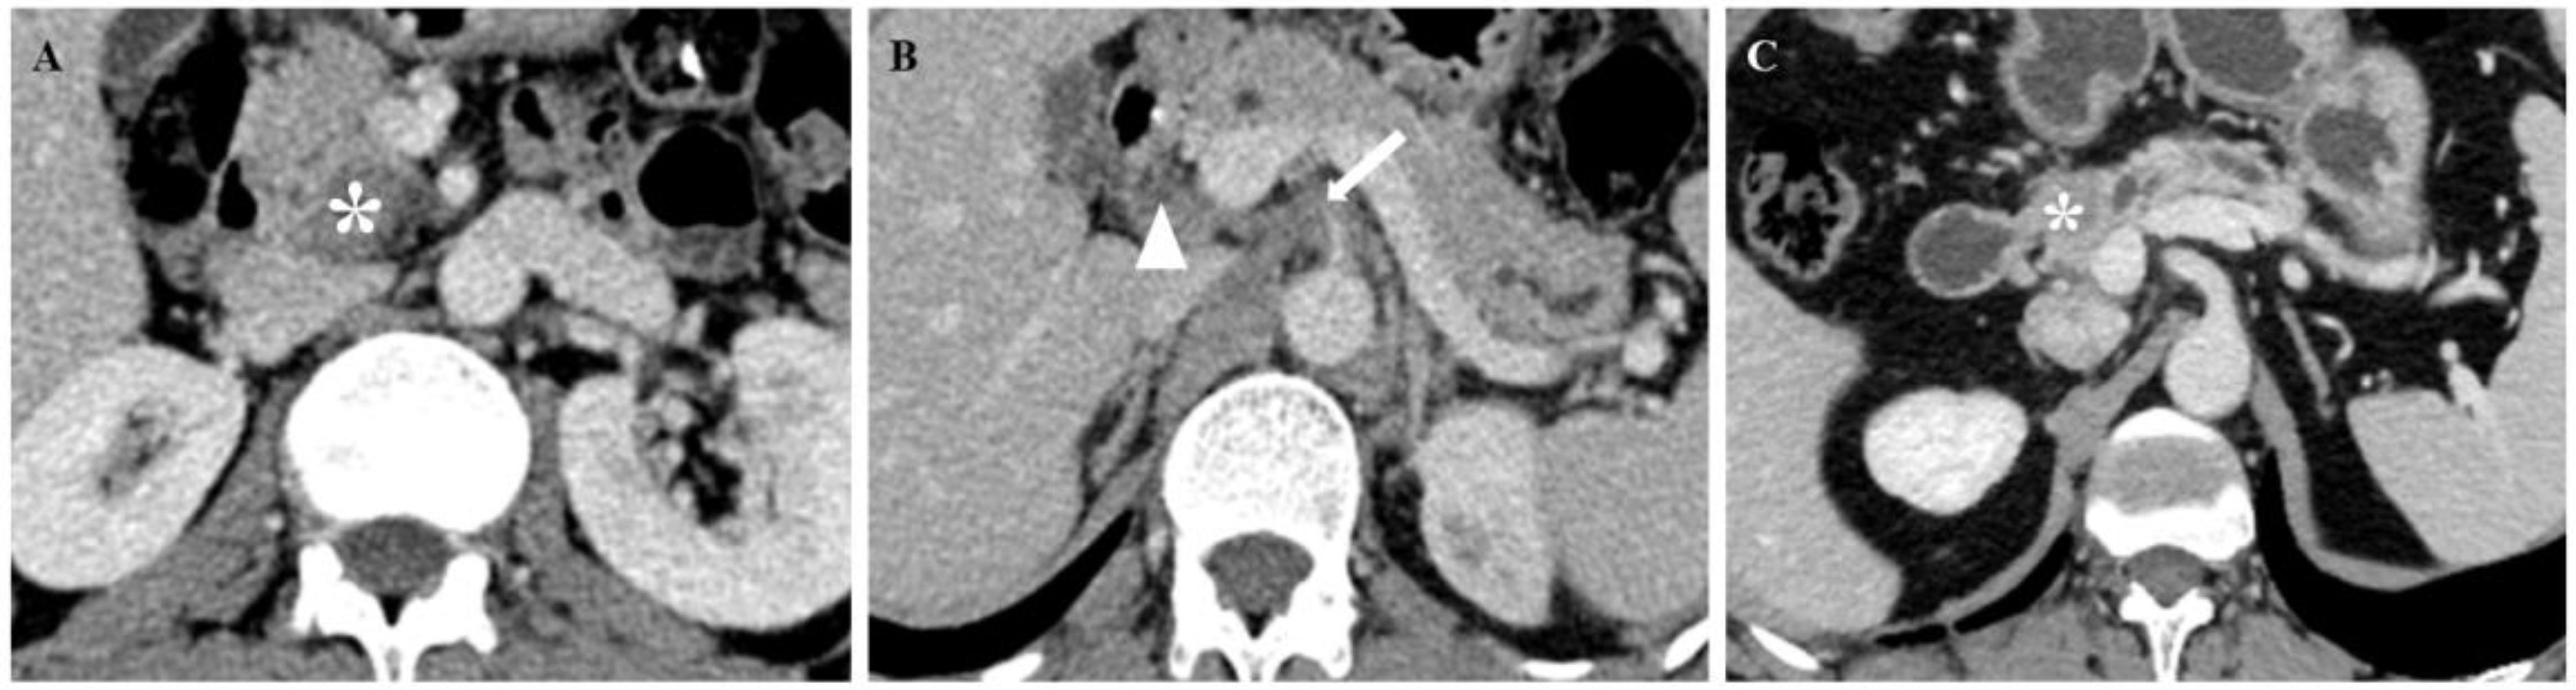
Figure 6. CT images of patients with PNI (A, B) and patients without PNI (C). (A, B) A 67-year-old man with PDAC underwent preoperative contrast-enhanced axial abdominal CT, and the CTPNI (white arrow) and CTLN (white arrowhead) were positive. The lesion (* in A) was used to calculate a Rad-score of 1.11508, and the total score was 11.75. Based on the nomogram, a probability of PNI positivity greater than 0.95 and PNI positivity was confirmed by histopathology. (C) A 73-year-old man with PDAC who underwent preoperative contrast-enhanced axial abdominal CT, CTPNI and CTLN were negative, and the Rad-score was -1.89701, as calculated by delineating the lesion (* in C). The total score was 3.6, the probability of PNI positivity was less than 0.05, and PNI negativity was confirmed by histopathology. PNI, Perineural invasion; PDAC, Pancreatic ductal adenocarcinoma; CTLN, Lymph node status determined on CT; CTPNI, Radiologists evaluated the status of PNI based on CECT.
Preoperative accurate evaluation of PNI in patients with PDAC affects the choice of appropriate treatment. Our retrospective study constructed a nomogram to preoperatively predict PNI based on the rad-score from the arterial and portal venous phases of CECT, CTLN and CTPNI. The nomogram could effectively predict the occurrence of PNI in both the training and testing groups. This study demonstrated that the nomogram was superior to the Rad-score and CTPNI for evaluating the occurrence of PNI.
The prevalence of PNI in PDAC patients is fairly high, varying from 42.3%-100% in previous reports (3), with an incidence of 54.4% in this study. Additionally, we found an interesting association between PNI status and LN status, and the PNI-positive group was more prone to LN metastasis. Previous studies have indicated that cancer cells grow along nerves in contact with LNs, indicating a complex link between LN metastasis and PNI (31, 32). There was also a statistically significant difference in the CTLNs. In addition, patients with PNI were more likely to have poor pathological differentiation. Poorly differentiated PDAC has more aggressive behavior, which is related to poor prognosis, PNI and poor differentiation and reflects the malignant biological behavior of PDAC. We did not find significant differences in tumor size; dilation status of the CBD or MPD; CEA or CA19-9 levels; or resection margin status between the PNI-positive and PNI-negative groups. The relationship between PNI and tumor size is controversial. Crippa et al. reported that the incidence of PNI increased with tumor size (33). However, Patel et al. suggested that no evidence was found between tumor size and PNI (11). PNI occurs early in PDAC, and even tumors less than 2 cm may develop PNI (34). This may be related to the greater probability of PNI due to tumor growth beyond the pancreas, while tumors within the pancreas generally do not develop PNI even if the tumor is large, based on the anatomical structure (35). These controversial results suggest that the relationship between tumor size and PNI needs further investigation. CBD and MPD dilatation caused by obstruction may not be associated with PNI. CEA and CA19-9 are nonspecific in PDAC and may be abnormal in a variety of diseases, which may account for the lack of differences in CEA and CA19-9 between the PNI-positive and PNI-negative groups.
Eight radiomics features related to PNI were selected for this study. Kulkarni et al. (36) extracted CT texture features to analyze their association with PNI and did not find any texture features related to PNI. The possible reason is that the texture features were only extracted from the maximum level of the tumor, which included incomplete features. In addition, in this study, poorly vascularized tumors located in the head of the pancreas were selected. In our study, the radiomics features of the whole lesion were extracted at the three-dimensional level, which could help to discover more biological characteristics of tumors. These selected features were integrated into a Rad-score and exhibited moderate performance in preoperatively predicting the PNI status of PDAC in both the training and testing cohorts. Radiomics can improve the prediction performance of medical images by improving analysis and using computer algorithms to extract thousands of quantitative features, and it can mine a large amount of information that is invisible to the naked eye. According to the radiologists’ evaluation, the CTPNI achieved inferior performance, which may be attributed to perivascular inflammation or fibrosis easily mimicking PNI on CT. In addition, PDAC is characterized by lymphatic growth and PNI, which are easily confused with microvessels, LN or fibrosis on CT. This may have caused the unsatisfactory agreement between the two reviewers in assessing the CTPNI and CTLN in our study.
A nomogram combining the Rad-score, CTLN and CTPNI achieved the best performance (the AUC in the testing cohort was 0.778) for the preoperative assessment of PNI in patients with PDAC. Several possible reasons may contribute to the good performance of the nomogram. One is that the Rad-score combined with arterial and portal venous phases can provide valuable information. In addition, different CT scan parameters may lead to unsatisfactory reproducibility of radiomics features, which can be maximally alleviated by using resampling as a preprocessing method, which optimizes gray dispersion to maintain the stability of features (37). Z score standardization eliminates the effect of different data dimensions. Moreover, the good performance of the nomogram was attributed to feature selection and modeling. Univariate analysis and LASSO regression confirmed that important features were selected for modeling. Tenfold validation was applied to guarantee the robustness of the model. Finally, the nomogram integrates selected radiomics features, the presence of PDAC on CT images and the experience of radiologists and combines the performance of different dimensions to better reflect the characteristics of PDAC. This result suggested that the nomogram has the potential to preoperatively predict PNI status in PDAC patients. The calibration curve revealed that the predicted PNI was in good agreement with the actual PNI probability. The decision curve indicated that the nomogram outperformed radiologists at any threshold probability.
This study has several limitations. First, this was a single-center study with a limited sample size and no external validation group. However, the number included in our study was relatively larger than that in previous studies. Therefore, the retrospective nature of the study may have led to biased results. Large sample, multicenter and prospective studies should be conducted to further verify the results. In addition, the study just delineated the tumor and extracted the radiomic features, which reflect the internal characteristics and biological behavior of the tumor. The space around the tumor was not sketched to extract additional features, which may be the reason for our modest results. The tumor and peritumoral radiomics features analysis need further study. Moreover, although several studies have reported that PNI is associated with PDAC patient prognosis, the relationship between PNI and prognosis was not clarified in this study. Subsequently, the corresponding patients should be followed up on the basis of this study to explore the ability of the nomogram to predict survival. Ultimately, there was not a consistent one-to-one match between CT evaluation and pathology.
In conclusion, a nomogram based on the rad-score derived from both the arterial and portal venous phases of CECT combined with the CTLN and CTPNI may serve as a valuable noninvasive tool for the preoperative assessment of PNI in patients with PDAC. This approach offers a practical means to classify PDAC patients before surgery and enhance patient management.
The raw data supporting the conclusions of this article will be made available by the authors, without undue reservation.
The studies involving humans were approved by The institutional review board at West China Hospital, Sichuan, China (IRB number: 2023-0003). The studies were conducted in accordance with the local legislation and institutional requirements. The ethics committee/institutional review board waived the requirement of written informed consent for participation from the participants or the participants' legal guardians/next of kin because Written informed consent was not required for this study because this is retrospective study.
YD: Methodology, Writing – original draft, Writing – review & editing. HY: Methodology, Writing – review & editing, Conceptualization, Investigation, Funding acquisition. XD: Investigation, Writing – review & editing, Data curation, Formal Analysis. LL: Data curation, Formal Analysis, Writing – review & editing. ZH: Conceptualization, Project administration, Supervision, Writing – review & editing. BS: Funding acquisition, Project administration, Supervision, Writing – review & editing.
The author(s) declare financial support was received for the research, authorship, and/or publication of this article. The authors state that this study was supported by Sichuan Science and Technology Program (Grant number 2025ZNSFSC1764), The 1.3.5 project for disciplines of excellence, West China Hospital, Sichuan University (Grant number ZYGD22004, ZYJC21012); The development project of Hainan provincial clinical medical center and postdoctoral station development project of Sana (Grant number 23CZ009).
The authors declare that the research was conducted in the absence of any commercial or financial relationships that could be construed as a potential conflict of interest.
The author(s) declare that no Generative AI was used in the creation of this manuscript.
All claims expressed in this article are solely those of the authors and do not necessarily represent those of their affiliated organizations, or those of the publisher, the editors and the reviewers. Any product that may be evaluated in this article, or claim that may be made by its manufacturer, is not guaranteed or endorsed by the publisher.
The Supplementary Material for this article can be found online at: https://www.frontiersin.org/articles/10.3389/fonc.2025.1525835/full#supplementary-material
AUC, area under the receiver operating characteristic curve; CECT, contrast-enhanced computed tomography; CTPNI, radiologists evaluated the status of PNI based on CECT; CTLN, the lymph node status determined on CT; CA19-9, carbohydrate antigen 19-9; CEA, carcinoembryonic antigen; CBD, common bile duct; GLCM, gray-level cooccurrences matrix; GLRLM, gray-level run-length matrix; IH, intensity histogram; ID, intensity direct; ICC, intraclass correlation coefficient; LASSO, least absolute shrinkage and selection operator; LN, lymph node; MPD, main pancreatic duct; PNI, perineural invasion; PDAC, pancreatic ductal adenocarcinoma; Rad-score, radiomics score; ROC, received operating characteristic.
1. Siegel RL, Giaquinto AN, Jemal A. Cancer statistics, 2024. Ca-Cancer J Clin. (2024) 74:12–49. doi: 10.3322/caac.21820
2. Suzuki S, Shimoda M, Shimazaki J, Maruyama T, Oshiro Y, Nishida K, et al. Predictive early recurrence factors of preoperative clinicophysiological findings in pancreatic cancer. Eur Surg Res. (2018) 59:329–38. doi: 10.1159/000494382
3. Schorn S, Demir IE, Haller B, Scheufele F, Reyes CM, Tieftrunk E, et al. The influence of neural invasion on survival and tumor recurrence in pancreatic ductal adenocarcinoma - A systematic review and meta-analysis. Surg Oncol. (2017) 26:105–15. doi: 10.1016/j.suronc.2017.01.007
4. Jurcak NR, Rucki AA, Muth S, Thompson E, Sharma R, Ding D, et al. Axon guidance molecules promote perineural invasion and metastasis of orthotopic pancreatic tumors in mice. Gastroenterology. (2019) 157:838–50. doi: 10.1053/j.gastro.2019.05.065
5. Huang C, Li Y, Guo Y, Zhang Z, Lian G, Chen Y, et al. MMP1/PAR1/SP/NK1R paracrine loop modulates early perineural invasion of pancreatic cancer cells. Theranostics. (2018) 8:3074–86. doi: 10.7150/thno.24281
6. Ceyhan GO, Bergmann F, Kadihasanoglu M, Altintas B, Demir IE, Hinz U, et al. Pancreatic neuropathy and neuropathic pain–a comprehensive pathomorphological study of 546 cases. Gastroenterology. (2009) 136:177–86. doi: 10.1053/j.gastro.2008.09.029
7. Chatterjee D, Katz MH, Rashid A, Wang H, Iuga AC, Varadhachary GR, et al. Perineural and intraneural invasion in posttherapy pancreaticoduodenectomy specimens predicts poor prognosis in patients with pancreatic ductal adenocarcinoma. Am J Surg Pathol. (2012) 36:409–17. doi: 10.1097/PAS.0b013e31824104c5
8. Felsenstein M, Lindhammer F, Feist M, Hillebrandt KH, Timmermann L, Benzing C, et al. Perineural invasion in pancreatic ductal adenocarcinoma (PDAC): A saboteur of curative intended therapies? J Clin Med. (2022) 11:2367. doi: 10.3390/jcm11092367
9. Schneider M, Strobel O, Hackert T, Büchler MW. Pancreatic resection for cancer-the Heidelberg technique. Langenbeck Arch Surg. (2019) 404:1017–22. doi: 10.1007/s00423-019-01839-1
10. Mizrahi JD, Surana R, Valle JW, Shroff RT. Pancreatic cancer. Lancet. (2020) 395:2008–20. doi: 10.1016/S0140-6736(20)30974-0
11. Patel BN, Giacomini C, Jeffrey RB, Willmann JK, Olcott E. Three-dimensional volume-rendered multidetector CT imaging of the posterior inferior pancreaticoduodenal artery: its anatomy and role in diagnosing extrapancreatic perineural invasion. Cancer Imaging. (2013) 13(4):580–90. doi: 10.1102/1470-7330.2013.0051
12. Patel BN, Olcott E, Jeffrey RB. Extrapancreatic perineural invasion in pancreatic adenocarcinoma. Abdom Radiol. (2018) 43:323–31. doi: 10.1007/s00261-017-1343-9
13. Deshmukh SD, Willmann JK, Jeffrey RB. Pathways of extrapancreatic perineural invasion by pancreatic adenocarcinoma: evaluation with 3D volume-rendered MDCT imaging. Am J Roentgenol. (2010) 194:668–74. doi: 10.2214/AJR.09.3285
14. Chang ST, Jeffrey RB, Patel BN, DiMaio MA, Rosenberg J, Willmann JK, et al. Preoperative multidetector CT diagnosis of extrapancreatic perineural or duodenal invasion is associated with reduced postoperative survival after pancreaticoduodenectomy for pancreatic adenocarcinoma: preliminary experience and implications for patient care. Radiology. (2016) 281:816–25. doi: 10.1148/radiol.2016152790
15. Guo X, Gao S, Yu J, Zhou Y, Gao C, Hao J. The imaging features of extrapancreatic perineural invasion (EPNI) in pancreatic Cancer:A comparative retrospective study. Pancreatology. (2021) 21:1516–23. doi: 10.1016/j.pan.2021.08.010
16. Gillies RJ, Kinahan PE, Hricak H. Radiomics: images are more than pictures, they are data. Radiology. (2016) 278:563–77. doi: 10.1148/radiol.2015151169
17. Lambin P, Leijenaar R, Deist TM, Peerlings J, de Jong E, van Timmeren J, et al. Radiomics: the bridge between medical imaging and personalized medicine. Nat Rev Clin Oncol. (2017) 14:749–62. doi: 10.1038/nrclinonc.2017.141
18. Tomaszewski MR, Gillies RJ. The biological meaning of radiomic features. Radiology. (2021) 298:505–16. doi: 10.1148/radiol.2021202553
19. Li K, Yao Q, Xiao J, Li M, Yang J, Hou W, et al. Contrast-enhanced CT radiomics for predicting lymph node metastasis in pancreatic ductal adenocarcinoma: a pilot study. Cancer Imaging. (2020) 20:12. doi: 10.1186/s40644-020-0288-3
20. Yao J, Cao K, Hou Y, Zhou J, Xia Y, Nogues I, et al. Deep learning for fully automated prediction of overall survival in patients undergoing resection for pancreatic cancer: A retrospective multicenter study. Ann Surg. (2023) 278:e68–79. doi: 10.1097/SLA.0000000000005465
21. Du D, Feng H, Lv W, Ashrafinia S, Yuan Q, Wang Q, et al. Machine learning methods for optimal radiomics-based differentiation between recurrence and inflammation: application to nasopharyngeal carcinoma post-therapy PET/CT images. Mol Imaging Biol. (2020) 22:730–8. doi: 10.1007/s11307-019-01411-9
22. Zheng H, Zheng Q, Jiang M, Han C, Yi J, Ai Y, et al. Contrast-enhanced CT based radiomics in the preoperative prediction of perineural invasion for patients with gastric cancer. Eur J Radiol. (2022) 154:110393. doi: 10.1016/j.ejrad.2022.110393
23. Chen J, Chen Y, Zheng D, Pang P, Zhang H, Zheng X, et al. Pretreatment MR-based radiomics nomogram as potential imaging biomarker for individualized assessment of perineural invasion status in rectal cancer. Abdom Radiol. (2021) 46:847–57. doi: 10.1007/s00261-020-02710-4
24. Makino I, Kitagawa H, Ohta T, Nakagawara H, Tajima H, Ohnishi I, et al. Nerve plexus invasion in pancreatic cancer: spread patterns on histopathologic and embryological analyses. Pancreas. (2008) 37:358–65. doi: 10.1097/mpa.0b013e31818166e6
25. Liebig C, Ayala G, Wilks JA, Berger DH, Albo D. Perineural invasion in cancer: a review of the literature. Cancer-Am Cancer Soc. (2009) 115:3379–91. doi: 10.1002/cncr.24396
26. Khristenko E, Shrainer I, Setdikova G, Palkina O, Sinitsyn V, Lyadov V. Preoperative CT-based detection of extrapancreatic perineural invasion in pancreatic cancer. Sci Rep-Uk. (2021) 11:1800. doi: 10.1038/s41598-021-81322-4
27. Mochizuki K, Gabata T, Kozaka K, Hattori Y, Zen Y, Kitagawa H, et al. MDCT findings of extrapancreatic nerve plexus invasion by pancreas head carcinoma: correlation with en bloc pathological specimens and diagnostic accuracy. Eur Radiol. (2010) 20(7):1757–67. doi: 10.1007/s00330-010-1727-5
28. Bian Y, Zheng Z, Fang X, Jiang H, Zhu M, Yu J, et al. Artificial intelligence to predict lymph node metastasis at CT in pancreatic ductal adenocarcinoma. Radiology. (2023) 306:160–9. doi: 10.1148/radiol.220329
29. Lee CJ, Scheiman J, Anderson MA, Hines OJ, Reber HA, Farrell J, et al. Risk of Malignancy in resected cystic tumors of the pancreas < or =3 cm in size: is it safe to observe asymptomatic patients? A multi-institutional report. J Gastrointest Surg. (2008) 12:234–42. doi: 10.1007/s11605-007-0381-y
30. Shafiq-Ul-Hassan M, Zhang GG, Latifi K, Ullah G, Hunt DC, Balagurunathan Y, et al. Intrinsic dependencies of CT radiomic features on voxel size and number of gray levels. Med Phys. (2017) 44:1050–62. doi: 10.1002/mp.12123
31. Gasparini G, Pellegatta M, Crippa S, Lena MS, Belfiori G, Doglioni C, et al. Nerves and pancreatic cancer: new insights into a dangerous relationship. Cancers (Basel). (2019) 11:893. doi: 10.3390/cancers11070893
32. Kayahara M, Nakagawara H, Kitagawa H, Ohta T. The nature of neural invasion by pancreatic cancer. Pancreas. (2007) 35(3):218–23. doi: 10.1097/mpa.0b013e3180619677
33. Crippa S, Pergolini I, Javed AA, Honselmann KC, Weiss MJ, Di Salvo F, et al. Implications of perineural invasion on disease recurrence and survival after pancreatectomy for pancreatic head ductal adenocarcinoma. Ann Surg. (2022) 276:378–85. doi: 10.1097/SLA.0000000000004464
34. Marchegiani G, Andrianello S, Malleo G, De Gregorio L, Scarpa A, Mino-Kenudson M, et al. Does size matter in pancreatic cancer?: reappraisal of tumour dimension as a predictor of outcome beyond the TNM. Ann Surg. (2017) 266:142–8. doi: 10.1097/SLA.0000000000001837
35. Tu W, Gottumukkala RV, Schieda N, Lavallée L, Adam BA, Silverman SG. Perineural invasion and spread in common abdominopelvic diseases: imaging diagnosis and clinical significance. Radiographics. (2023) 43:e220148. doi: 10.1148/rg.220148
36. Kulkarni A, Carrion-Martinez I, Jiang NN, Puttagunta S, Ruo L, Meyers BM, et al. Hypovascular pancreas head adenocarcinoma: CT texture analysis for assessment of resection margin status and high-risk features. Eur Radiol. (2020) 30:2853–60. doi: 10.1007/s00330-019-06583-0
37. Larue R, van Timmeren JE, de Jong E, Feliciani G, Leijenaar R, Schreurs W, et al. Influence of gray level discretization on radiomic feature stability for different CT scanners, tube currents and slice thicknesses: a comprehensive phantom study. Acta Oncol. (2017) 56(11):1544–53. doi: 10.1080/0284186X.2017.1351624
Keywords: pancreatic ductal adenocarcinoma, perineural invasion, computed tomography, radiomics, nomogram
Citation: Deng Y, Yu H, Duan X, Liu L, Huang Z and Song B (2025) A CT-based radiomics nomogram for the preoperative prediction of perineural invasion in pancreatic ductal adenocarcinoma. Front. Oncol. 15:1525835. doi: 10.3389/fonc.2025.1525835
Received: 10 November 2024; Accepted: 06 February 2025;
Published: 04 March 2025.
Edited by:
Abdullah Esmail, Houston Methodist Hospital, United StatesReviewed by:
Jiaxin Li, People’s Hospital of Dafang County, ChinaCopyright © 2025 Deng, Yu, Duan, Liu, Huang and Song. This is an open-access article distributed under the terms of the Creative Commons Attribution License (CC BY). The use, distribution or reproduction in other forums is permitted, provided the original author(s) and the copyright owner(s) are credited and that the original publication in this journal is cited, in accordance with accepted academic practice. No use, distribution or reproduction is permitted which does not comply with these terms.
*Correspondence: Zixing Huang, eml4aW5naHVhbmdAaG90bWFpbC5jb20=; Bin Song, c29uZ2xhYl9yYWRpb2xvZ3lAMTYzLmNvbQ==
†These authors have contributed equally to this work
Disclaimer: All claims expressed in this article are solely those of the authors and do not necessarily represent those of their affiliated organizations, or those of the publisher, the editors and the reviewers. Any product that may be evaluated in this article or claim that may be made by its manufacturer is not guaranteed or endorsed by the publisher.
Research integrity at Frontiers
Learn more about the work of our research integrity team to safeguard the quality of each article we publish.