
95% of researchers rate our articles as excellent or good
Learn more about the work of our research integrity team to safeguard the quality of each article we publish.
Find out more
ORIGINAL RESEARCH article
Front. Oncol. , 24 February 2025
Sec. Cancer Imaging and Image-directed Interventions
Volume 15 - 2025 | https://doi.org/10.3389/fonc.2025.1524634
This article is part of the Research Topic Quantitative Imaging: Revolutionizing Cancer Management with biological sensitivity, specificity, and AI integration View all 23 articles
 Dibash Basukala1,2*
 Artem Mikheev1Xiaochun Li3Judith D. Goldberg3
 Nima Gilani1Linda Moy1Katja Pinker4,5
 Savannah C. Partridge6,7
 Debosmita Biswas6,7
 Masako Kataoka8
 Maya Honda8,9
 Mami Iima8,10
 Sunitha B. Thakur2,5
 Eric E. Sigmund1,11
Introduction: The intravoxel incoherent motion (IVIM) model of diffusion weighted imaging (DWI) provides imaging biomarkers for breast tumor characterization. It has been extensively applied for both diagnostic and prognostic goals in breast cancer, with increasing evidence supporting its clinical relevance. However, variable performance exists in literature owing to the heterogeneity in datasets and quantification methods.
Methods: This work used retrospective anonymized breast MRI data (302 patients) from three sites employing three different software utilizing least-squares segmented algorithms and Bayesian fit to estimate 1st order radiomics of IVIM parameters perfusion fraction (fp), pseudo-diffusion (Dp) and tissue diffusivity (Dt). Pearson correlation (r) coefficients between software pairs were computed while logistic regression model was implemented to test malignancy detection and assess robustness of the IVIM metrics.
Results: Dt and fp maps generated from different software showed consistency across platforms while Dp maps were variable. The average correlation between the three software pairs at three different sites for 1st order radiomics of IVIM parameters were Dtmin/Dtmax/Dtmean/Dtvariance/Dtskew/Dtkurt: 0.791/0.891/0.98/0.815/0.697/0.584; fpmax/fpmean/fpvariance/fpskew/fpkurt: 0.615/0.871/0.679/0.541/0.433; Dpmax/Dpmean/Dpvariance/Dpskew/Dpkurt: 0.616/0.56/0.587/0.454/0.51. Correlation between least-squares algorithms were the highest. Dtmean showed highest area under the ROC curve (AUC) with 0.85 and lowest coefficient of variation (CV) with 0.18% for benign and malignant differentiation using logistic regression. Dt metrics were highly diagnostic as well as consistent along with fp metrics.
Discussion: Multiple 1st order radiomic features of Dt and fp obtained from a heterogeneous multi-site breast lesion dataset showed strong software robustness and/or diagnostic utility, supporting their potential consideration in controlled prospective clinical trials.
Breast cancer remains a leading cause of cancer-related deaths in women in the U.S (1). Diffusion weighted MRI (DW-MRI or DWI) provides biomarkers for cancer diagnosis and characterization (2–6), and has been demonstrated to distinguish benign and malignant breast lesions (7–10) without using contrast agents.
Intravoxel incoherent motion (IVIM) (11–13), an advanced DWI technique allows simultaneous quantification of diffusion and perfusion properties of the tissue. IVIM is sensitive to cellularity and microvascular flow and there is a growing evidence base of its clinical utility for both diagnostic and prognostic goals in the setting of breast cancer (14–18). IVIM uses a biexponential function (see Equation 1.1) to describe the diffusion signal decay over different b-values to estimate tissue diffusivity (Dt), pseudo-diffusion (Dp), and perfusion fraction (fp). These IVIM coefficients serve as biomarkers for the identification of different tumor biologic characteristics. Specifically, Dt is sensitive to restrictions to Brownian water motion such as cell membranes, fibrosis, or macromolecules. fp reflects the volume fraction of faster microcirculation, often originating from the microvascular space. Finally, Dp reflects the apparent diffusion process in the microcirculatory space which is impacted by both fluid flow speed and vascular architecture. For the specific case of breast cancer, malignant tumors often exhibit lower Dt values due to higher cellularity, higher fp due to higher vascularity and lower Dp due to slower blood velocity compared to benign lesions.
One obstacle to clinical implementation is the variability of algorithms and tools used to determine the IVIM metrics, which can introduce corresponding variability in clinical performance. For example, most IVIM parameters’ estimation is based on nonlinear least squares (19, 20), segmented least squares fitting (17, 21–23), or the Bayesian (24–27) approach. More recently, deep learning (DL) based approaches have gained significant attention for their mitigation of acquisition (28) and noise-induced variability compared to traditional methods, especially for fp and Dp (29–32). Furthermore, most prior studies calculated IVIM coefficients based on the mean values within the region of interest (ROI), whereas radiomic features of IVIM maps may potentially provide more information and capture tumor heterogeneity (33–35).
Nevertheless, differences in patient cohorts, scanners, acquisition protocols, and analysis algorithms (36–39) contribute to variable diagnostic performance between studies and can dilute the potential of the IVIM biomarkers for more widespread adoption in clinical trials or daily practice (8, 10). A retrospective cross-sectional view of a large subset of available clinical data from patients presenting with suspicious lesions, acquired at different sites analyzed with widely used software platforms, may be illuminating to highlight the software dependency of IVIM parameters as well as the most robust and diagnostic 1st order radiomic features in the IVIM dataset and guide future harmonization efforts in multi-center trials.
This study evaluated retrospective anonymized breast MR imaging data from three different sites. The patients were scanned using 1.5 T or 3 T scanners at each site (Site A: GE Healthcare, Waukesha, Wisconsin, USA, 1.5 T and 3.0 T; Site B: Philips Healthcare, Best, the Netherlands, 3.0 T; and Site C: Siemens trio, Siemens Healthcare, Erlangen, Germany, 3.0 T). Details of each acquisition protocol and studied cohort are listed in Tables 1, 2. Criteria for evaluation varied between sites. Site A included the patients who underwent breast MRI screening when they were suspicious of Breast Imaging Reporting and Data System (BI-RADS) 4, 5 and/or cancer-proven BI-RADS 6 lesions. Site B included patients underwent breast MRI screening and had BI-RADS 4, 5 lesions detected. Site C included the patients who underwent breast MRI when they were known to have or were suspected of having breast carcinoma. This included patients with BI-RADS categories 2-5 lesions.
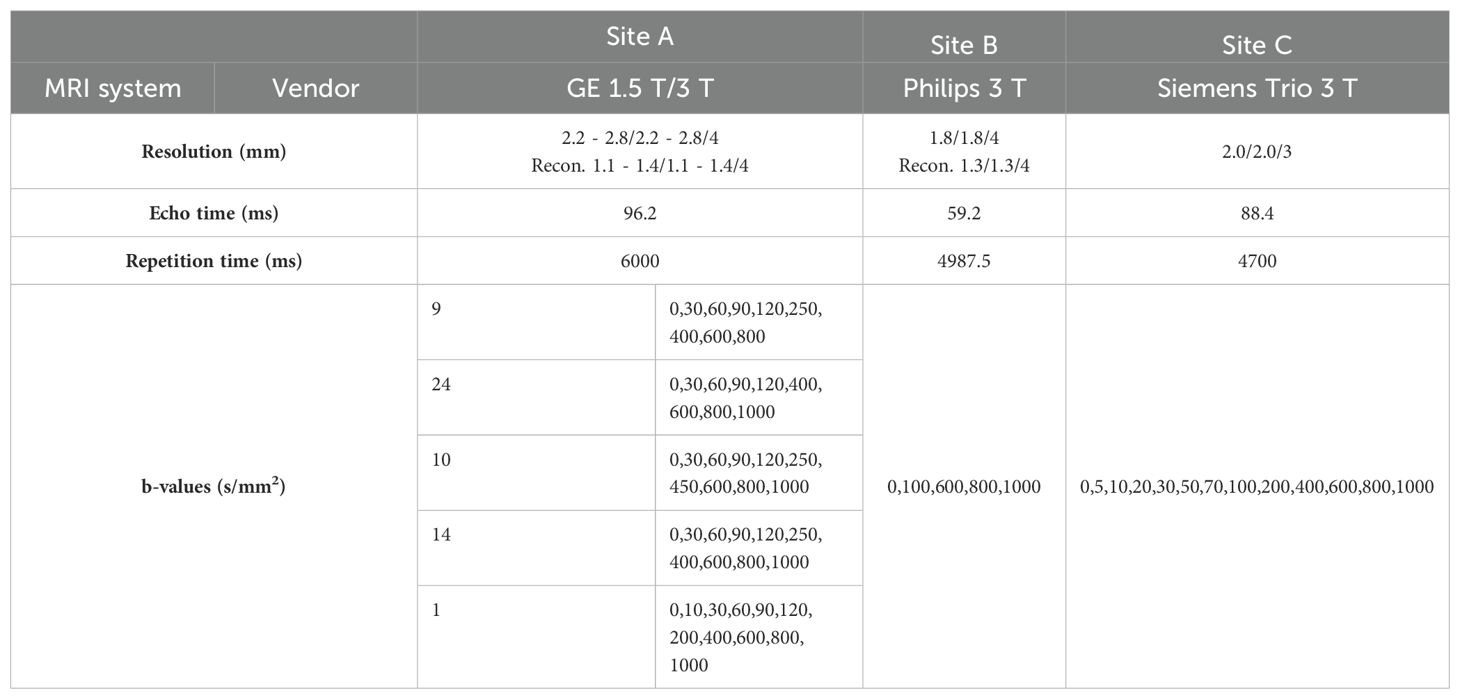
Table 1. MRI system and acquisition parameters used at each site in the multicenter study. Resolutions are given in acquired and reconstructed voxel sizes.
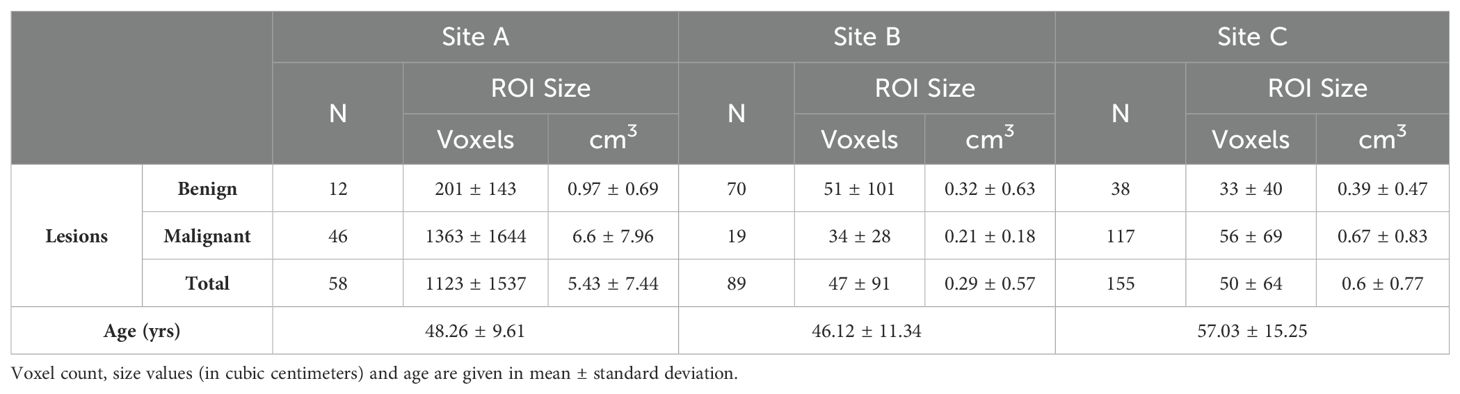
Table 2. Number of patients with breast lesions from multiple centers along with average age at each site.
Lesion conspicuity was assessed by radiologists on either b0 or b>0 DWI images, in comparison with dynamic contrast enhanced (DCE) MRI at Site A, Site B and Site C. Referencing the accompanying DCE MRI, ROIs were drawn on either b0 or b>0 DWI images in consultation with the respective team radiologist. At Site A ROIs were prescribed on all lesion slices, while for Sites B and C only the central slice of largest cross section was prescribed. The ROI contains at least 3 voxels, and no obvious artifacts were included at all sites as per the guidelines from the European Society of Breast Radiology (EUSOBI) (8). Single lesion per patient was used at all sites. In addition, lesions were histologically confirmed (Site A and Site B), or sometimes based on radiologist reports, and based on stability on imaging for more than 18 months for benign lesions at Site C.
IVIM data from all sites were independently analyzed using three software packages: a shareware tool with least-squares segmented fitting (Firevoxel, https://firevoxel.org/ (Software a)), an MR vendor research software package with least-squares segmented fitting (Siemens MR Body Diffusion Toolbox from Siemens Healthineers (Software b)) and a commercial software package with Bayesian fit algorithm Olea Sphere (Software c).
IVIM parameters were estimated from a fit of all acquired b-values (see Table 1) to a biexponential decay:
IVIM parameters fp, Dp and Dt were calculated from the voxels in the lesion ROI using each software tool. Histogram analysis of parametric maps generated by each software was also performed within a separate module for histogram generation in Firevoxel (100 bins, fp: 0 – 1, Dp: 0 – 0.1 mm2/s and Dt: 0 – 0.003 mm2/s) to estimate 1st order radiomic features from each parameter: mean/minimum/maximum/variance/skewness/kurtosis. This single histogram module was used to limit the software differences to that in IVIM estimation alone.
The Pearson correlation (r) coefficient of IVIM parameters for the 1st order radiomic features was computed between each software pair at each site separately. The average correlation coefficient and coefficient of variation (CV) over all software pairs and sites was computed for each metric and ranked in numerical order to assess the consistency of performance of a clinical task. The intraclass correlation coefficient (ICC) was also computed for the agreement among three software for the IVIM metrics at each site. Additionally, Bland-Altman analysis (40) of IVIM parameters for the 1st order radiomic features was also carried out between each software pair at each site separately. Measures of absolute difference mean, absolute difference standard deviation, and CV (%) were derived from each software pair comparison.
Within the context of each software, each IVIM metric was tested for benign/malignant differentiation, separately for each software, using logistic regression for all three sites’ data together, with each variable adjusted by site (coefficient and intercept). In addition, we also performed leave-one-patient-out (LOU) cross validation for each IVIM metric for the logistic regressions adjusted by site for each software. The area under the ROC curve (AUC) and standard error (SE) were quantified for each software separately. An average of AUCs (separately for original and LOU analysis) across software was computed for each IVIM metric. CVs of the three AUCs from each software were computed for benign and malignant differentiation. These average metrics were then ranked in numerical order for assessment of consistency of performance of a clinical task. Additionally, AUCs from all pairs of software were separately compared with DeLong’s test. Statistical analysis was performed using MATLAB software for Bland-Altman analysis and R 4.2 software for ICC and logistic regression.
The study included 58, 89 and 155 patients from Site A, Site B, and Site C respectively. Site A, Site B and Site C included 79.3%, 21.4%, and 75.5% of patients with malignant lesions respectively, with each patient contributing one lesion. Table 2 shows the distribution of the patients including the number of biopsy-confirmed benign/malignant lesions across sites in this retrospective multicenter study along with ROI size. The number of voxels per ROI ranged from 47 ± 91 (Site B) to 50 ± 64 (Site C), and up to 1123 ± 1537 (Site A). In addition, average age across sites is also reported.
Example IVIM parameter maps obtained from each software for malignant lesions from Site A, Site B and Site C are shown in Figure 1, Figures 2, 3 respectively. Example benign breast lesions are shown in Supplementary Figure S1-S3. Overall Dt maps and fp maps show consistency while Dp maps exhibit the most variability across the software platforms. The average fractions of utilized voxels per lesion (i.e. having values within the prescribed histogram ranges) were as follows. Dt utilized 99.72%/99.88%/99.87% of lesion voxels at Site A; 100%/100%/100% at Site B; 99.99%/99.95%/100% at Site C using Software a/b/c. Dp utilized 77.51%/99.77%/100% of lesion voxels at Site A; 80.58%/100%/100% at Site B; 59.78%/99.23%/100% at Site C using Software a/b/c while fp utilized 100% of lesion voxels at all sites using Software a, b, c. The mean IVIM parameter values for benign and malignant lesions at Site A, Site B and Site C are shown in Table 3 which clearly indicates the consistency of Dt and fp values across all software platforms except for fp at Site B. Mean fp values were found to be somewhat variable between least squares segmented fitting and Bayesian fitting at Site B.
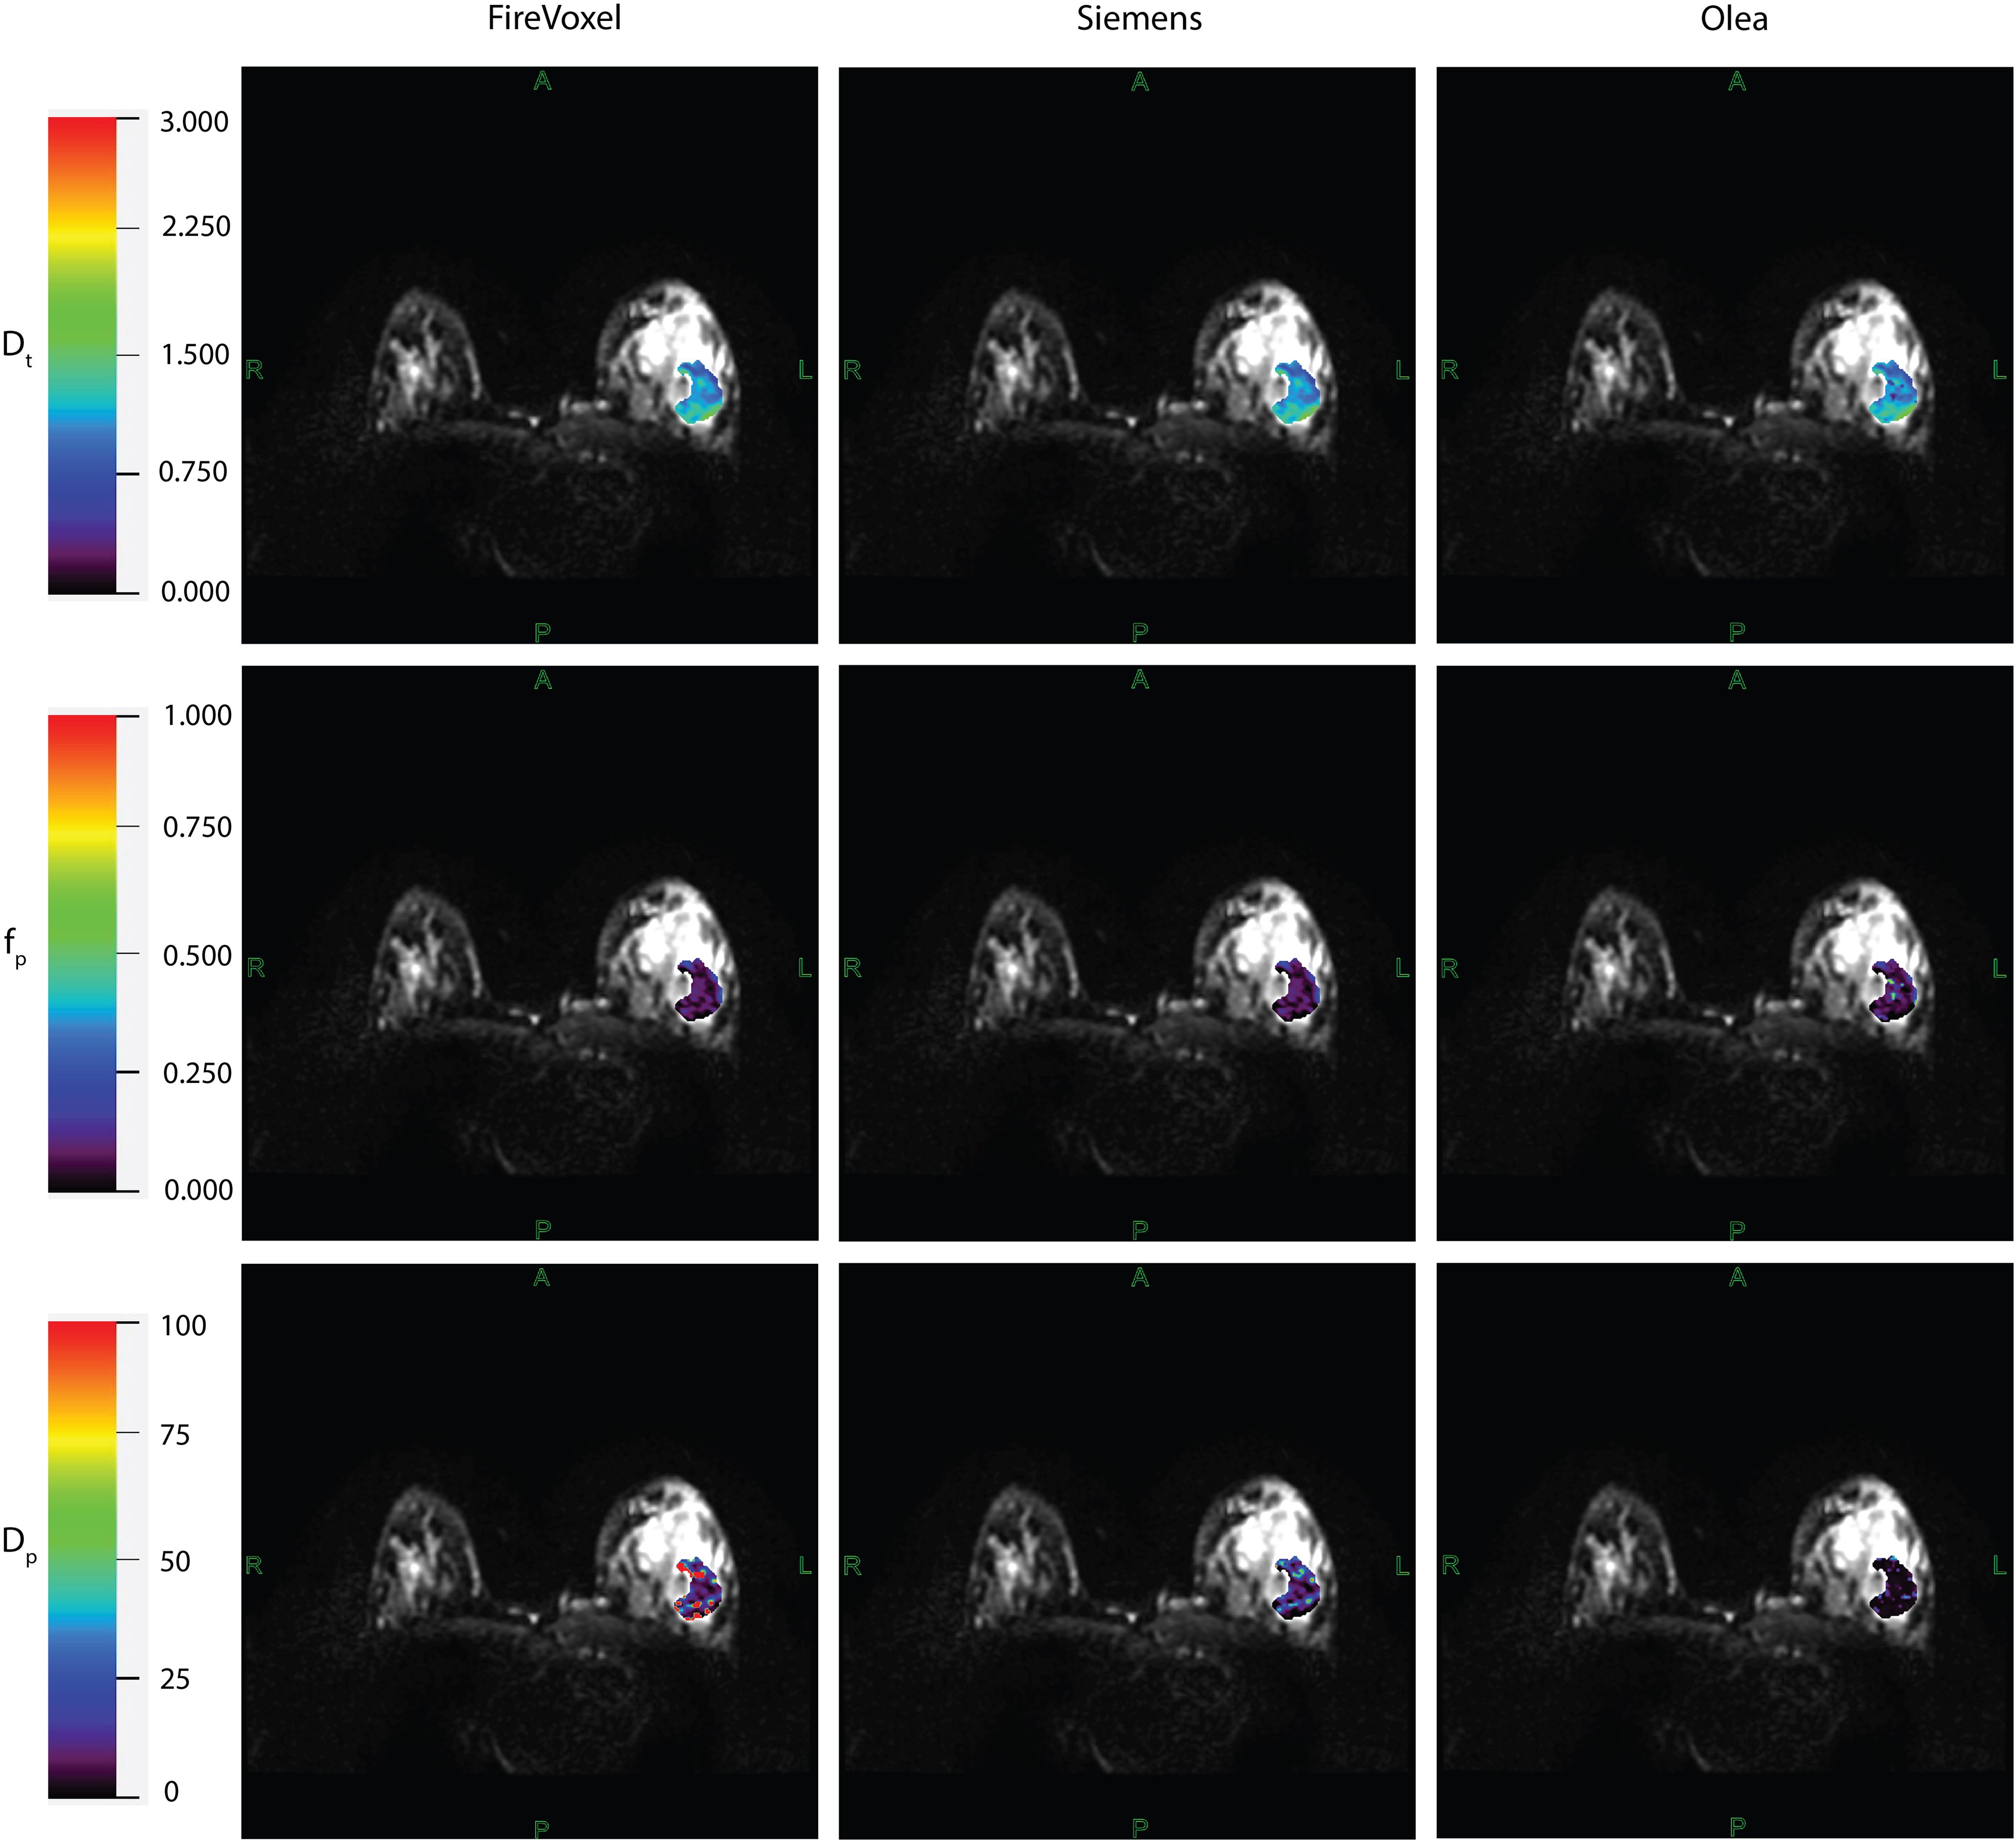
Figure 1. IVIM parametric maps overlaid on raw DWI images in a patient with malignant breast lesion for Site A. IVIM parameters tissue diffusivity (Dt), perfusion fraction (fp) and pseudodiffusivity (Dp) obtained from Firevoxel, Siemens and Olea software in the breast lesion. Dt maps and fp maps are the most consistent across software platforms, while Dp maps show the most variability with fit algorithms. Dt and Dp are given in units of 10 -3 mm2/s.

Figure 2. IVIM parametric maps overlaid on raw DWI images in a patient with malignant breast lesion for Site B. IVIM parameters tissue diffusivity (Dt), perfusion fraction (fp) and pseudodiffusivity (Dp) obtained from Firevoxel, Siemens and Olea software in the breast lesion. Dt maps and fp maps are the most consistent across software platforms, while Dp maps show the most variability with fit algorithms. Dt and Dp are given in units of 10 -3 mm2/s.
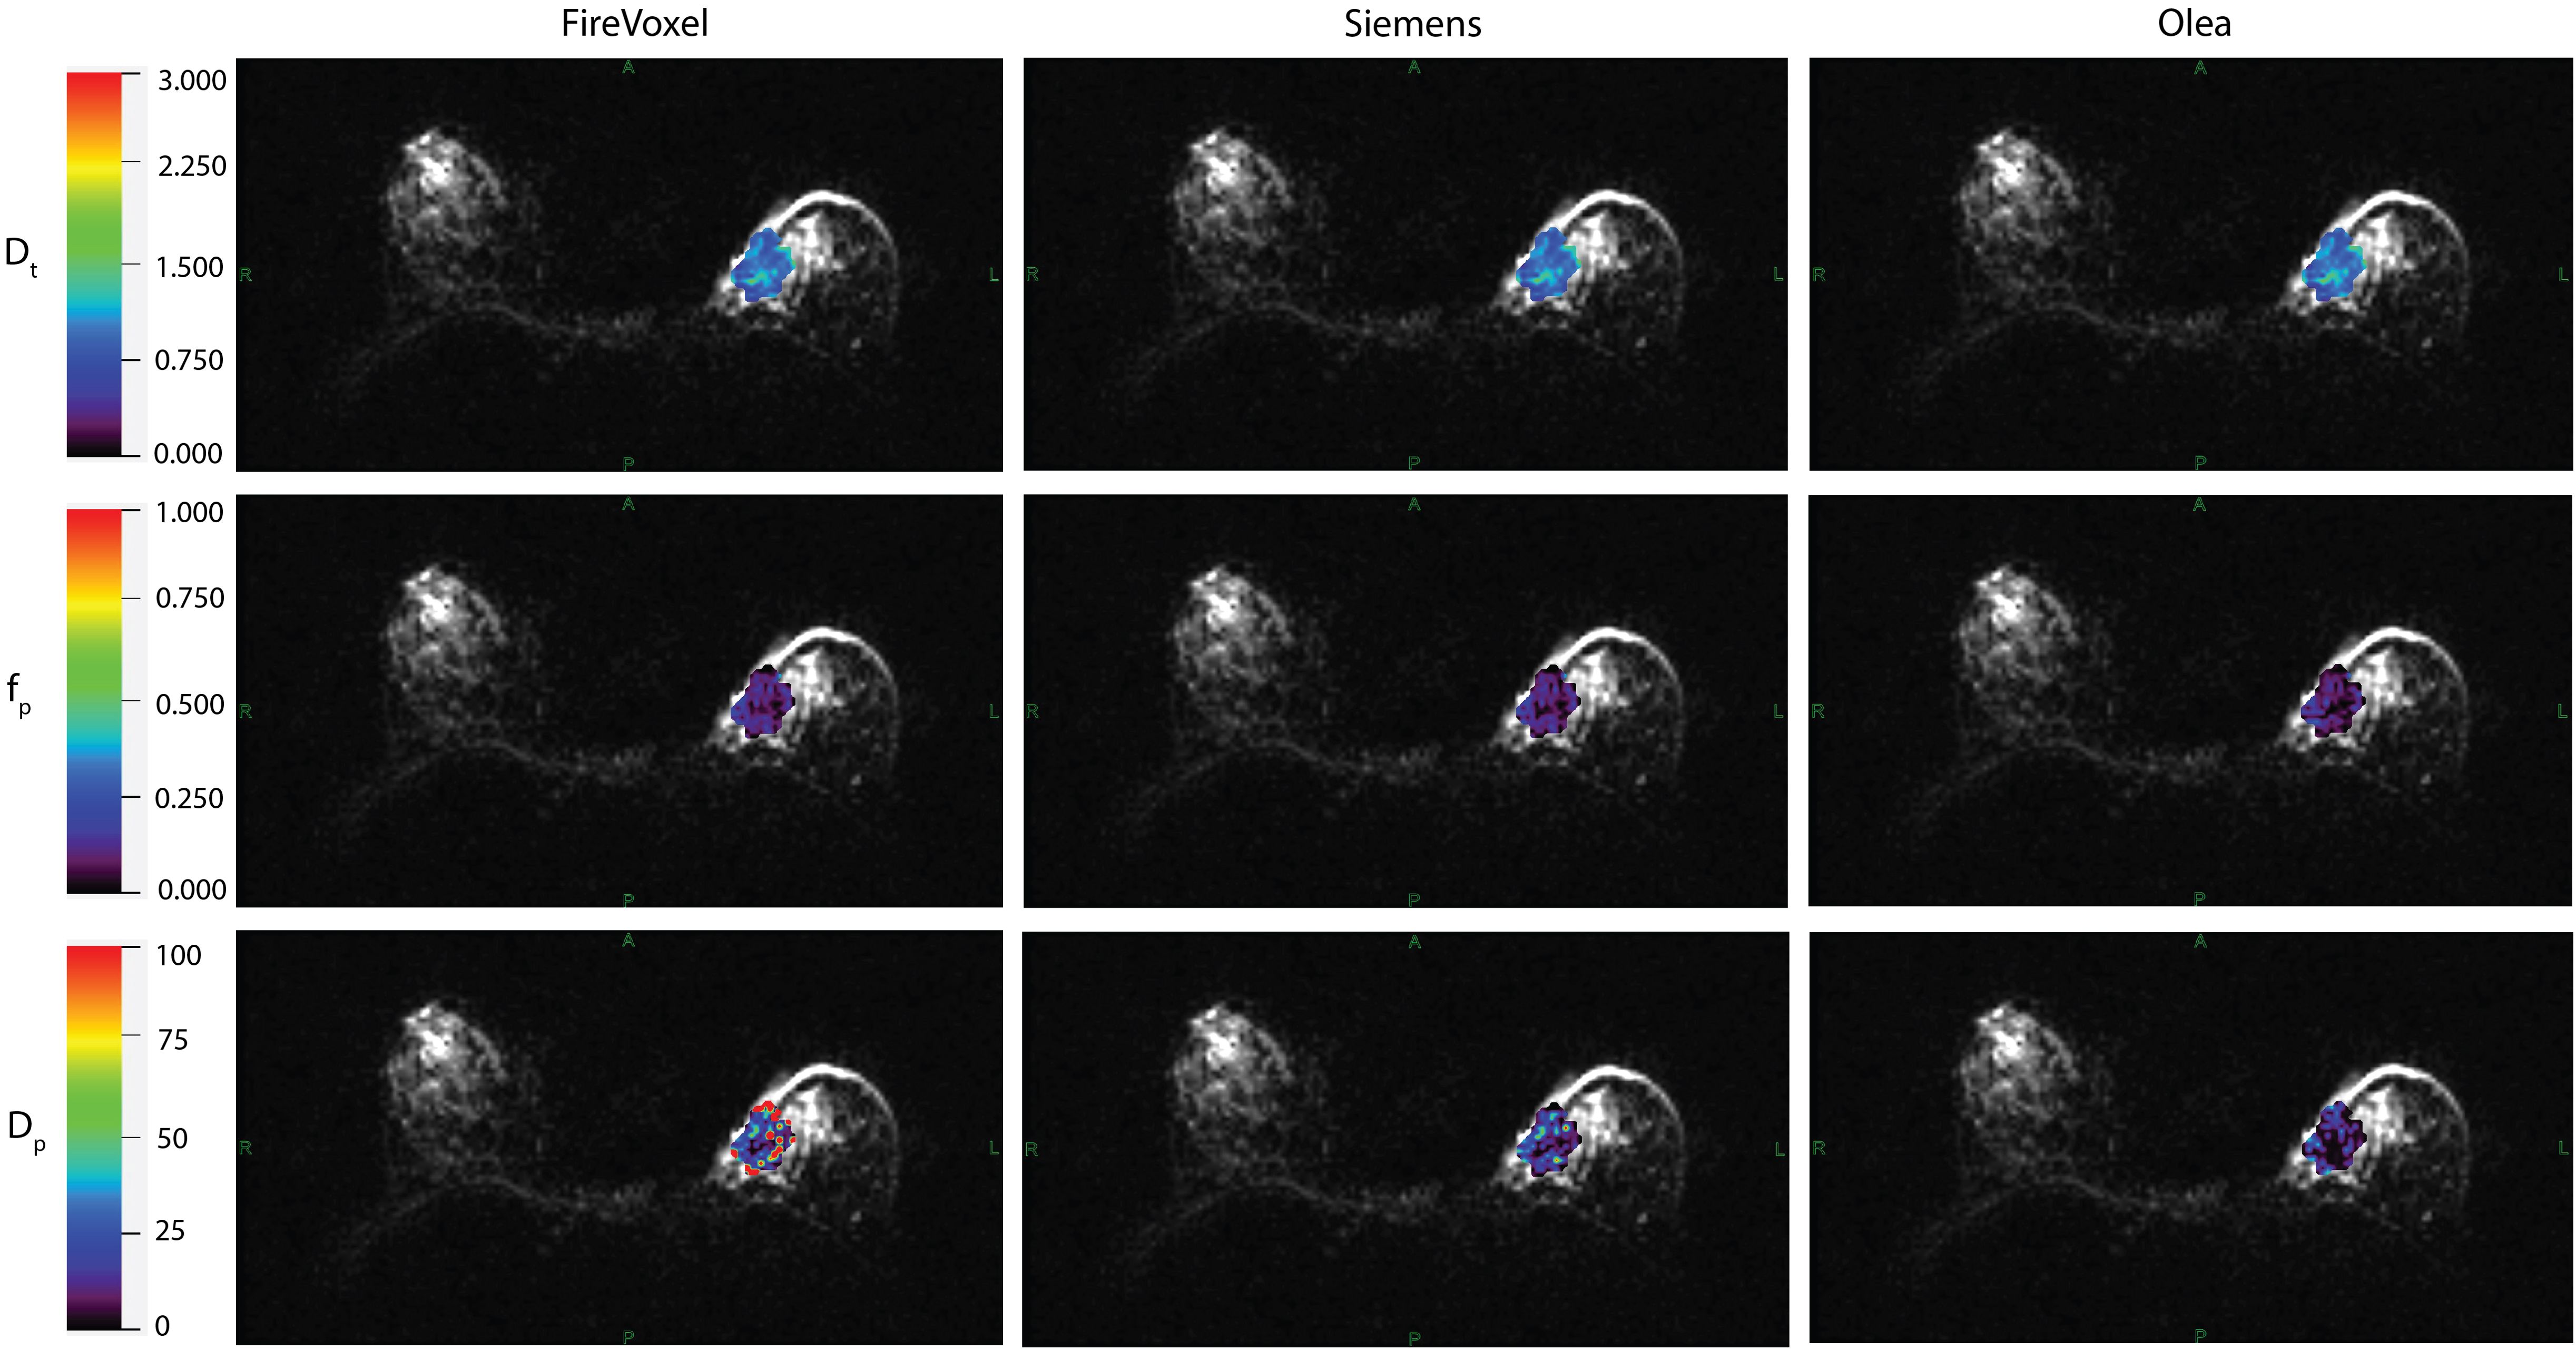
Figure 3. IVIM parametric maps overlaid on raw DWI images in a patient with malignant breast lesion for Site C. IVIM parameters tissue diffusivity (Dt), perfusion fraction (fp) and pseudodiffusivity (Dp) obtained from Firevoxel, Siemens and Olea software in the breast lesion. Dt maps and fp maps are the most consistent across software platforms, while Dp maps show the most variability with fit algorithms. Dt and Dp are given in units of 10 -3 mm2/s.
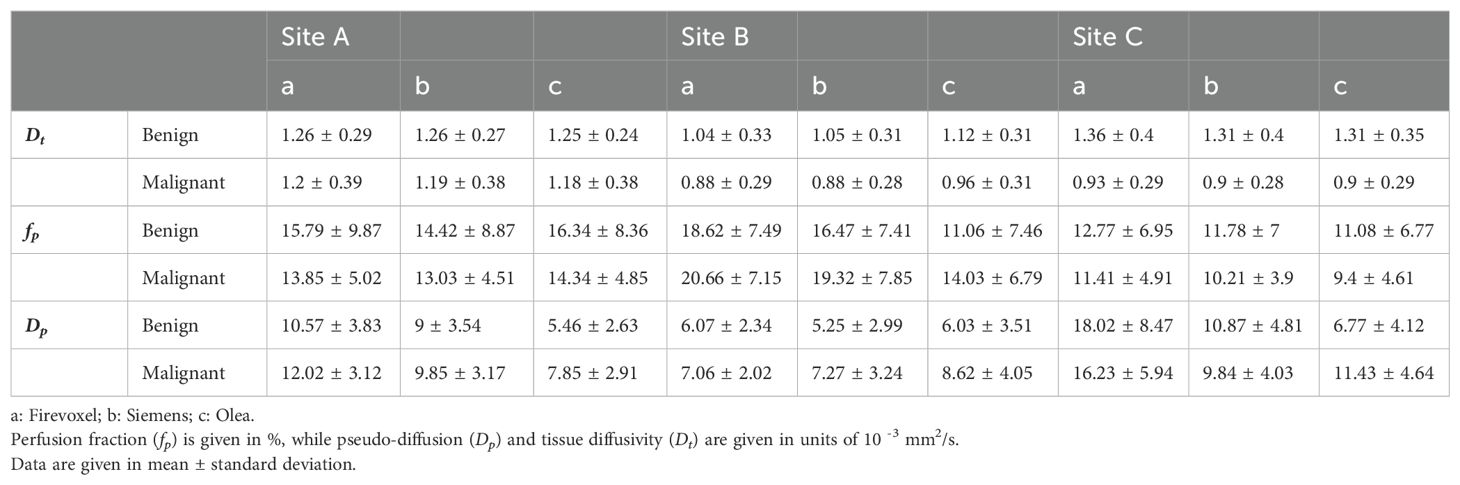
Table 3. Mean IVIM parameter values for benign and malignant lesion employing Software (a, b, c) at Site A, Site B and Site C.
The correlation coefficient of IVIM parameters between each software pair for 1st order radiomic features at each site is shown in Supplementary Table S1 along with ICC values. Correlations between least-squares segmented fitting algorithms are generally higher than those between least squares and Bayesian algorithms. The average correlation between the three software at three different sites for 1st order radiomic features mean/maximum/variance/skewness/kurtosis were fp (r = 0.871/0.615/0.679/0.541/0.433), Dp (r = 0.56/0.616/0.587/0.454/0.51) and Dt (r = 0.98/0.891/0.815/0.697/0.584) respectively while that for Dtmin was 0.791. The correlations between the three software for mean Dt at Site A, Site B and Site C are shown in Figure 4; excellent correlation observed between least-squares segmented algorithms (Firevoxel and Siemens) and Bayesian algorithms (Olea) at each site. Similarly, the correlations between the three software for mean fp at Site A, Site B and Site C are shown in Figure 5; strongest correlation observed between least-squares segmented algorithms (Firevoxel and Siemens) at each site. Figure 6 shows the average of correlation coefficients of 1st order radiomic features of fp, Dt and Dp across all software and sites along with CV of correlation coefficients. In general, Dt radiomics showed the highest average software correlation along with mean fp while Dtmean showed the lowest CV. Additionally, Bland-Altman analysis of IVIM parameters between each Software (a, b, c) pair for 1st order radiomics at each site is shown in Supplementary Table S2. Bland-Altman plots between the three software for mean Dt and mean fp at Site A, Site B and Site C are shown in Supplementary Figures S4, S5.
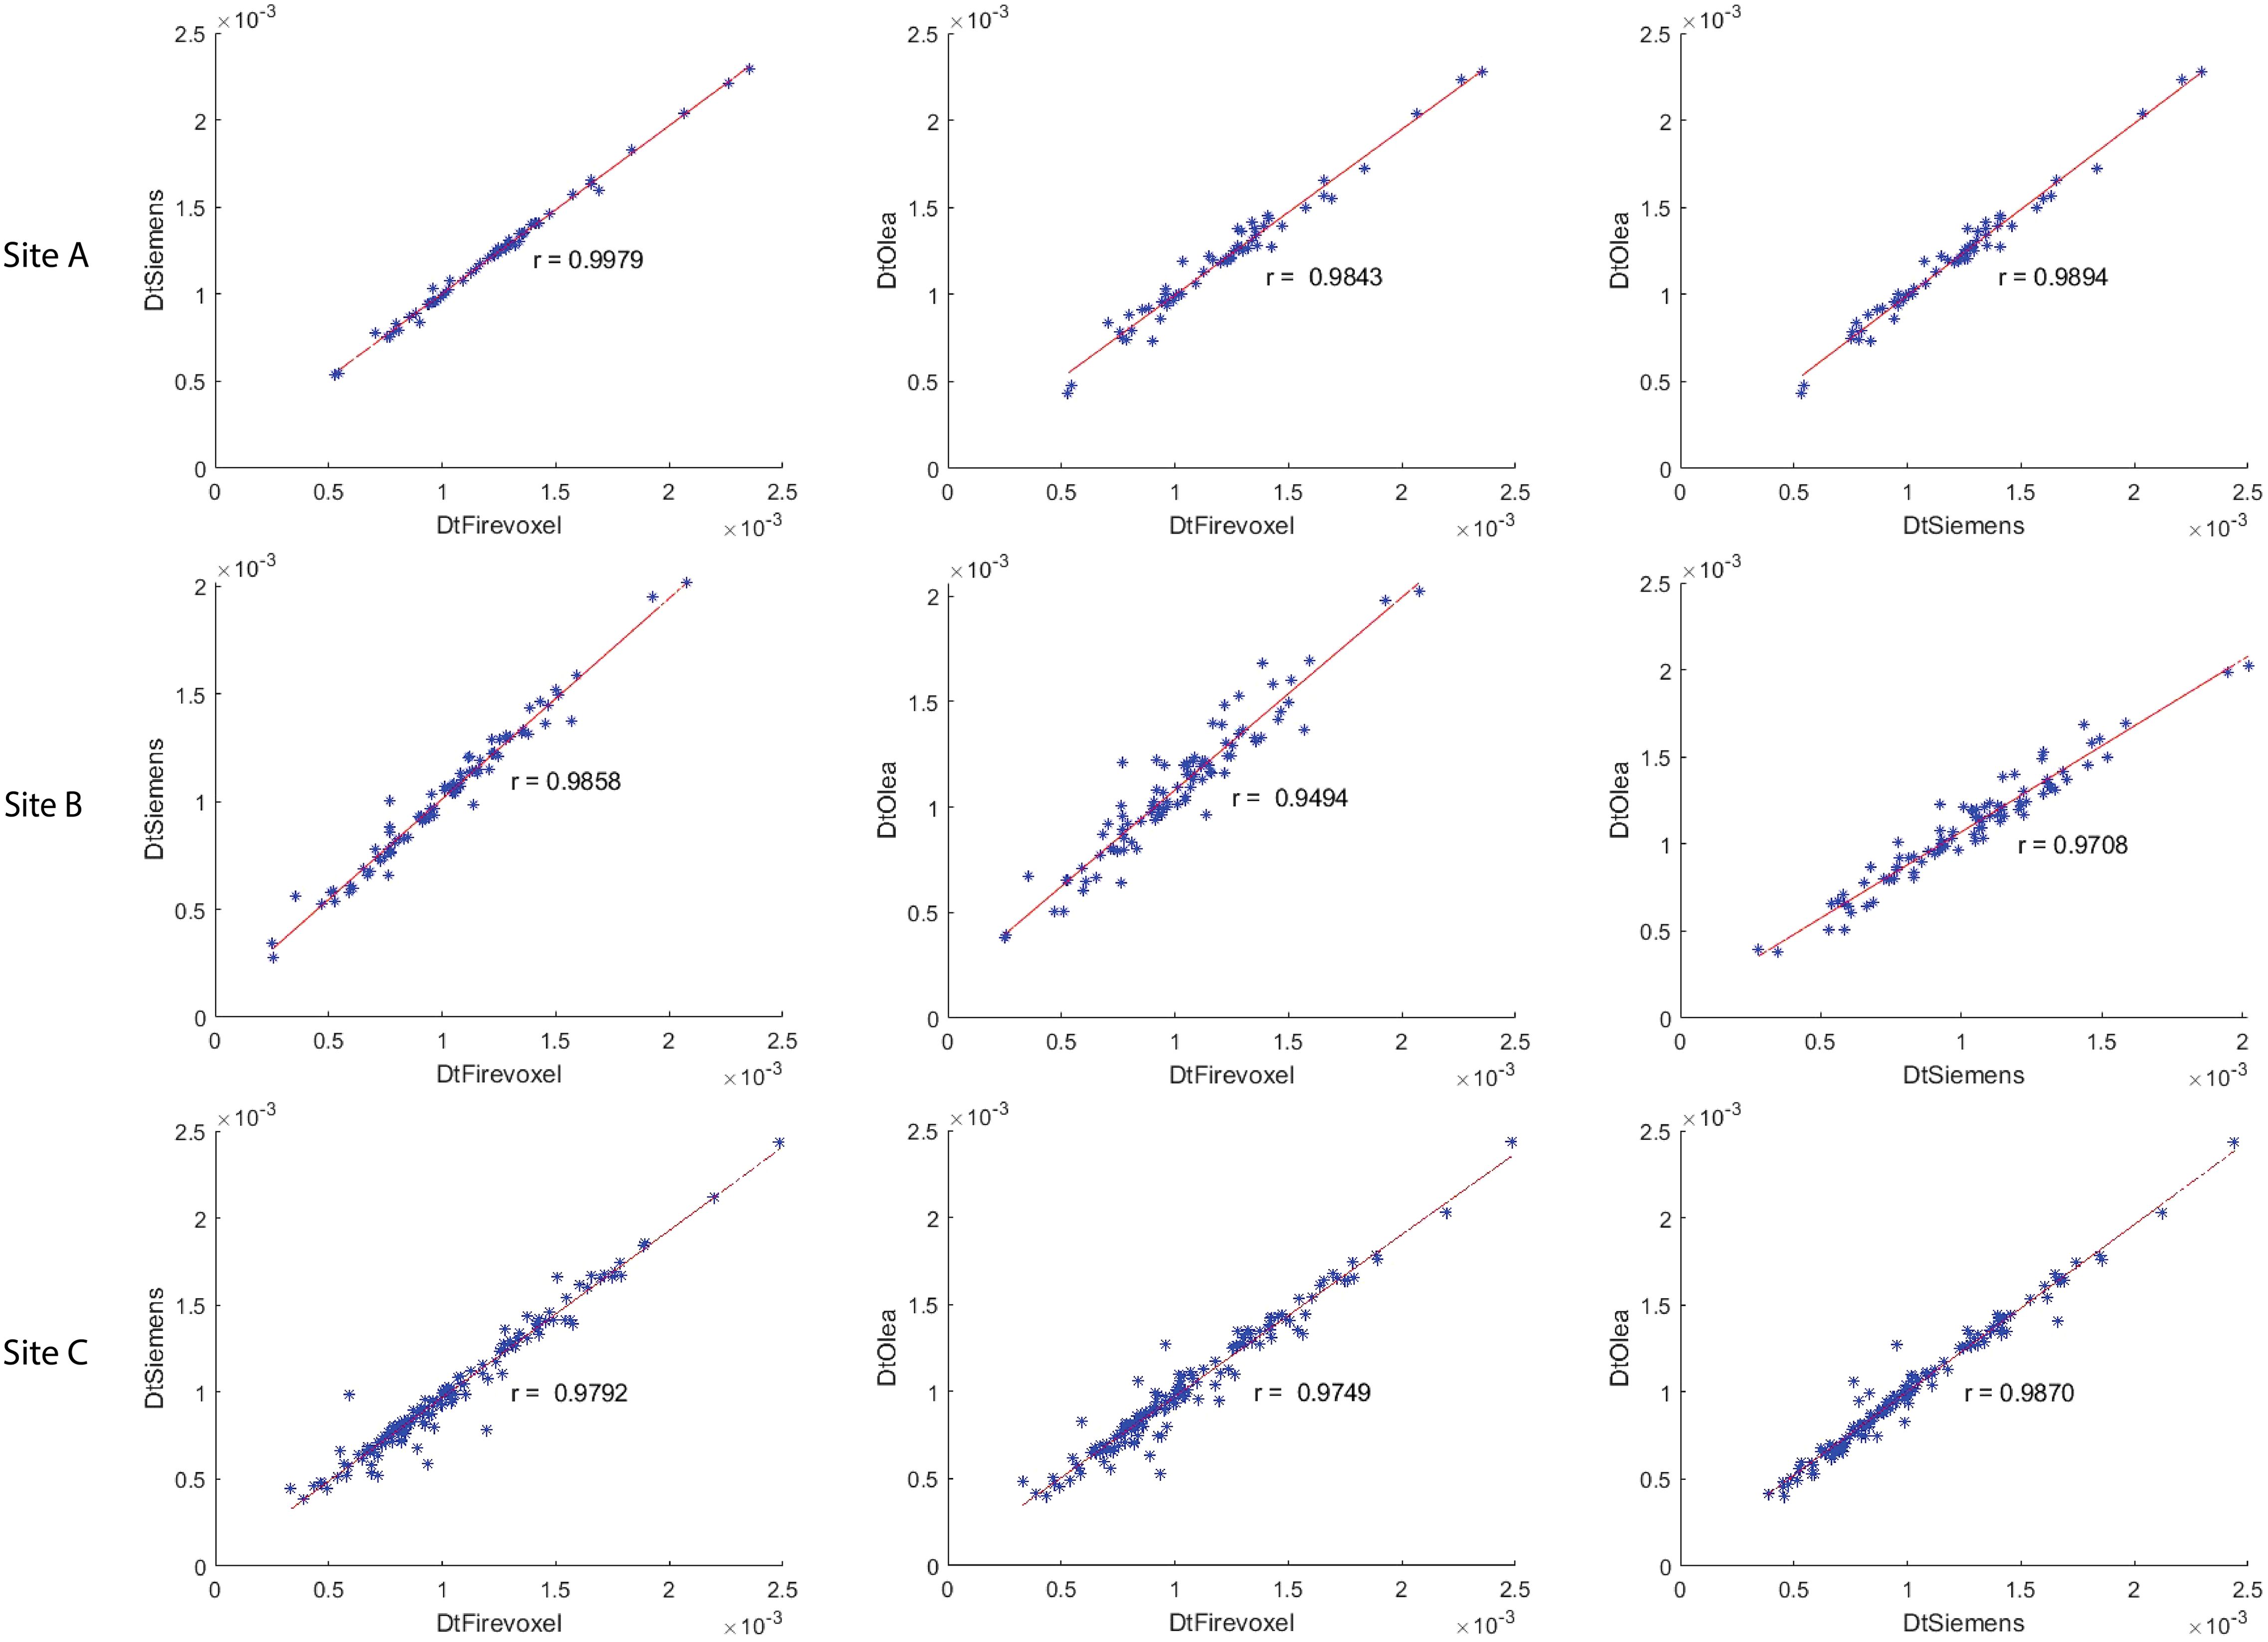
Figure 4. Correlation coefficient between Firevoxel, Siemens and Olea for mean of tissue diffusivity (Dt) at Site A, Site B and Site C. Comparisons shown left to right: Firevoxel vs. Siemens, Firevoxel vs. Olea, and Siemens vs. Olea. Least-squares segmented algorithms (Firevoxel, Siemens) and Bayesian algorithms (Olea) show excellent agreement. Dt is given in unit of mm2/s.
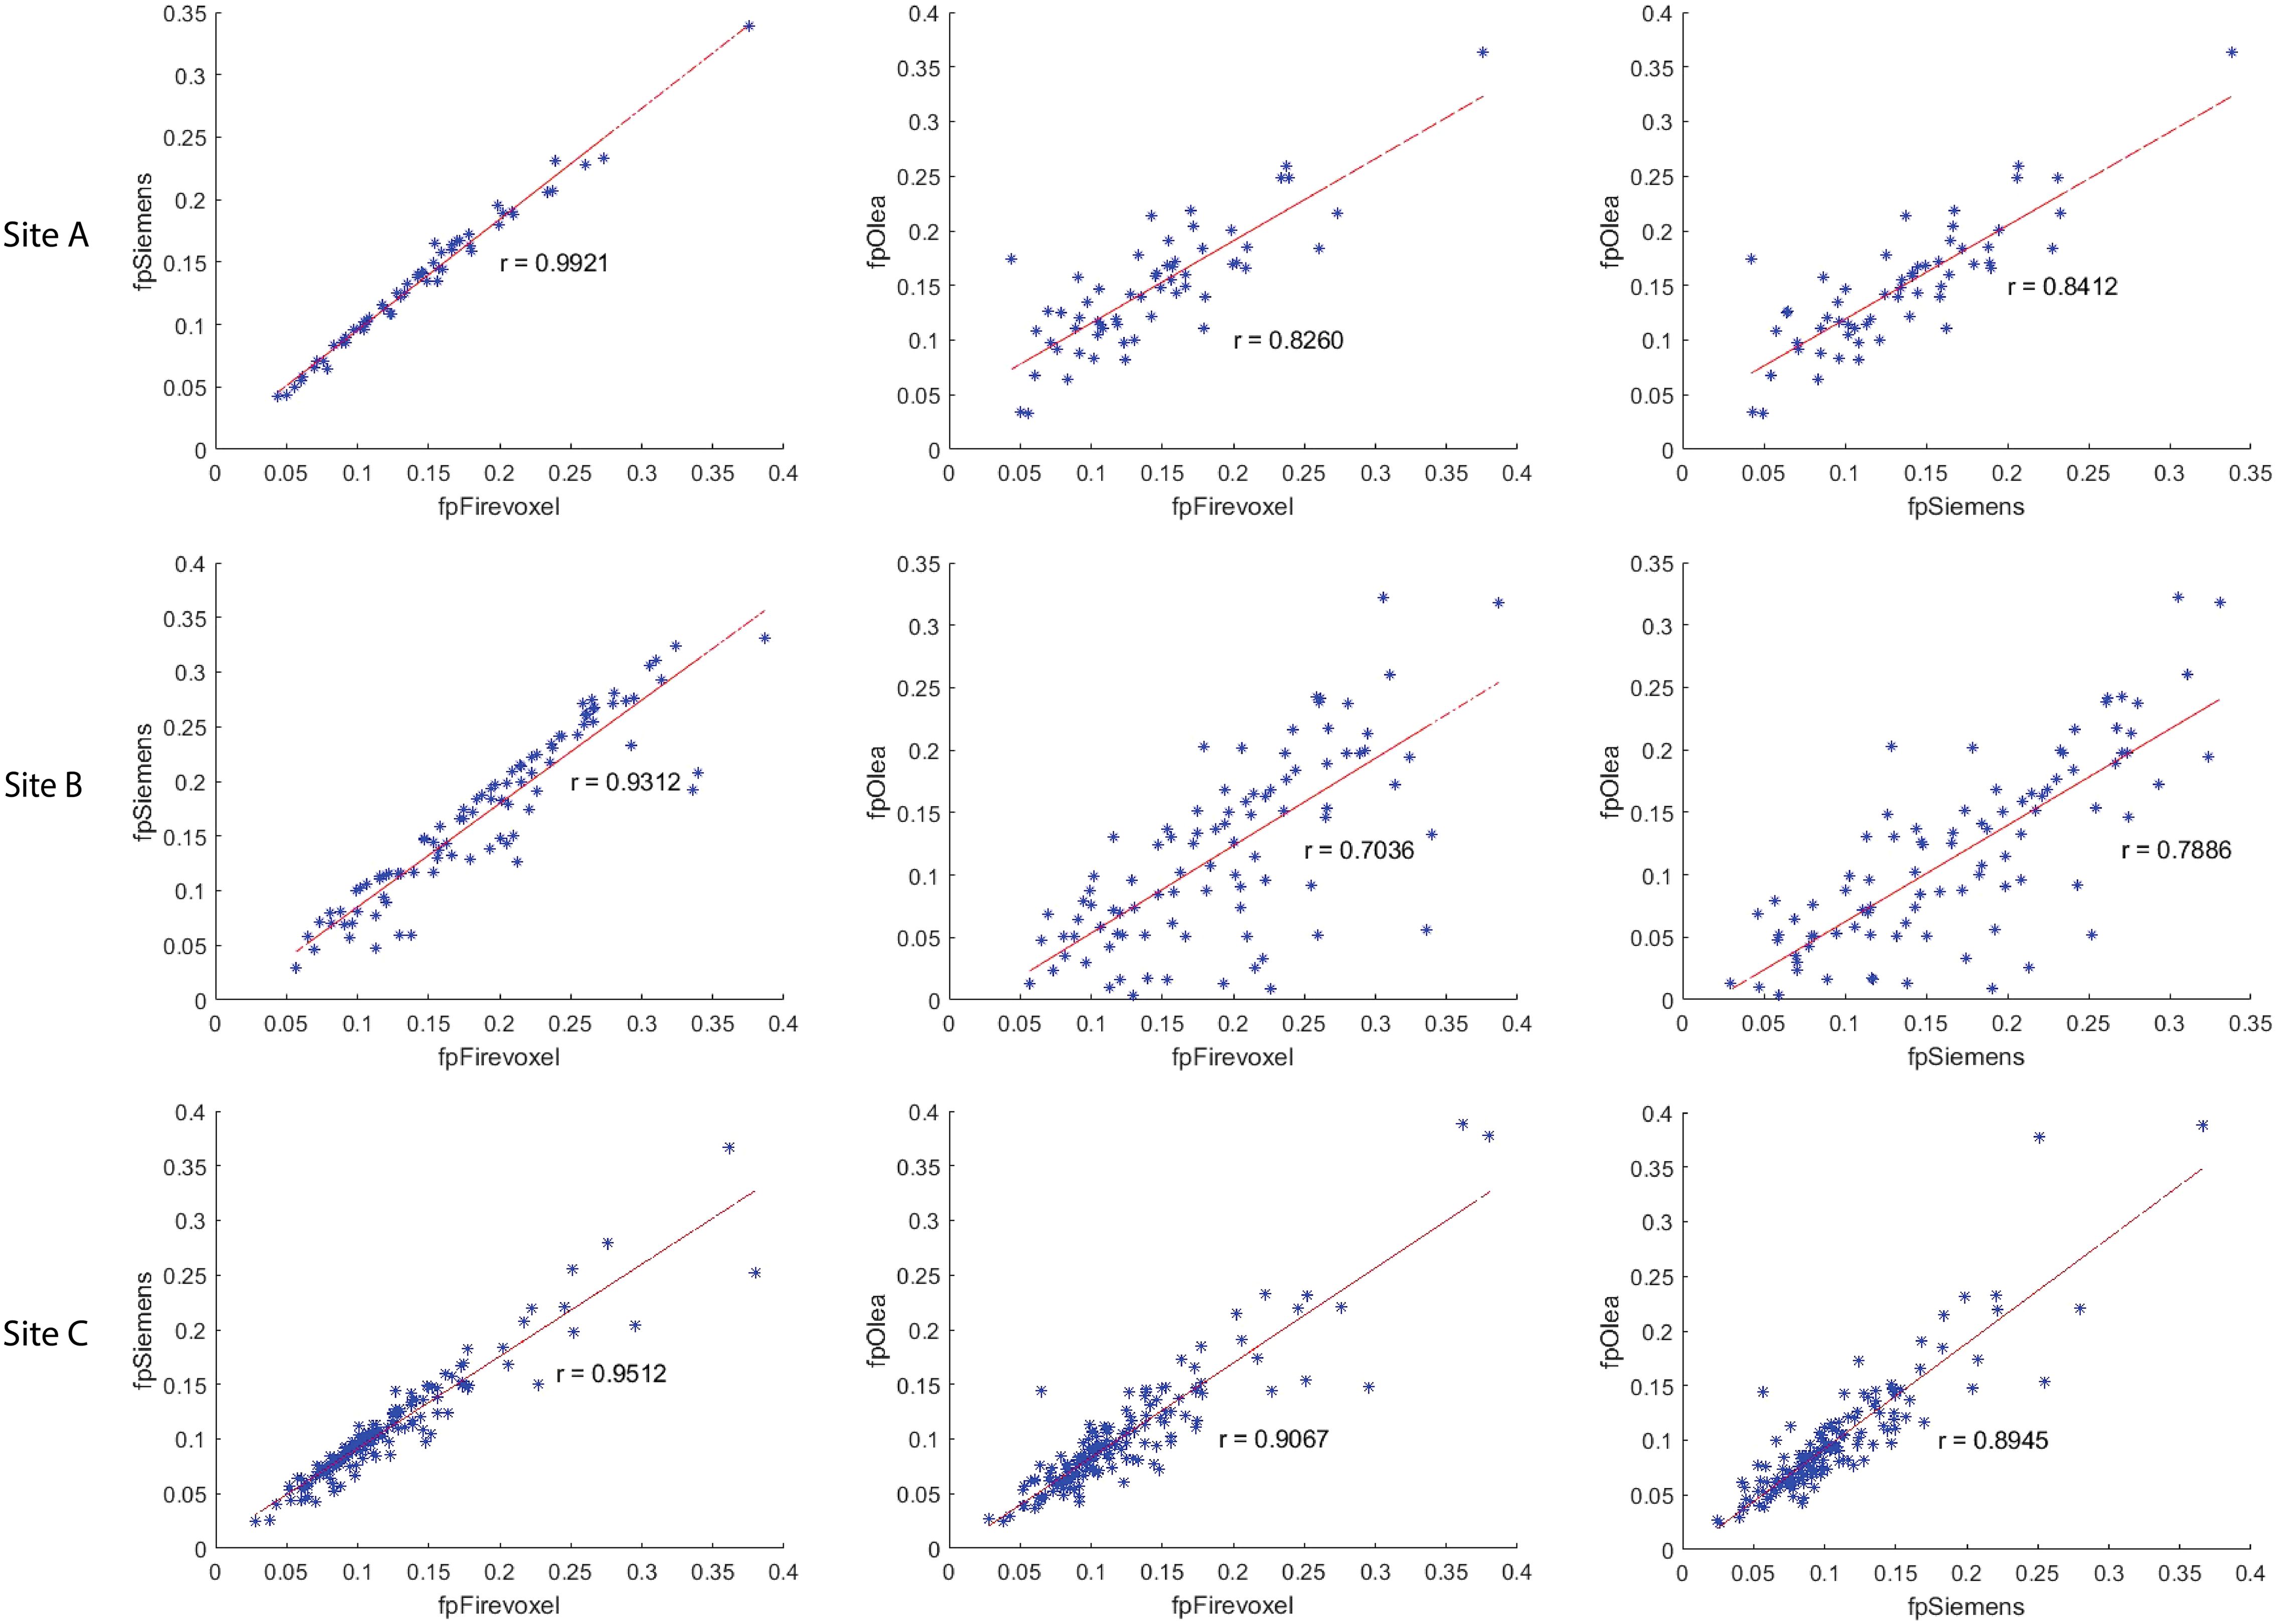
Figure 5. Correlation coefficient between Firevoxel, Siemens and Olea for mean of perfusion fraction (fp) at Site A, Site B and Site C. Comparisons shown left to right: Firevoxel vs. Siemens, Firevoxel vs. Olea, and Siemens vs. Olea. Least-squares segmented algorithms (Firevoxel, Siemens) show the highest agreement while correlation between least-squares and Bayesian algorithms (Olea) is somewhat less.
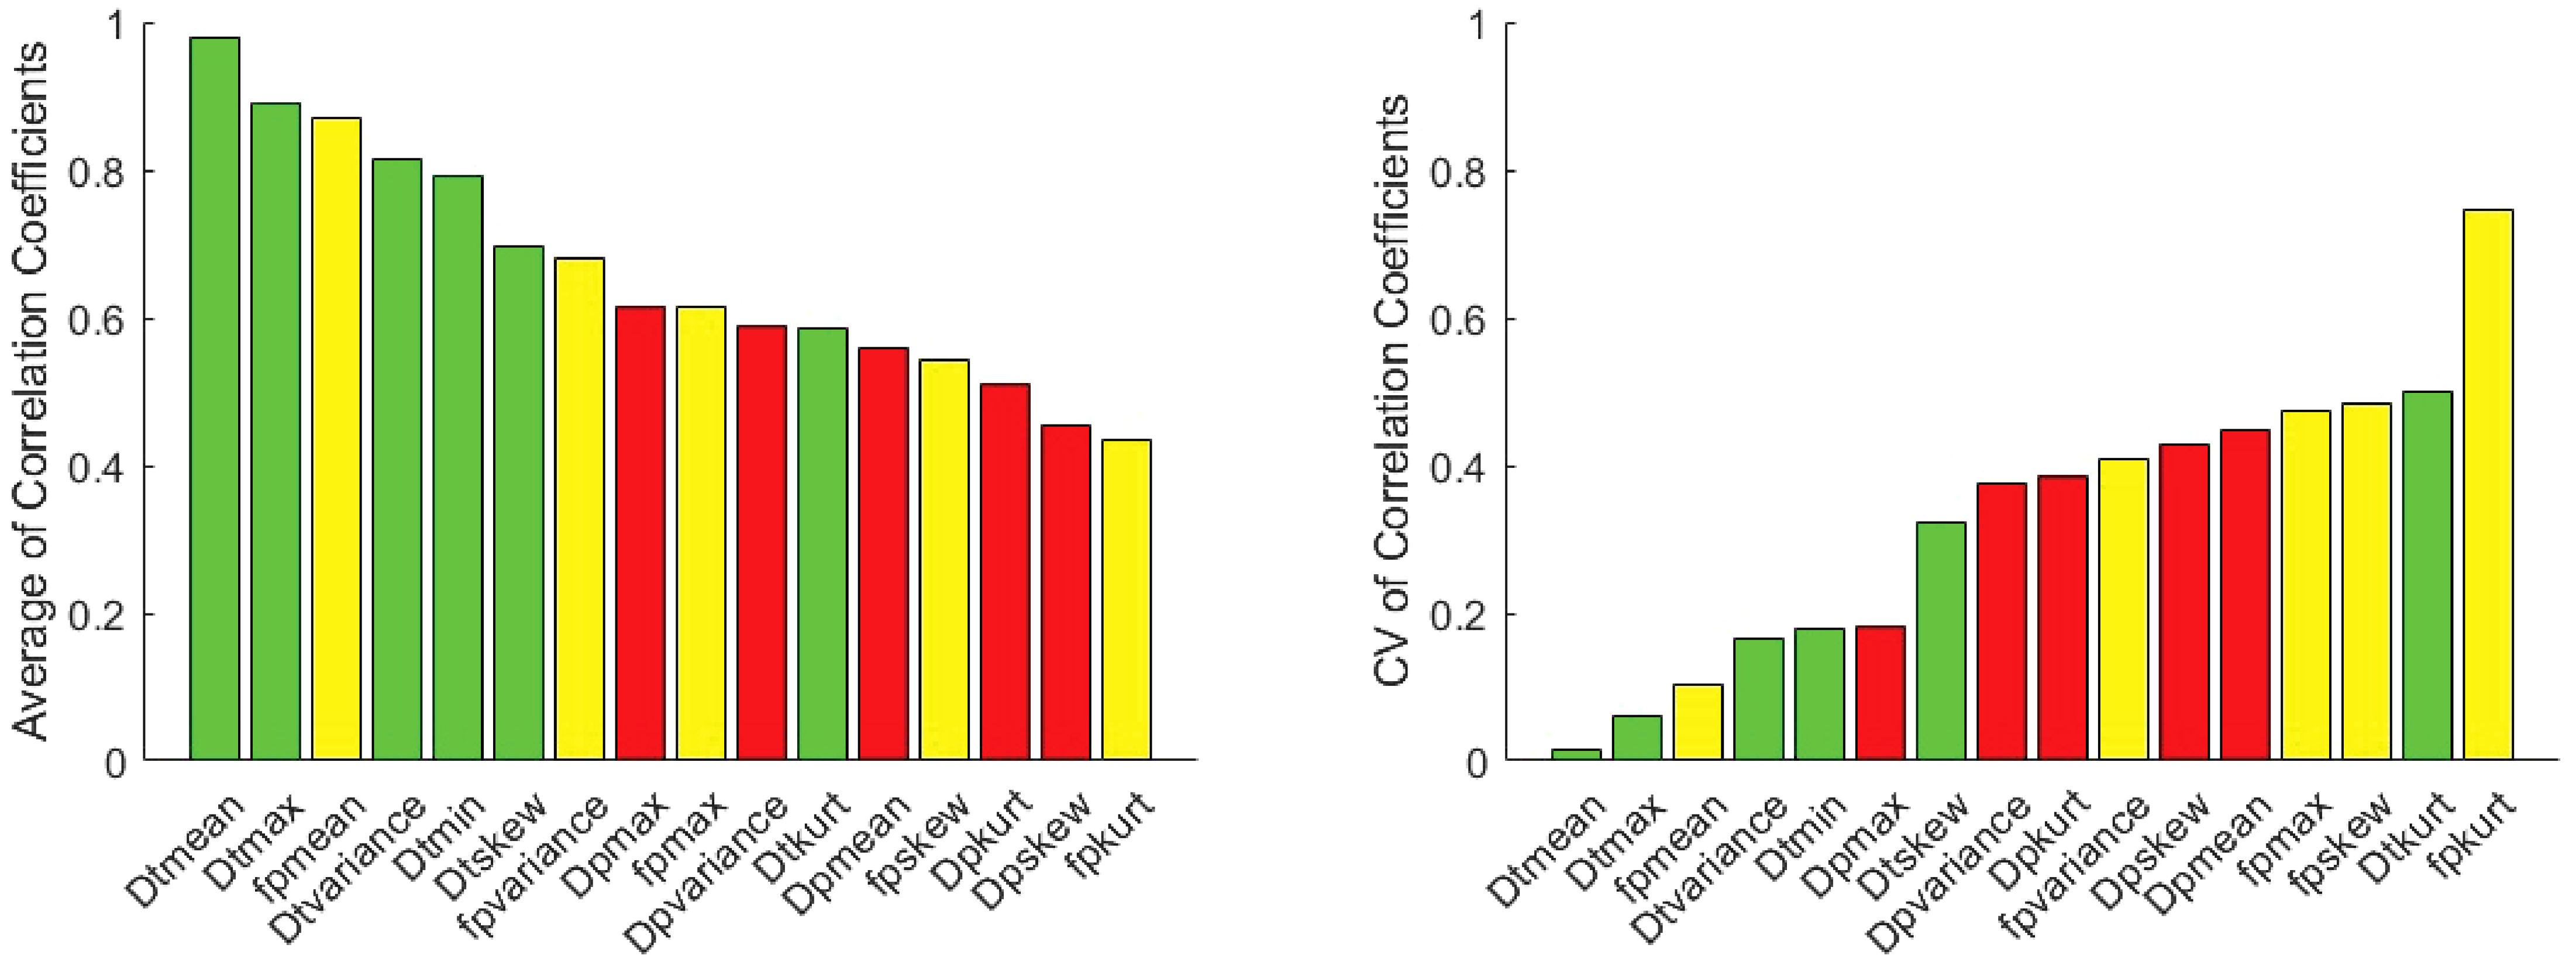
Figure 6. Average Pearson correlation coefficients of 1st order radiomic features of fp (yellow), Dt (green) and Dp (red) between software pairs at Site A, Site B and Site C along with coefficient of variation (CV) of correlation coefficients. Highest correlations are observed for mean Dt (lowest CV) and fp metrics as well as other Dt radiomics.
No pair of parameter AUCs from different software were significantly different (p>0.05). Regarding the pooled site analyses, the AUC with SE for benign and malignant differentiation for different IVIM metrics employing different software from three sites using logistic regression and LOU cross validation is shown in Table 4 while the average of AUC as well as CV of AUC (%) for benign and malignant differentiation is shown in Figure 7. For both AUC analyses, mean, minimum, maximum and skewness of Dt showed the highest average AUC followed by Dp metrics for the benign/malignant task while mean and variance of fp along with several Dt radiomics showed high consistency among software. LOU AUCs showed a similar ranking of performance to logistic regression AUC with a few exceptions (such as higher ranking of fp mean), with slightly lower and more spread values of average AUC, and higher and more spread values of CV of AUC.
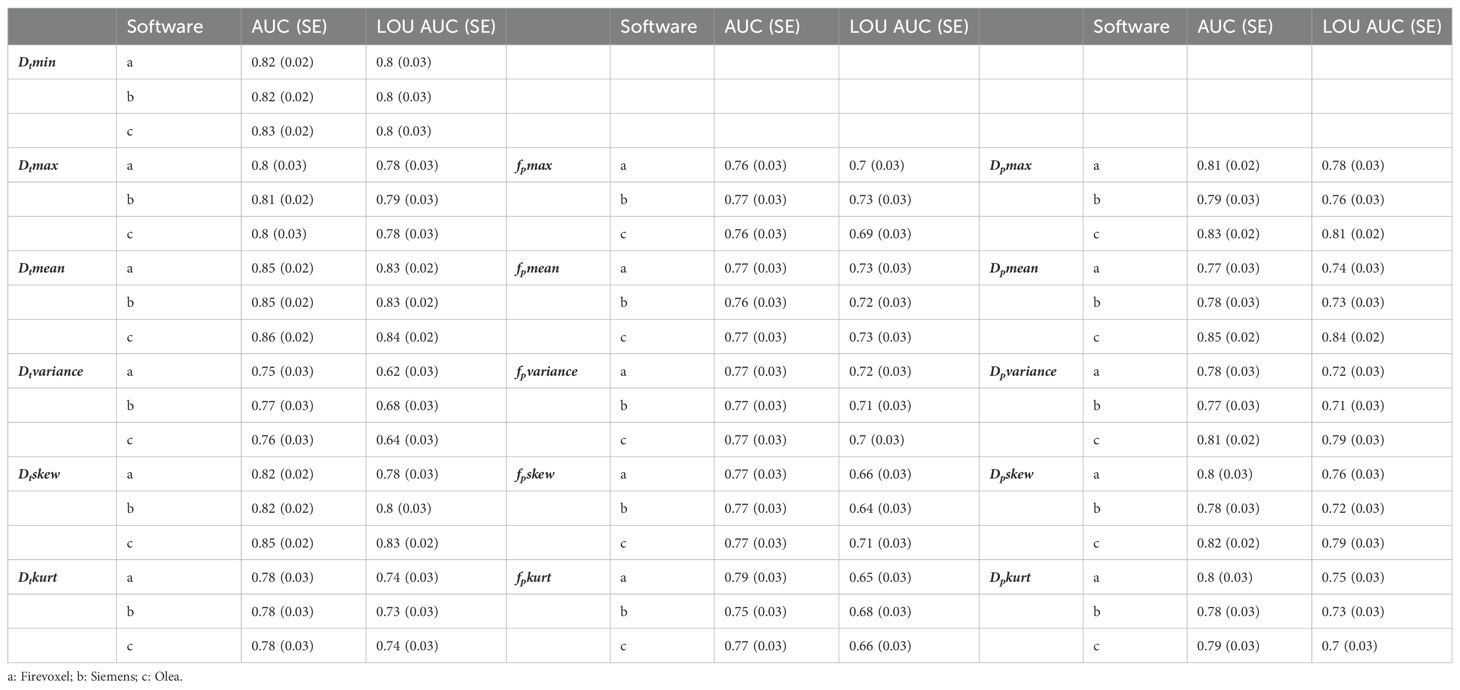
Table 4. Area under the ROC curve (AUC) with standard error (SE) using logistic regression and leave-one-patient-out (LOU) cross validation AUC with SE for benign and malignant differentiation for different IVIM metrics using Software (a, b, c) from Site A, Site B and Site C.

Figure 7. Average area under the ROC curve (AUC) and coefficient of variation (CV) of AUC for benign and malignant differentiation via metrics of fp (yellow), Dt (green) and Dp (red) using logistic regression (top row) and leave-one-patient-out (LOU) cross validation (bottom row). Dt metrics generally show the highest average and most consistent performance for the benign/malignant task, and several fp metrics (e.g. mean and variance) show high consistency among software.
Our study evaluated variability across software tools for IVIM measurements of breast tumors in a heterogeneous multicenter multivendor dataset to test the robustness and diagnostic utility of IVIM biomarkers in a worst-case scenario paradigm. Broadly speaking, Dt metrics present markers of tissue microstructure (especially tumor cellularity) and fp metrics report on microvascularity. Both of these features are known to be biologically important in determining malignancy and monitoring or predicting response to differently targeted treatment (such as cytotoxic or anti-angiogenic agents). In order to maximize the potential of their separate biologic sensitivities, their numerical robustness must be scrutinized as in the present study.
IVIM parametric maps obtained from different software employing least-squares segmented fitting and Bayesian fitting generated similar Dt and fp maps. Dt maps were the most consistent across the software platforms at all sites while some differences in fp maps could be observed particularly at Site B between Software a/b and c. The lower correlations at Site B between fp values obtained from Bayesian and least-squares packages may have been affected by that site’s low number of b-values sampled in the pseudodiffusion regime (b<200 s/mm2); with fewer data constraints Bayesian approaches may regress to their prior. Dp maps were the most variable between the software platforms.
Several Dt radiomic features as well as mean fp demonstrated high correlations between software pairs. Software correlations were highest between the least squares segmented algorithms (a/b) and mean values are the most consistent across contexts. Multiple Dt radiomic features were highly diagnostic for benign and malignant differentiation as well as consistent across software platforms. However, for fp metrics, mean and variance, moderately diagnostic on average, were highly consistent among software.
Results of this study indicate some variability in software robustness and benign/malignant differentiation among multi-site data. Some site variability (lesion size, b-value distribution, cohort size, selection criteria) may limit consistency; therefore, a logistic regression model with site adjustment factors was employed to obtain AUCs to account for such heterogeneity in the dataset. LOU AUCs was also derived as a more stringent test of the data, which revealed slight reduction in performance but analogous ranking of parameters. Several Dt metrics showed both software robustness and consistently high diagnostic performance. The robust performance of Dt metrics across different software platforms and sites, particularly for benign/malignant differentiation, supports the potential for widespread implementation of IVIM-DWI beyond its current limited clinical use and research applications (5). On the other hand, several Dp metrics although showing consistency across software platforms were moderately diagnostic on average for benign and malignant differentiation. Several fp metrics showed only slightly lower diagnostic performance in the logistic regression and were highly consistent across software platforms. These results, obtained in the challenging context of a retrospective analysis of heterogeneous multi-site data, underline the potential additive value of fp in future prospective multi-site studies.
In general, consistency of Dt radiomic features from least-squares segmented algorithms and Bayesian algorithms agrees with the study conducted by Scalco et al. (35) in that the choice of the quantification method can be neglected for the extraction of 1st order histogram features from Dt maps in case of retrospective multi-center analyses. However, our study also validated that Dt radiomic features obtained from least-squares segmented fitting could be consistent with the Bayesian fitting and therefore the fitting methods for the estimation of Dt maps could be completely neglected. Their study also revealed that Dp is the most sensitive to quantification method and therefore is less robust across software platforms as demonstrated in this study.
Meeus et al. (41) reported that the constrained IVIM fitting method provides robust and reproducible IVIM parameters particularly Dt and fp in low-perfused brain tissue similar to our study. Dt consistency across software tools reported in the current study was good and in agreement with the reproducibility studies conducted for phantom (42) and kidney (43–46). In addition, we also observed good fp reproducibility in most contexts.
Our present study had some limitations. Since the study was retrospective there was no control over the differences in acquisition protocols or hardware platforms at different sites; this might be one of many reasons for inconsistency in IVIM parameter maps particularly Dp. There is a possibility that robustness and consistency of Dp maps among software packages was impacted by the different amount of outlier rejection fractions particularly in the case of Dp maps. Dp maps from Firevoxel generated considerably more lesion voxels outside the histogram range (0 – 0.1 mm2/s) than did Software b and Software C, which included almost all the lesion voxels. Moreover, the harmonization in b-values would be beneficial for future prospective studies to maintain robustness. Site A in particular may have been affected by heterogeneous sets of b-values and resolution levels within its cohort. The non-Gaussian effect/noise floor was not accounted for in the software used in this study, potentially leading to overestimations of fp values. While the lesion size among the recruited population in the study cannot be foreseen, however the difference in ROI size in patient population in this retrospective study is also because of the multi-slice segmentation (Site A) or single slice segmentation (Site B and Site C) employed, which could also be the reason for some inconsistency in results. Therefore, uniformity in delineating the lesion must be maintained in addition to recruiting a similar cohort size and consistent recruitment criteria for prospective multicenter studies. Finally, there was some heterogeneity in lesion validation standard (biopsy confirmation at Sites A, B vs. radiologic assessment at Site C for benign lesions) in the studied cohorts.
Even in a heterogeneous multisite cohort with varying acquisition and analysis settings, certain 1st order IVIM radiomic features (specifically mean, minimum and maximum of Dt) show potential for robustness and diagnostic applicability. Pseudodiffusion features (fp and Dp) are more sensitive to fit algorithms and clinical cohorts, but the mean and variance of fp still demonstrates potential for consistent behavior among site/software contexts that controlled prospective studies might leverage.
The datasets presented in this article are not readily available because Data sharing is restricted. The current data use agreement doesn’t allow it to be shared and post publicly. However, upon request, under appropriate institutional data-use agreements’ sharing might be possible. Requests to access the datasets should be directed to DiB, ZGliYXNoLmJhc3VrYWxhQG55dWxhbmdvbmUub3Jn.
The data collection for studies involving humans was approved by each participating Site’s local institutional review board (IRB). Data analysis of all Sites’s data in the current work was done under a retrospective IRB approved at NYU, with which all participating Sites partnered with approved Agreements covering the sharing of anonymized data. All studies were conducted in accordance with the local legislation and institutional requirements.
DiB: Data curation, Formal analysis, Methodology, Software, Visualization, Writing – original draft, Validation. AM: Software, Writing – review & editing. XL: Methodology, Writing – review & editing, Formal analysis, Validation, Visualization. JDG: Methodology, Writing – review & editing, Formal analysis, Validation, Visualization. NG: Writing – review & editing. LM: Funding acquisition, Writing – review & editing. KP: Methodology, Funding acquisition, Writing – review & editing, Data curation, Investigation. SCP: Methodology, Funding acquisition, Writing – review & editing, Data curation, Investigation. DeB: Writing – review & editing, Data curation. MK: Data curation, Investigation, Methodology, Writing – review & editing. MH: Data curation, Writing – review & editing, Investigation, Methodology. MI: Data curation, Writing – review & editing, Investigation, Methodology. SBT: Software, Supervision, Validation, Visualization, Data curation, Investigation, Writing – review & editing, Conceptualization, Funding acquisition, Methodology, Project administration, Resources. EES: Data curation, Investigation, Writing – review & editing, Conceptualization, Formal analysis, Funding acquisition, Methodology, Project administration, Resources, Software, Supervision, Validation, Visualization.
The authors declare that financial support was received for the research, authorship, and/or publication of this article. This work was supported by the National Institutes of Health (NIH) (UG3CA239861 (EES, SBT, AM, KP, SCP, DiB, DeB, MK, MI), UH3CA239861 (EES, SBT, DiB, JDG, XL, AM, LM)). EES: This work was performed under the rubric of the Center for Advanced Imaging Innovation and Research (CAI2R, www.cai2r.net), an NIBIB National Center for Biomedical Imaging and Bioengineering (NIH P41 EB017183). JDG and XL: This study was supported by National Institutes of Health/National Cancer Institute Cancer Center Support Grant P30CA016087. SBT: This study was supported by National Institutes of Health/National Cancer Institute Cancer Center Support Grant P30 CA008748. SCP and DeB: This study was supported by Q16 funding from the National Institutes of Health/National Cancer Institute R01CA207290, R01CA248192 and R01CA190299.
We acknowledge Mahesh Keerthivasan and Robert Grimm at Siemens Healthineers and Astrid Saulnier at Olea Medical for assistance and useful discussions.
The authors declare that the research was conducted in the absence of any commercial or financial relationships that could be construed as a potential conflict of interest.
The author(s) declared that they were an editorial board member of Frontiers, at the time of submission. This had no impact on the peer review process and the final decision.
The author(s) declare that no Generative AI was used in the creation of this manuscript.
All claims expressed in this article are solely those of the authors and do not necessarily represent those of their affiliated organizations, or those of the publisher, the editors and the reviewers. Any product that may be evaluated in this article, or claim that may be made by its manufacturer, is not guaranteed or endorsed by the publisher.
The Supplementary Material for this article can be found online at: https://www.frontiersin.org/articles/10.3389/fonc.2025.1524634/full#supplementary-material
1. DeSantis CE, Ma JM, Gaudet MM, Newman LA, Miller KD, Sauer AG, et al. Breast cancer statistics, 2019. Ca-Cancer J Clin. (2019) 69:438–51. doi: 10.3322/caac.21583
2. Padhani AR, Liu G, Koh DM, Chenevert TL, Thoeny HC, Takahara T, et al. Diffusion-weighted magnetic resonance imaging as a cancer biomarker: consensus and recommendations. Neoplasia. (2009) 11:102–25. doi: 10.1593/neo.81328
3. Partridge SC, Nissan N, Rahbar H, Ae K, Sigmund EE. Diffusion-weighted breast MRI: Clinical applications and emerging techniques. J Magn Reson Imaging. (2017) 45:337–55. doi: 10.1002/jmri.25479
4. Gullo RL, Partridge SC, Shin HJ, Thakur SB, Pinker K. Update on DWI for breast cancer diagnosis and treatment monitoring. AJR Am J Roentgenol. (2024) 222:e2329933. doi: 10.2214/AJR.23.29933
5. Honda M, Sigmund EE, Le Bihan D, Pinker K, Clauser P, Karampinos D, et al. Advanced breast diffusion-weighted imaging: what are the next steps? A proposal from the EUSOBI International Breast Diffusion-weighted Imaging working group. Eur Radiol. (2024). doi: 10.1007/s00330-024-11010-0
6. Iima M, Honda M, Sigmund EE, Ohno Kishimoto A, Kataoka M, Togashi K. Diffusion MRI of the breast: Current status and future directions. J Magn Reson Imaging. (2020) 52:70–90. doi: 10.1002/jmri.26908
7. Amornsiripanitch N, Bickelhaupt S, Shin HJ, Dang M, Rahbar H, Pinker K, et al. Diffusion-weighted MRI for unenhanced breast cancer screening. Radiology. (2019) 293:504–20. doi: 10.1148/radiol.2019182789
8. Baltzer P, Mann RM, Iima M, Sigmund EE, Clauser P, Gilbert FJ, et al. Diffusion-weighted imaging of the breast-a consensus and mission statement from the EUSOBI International Breast Diffusion-Weighted Imaging working group. Eur Radiol. (2020) 30:1436–50. doi: 10.1007/s00330-019-06510-3
9. Chen BY, Xie Z, Nie P, Yang D, Hu YC, Liu ST, et al. Multiple b-value diffusion-weighted imaging in differentiating benign from Malignant breast lesions: comparison of conventional mono-, bi- and stretched exponential models. Clin Radiol. (2020) 75:642.e1–.e8. doi: 10.1016/j.crad.2020.03.039
10. Lo Gullo R, Sevilimedu V, Baltzer P, Le Bihan D, Camps-Herrero J, Clauser P, et al. A survey by the European Society of Breast Imaging on the implementation of breast diffusion-weighted imaging in clinical practice. Eur Radiol. (2022) 32:6588–97. doi: 10.1007/s00330-022-08833-0
11. Le Bihan D. What can we see with IVIM MRI? NeuroImage. (2019) 187:56–67. doi: 10.1016/j.neuroimage.2017.12.062
12. Lebihan D, Breton E, Lallemand D, Grenier P, Cabanis E, Lavaljeantet M. Mr imaging of intravoxel incoherent motions - application to diffusion and perfusion in neurologic disorders. Radiology. (1986) 161:401–7. doi: 10.1148/radiology.161.2.3763909
13. Iima M, Yano K, Kataoka M, Umehana M, Murata K, Kanao S, et al. Quantitative non-Gaussian diffusion and intravoxel incoherent motion magnetic resonance imaging: differentiation of Malignant and benign breast lesions. Invest radiol. (2015) 50:205–11. doi: 10.1097/RLI.0000000000000094
14. Bokacheva L, Kaplan JB, Giri DD, Patil S, Gnanasigamani M, Nyman CG, et al. Intravoxel incoherent motion diffusion-weighted MRI at 3.0 T differentiates Malignant breast lesions from benign lesions and breast parenchyma. J Magn Reson Imaging. (2014) 40:813–23. doi: 10.1002/jmri.24462
15. Liang J, Zeng S, Li Z, Kong Y, Meng T, Zhou C, et al. Intravoxel incoherent motion diffusion-weighted imaging for quantitative differentiation of breast tumors: A meta-analysis. Front Oncol. (2020) 10:585486. doi: 10.3389/fonc.2020.585486
16. Ma WL, Mao JW, Wang T, Huang YN, Zhao ZH. Distinguishing between benign and Malignant breast lesions using diffusion weighted imaging and intravoxel incoherent motion: A systematic review and meta-analysis. Eur J Radiol. (2021) 141:109809. doi: 10.1016/j.ejrad.2021.109809
17. Sigmund EE, Cho GY, Kim S, Finn M, Moccaldi M, Jensen JH, et al. Intravoxel incoherent motion imaging of tumor microenvironment in locally advanced breast cancer. Magn Reson Med. (2011) 65:1437–47. doi: 10.1002/mrm.22740
18. Yao FF, Zhang Y. A review of quantitative diffusion-weighted MR imaging for breast cancer: Towards noninvasive biomarker. Clin Imaging. (2023) 98:36–58. doi: 10.1016/j.clinimag.2023.03.016
19. Lu YG, Jansen JFA, Stambuk HE, Gupta G, Lee N, Gonen M, et al. Comparing primary tumors and metastatic nodes in head and neck cancer using intravoxel incoherent motion imaging: A preliminary experience. J Comput Assist Tomo. (2013) 37:346–52. doi: 10.1097/RCT.0b013e318282d935
20. Suo ST, Lin N, Wang H, Zhang LB, Wang R, Zhang S, et al. Intravoxel incoherent motion diffusion-weighted MR imaging of breast cancer at 3.0 tesla: Comparison of different curve-fitting methods. J Magn Reson Imaging. (2015) 42:362–70. doi: 10.1002/jmri.24799
21. Callot V, Bennett E, Decking UKM, Balaban RS, Wen H. In vivo study of microcirculation in canine myocardium using the IVIM method. Magn Reson Med. (2003) 50:531–40. doi: 10.1002/mrm.10568
22. Cho GY, Moy L, Zhang JL, Baete S, Lattanzi R, Moccaldi M, et al. Comparison of fitting methods and b-value sampling strategies for intravoxel incoherent motion in breast cancer. Magn Reson Med. (2015) 74:1077–85. doi: 10.1002/mrm.25484
23. Luciani A, Vignaud A, Cavet M, Van Nhieu JT, Mallat A, Ruel L, et al. Liver cirrhosis: intravoxel incoherent motion MR imaging-pilot study. Radiology. (2008) 249:891–9. doi: 10.1148/radiol.2493080080
24. Freiman M, Perez-Rossello JM, Callahan MJ, Voss SD, Ecklund K, Mulkern RV, et al. Reliable estimation of incoherent motion parametric maps from diffusion-weighted MRI using fusion bootstrap moves. Med Image Anal. (2013) 17:325–36. doi: 10.1016/j.media.2012.12.001
25. Neil JJ, Bretthorst GL. On the use of bayesian probability-theory for analysis of exponential decay data - an example taken from intravoxel incoherent motion experiments. Magn Reson Med. (1993) 29:642–7. doi: 10.1002/mrm.1910290510
26. Orton MR, Collins DJ, Koh DM, Leach MO. Improved intravoxel incoherent motion analysis of diffusion weighted imaging by data driven bayesian modeling. Magn Reson Med. (2014) 71:411–20. doi: 10.1002/mrm.24649
27. While PT. A comparative simulation study of bayesian fitting approaches to intravoxel incoherent motion modeling in diffusion-weighted MRI. Magn Reson Med. (2017) 78:2373–87. doi: 10.1002/mrm.26598
28. Wada A, Akashi T, Hagiwara A, Nishizawa M, Shimoji K, Kikuta J, et al. Deep learning-driven transformation: A novel approach for mitigating batch effects in diffusion MRI beyond traditional harmonization. J Magn Reson Imaging. (2024) 60:510–22. doi: 10.1002/jmri.29088
29. Barbieri S, Gurney-Champion OJ, Klaassen R, Thoeny HC. Deep learning how to fit an intravoxel incoherent motion model to diffusion-weighted MRI. Magn Reson Med. (2020) 83:312–21. doi: 10.1002/mrm.27910
30. Bertleff M, Domsch S, Weingartner S, Zapp J, O’Brien K, Barth M, et al. Diffusion parameter mapping with the combined intravoxel incoherent motion and kurtosis model using artificial neural networks at 3 T. Nmr BioMed. (2017) 30:e3833. doi: 10.1002/nbm.v30.12
31. Kaandorp MPT, Barbieri S, Klaassen R, van Laarhoven HWM, Crezee H, While PT, et al. Improved unsupervised physics-informed deep learning for intravoxel incoherent motion modeling and evaluation in pancreatic cancer patients. Magn Reson Med. (2021) 86:2250–65. doi: 10.1002/mrm.28852
32. Mastropietro A, Procissi D, Scalco E, Rizzo G, Bertolino N. A supervised deep neural network approach with standardized targets for enhanced accuracy of IVIM parameter estimation from multi-SNR images. Nmr Biomed. (2022) 35:e4774. doi: 10.1002/nbm.v35.10
33. Baidya Kayal E, Kandasamy D, Khare K, Bakhshi S, Sharma R, Mehndiratta A. Texture analysis for chemotherapy response evaluation in osteosarcoma using MR imaging. Nmr Biomed. (2021) 34:e4426. doi: 10.1002/nbm.4426
34. Li HH, Sun B, Tan C, Li R, Fu CX, Grimm R, et al. The value of whole-tumor histogram and texture analysis using intravoxel incoherent motion in differentiating pathologic subtypes of locally advanced gastric cancer. Front Oncol. (2022) 12:821586. doi: 10.3389/fonc.2022.821586
35. Scalco E, Rizzo G, Mastropietro A. The quantification of IntraVoxel incoherent motion - MRI maps cannot preserve texture information: An evaluation based on simulated and in-vivo images. Comput Biol Med. (2023) 154:106495. doi: 10.1016/j.compbiomed.2022.106495
36. Vidić I, Jerome NP, Bathen TF, Goa PE, While PT. Accuracy of breast cancer lesion classification using intravoxel incoherent motion diffusion-weighted imaging is improved by the inclusion of global or local prior knowledge with bayesian methods. J Magnet Resonance Imaging. (2019) 50:1478–88. doi: 10.1002/jmri.26772
37. Gurney-Champion OJ, Klaassen R, Froeling M, Barbieri S, Stoker J, Engelbrecht MRW, et al. Comparison of six fit algorithms for the intravoxel incoherent motion model of diffusionweighted magnetic resonance imaging data of pancreatic cancer patients. PloS One. (2018) 13:1–18. doi: 10.1371/journal.pone.0194590
38. Taimouri V, Afacan O, Perez-Rossello JM, Callahan MJ, Mulkern RV, Warfield SK, et al. Spatially constrained incoherent motion method improves diffusion-weighted MRI signal decay analysis in the liver and spleen. Med Phys. (2015) 42:1895–903. doi: 10.1118/1.4915495
39. Barbieri S, Donati OF, Froehlich JM, Thoeny HC. Impact of the calculation algorithm on biexponential fitting of diffusion-weighted MRI in upper abdominal organs. Magnet Resonance Med. (2016) 75:2175–84. doi: 10.1002/mrm.25765
40. Klein R. Bland-Altman and Correlation Plot (2025). Available online at: https://www.mathworks.com/matlabcentral/fileexchange/45049-bland-altman-and-correlation-plot (Accessed December 24, 2024).
41. Meeus EM, Novak J, Withey SB, Zarinabad N, Dehghani H, Peet AC. Evaluation of intravoxel incoherent motion fitting methods in low-perfused tissue. J Magn Reson Imaging. (2017) 45:1325–34. doi: 10.1002/jmri.25411
42. Basukala D, Mikheev A, Sevilimedu V, Gilani N, Moy L, Pinker K, et al. Multisite MRI intravoxel incoherent motion repeatability and reproducibility across 3 T scanners in a breast diffusion phantom: A BReast intravoxel incoherent motion multisite (BRIMM) study. J Magn Reson Imaging. (2024) 59:2226–37. doi: 10.1002/jmri.29008
43. de Boer A, Harteveld AA, Stemkens B, Blankestijn PJ, Bos C, Franklin SL, et al. Multiparametric renal MRI: an intrasubject test-retest repeatability study. J Magn Reson Imaging. (2021) 53:859–73. doi: 10.1002/jmri.27167
44. Makino Y, Ohno N, Miyati T, Hori N, Matsuura Y, Kobayashi S, et al. Tri- and bi-exponential diffusion analyses of the kidney: effect of respiratory-controlled acquisition on diffusion parameters. Radiol Phys Technol. (2023) 16:478–87. doi: 10.1007/s12194-023-00734-1
45. Sigmund EE, Vivier PH, Sui D, Lamparello NA, Tantillo K, Mikheev A, et al. Intravoxel incoherent motion and diffusion-tensor imaging in renal tissue under hydration and furosemide flow challenges. Radiology. (2012) 263:758–69. doi: 10.1148/radiol.12111327
Keywords: IVIM, DWI, breast cancer, diagnosis, multisite, multisoftware, radiomics, robust
Citation: Basukala D, Mikheev A, Li X, Goldberg JD, Gilani N, Moy L, Pinker K, Partridge SC, Biswas D, Kataoka M, Honda M, Iima M, Thakur SB and Sigmund EE (2025) Retrospective BReast Intravoxel Incoherent Motion Multisite (BRIMM) multisoftware study. Front. Oncol. 15:1524634. doi: 10.3389/fonc.2025.1524634
Received: 07 November 2024; Accepted: 28 January 2025;
Published: 24 February 2025.
Edited by:
Frontiers in Oncology Editorial Office, Frontiers Media SA, SwitzerlandReviewed by:
Zheng Han, University of Oklahoma Health Sciences Center, United StatesCopyright © 2025 Basukala, Mikheev, Li, Goldberg, Gilani, Moy, Pinker, Partridge, Biswas, Kataoka, Honda, Iima, Thakur and Sigmund. This is an open-access article distributed under the terms of the Creative Commons Attribution License (CC BY). The use, distribution or reproduction in other forums is permitted, provided the original author(s) and the copyright owner(s) are credited and that the original publication in this journal is cited, in accordance with accepted academic practice. No use, distribution or reproduction is permitted which does not comply with these terms.
*Correspondence: Dibash Basukala, ZGliYXNoLmJhc3VrYWxhQG55dWxhbmdvbmUub3Jn
Disclaimer: All claims expressed in this article are solely those of the authors and do not necessarily represent those of their affiliated organizations, or those of the publisher, the editors and the reviewers. Any product that may be evaluated in this article or claim that may be made by its manufacturer is not guaranteed or endorsed by the publisher.
Research integrity at Frontiers
Learn more about the work of our research integrity team to safeguard the quality of each article we publish.