 Qian Wu
 Junhui Cai1
 Xuefeng Yang
94% of researchers rate our articles as excellent or good
Learn more about the work of our research integrity team to safeguard the quality of each article we publish.
Find out more
ORIGINAL RESEARCH article
Front. Oncol. , 13 February 2025
Sec. Cancer Epidemiology and Prevention
Volume 15 - 2025 | https://doi.org/10.3389/fonc.2025.1461962
This article is part of the Research Topic The Cellular and Molecular Basis of Nutrition and Lifestyle in Cancer Prevention and Progression View all 4 articles
Background: Anemia is a prevalent issue among cancer survivors, which greatly affects their quality of life and overall prognosis. The Naples Prognostic Score (NPS), an inflammation-based prognostic tool, is increasingly acknowledged for its potential in predicting clinical outcomes. This study aims to assess the correlation between anemia status, prognosis, and NPS in cancer survivors.
Methods: This study utilized data from the National Health and Nutrition Examination Survey (NHANES) database spanning from 2003 to 2018, along with death data from the National Death Index (NDI) up to December 31, 2019. A total of 80,312 participants were included, of whom 4,260 were identified as cancer survivors. After applying rigorous exclusion criteria for missing variables, 3,143 participants were retained in the final analysis. NPS was calculated using serum albumin (ALB), total cholesterol (TC), neutrophil to lymphocyte ratio (NLR), and lymphocyte to monocyte ratio (LMR). After adjusting relevant confounding factors, weighted univariable and multivariable logistic regression were utilized to calculate the odds ratios (OR) and 95% confidence intervals (CI). Kaplan-Meier (KM) curves and Log-rank test were employed to compare survival differences among the three patient groups, while Cox proportional regression was utilized to estimate hazard ratio (HR) and 95% CI. Additionally, subgroup analyses were performed to assess the consistency of the outcomes.
Results: Univariable and multivariable analyses indicated positive correlation between NPS and anemia in cancer survivors (P < 0.05). When NPS was treated as continuous variable, crude model showed that higher NPS scores were linked to higher likelihood of anemia in cancer survivors (OR: 1.77, 95% CI: 1.55 - 2.02; P < 0.001), and this association remained significant even after adjusting for all confounding variables (OR: 1.66, 95% CI: 1.45 - 1.90; P < 0.001). Moreover, with Q1 (score = 0) as the reference category, the analysis demonstrated positive association between NPS and the prevalence of anemia in cancer survivors, regardless of whether the model was crude or fully adjusted (P < 0.001). KM analysis indicated that the decline in overall survival from all causes and other causes was significantly more pronounced among anemic cancer survivors in the Q3 (score = 3 or 4) group (P < 0.05). After accounting for all confounding factors, individuals with the highest NPS had HR of 2.46 (95% CI: 1.81 - 3.34) for all-cause mortality. However, there were no significant differences in mortality trends related to cardiovascular or cancer causes (P > 0.05). Subgroup analyses and sensitivity analysis revealed no statistically significant interactions (P for interaction < 0.05).
Conclusions: The study highlights the correlation between higher NPS and an increased prevalence of anemia in cancer survivors, indicating that NPS may serve as a valuable tool for assessing the prognosis of cancer survivors in clinical practice and for guiding interventions aimed at mitigating anemia-related complications.
Driven by an aging population and advancements in treatment strategies, the number of cancer survivors in the United States is rapidly increasing (1). By the year 2024, it is anticipated that there will be 2,001,140 new cancer cases and 611,720 cancer-related deaths in the country (2). Furthermore, this number is expected to rise to 22.1 million by 2030 (3). Despite advancements in cancer detection and treatment, the long-term well-being of cancer survivors remains a significant concern. Anemia is a common complication observed in cancer survivors, which can have a negative impact on their quality of life and overall survival (4). While anemia is relatively straightforward to diagnose among cancer-related complications, there is an urgent need for the enhancement of prognostic tools to improve the identification and management of anemia in cancer patients within clinical practice (5).
The Naples Prognostic Score (NPS) is a composite index based on serum albumin (ALB), total cholesterol (TC), neutrophil to lymphocyte ratio (NLR), and lymphocyte to monocyte ratio (LMR). It has been utilized to forecast outcomes in various diseases, including cancer (6). Previous research has shown that a higher NPS is linked to a worse prognosis in patients with gastrointestinal cancers, hepatocellular carcinoma, and colorectal cancer (7, 8). However, the potential of NPS in predicting anemia in cancer survivors remains underexplored. Given that anemia can significantly impact the prognosis and quality of life in cancer survivors, investigating the relationship between NPS and anemia could offer valuable insights into the management of these patients.
Given these considerations, this study evaluated the association between anemia and NPS in cancer survivors, utilizing data from the National Health and Nutrition Examination Survey (NHANES) spanning from 2003 to 2018. The goal is to ascertain whether NPS can serve as a reliable indicator of anemia in this population, potentially guiding the development of personalized interventions to enhance patient outcomes.
Data used in this study were obtained from the NHANES database of the Centers for Disease Control and Prevention (CDC) from 2003 to 2018 (https://www.cdc.gov/nchs/nhanes/). NHANES is a national, population-based, cross-sectional study designed to assess the health and nutritional status of adults and children in the United States (9). All NHANES protocols used were approved by the CDC National Center for Health Statistics (NCHS) Ethics Review Board, and each participant signed an informed consent form (10).
The study included 80,312 participants who participated in eight consecutive NHANES survey cycles from 2003 to 2018. Cancer survivors were initially defined based on whether they had been informed about cancer or any type of malignancy by a physician or other health professional (variables MCQ220). Those who answered ‘yes’ were then asked about the type of cancer (variables MCQ230A), resulting in the identification of 4260 cancer survivors. Subsequently, any missing variables were excluded, which included laboratory data such as HB, ALB, TC, CBC, and other covariates. Additionally, pregnant women were excluded from the analysis. Based on these criteria, a total of 3,143 participants were ultimately included in the study (Figure 1).
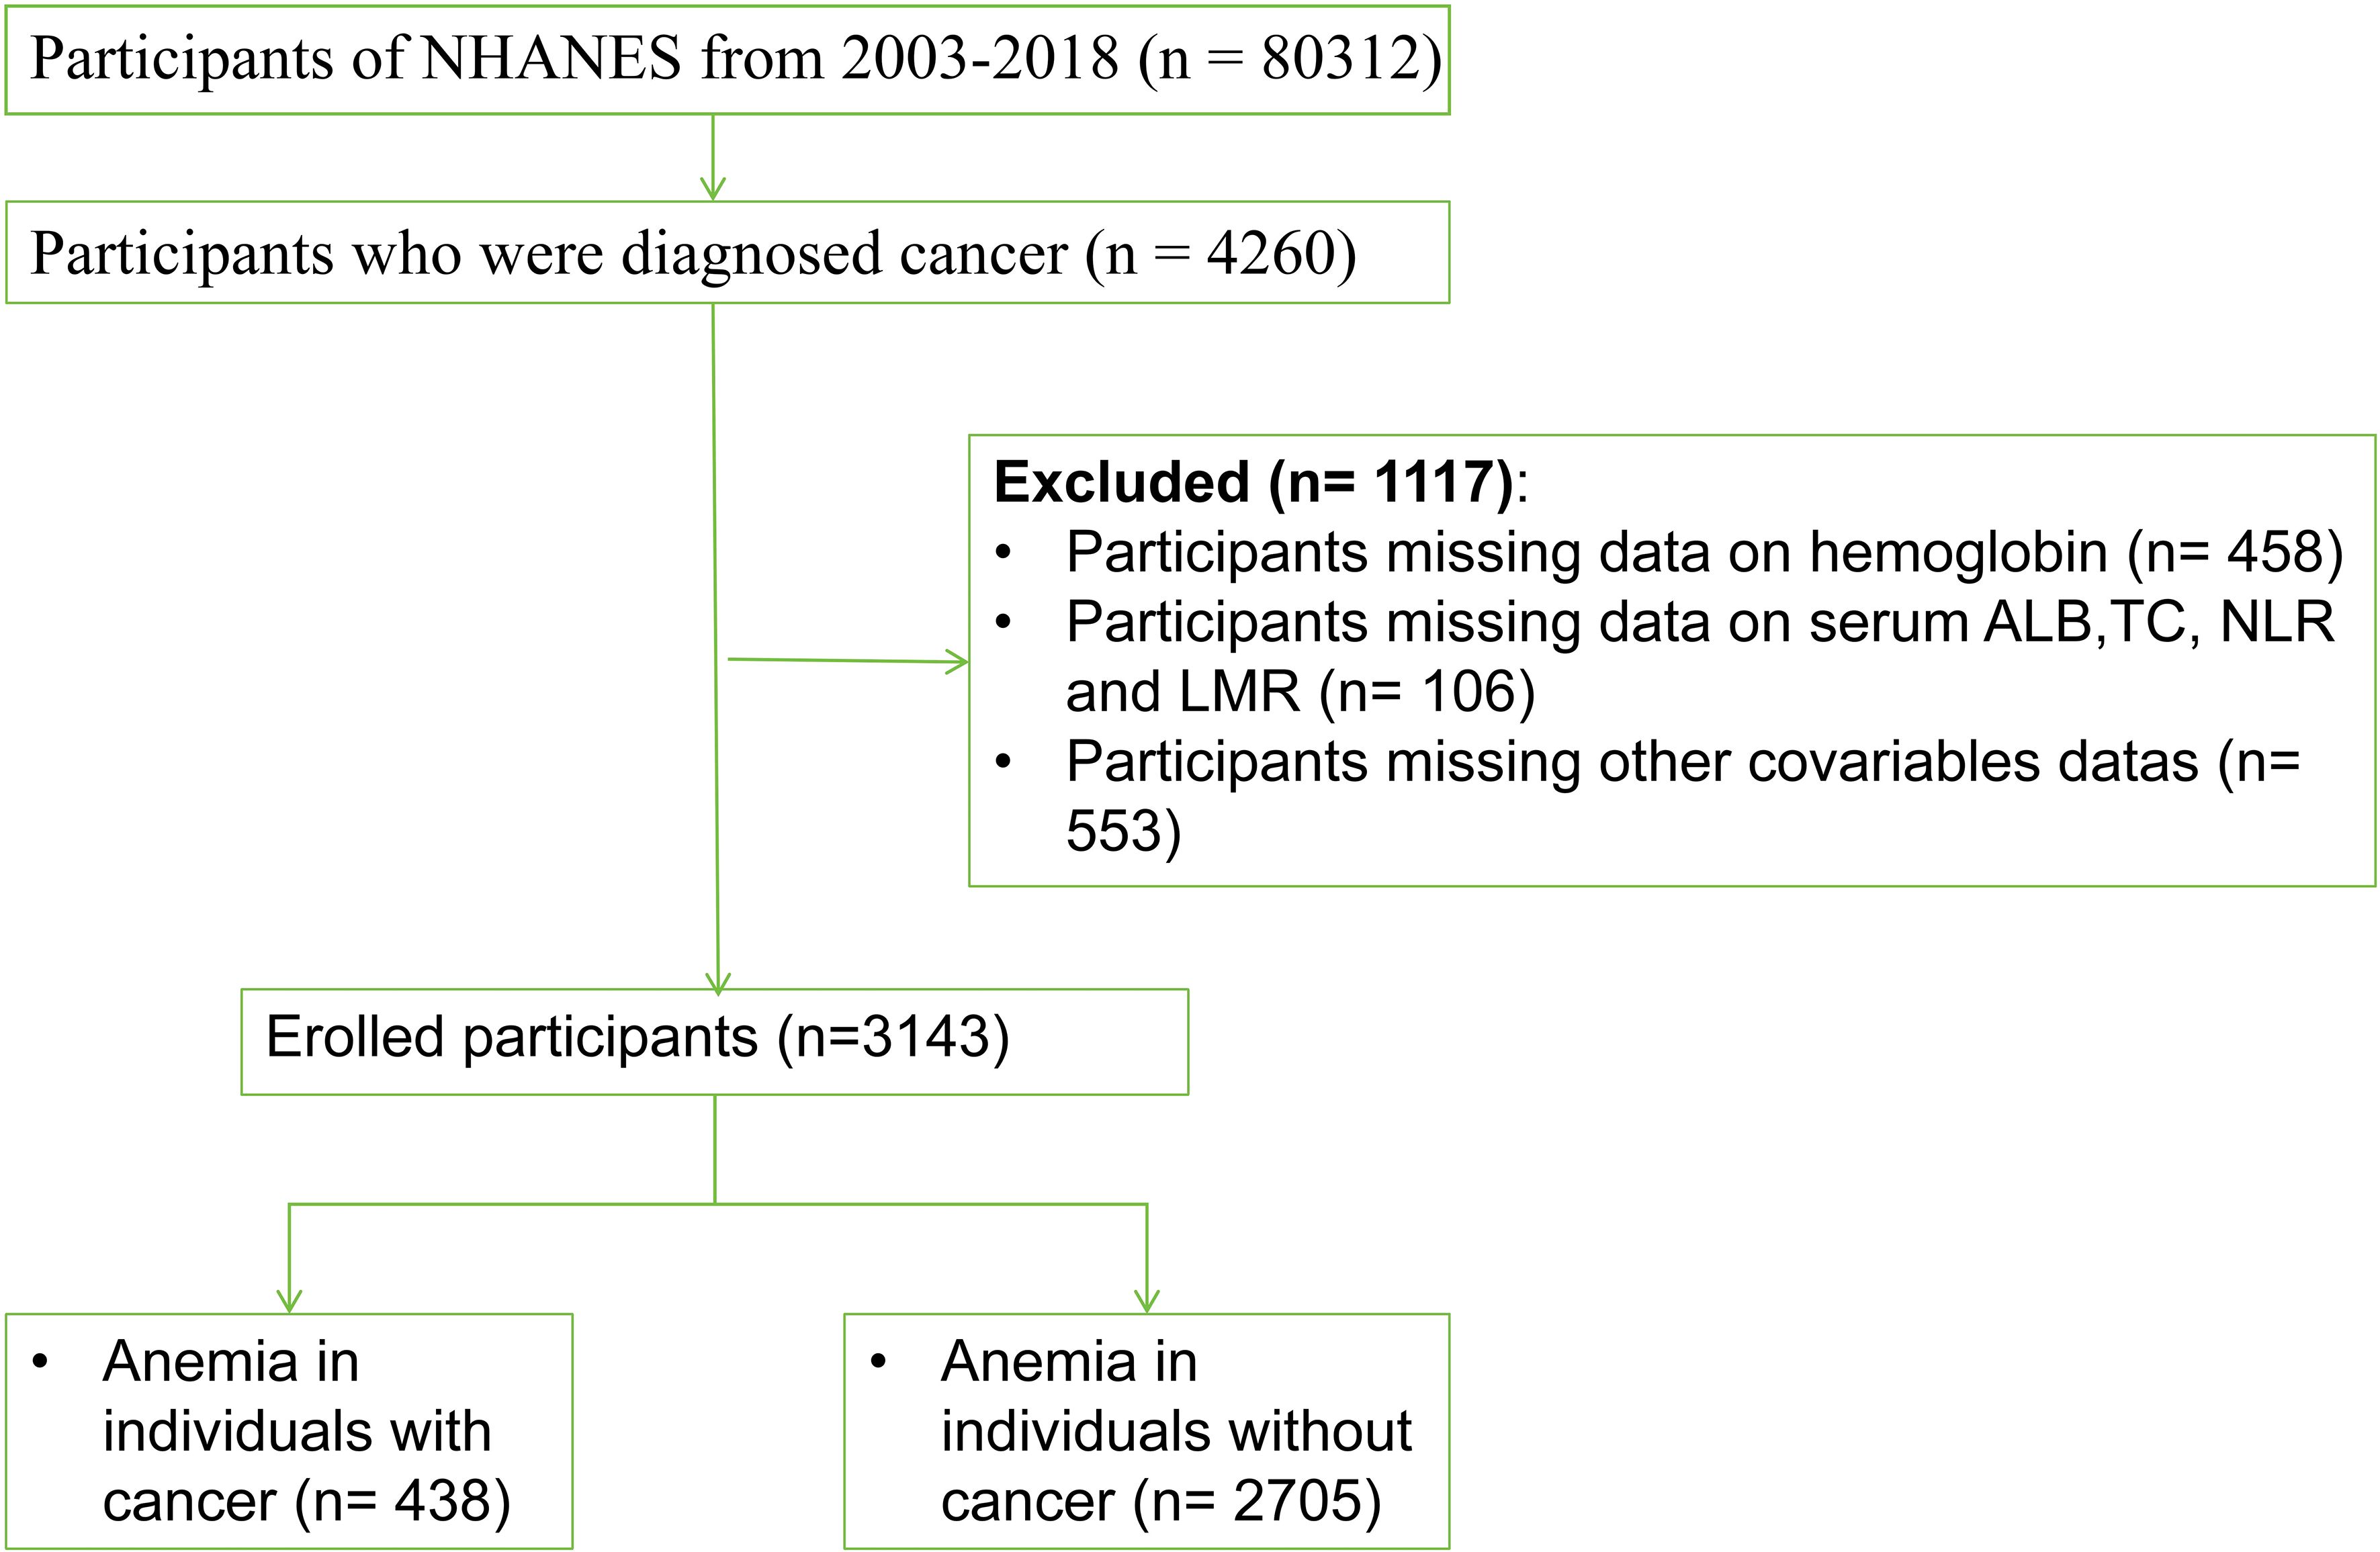
Figure 1. Study participant selection flowchart.
According to the World Health Organization (WHO) guidelines, patients with anemia are defined as follows: women with hemoglobin (Hgb) levels below 12 g/dL and men with Hgb levels below 13 g/dL (11). Complete blood counts were performed on whole blood samples collected using the Beckman Coulter MAXM analyzer.
The NPS is defined by the ALB, TC, NLR, and LMR levels. The albumin concentration was measured using the bromcresol purple (BCP), while cholesterol levels were determined using an enzymatic method. A comprehensive overview of the laboratory methods can be found on the NHANES website. Then, we calculated the value of NLR and LMR according to the following equations (12): NLR = neutrophil count/lymphocyte count, LMR = lymphocyte count/monocyte count. Based on previous reports (13), participants were assigned scores as follows: (1) Score of 0 if serum albumin was ≥ 40 g/L, TC > 180 mg/dL, NLR < 2.96, or LMR > 4.44; (2) Score of 1 if serum albumin < 40 g/L, TC ≤ 180 mg/dL, NLR ≥ 2.96, LMR ≤ 4.44. The NPS is calculated as the sum of the scores for each of the four factors mentioned. Subsequently, participants were categorized into three groups based on their NPS scores: Group 1 with a score of 0, Group 2 with a score of 1 or 2, and Group 3 with a score of 3 or 4.
NHANES data were linked to death certificate records from the National Death Index (NDI). The mortality follow-up study included individuals aged 18 years or older, commencing from the date of survey participation and concluding at the time of death or study censorship (December 31, 2019). Specific causes of death were described using the International Classification of Diseases, Tenth Revision (ICD10) (14). All-cause mortality is defined as death from all causes, cancer mortality refers to the probability of dying from various malignant tumors (ICD-10: C00-C97), and cardiovascular disease with the specific codes of ICD-10: I00-I09, I11, I13, I20-I51 (15).
Baseline data for study participants were collected through questionnaires and laboratory tests, which included information on age, gender (male or female), education levels (less than high school, high school and more than high school), race/ethnicity (Mexican American, non-Hispanic White, non-Hispanic Black, or other race), marital status (never married, divorced/widowed/separated, married/cohabiting), and body mass index (BMI: thin < 18.5 kg/m², normal 18.5 - 23.9 kg/m², overweight 24 - 27.9 kg/m², obese ≥ 28 kg/m²). The poverty income rate (PIR) was calculated as the ratio of household income to household size and categorized into high PIR (≥ 2.14) and low PIR (< 2.14) groups. Participants who had smoked fewer than 100 cigarettes in their lifetime were classified as never smokers, while those who had smoked were categorized smokers. Alcohol drinking was classified as non-drinkers or drinkers. Chronic diseases were assessed based on self-reported medical history, including hypertension (yes or no), hyperlipidemia (yes or no), and diabetes (yes or no). Taking prescribed medication was defined as: Are you currently adhering to the advice to take the prescribed medication?. Physical activity was assessed using the Physical Activity Questionnaire (GPAQ), which inquires about the type, frequency, and duration of physical activity, encompassing encompasses leisure activities, walking or cycling exercises and work-related activities (16). Dietary energy intake was evaluated through two 24-hour dietary recalls and categorized into quartiles based on its distribution.
The analysis was conducted using R version 4.3.3. NHANES employed complex survey design that accounted for weighting and stratification to produce nationally representative estimates of the US population (17). Continuous variables were presented as weighted means (mean ± SD) and evaluated using t tests, while categorical variables were expressed as percentages and analyzed with chi-square tests. Odds ratios (OR) and 95% confidence intervals (CI) were calculated through weighted, univariable and multivariable logistic regression. Cancer-specific mortality was calculated from the date of diagnosis to the date of death from a cancer. Those alive, lost to follow-up or died to other causes were censored. Overall survival (OS) was calculated from the date of cancer diagnosis of cancer diagnosis to date of death from any cause. Those who alive or lost to follow-up were also censored. Kaplan-Meier (KM) survival analysis and Log-rank test were employed to assess the difference in the survival between the three groups based on NPS. Additionally, the Cox proportional hazards model was utilized to determine the adjusted hazard ratio (HR) and 95%CI for all-cause and cause-specific mortality in cancer survivors. The crude model did not involve any adjustments, while Model I was adjusted for age, race, and gender. Model II, which including Model I, additional adjustments for variables such as BMI, PIR, education levels, marital status, alcohol drinking, smoking, hypertension, hyperlipidemia, and diabetes. Furthermore, subgroup analysis and sensitivity analysis were conducted in which factors interacting with NPS were excluded. Statistical significance was defined as P < 0.05.
Table 1 shows the baseline characteristics of the three groups of NPS in the NHANES from 2003 to 2018. A total of 3,143 participants included in the study, with an average age of 62.2 ± 0.36 years, 52.66% were female, the majority of the cancer survivors had soft tissue cancer or were diagnosed with soft tissue cancer (30.58%), and the prevalence of anemia was 13.94%. Compared with Group 1, Group 3 participants were more likely to be older men with higher income levels, no alcohol drinking, no diabetes, hypertension, taking prescribed medication, lower prevalence of anemia and more urinary system cancers, and lower LMR, ALB and TC, but higher NLR (P < 0.05).
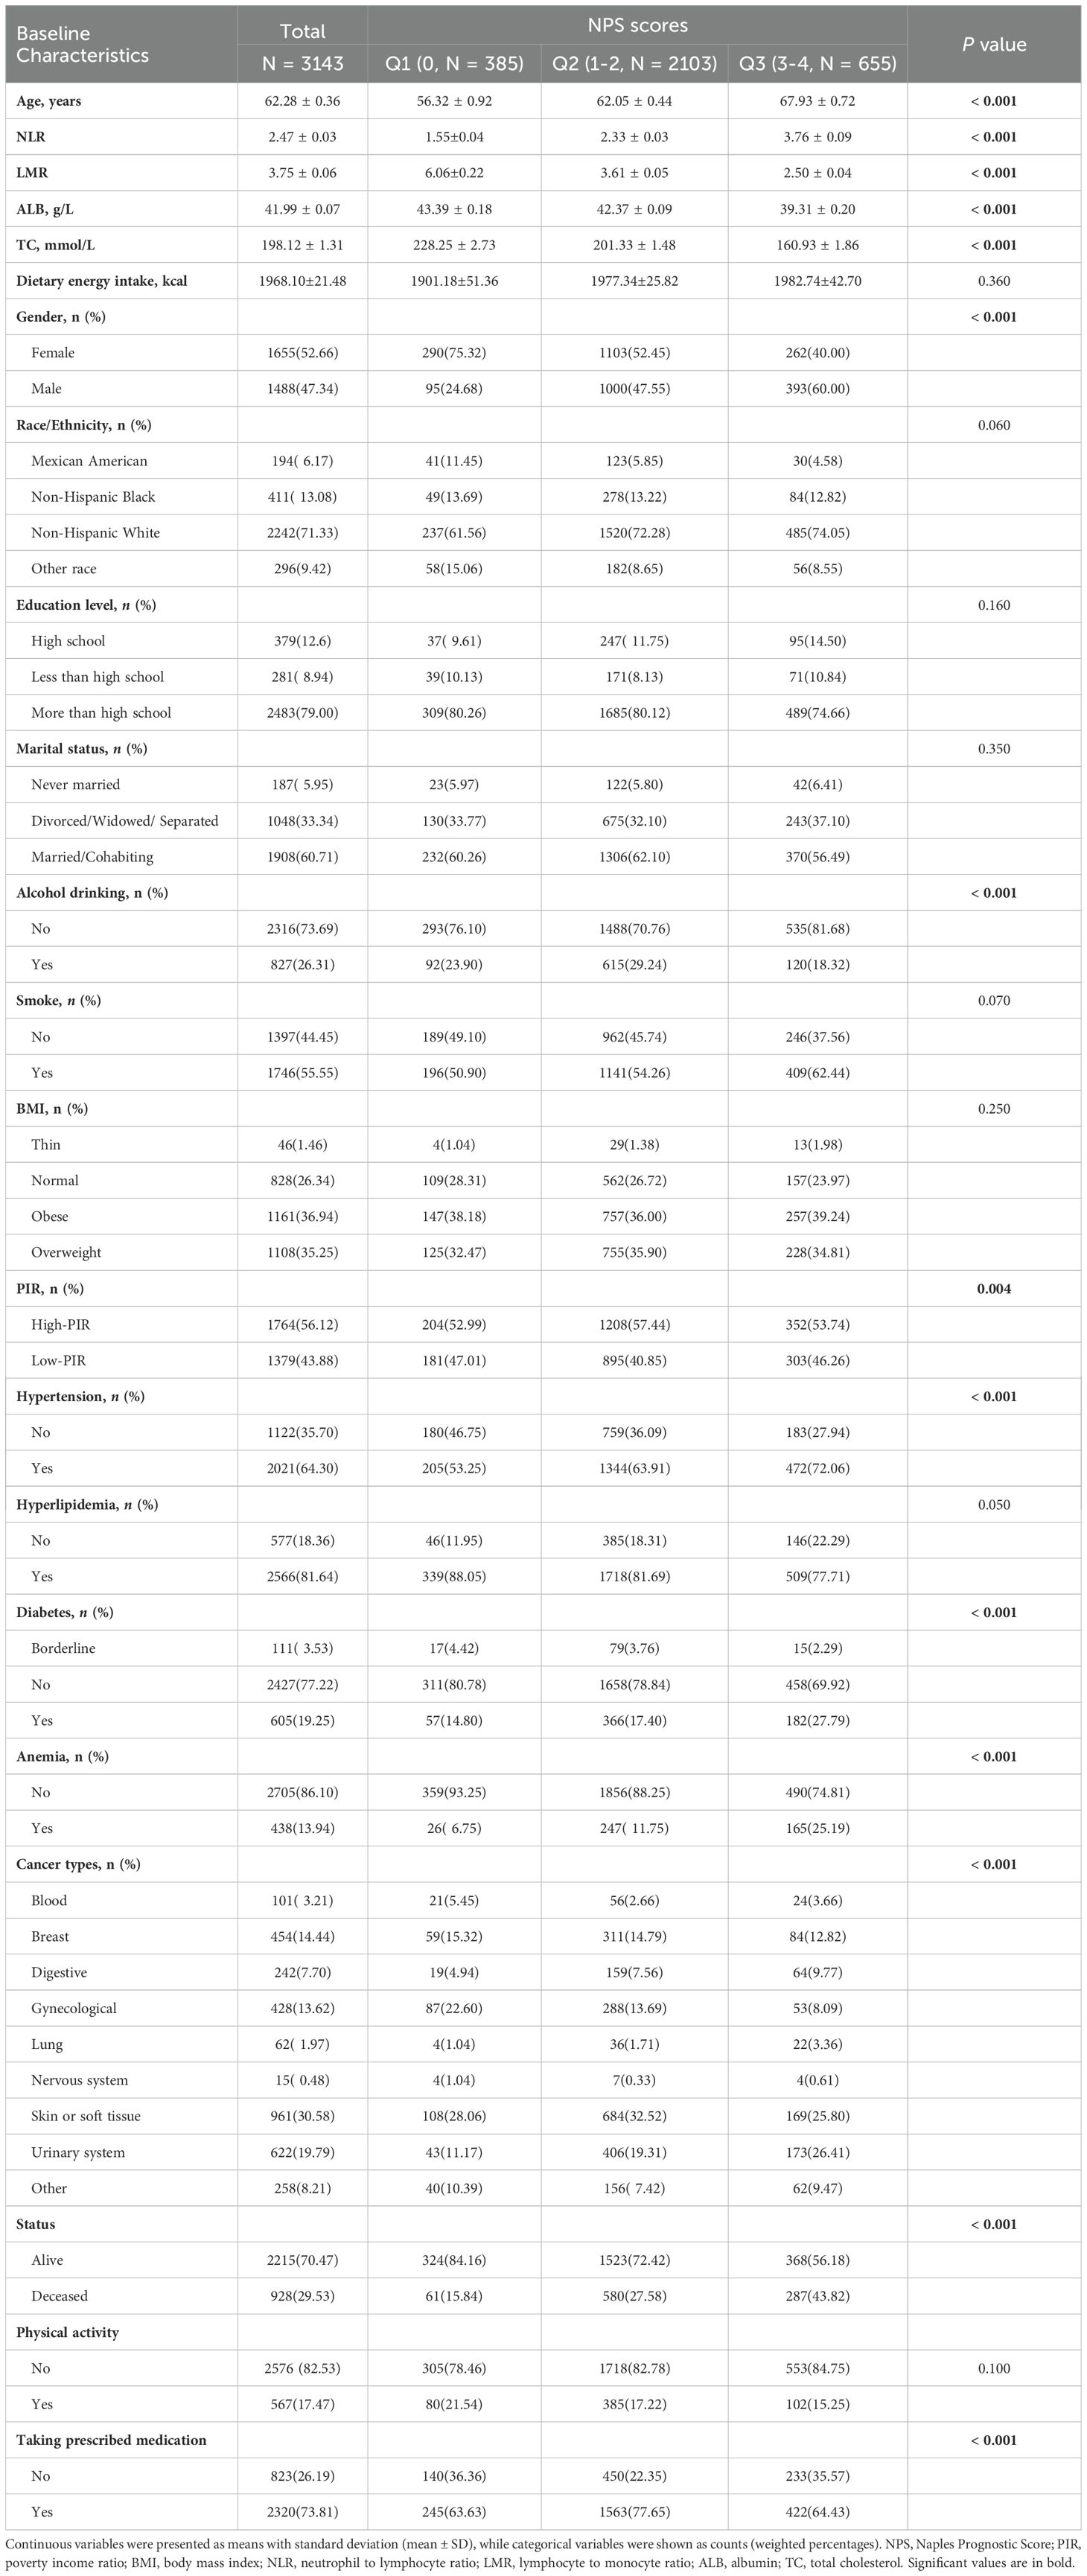
Table 1. Baseline characteristics were described based on the three groups.
Additionally, as of December 31, 2019, a total of 928 all-cause deaths were recorded, of which 205 were attributed to heart disease and 286 to cancer. Compared with survivors, individuals who died from all causes were more likely to be older, smoker, no alcohol drinking, Hispanic white women who were married or cohabiting, had higher NPS, and had higher educational levels. Furthermore, patients who died showed more hypertension, hyperlipidemia and diabetes. They also had lower ALB, TC, and LMR levels, but higher NLR levels (P < 0.001) (Table 2).
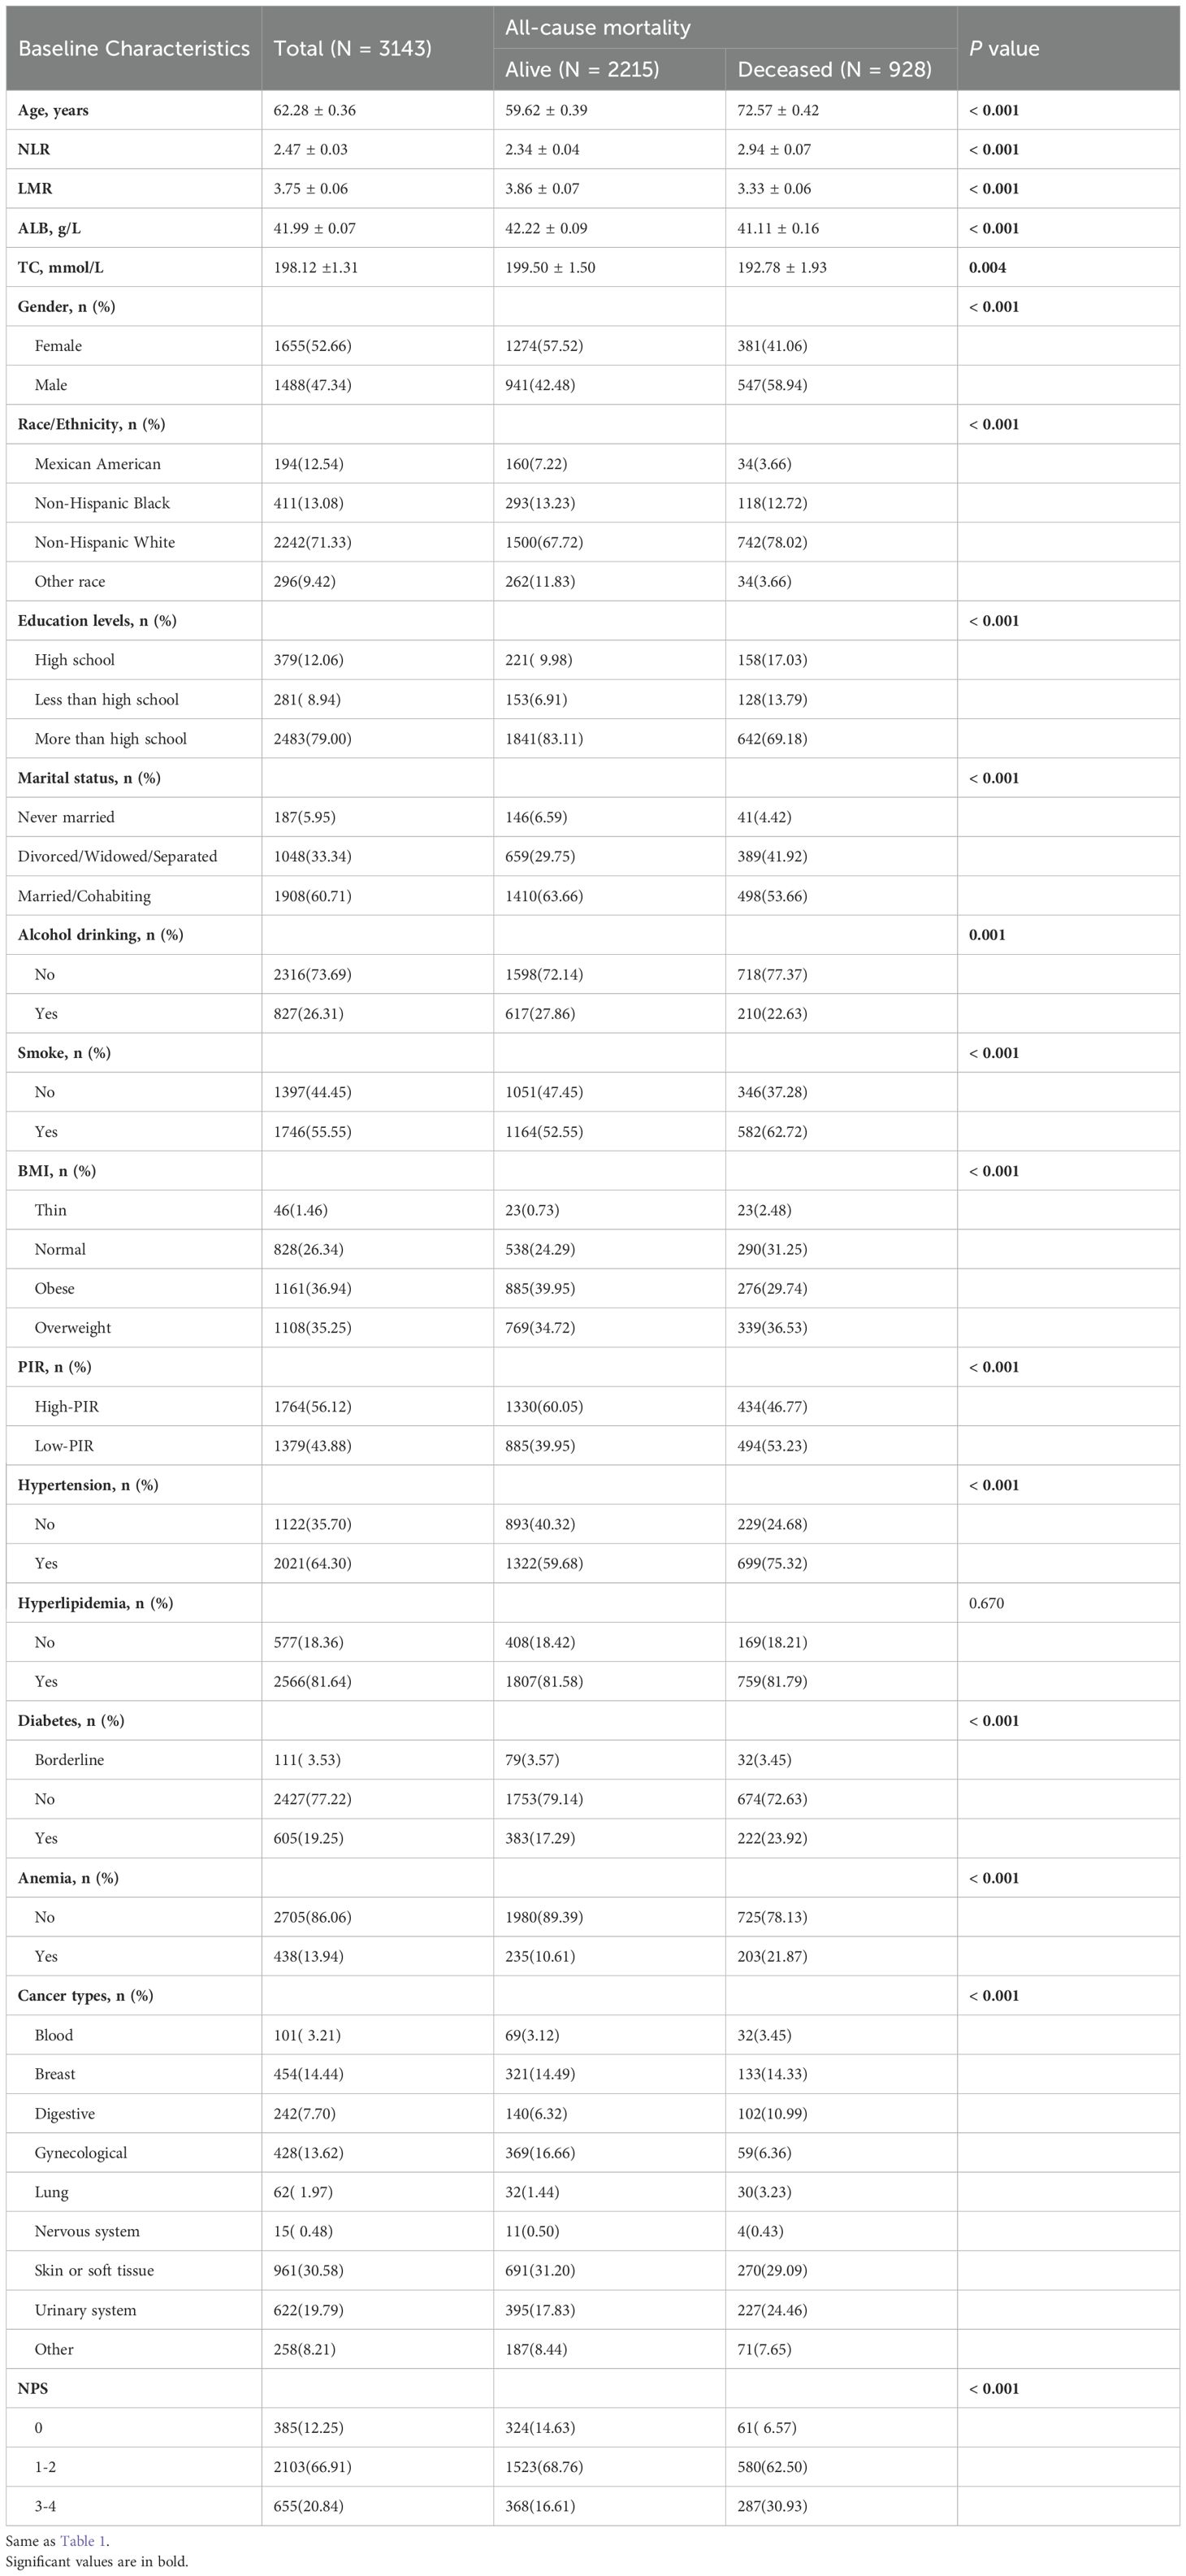
Table 2. Baseline characteristics were described based on all-cause mortality.
The association between NPS and the prevalence of anemia in cancer survivors was examined using univariable and multivariable logistic regression model, revealing that age, race, hypertension, ALB, and NPS were statistically significant (P < 0.05) (Supplementary Table 1). When NPS was treated as continuous variable, the crude model demonstrated positive association between NPS and the prevalence of anemia in cancer survivors (OR: 1.77, 95% CI: 1.55 - 2.02; P < 0.001), and the association remained statistically significant even after adjusting for all confounding factors (OR: 1.66, 95% CI: 1.45 - 1.90; P < 0.001). Furthermore, when NPS was categorized into three groups (Q1, Q2, Q3), with group 0 serving as reference category, the analysis revealed that NPS remained positively associated with the prevalence of anemia in cancer survivors, regardless of whether the model was crude or fully adjusted (P for trend < 0.0001) (Table 3).
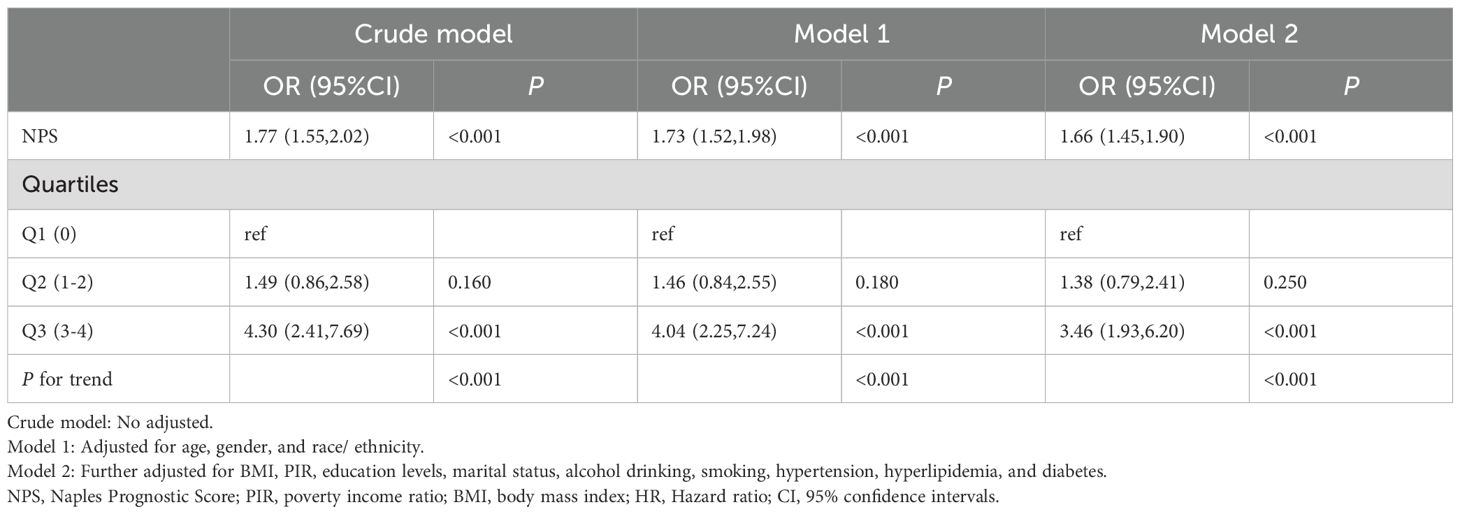
Table 3. The association between NPS and anemia in cancer survivors.
Utilizing the KM curve, our study revealed significant differences in the prognosis of anemia among cancer survivors within the NPS group. The findings indicated that cancer survivors with anemia in the Q3 group faced heightened risk of mortality from all causes and other reasons compared to the other groups (P < 0.001) (Figure 2).
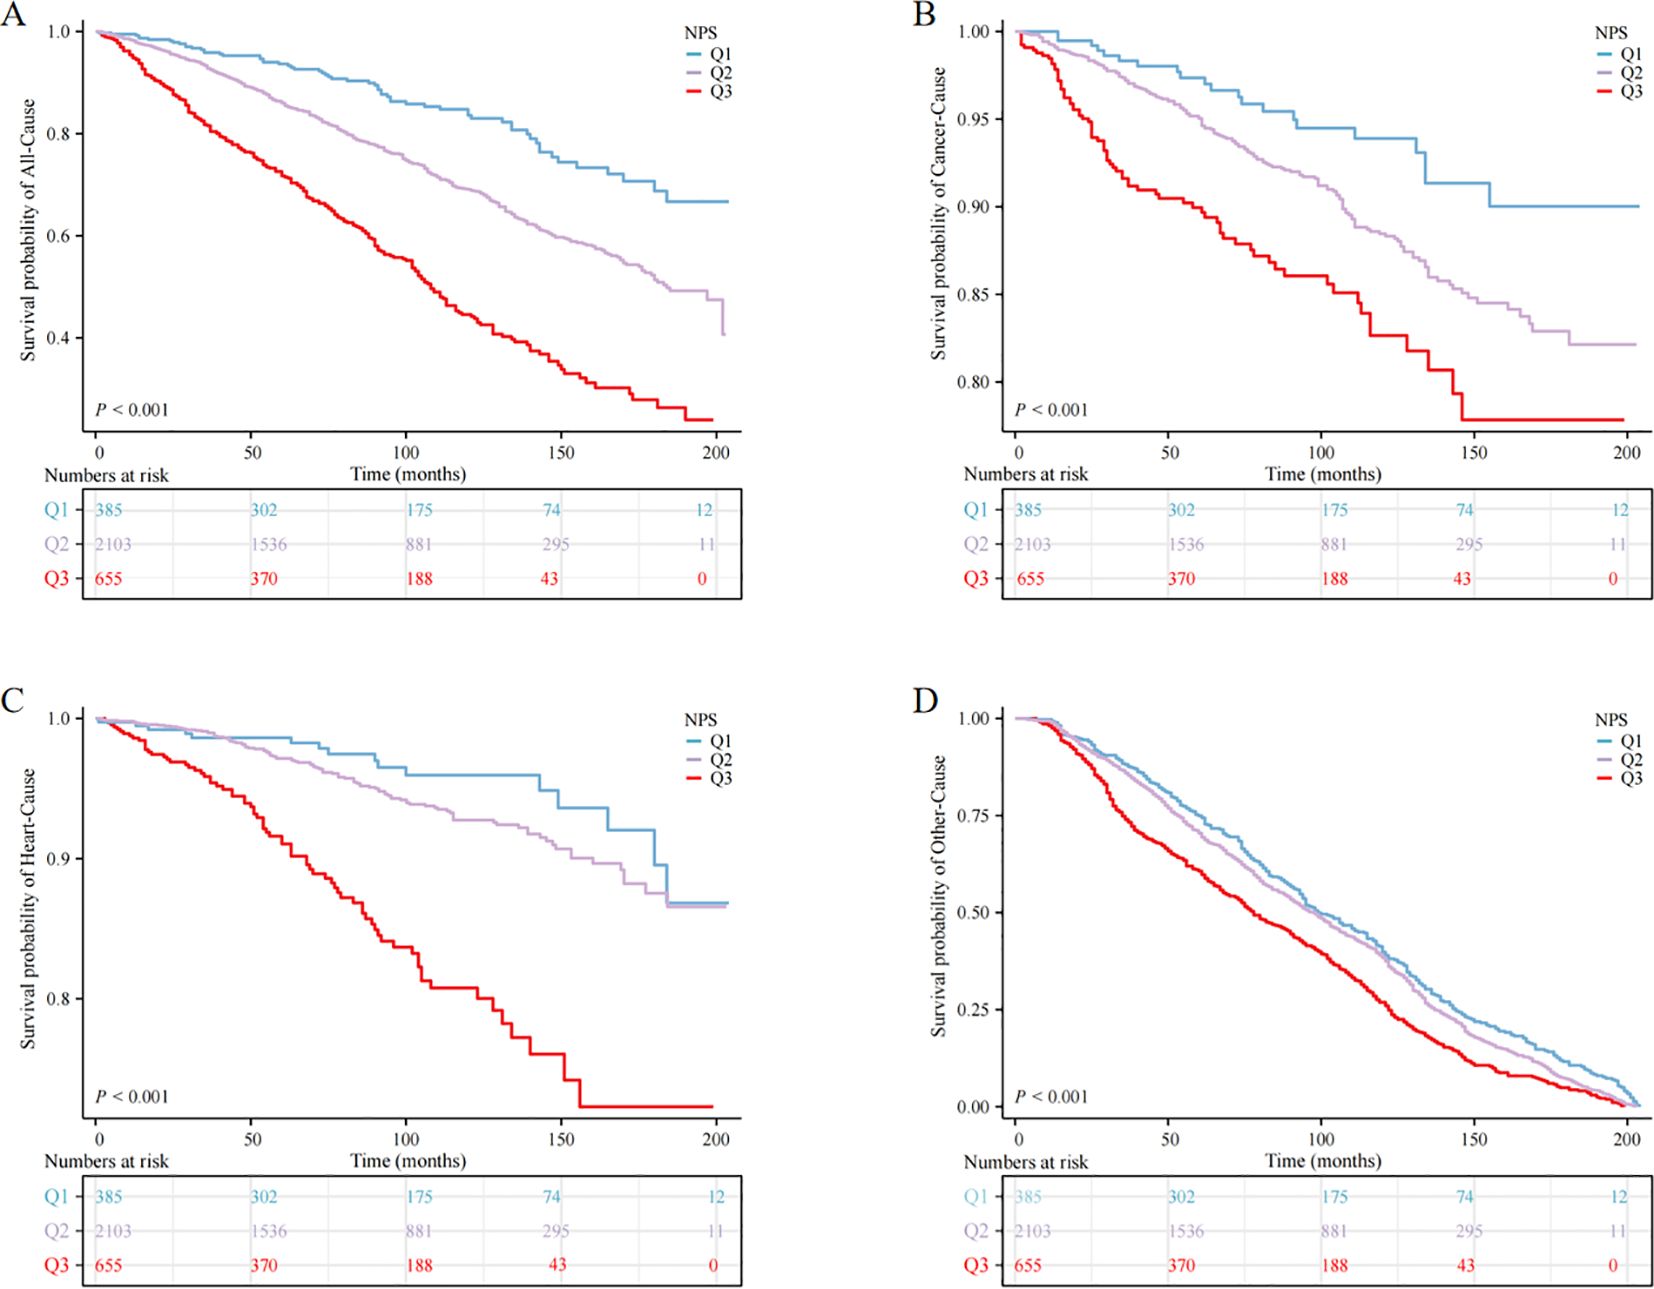
Figure 2. Kaplan‒Meier survival curve of mortality; (A) all-cause mortality, (B) cancer mortality, (C) heart mortality, (D) other mortality.
When NPS was used as continuous variable, it was positively correlated with all-cause, cardiovascular, and cancer mortality, both in the crude model and in models 1 and 2 (P < 0.05). When NPS was examined in categories, in the adjusted model, cancer survivors in the Q3 group exhibited reduced survival rates relative to the Q1 group, and the unadjusted model (crude model) showed HR (95% CI) of 5.46 (3.86, 7.72), in model 1, the HR (95% CI) adjusted for age, sex and race was 2.45 (1.81, 3.33), and in model 2, the HR (95% CI) after controlling for all covariates was 2.46 (1.81, 3.34), this escalating trend was statistically significant (P for trend < 0.001). Nevertheless, no significant trend was observed in cardiovascular mortality and cancer-specific mortality (P > 0.05) (Table 4).
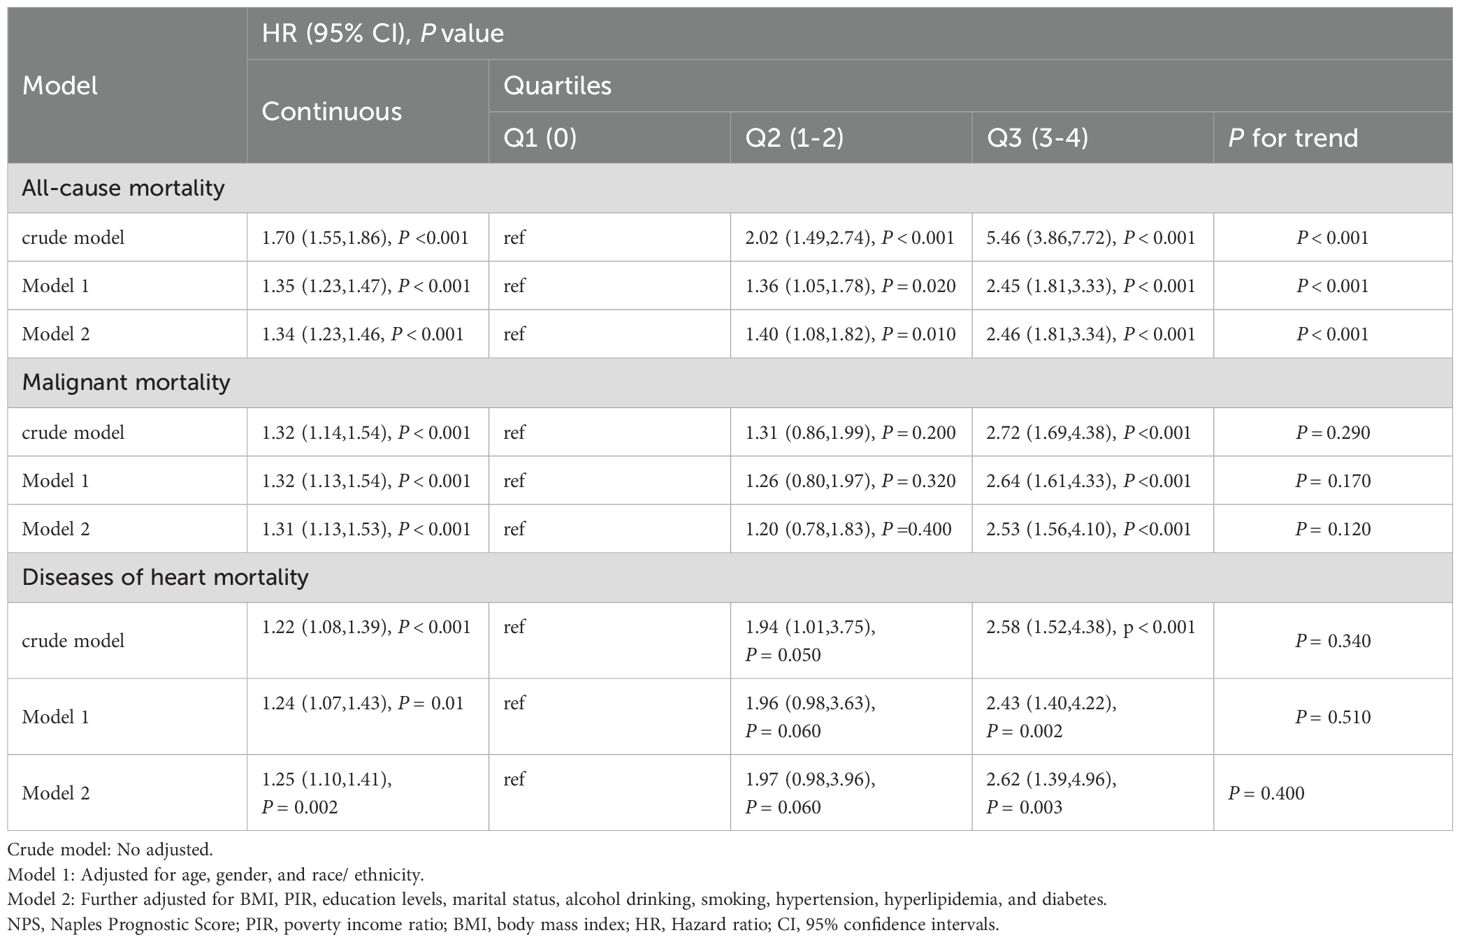
Table 4. Cox regression analysis for all-cause and cause-specific mortality among cancer patients according to NPS.
In the subgroup analysis (Figure 3), the study examined various demographic factors, including gender (male, female), education levels (less than high school, high school and more than high school), race/ethnicity (Mexican American, non-Hispanic White, non-Hispanic Black, or other race), BMI (thin, normal, overweight and obese), marital status (never married, divorced/widowed/separated, married/cohabiting), smoking (yes, no), alcohol drinking (yes, no), PIR (high PIR, low PIR), hypertension (yes, no), hyperlipidemia (yes, no), diabetes (yes, no and borderline), taking prescribed medication (yes, no), physical activity (yes, no), and Dietary energy intake (Q1, Q2, Q3, Q4). Importantly, the subgroup analysis revealed that the majority of results were in line with the primary analysis trends. No significant interactions were observed between the subgroups and NPS scores with regard to the association with anemia in cancer survivors (P for interaction > 0.05). To further assess the robustness of our study results, we conducted sensitivity analysis that included participants who were taking prescribed medication, as well as those reporting physical activity and dietary energy intake. The results indicated no significant changes (P for interaction > 0.05) (Supplementary Figure 1).
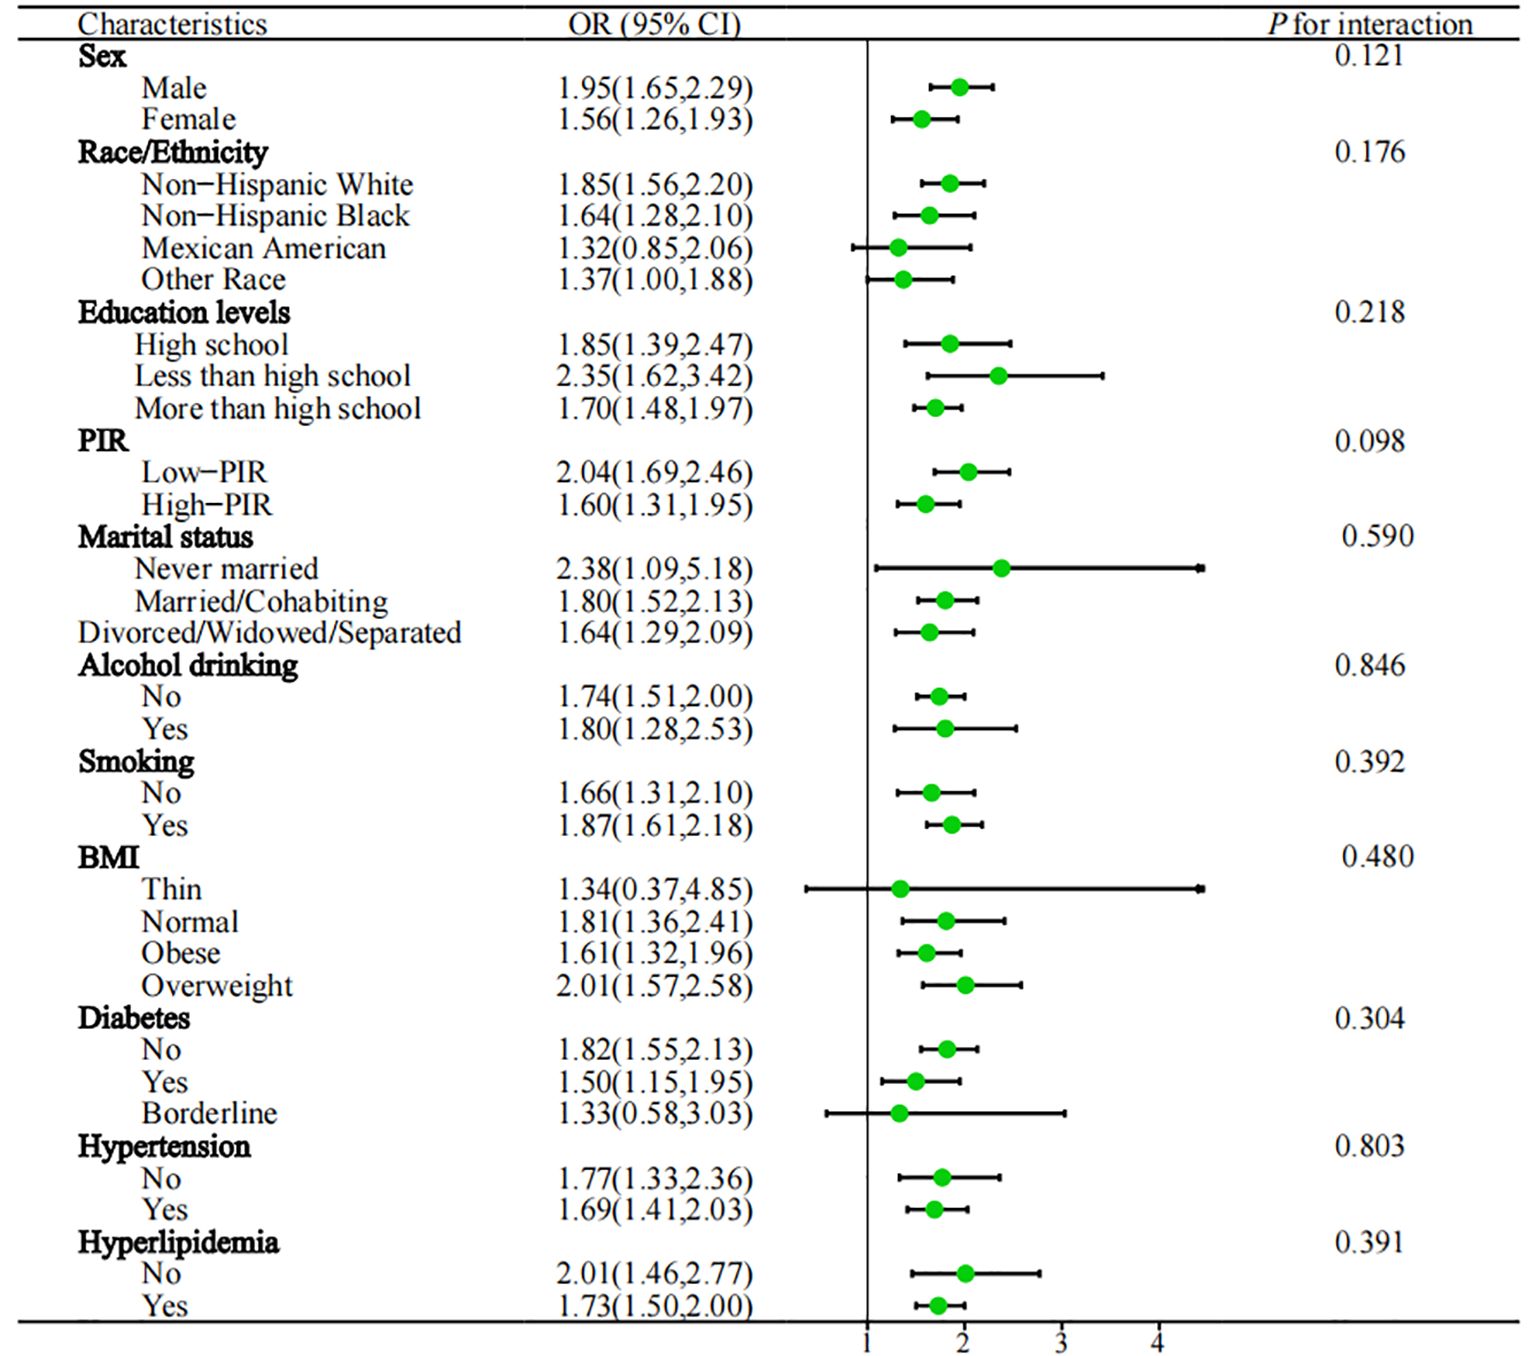
Figure 3. Subgroups analysed are shown in forest plots. PIR, poverty income ratio; BMI, body mass index; OR, odds ratio; 95%CI, 95% confidence interval; Q1: ≦ 1350kcal, 1350 < Q2 ≦ 1800kcal, 1800 < Q3 ≦ 2300kcal, Q4 > 2300kcal.
To our knowledge, this study represents the initial exploration of the correlation between anemia and NPS in cancer survivors, utilizing data from the NHANES database spanning from 2003 to 2018. The results revealed noteworthy correlation between elevated NPS scores and increased prevalence of anemia, and increased rates of all-cause mortality, even after controlling all covariates. Furthermore, subgroup analyses were performed to assess the consistency of the outcomes. Our findings offer valuable insights for further investigations into the connection between NPS and anemia in cancer survivors.
Anemia is a common complication among cancer survivors, often arising from the disease itself or its treatment methods, such as chemotherapy and radiation therapy (18). This condition can exacerbate fatigue, restrict physical capabilities, and diminish overall survival. Therefore, it is crucial to manage anemia effectively to improve the quality of life for cancer survivors (19). Given the considerable burden of anemia in this population, it is crucial to identify reliable markers that can facilitate early detection and treatment of this condition.
Recently, there is growing evidence indicating correlation between inflammation, nutrition, and immunity with cancer prognosis (20, 21). NLR is an inflammatory marker that has been linked to poorer prognosis in cancer patients (22, 23). Our study found that higher NLR was significantly associated with higher prevalence of anemia in cancer survivors (OR: 1.13, 95% CI: 1.06 - 1.21). Additionally, LMR is another inflammatory marker that has been associated with cancer prognosis. Lower LMR indicates higher monocyte count relative to lymphocytes, suggesting state of chronic inflammation and immune suppression (24). Our study demonstrated that lower LMR, contributing to higher NPS scores, was significantly associated with increased anemia prevalence. This connection implies that interventions targeting immune responses could potentially reduce the incidence of anemia in cancer survivors. Furthermore, low ALB levels are linked to poor nutritional status, inflammation, and negative clinical outcomes in cancer survivors (25). Our study found that lower ALB levels were significantly associated with higher prevalence of anemia in cancer survivors (OR: 0.85, 95% CI: 0.80 - 0.90). This discovery aligns with previous research indicating that hypoalbuminemia is marker of systemic inflammation and malnutrition, which can lead to anemia (26). TC serves as a measure of the overall cholesterol levels in the blood, encompassing low-density lipoprotein and high-density lipoprotein. Dyslipidemia is prevalent condition among cancer patients and can be influenced by the cancer or its treatment (27). Our research revealed that low TC levels were linked to greater likelihood of developing anemia (OR: 0.99, 95% CI: 0.99 - 0.99). This correlation could be attributed to the essential role of cholesterol in maintaining cell membrane structure and function, potentially hindering erythropoiesis in its absence (28). Another explanation could be that low TC levels may indicate an underlying chronic illness or malnutrition, both known contributors to the development of anemia.
Various nutrition and inflammation related markers are utilized as prognostic indicators for cancer patients. Among these, nutrition-related indices such as NPS (29), prognostic nutritional index (PNI) (30), nutritional risk index (NRI) (31), and controlled nutritional status (CONUT) (32) have emerged as independent prognostic factors for patient survival in cancer (33–35). The association between NPS and anemia in cancer survivors has not yet been investigated. NPS takes into account ALB, TC, NLR and LMR, all of which have previously demonstrated correlations with outcomes in various cancer types. NPS provides comprehensive reflection of systemic inflammation and malnutrition in diverse conditions, showing superior predictive ability compared to PNI and CONUT scores (36). Peng et al. indicated that NPS can serve as an effective indicator for predicting OS and progression free survival (PFS) in patients with non small cell lung cancer (NSCLC), and further compared the prognostic value of the NPS with other scoring systems (PNI and CONUT), indicating that NPS (AUC3-year OS: 0.703, AUC3-year PFS: 0.681) was superior to other scoring systems (PNI: AUC3-year OS: 0.606, AUC3-year PFS: 0.597; CONUT: AUC3-year OS: 0.575, AUC3-year PFS: 0.558) for predicting long-term survival (34). Liang et al. demonstrated that the NPS, a composite indicator of inflammation and nutritional status, is positively associated with cancer incidence (OR: 1.64, 95% CI:1.36 - 1.97) and is closely linked to an elevated risk of all-cause (HR: 2.57, 95% CI:1.73 - 3.84), cardiovascular mortality (HR: 3.44, 95% CI:1.64 - 7.21) and cancer-specific mortality (HR: 1.60, 95% CI:1.01 - 2.56) (29). Our study, also based on analysis of the NHANES database focusing on cancer survivors with anemia, found significant relationship between higher NPS scores and increased prevalence of anemia, even after adjusting for confounding variables. Furthermore, we identified higher all-cause mortality associated with elevated NPS scores, although no significant association was observed with cause-specific mortality. Therefore, additional data and analysis are warranted to explore the potential influence of NPS score on cause-specific mortality.
Our study offers several notable advantages over previous research. Firstly, we utilized a large, nationally representative sample. Secondly, the NPS integrates overall inflammatory status and nutritional status and is superior to single inflammation or nutritional indicators in assessing tumor progression. Finally, we implemented hierarchical and interaction analyses to assess the consistency of the outcomes.
However, there are certain limitations to our study. Firstly, the results from the NHANES study were based on self-reports from patients, which are prone to recall bias. Secondly, despite controlling for various potential confounding variables, there may still be other factors influencing the analysis. Additionally, The cross-sectional design of this study fundamentally limits the ability to establish causal relationships between variables. Therefore, prospective multicenter studies are needed to validate our results in the near future.
In summary, our study highlights significant association between higher NPS and the prevalence of anemia in cancer survivors. These findings suggest that NPS could serve as valuable prognostic tool in this population. Future research should aim to validate these results through clinical trials and explore the underlying biological mechanisms.
The datasets presented in this study can be found in online repositories. The names of the repository/repositories and accession number(s) can be found below: https://www.cdc.gov/nchs/nhanes/index.htm.
All NHANES protocols used were approved by the CDC National Center for Health Statistics (NCHS) Ethics Review Board. The studies were conducted in accordance with the local legislation and institutional requirements. The participants provided their written informed consent to participate in this study. Written informed consent was obtained from the individual(s) for the publication of any potentially identifiable images or data included in this article.
QW: Data curation, Software, Writing – original draft, Writing – review & editing. JC: Conceptualization, Data curation, Investigation, Writing – original draft. JL: Conceptualization, Data curation, Methodology, Writing – original draft. GH: Conceptualization, Data curation, Methodology, Writing – review & editing. XY: Formal analysis, Funding acquisition, Supervision, Writing – review & editing. LC: Methodology, Resources, Visualization, Writing – review & editing. YS: Conceptualization, Investigation, Methodology, Writing – original draft. XG: Funding acquisition, Project administration, Resources, Supervision, Writing – original draft, Writing – review & editing.
The author(s) declare that financial support was received for the research, authorship, and/or publication of this article. 1. The National Natural Science Foundation of China (82460465) 2. The Natural Science Foundation of Guizhou Province (Qian KeHe Basic Proieet ZK [2024] 346) 3. The Science and Technology Plan of GuizhouProvince (Guizhou Science and Technology Foundation-ZK[2024]General 344).
We thank the researchers, staff, and participants of the National Health and Nutrition Examination Survey for their valuable contributions, which enabled our analysis.
The authors declare that the research was conducted in the absence of any commercial or financial relationships that could be construed as a potential conflict of interest.
All claims expressed in this article are solely those of the authors and do not necessarily represent those of their affiliated organizations, or those of the publisher, the editors and the reviewers. Any product that may be evaluated in this article, or claim that may be made by its manufacturer, is not guaranteed or endorsed by the publisher.
The Supplementary Material for this article can be found online at: https://www.frontiersin.org/articles/10.3389/fonc.2025.1461962/full#supplementary-material
1. Qiu X, Wu Q, Zhang Y, Zhu Y, Yang M, Tao L. Association between life’s essential 8 and frailty status among cancer survivors in the United States: a cross-sectional analysis. BMC Public Health. (2024) 24:1287. doi: 10.1186/s12889-024-18741-1
2. Siegel RL, Giaquinto AN, Jemal A. Cancer statistics. CA Cancer J Clin. (2024) 74:12–49. doi: 10.3322/caac.21830
3. Miller KD, Nogueira L, Mariotto AB, Rowland JH, Yabroff KR, Alfano CM, et al. Cancer treatment and survivorship statistics. CA Cancer J Clin. (2019) 69:363–85. doi: 10.3322/caac.21565
4. Knight K, Wade S, Balducci L. Prevalence and outcomes of anemia in cancer: a systematic review of the literature. Am J Med. (2016) 116:11S–26S. doi: 10.1016/j.amjmed.2003.12.008
5. Crawford J, Cella D, Cleeland CS, Cremieux PY, Demetri GD, Sarokhan BJ, et al. Relationship between changes in hemoglobin level and quality of life during chemotherapy in anemic cancer patients receiving epoetin alfa therapy. Cancer. (2010) 98:1824–32. doi: 10.1002/cncr.10763
6. Galizia G, Lieto E, Auricchio A, Cardella F, Mabilia A, Basile N, et al. Naples prognostic score (NPS) is a predictor of long-term outcome in patients with colorectal cancer: a cohort study. Ann Med Surgery. (2018) 31:30–4. doi: 10.1016/j.amsu.2018.05.002
7. Deng Q, He B, Liu X, Yue J, Ying H, Pan Y, et al. Prognostic value of pre-operative inflammatory response biomarkers in gastric cancer patients and the construction of a predictive model. J Trans Med. (2018) 16:129. doi: 10.1186/s12967-015-0409-0
8. Ma W, Zhang P, Qi J, Gu L, Zang M, Yao H, et al. Prognostic value of the Naples prognostic score in hepatocellular carcinoma patients undergoing transarterial chemoembolization: a retrospective study. BMC Cancer. (2020) 20:1–10. doi: 10.1016/j.jhep.2019.06.001
9. Fulgoni K, Fulgoni VL 3rd. Trends in total, added, and natural phosphorus intake in adult Americans, NHANES 1988-1994 to NHANES 2015-2016. Nutrients. (2021) 13:2249. doi: 10.3390/nu13072249
10. Neuhouser M. The importance of healthy dietary patterns in chronic disease prevention. Nutr Res. (2019) 70:3–6. doi: 10.1016/j.nutres.2018.06
11. Safiri S, Kolahi AA, Noori M, Nejadghaderi SA, Karamzad N, Bragazzi NL, et al. Burden of anemia and its underlying causes in 204 countries and territories, 1990-2019: results from the Global Burden of Disease Study 2019. J Hematol Oncol. (2021) 14:185. doi: 10.1186/s13045-021-01202-2
12. Liu K, Tang S, Liu C, Ma J, Cao X, Yang X, et al. Systemic immune-inflammatory biomarkers (SII, NLR, PLR and LMR) linked to non-alcoholic fatty liver disease risk. Front Immunol. (2024) 15:1337241. doi: 10.3389/fimmu.2024.1337241
13. Galizia G, Lieto E, Auricchio A, Cardella F, Mabilia A, Podzemny V, et al. Naples prognostic score, based on nutritional and inflammatory status, is an independent predictor of long-term outcome in patients undergoing surgery for colorectal cancer. Dis Colon Rectum. (2017) 60:1273–84. doi: 10.1097/DCR.00000000000000961
14. Outland B, Newman MM, William MJ. Health Policy basics: implementation of the International classification of Disease, 10th Revision. Ann Intern Med. (2015) 163:554–6. doi: 10.7326/M15-1933
15. World Health Organization. (2016). Available online at: https://icd.who.int/browse10/2016/en (Accessed May 15, 2024).
16. Fei Z, Zhu X, Shan Q, Wan F, Tu Y, Lv X. Association between sleep disorders and physical activity in middle-aged Americans: a cross-sectional study from NHANES. BMC Public Health. (2024) 24:1248. doi: 10.1186/s12889-024-18665-w
17. Ezeani A, Tcheugui JBE, Agurs-Collins T. Sex/gender differences in metabolic syndrome among cancer survivors in the US: an NHANES analysis. J Cancer Surviv. (2024) 18:1648–56. doi: 10.1007/s11764-023-01404-2
18. Knight K, Wade S, Balducci L. Prevalence and outcomes of anemia in cancer: a systematic review of the literature. Am J Med. (2004) 116(Suppl 7A):11S–26S. doi: 10.1016/j.amjmed.2003.12.008
19. Caro JJ, Salas M, Ward A, Goss G. Anemia as an independent prognostic factor for survival in patients with cancer: a systematic, quantitative review. Cancer. (2001) 91:2214–21. doi: 10.1002/1097-0142(20010615)91:12<2214::AID-CNCR1251>3.0.CO;2-P
20. Mantovani A, Allavena P, Sica A, Balkwill F. Cancer-related inflammation. Nature. (2008) 454:436–44. doi: 10.1038/nature07205
21. Fujino S, Miyoshi N, Saso K, Sasaki M, Ishikawa S, Takahashi Y, et al. A model based on a new inflammation-nutrition score and TNM stage for predicting overall survival of patients with colorectal cancer. Ann Oncol. (2018) 29:ix40. doi: 10.1093/annonc/mdy431.041
22. Martinez Cannon BA, Castro Sanchez A, Barragan-Carrillo R, de la Rosa Pacheco S, Platas A, Fonseca A, et al. Adherence to adjuvant tamoxifen in Mexican young women with breast cancer. Patient Prefer Adherence. (2021) 15:1039–49. doi: 10.2147/PPA.S296747
23. Tokumaru Y, Oshi M, Murthy V, Tokumaru Y, Oshi M, Murthy V, et al. Low intratumoral genetic neutrophil-to-lymphocyte ratio (NLR) is associated with favorable tumor immune microenvironment and with survival in triple negative breast cancer (TNBC). Am J Cancer Res. (2021) 11:5743–55.
24. Li J, Chen Q, Luo X, Hong J, Pan K, Lin X, et al. Neutrophil-to-lymphocyte ratio positively correlates to age in healthy population. J Clin Lab Analysis. (2015) 29:437–43. doi: 10.1002/jcla.21791
25. Don BR, Kaysen G. Serum albumin: relationship to inflammation and nutrition. Semin Dialysis. (2004) 17:432–7. doi: 10.1111/j.0894-0959.2004.17603.x
26. Gupta D, Lis CG, Pretorius K. The role of serum albumin in the prediction of cancer survival: a systematic review of the epidemiological literature. J Cancer Epidemiol. (2010) 9:69. doi: 10.1186/1475-2891-9-69
27. Zebrack BJ, Isaacson S. Psychosocial care of adolescent and young adult patients with cancer and survivors. J Clin Oncol. (2012) 30:1221–6. doi: 10.1200/JCO.2011.39.5467
28. Nelson RH. Hyperlipidemia as a risk factor for cardiovascular disease. Primary Care: Clinics Office Practice. (2013) 40:195–211. doi: 10.1016/j.pop.2012.11.003
29. Liang C, Zhang C, Song J, Yan L, Xiao Y, Cheng N, et al. The Naples prognostic score serves as a predictor and prognostic indicator for cancer survivors in the community. BMC Cancer. (2024) 24:696. doi: 10.1186/s12885-024-12448-7
30. Zhao L, Shen X, Yang L, Wang P, Zhang J, Liu N, et al. Association of prognostic nutritional index with mortalities in American adult cancer survivors: A cohort study based on NHANES, 1999-2018. Food Sci Nutr. (2023) 12:1834–46. doi: 10.1002/fsn3.3877
31. Xie H, Ruan G, Zhang Q, Ge Y, Song M, Zhang X, et al. Combination of nutritional risk index and handgrip strength on the survival of patients with cancer cachexia: A multi- center cohort study. J Inflammation Res. (2022) 15:1005–15. doi: 10.2147/JIR.S352250
32. Kheirouri S, Alizadeh M. Prognostic potential of the preoperative controlling nutritional status (CONUT) score in predicting survival of patients with cancer: A systematic review. Adv Nutr. (2021) 12:234–50. doi: 10.1093/advances/nmaa102
33. Miyamoto Y, Hiyoshi Y, Daitoku N, Okadome K, Sakamoto Y, Yamashita K, et al. Naples prognostic score is a useful prognostic marker in patients with metastatic colorectal cancer. Dis Colon Rectum. (2019) 62:1485–93. doi: 10.1097/DCR.0000000000001484
34. Peng SM, Ren JJ, Yu N, Xu JY, Chen GC, Li X, et al. The prognostic value of the Naples prognostic score for patients with non-small-cell lung cancer. Sci Rep. (2022) 12:5782. doi: 10.1038/s41598-022-09888-1
35. Li J, Yang W, Yuan Y, Zuo M, Li T, Wang Z, et al. Preoperative Naples prognostic score is a reliable prognostic indicator for newly diagnosed glioblastoma patients. Front Oncol. (2022) 12:775430. doi: 10.3389/fonc.2022.775430
Keywords: Naples Prognostic Score, National Health and Nutrition Examination Survey, anemia, cancer survivors, prognosis, cross-sectional studies
Citation: Wu Q, Cai J, Li J, He G, Yang X, Chen L, Sun Y and Gou X (2025) Association of Naples Prognostic Score with anemia in cancer survivors: a study based on NHANES database. Front. Oncol. 15:1461962. doi: 10.3389/fonc.2025.1461962
Received: 09 July 2024; Accepted: 23 January 2025;
Published: 13 February 2025.
Edited by:
Maicon Roberto Kviecinski, Federal University of Santa Catarina, BrazilReviewed by:
Saber A Amin, University of Nebraska Medical Center, United StatesCopyright © 2025 Wu, Cai, Li, He, Yang, Chen, Sun and Gou. This is an open-access article distributed under the terms of the Creative Commons Attribution License (CC BY). The use, distribution or reproduction in other forums is permitted, provided the original author(s) and the copyright owner(s) are credited and that the original publication in this journal is cited, in accordance with accepted academic practice. No use, distribution or reproduction is permitted which does not comply with these terms.
*Correspondence: Xiaoxia Gou, Z291eHgyMDIwQDE2My5jb20=
Disclaimer: All claims expressed in this article are solely those of the authors and do not necessarily represent those of their affiliated organizations, or those of the publisher, the editors and the reviewers. Any product that may be evaluated in this article or claim that may be made by its manufacturer is not guaranteed or endorsed by the publisher.
Research integrity at Frontiers
Learn more about the work of our research integrity team to safeguard the quality of each article we publish.