
94% of researchers rate our articles as excellent or good
Learn more about the work of our research integrity team to safeguard the quality of each article we publish.
Find out more
ORIGINAL RESEARCH article
Front. Oncol. , 20 December 2024
Sec. Neuro-Oncology and Neurosurgical Oncology
Volume 14 - 2024 | https://doi.org/10.3389/fonc.2024.1507335
 Xinli Zhang1
 Jue Lu1
 Xiaoming Liu1
 Peng Sun2
 Qian Qin1
 Zhengdong Xiang1
 Lan Cheng1
 Xiaoxiao Zhang2
 Xiaotong Guo1
 Jing Wang1*
Objectives: To comprehensively and noninvasively predict glioma grade, IDH mutation status, 1p/19q codeletion status, and MGMT promoter methylation status using chemical exchange saturation transfer (CEST)-based tumor pH assessment and metabolic profiling.
Methods: We analyzed 128 patients with pathologically confirmed adult diffuse glioma. CEST-derived metrics based on tumor regions were obtained using five-pool Lorentzian analysis and pH_weighted analysis. Histogram features of these metrics were computed to characterize tumor heterogeneity. These features were subsequently employed for glioma grading and molecular genotyping of IDH, 1p/19q and MGMT. Logistic regression analysis was used to predict the grade and IDH genotypes. The diagnostic performance was evaluated using receiver operating characteristic (ROC) curves and area under the curve (AUC) analysis.
Results: The DS, MT and pH_weighted differed significantly between grade II and III, as well as grade III and IV. The amide, NOE, pH_weighted and MTR3.5 showed significantly differences within IDH genotypes. Regression models achieved the highest AUC for differentiating grade II from III (0.80, 95% CI: 0.64-0.91), grade III from IV (0.83, 95% CI: 0.74-0.90), and IDH mutant from wild status (0.84, 95% CI: 0.77-0.90). MT and pH_weighted metrics were the only indicators for identifying 1p/19q codeletion in grade II and grade III gliomas, respectively. MT 90th percentile (0.87, 95% CI: 0.65-0.98) and pH_weighted 25th percentile (0.83, 95% CI: 0.56-0.97) showed the best performance, respectively. The MTR3.5 was the only indicator which can distinguish MGMT promoter methylation and unmethylation gliomas, within MTR3.5 90th percentile performed best (AUC = 0.79, 95% CI: 0.61- 0.91).
Conclusion: CEST-based tumor pH assessment and metabolic profiling demonstrated promising potential for predicting glioma grade, IDH mutation status, 1p/19q codeletion, and MGMT genotype.
Gliomas are the most common primary brain tumors, characterized by high mortality and morbidity rates (1). According to the 2021 World Health Organization (WHO) Central Nervous System (CNS) classification, adult-type diffuse gliomas are categorized into astrocytomas (isocitrate dehydrogenase mutant [IDH-mt], 1p/19q non- codeletion), oligodendrogliomas (IDH-mt, 1p/19q codeletion), and glioblastomas (IDH wild-type, [IDH-wt]) (2). IDH-wt gliomas are classified as grade IV, oligodendrogliomas as grade II to III, and astrocytomas range from grade II to IV. Glioma grading influences treatment approaches, with high-grade gliomas typically managed by maximal surgical resection followed by adjuvant radiotherapy and chemotherapy, while low-grade gliomas are treated based on the extent of resection and patient factors such as age to determine postoperative adjuvant therapy (3). The new classification guidelines highlight the importance of genotypes and molecular characteristics. Research indicates that patients with 1p/19q codeletion respond better to radiotherapy and chemotherapy, resulting in improved prognosis (4). Additionally, O-6-methylguanine-DNA methyltransferase (MGMT) promoter methylation predicts a better response to temozolomide and enhances survival (5). However, molecular typing often relies on pathological diagnosis, which is invasive, prone to sampling errors, and costly.
MRI is the most commonly used preoperative diagnostic tool for gliomas. Grade IV gliomas frequently exhibit ring enhancement on T1-weighted images, whereas grade II and III gliomas typically show no enhancement, making it challenging to distinguish these grades on imaging. Most studies focus on the comparison between low-grade gliomas (grade II) and high-grade gliomas (grades III and IV), or between lower-grade gliomas (grades II and III) and higher-grade gliomas (grade IV), while the identification of grade III gliomas remains relatively vague. Diffusion-weighted imaging (DWI) has been used to predict MGMT promoter methylation and 1p/19q codeletion (5, 6). However, apparent diffusion coefficient (ADC) measurements are often based on subjective regional delineation, and the heterogeneity of gliomas may introduce selection bias in region of interest settings. Some studies have found that the methylated MGMT promoter type exhibited larger ADC values, while others reported no differences between methylated and unmethylated types (7, 8). Dynamic susceptibility contrast (DSC) and dynamic contrast-enhanced (DCE) imaging have also demonstrated value in predicting MGMT promoter methylation and 1p/19q codeletion, but both methods require contrast agent injection (9–12).
The degree of tumor metabolism is often positively correlated with malignancy. High-grade gliomas exhibit vigorous cell proliferation, angiogenesis or vascular disruption, and an accumulation of more acidic metabolic byproducts in the extracellular space. Persistent hypoxia, increased glycolysis, and heightened acidity in tumors can affect tumor invasiveness and alter gene expression (13, 14). Therefore, characterizing tumor metabolism and the acidity of the tumor microenvironment is a feasible method for grading and predicting molecular subtypes.
Chemical exchange saturation transfer (CEST) imaging is an MRI technique that enhances the detection of low- concentration biomolecules by exploiting the chemical exchange properties between molecules and water protons (15). The exchange rates of certain protons are pH-dependent, making this technique useful for assessing tissue pH, which is crucial for evaluating the tumor microenvironment (16). Previous studies have demonstrated that CEST imaging of amine protons in glutamine molecules can be used as a noninvasive pH-weighted MRI technique for human and preclinical investigations of malignant gliomas (17). Amide proton transfer (APT) imaging is a relatively mature CEST technology, with amide protons in tissues serving as the primary source of the APT signal (18). Studies have shown that APT imaging holds potential for the differential diagnosis, grading, molecular typing, and prognostic evaluation of gliomas (19–24). However, APT imaging based on magnetization transfer asymmetry analysis can overlook confounding factors, including intrinsic semi-solid magnetization transfer (MT) asymmetry and low-field relayed nuclear Overhauser effect (NOE) signals. Methods such as multi-pool Lorentzian analysis and inverse Z-spectrum analysis have been proposed to enhance CEST quantitative analysis (25, 26). Multi-pool Lorentzian analysis decomposes the Z-spectrum into five components: amide, NOE, amine, DS, and MT. Amide and amine represent mobile proteins/peptides and creatine, respectively. The DS signal is related to water proton concentration and tissue relaxation time, while the MT signal originates from immobile macromolecules. The NOE signal comes from the aliphatic and olefinic components of various metabolites, including mobile proteins, peptides, and lipids. Multi-pool Lorentzian analysis has demonstrated potential value in glioma grading and the diagnosis of IDH and 1p/19q genotypes (25, 27).
In this study, we quantitatively describe glioma metabolism and the pH characteristics of the tumor region based on CEST imaging using multi-pool Lorentzian and pH analyses. We explore their value in assessing glioma grade, IDH mutation, 1p/19q codeletion, and MGMT promoter methylation. Additionally, histogram analysis was employed to better characterize tumor heterogeneity.
This study received approval from the Institutional Review Board. Between January 2023 and March 2024, 415 consecutive patients suspected of having gliomas who underwent preoperative CEST MRI examinations were enrolled. The inclusion criteria were: (1) histologically diagnosed adult-type diffuse gliomas, and (2) age >18 years. Figure 1 illustrates the participant flowchart.
Scans were performed using a 3TIngenia CX Philips scanner with an 80 mT/mgradient, 200 mT/m/s slew rate, and a 32-channel head coil. Routine structural MRI included T1-weighted images before and after Gd enhancement, and T2-FLAIR images, with a total acquisition time of 10 minutes. A custom-developed CEST sequence based on 2D multi-offset, single-slice, single-shot turbo spin echo (TSE) was applied to the maximum cross-sectional areas of the tumors with the following acquisition parameters: radiofrequency (RF) saturation power, 0.9 µT; saturation duration, 3,000 ms; TR = 5000 ms, TE = 14 ms, field of view = 200 × 200 mm2, voxel of 2.5 × 2.5 × 4 mm3, compressed sensing acceleration factor of 4, and flip angle 90 degrees. RF saturation was performed with 2 parallel RF transmission channels (through a body coil) driven by the RF amplifiers in a time‐interleaved fashion. By combining 2 amplifiers, each operating at 50% duty cycle, RF saturation at 100% duty cycle was achieved. The 64 offsets in order were 0, ± 0.25, ± 0.5, ± 0.75, ± 1, ± 1.25, ± 1.5, ± 1.75, ± 2, ±2.25, ± 2.5, ± 2.75, ± 3, ± 3.25, ± 3.5, ± 3.75, ± 4, ± 4.25, ± 4.5, ± 4.75, ± 5, ± 5.5, ± 6, ± 6.5, ± 7, ± 7.5, ± 10, ± 15, ± 20, ± 25, ± 30, ± 100 and +300 parts per million (ppm).The scan duration was 5 minutes and 25 seconds.
The tumor region-of-interest (ROI) was manually delineated by two dedicated radiologists (with 3 and 10 years of neuroradiology experience, respectively) on CEST images. Areas with necrosis, cysts, and hemorrhages were carefully excluded. The solid tumor was defined as either the contrast-enhanced region on T1-weighted images or the hyperintense region on T2-FLAIR images (when contrast enhancement was not detected) (25, 28, 29). Based on a previous study (30), we used custom MATLAB code (version 2023b, MathWorks, Natick, MA, USA) for quantitative image analysis of CEST. The Z-spectrum is generated using the ratio between the saturated image Ssat and the fully relaxed image S0. The spline-interpolated Z-spectrum was used to calculate frequency differences for generating B0 maps and performing voxel-wise B0 field correction. The B0-corrected Z-spectrum was then fitted as a sum of five Lorentzian functions corresponding to aliphatic nuclear Overhauser effect (NOE, -3.5 ppm), magnetization transfer (MT, -1 ppm), direct saturation of water (DS, 0 ppm), amine (2.0 ppm), and amide (3.5 ppm).
The spectrally selective CEST effects were obtained through Lorentzian line fitting for four steps: (1) motion correction using a subpixel image registration algorithms and denoising raw images using multilinear singular value decomposition; (2) 2-pool Lorentzian fitting (MT and DS) for B0 determination and B0 correction (3) 2-pool Lorentzian fitting (MT and DS) on B0 corrected data, generation of MTRLD; (4) 3-pool Lorentzian model fitting of MTRLD for isolated CEST contrast.
The first step involved utilizing a 2-pool model to characterize background signals such as direct water saturation (DS) and semisolid magnetization transfer (MT). Only those irradiation frequency offsets, assumed to be influenced exclusively by the background signal, were employed for the fit (MT: ± 10, ± 15, ± 20, ± 25, ± 30, ± 100; water: ± 1, ± 0.75, ± 0.5, ± 0.25, 0 ppm). Any other irradiation frequency offsets were disregarded. The 2-pool fit model used is expressed by the DS(w) and MT.
with a constant c and the adjusted Lorentzian Lw of the water line. Lw includes a plateau to account for the pulse bandwidth at 3T defined by Equation 2.
where A represents the Lorentzian amplitude of the five pools, Γ represents the Lorentzian width (full-width-at-half-maximum) of the five pools, and δ represents the peak position. Here, Θ[•] refers to the Heaviside function, with and . The parameter BW is an estimate of the Fourier width of the Gaussian saturation pulse, which is related to platform width and remains constant for . The second pool in which the Lorentzian function is defined in Equation 3 represents MT:
The Lorentzian ssMT pool was fitted with an initial resonance frequency of -1 ppm, which was adjustable within the range from 0 to -2.5 ppm during data fitting (30) In the second step, the water pool’s off-resonance in the preliminary 2-pool model served as a surrogate B0 map. Z-spectra underwent shifts to compensate B0 inhomogeneity.
In accordance with prior research, the Lorentzian difference method was employed for the evaluation of peak-selective CEST.
In step 3, the referred to a 2-pool background fit, which was repeated on B0-corrected and denoised Z-spectra.
Ultimately, in the step 4, a 3-pool Lorentzian model was implemented to fit the MTRLD spectrum to distinctly separate the amide (+3.5 ppm), amine (+2.0 ppm), and NOE (-3.5 ppm) resonances.
and (Equation 6)
Quantitative maps were derived from the fitting parameter Ax for the five CEST pools.
The conventional magnetization transfer ratio (MTR) asymmetry analysis was used to calculate the MTR3.5, defined as
We use CEST to characterize the acidity of the tumor region according to (17).
At last, the histogram values for various parameters such as amide, NOE, amine, MT, DS, MTR3.5, and pH_weighted (13, 17) in tumor were calculated.
Data were analyzed using SPSS 25.0, GraphPad Prism version 8.0, and MedCalc 20.0. The inter-observer variability of measurements in glioma patients was assessed using the intra-class correlation coefficient. Continuous variables with normal distribution were expressed as the mean ± SD, while non-normally distributed variables were expressed as the median with IQR. Categorical variables were expressed as frequencies. Metrics with significant differences were identified using an independent sample t-test (for normally distributed data) or Mann–Whitney U test (for non-normally distributed data). The Chi-squared test was used for categorical variables. Among the histogram features of amide, NOE, amine, MT, DS, pH_weighted, and MTR3.5, those with statistical significance (p < 0.05) were first selected. Features demonstrating the highest diagnostic performance were further selected. Collinearity analysis was performed on these features, and those with a tolerance (Tol) less than 0.1 or a variance inflation factor (VIF) greater than 10 were excluded. The remaining features were retained for constructing the combined model. Individual features or combined models were used for glioma grading and molecular typing (IDH mutation, 1p/19q codeletion, and MGMT promoter methylation status). The significance level was set at p = 0.05 for all tests.
The demographic and pathological findings of the participants are summarized in Table 1. A total of 128 patients with histologically confirmed gliomas were included. There were 24 grade II, 16 grade III, and 88 grade IV gliomas, among which 82 were IDH-wt and 46 were IDH-mut. Significant differences were found in age across different grades (p = 0.018) and IDH subtypes (p = 0.014). Among grade II and III gliomas, there were 18 and 22 with 1p/19q codeletion, respectively, and the remaining without codeletion. No significant differences in age were observed between these groups (p = 0.667, 0.683, respectively). There were 17 gliomas with MGMT promoter methylation and 16 without. Patients with MGMT promoter methylation were significantly older than those without (p = 0.043). No significant differences were found in gender across all subgroups (p = 0.785, 0.963, 0.214, 0.315, 0.728, respectively). We performed an inter-observer consistency analysis for all gliomas, low-grade gliomas, and high-grade gliomas separately, and the results showed good consistency in both groups. The intraclass correlation coefficients for inter-observer agreement for CEST metric values ranged from 0.90 to 0.99(Supplementary Tables S1–S3).
As shown in Table 2 and Figure 2, grade III gliomas exhibited higher DS (median: 0.80 vs 0.78, p = 0.020) and pH_weighted (median: -0.01 vs -0.02, p = 0.008) signals, and lower MT (mean: 0.14 vs 0.15, p = 0.029) (Supplementary Figure S1A) compared to grade II gliomas. Specifically, the 90th percentile of MT [p = 0.003, AUC = 0.78 (95% CI: 0.62- 0.90)], the mean of DS [p = 0.020, AUC = 0.72 (95% CI: 0.55-0.85)], and the mean of pH_weighted [p = 0.006, AUC = 0.76 (95% CI: 0.59-0.88)] showed the best performance for each signal, respectively (Figure 3A, Table 3). The combined model achieved an AUC of 0.80 (95% CI: 0.64-0.91) (Supplementary Table S4).
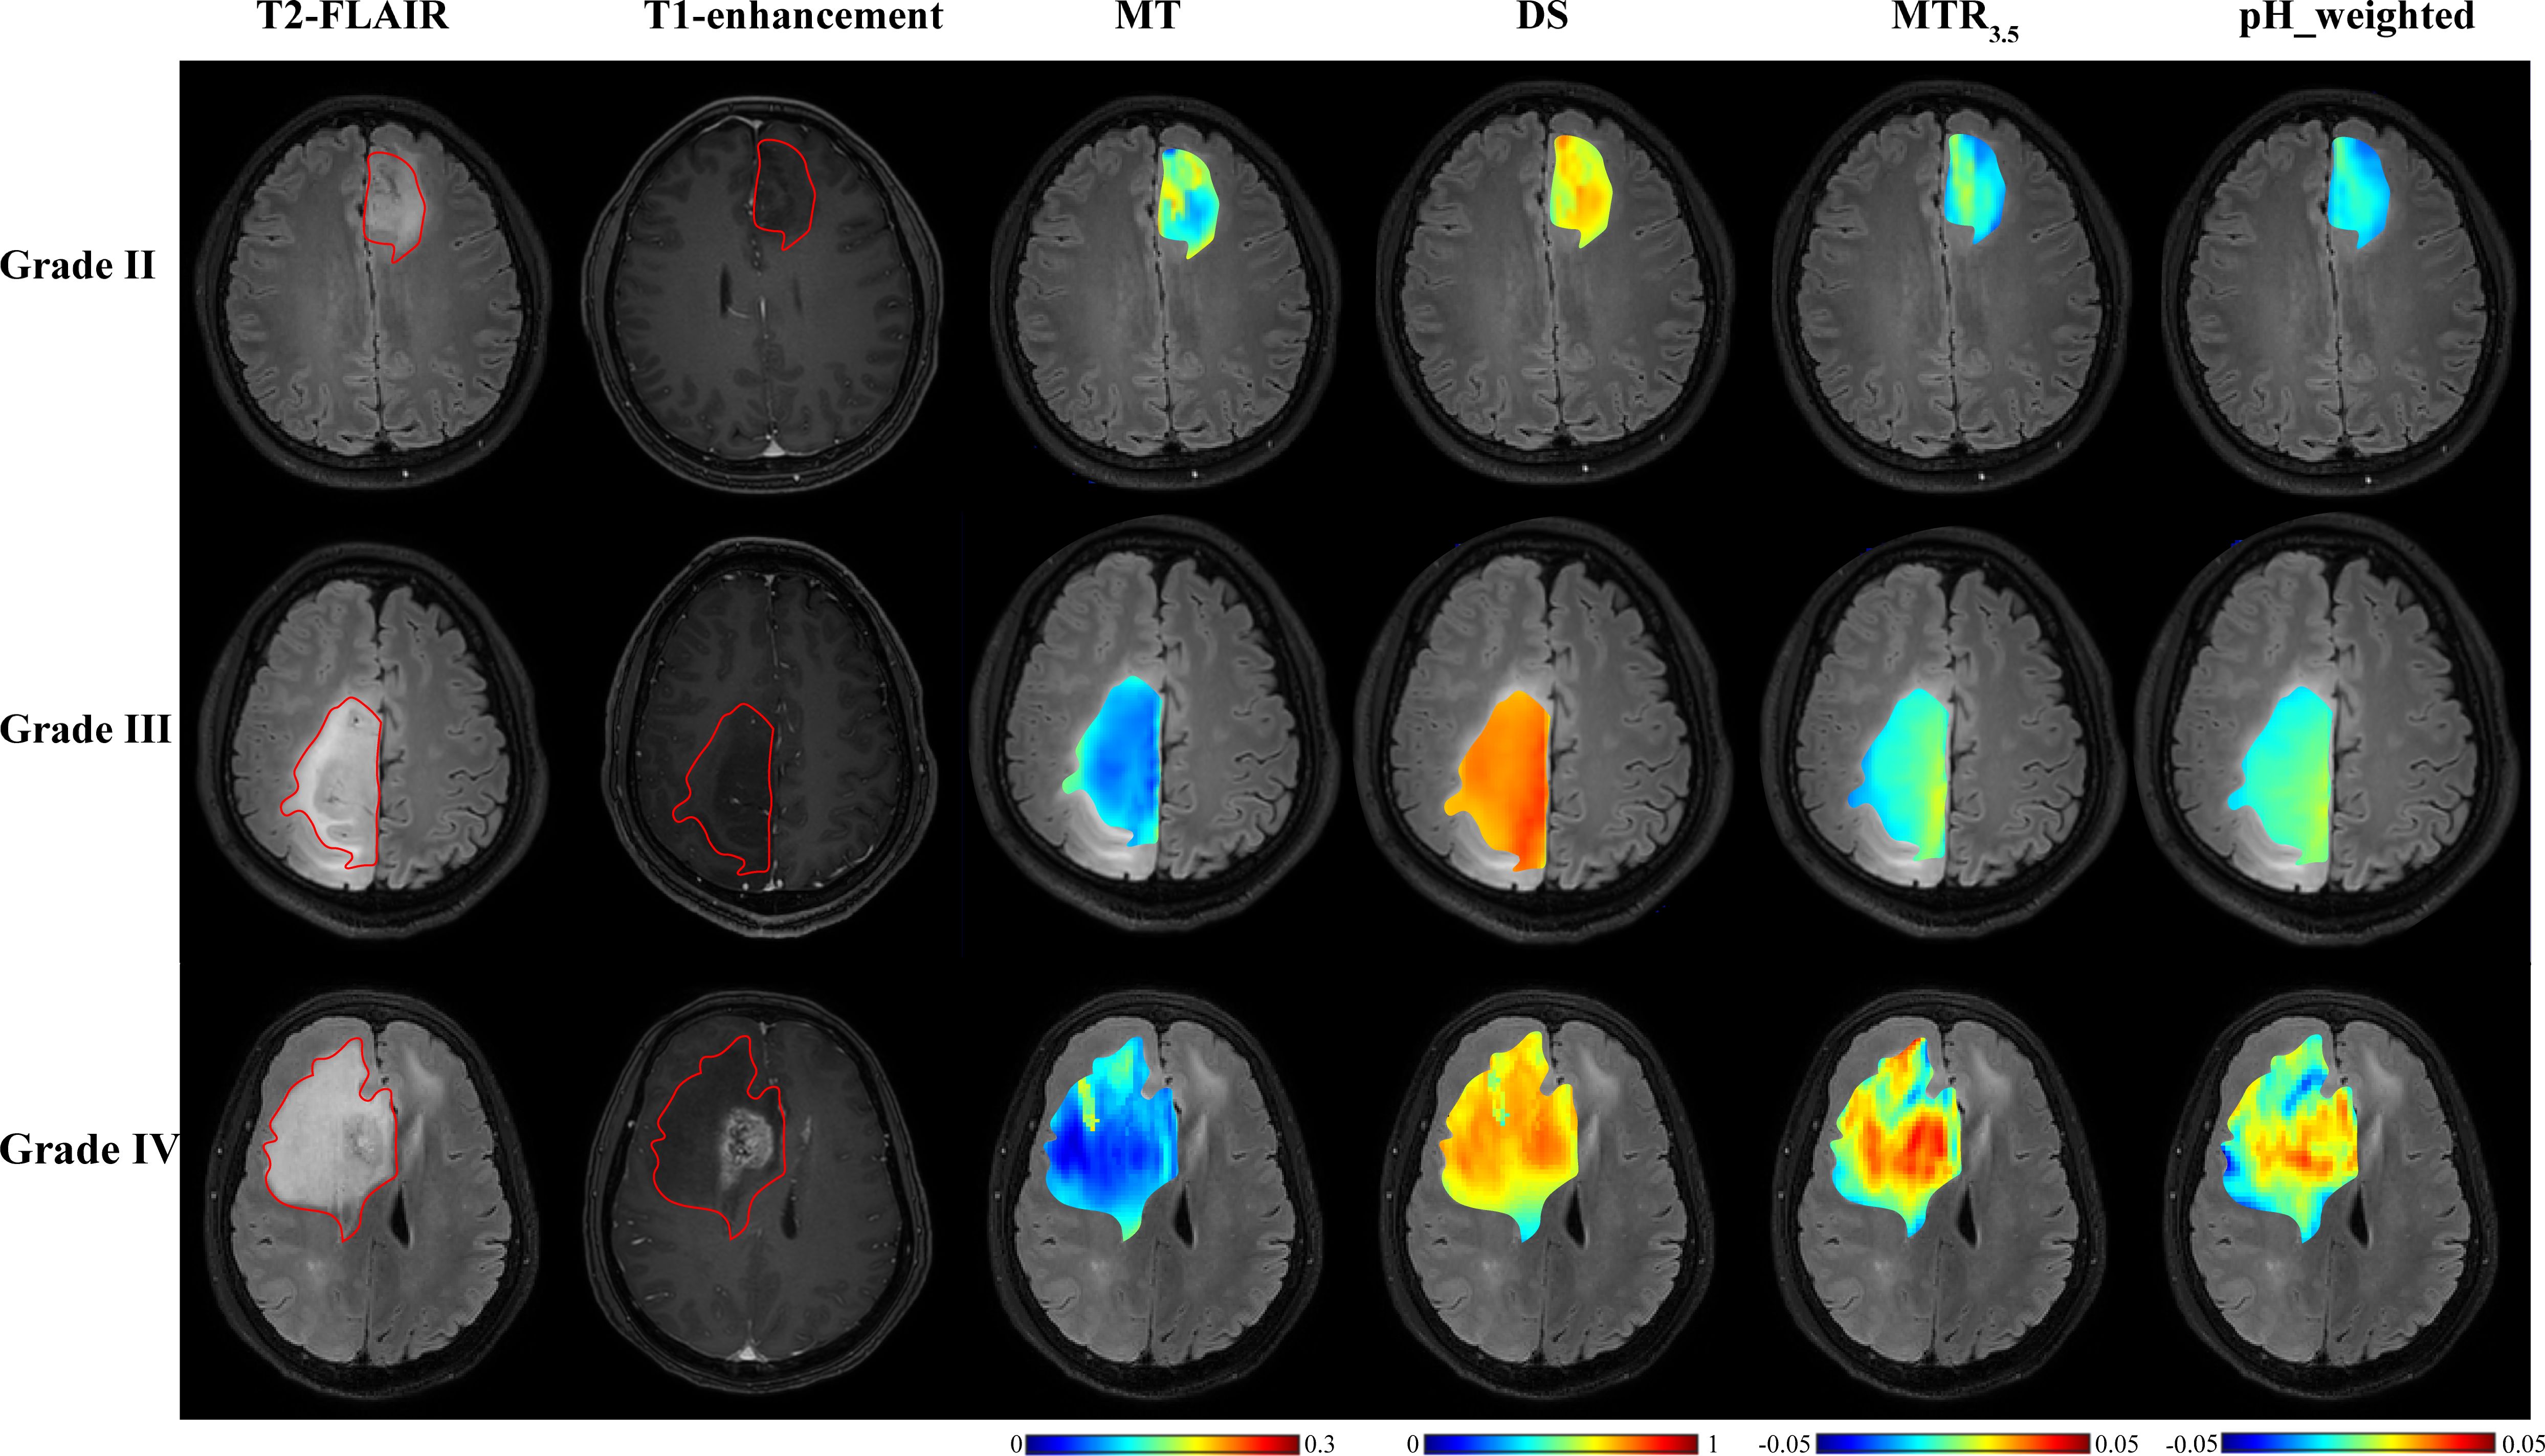
Figure 2. T2-FLAIR, T1-enhancement images and effective CEST derived metric maps of MT, DS, MTR3.5 and pH_weighted for differentiating between one grade II glioma patient (44 years old male), one grade III glioma patient (33 years old male) and one grade IV glioma patient (61 years old male). As glioma grade increases, tumors exhibit higher DS and MTR3.5 signals, lower MT signals, and increased acidity within the tumor region.
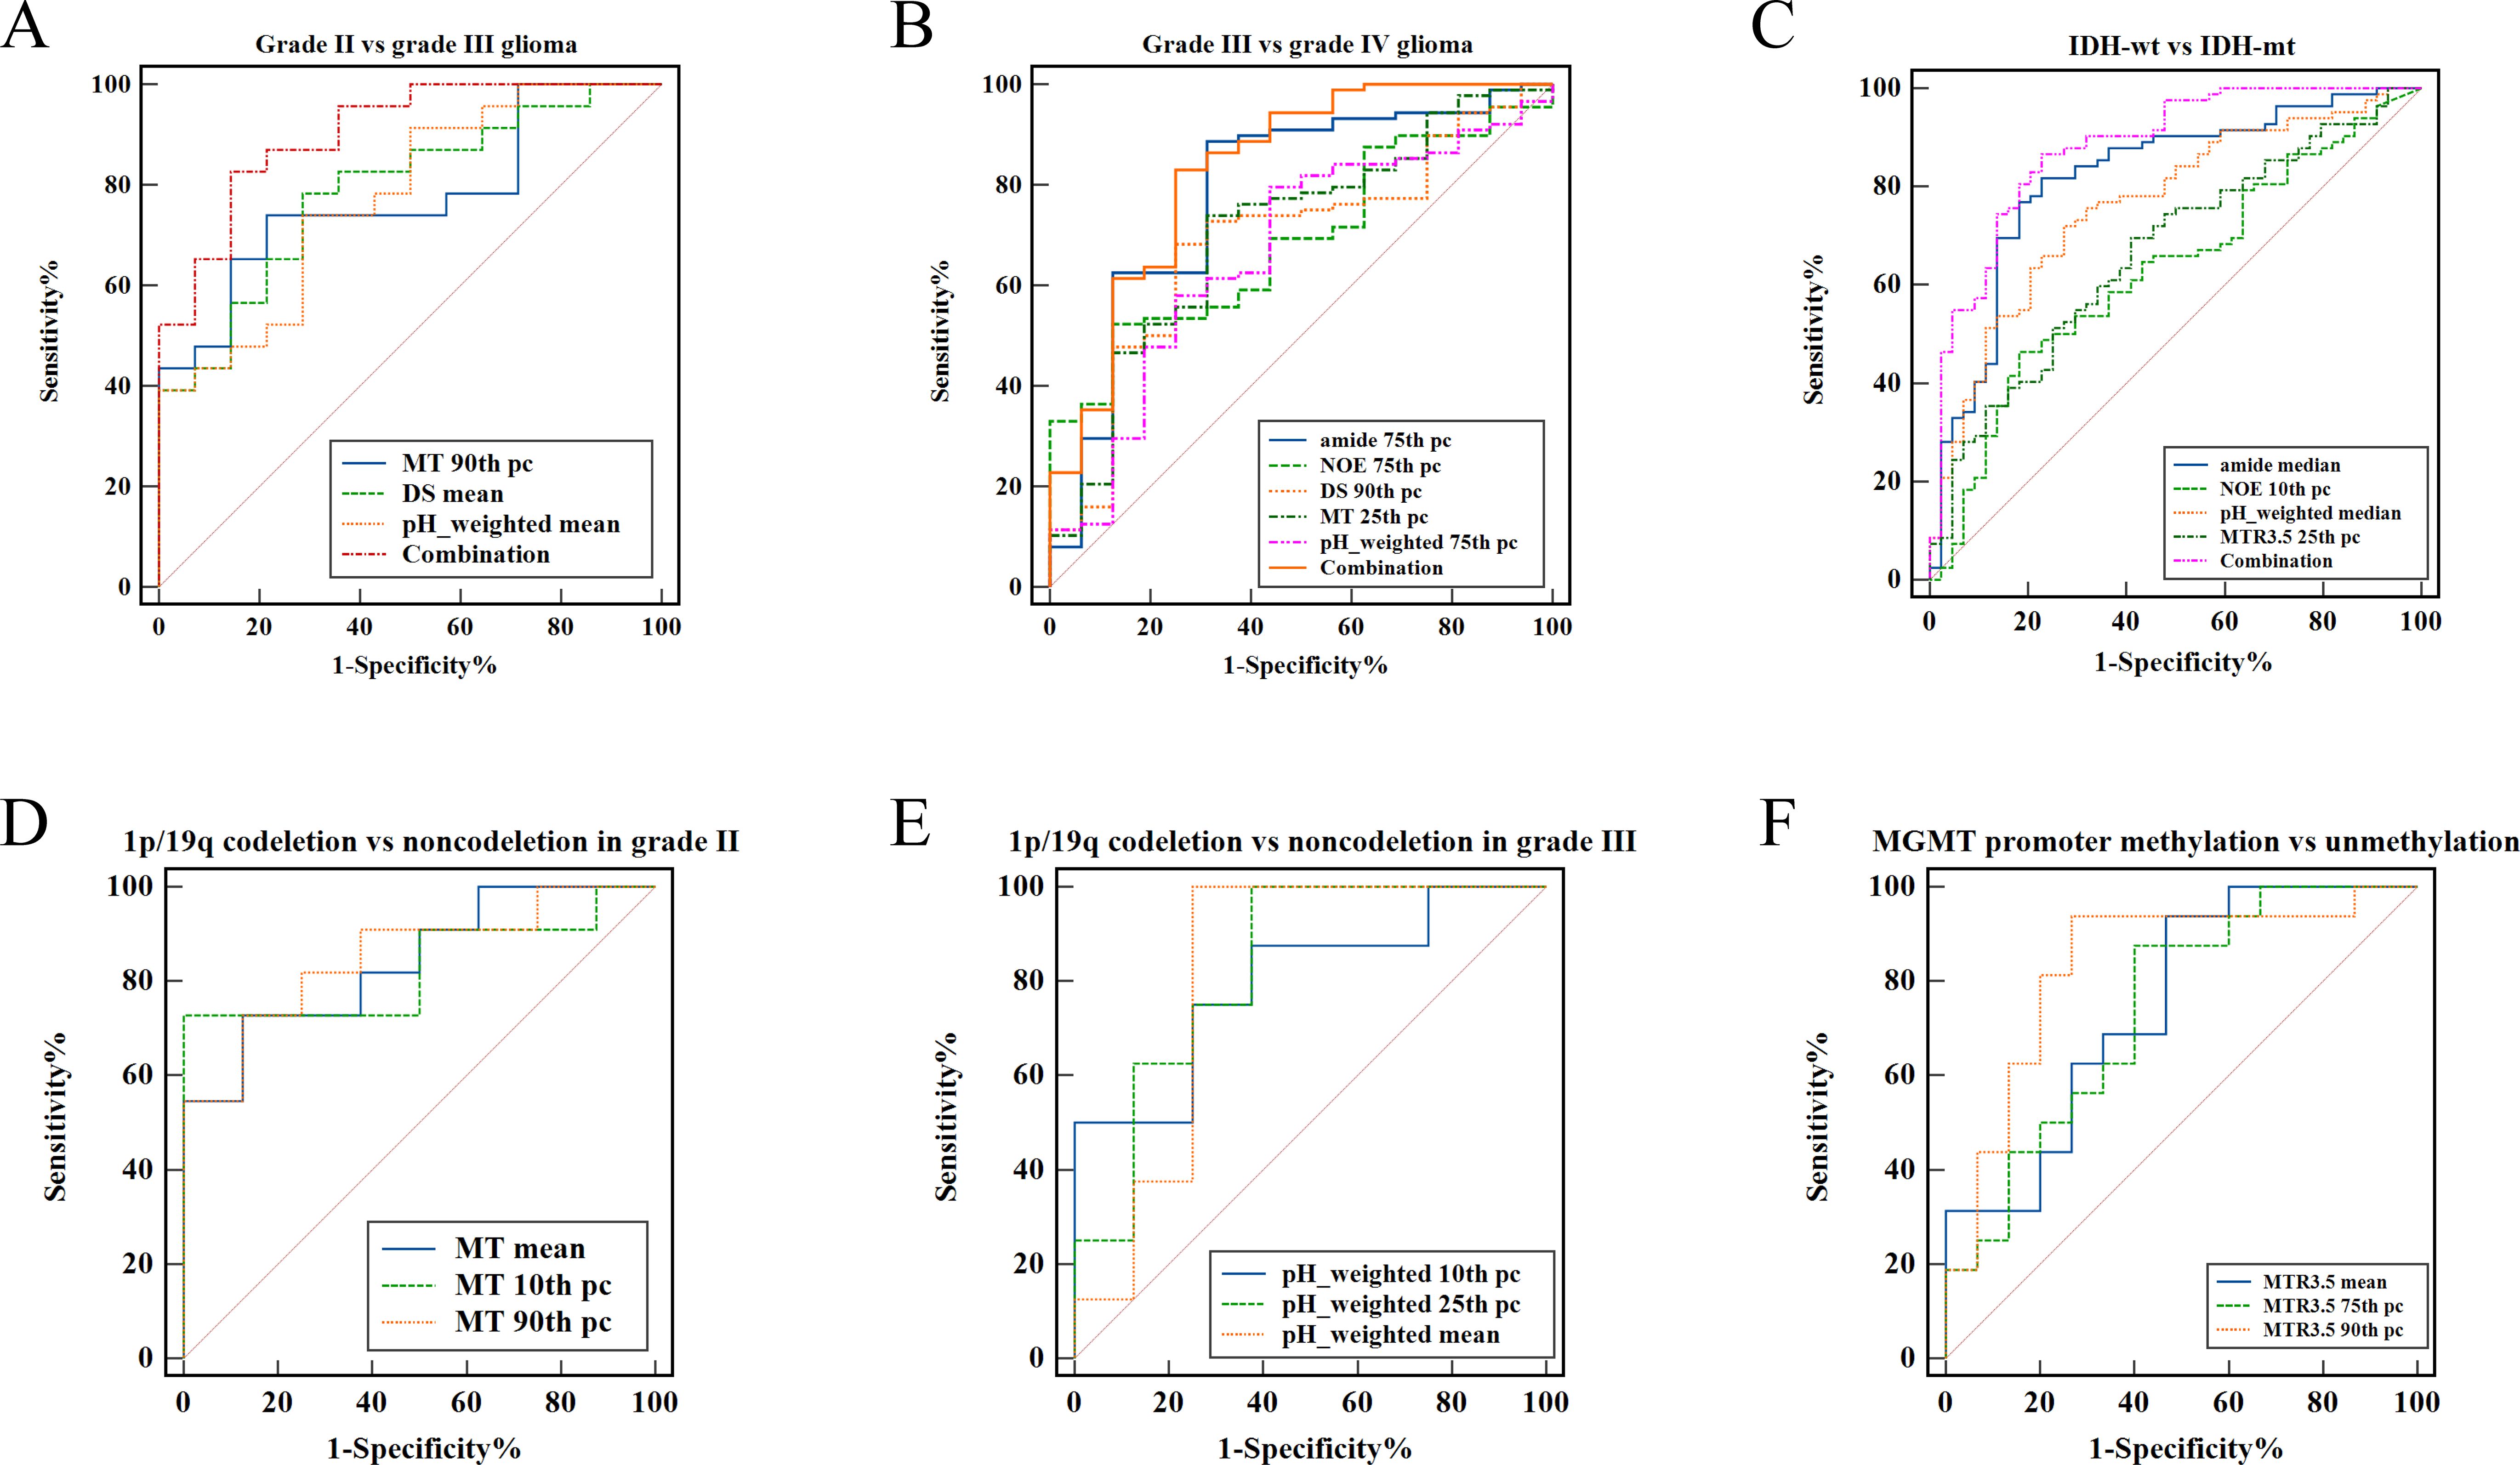
Figure 3. ROC curve analysis of fitted CEST metric histogram features in differentiating glioma subtype. (A) Differentiating grade II from grade III. (B) Differentiating grade III from grade IV. (C) Differentiating IDH-wt from IDH-mut. (D) Differentiating 1p/19q codeletion from 1p/19q non-codeletion in grade II glioma. (E) Differentiating 1p/19q codeletion from 1p/19q non-codeletion in grade III glioma. (F) Differentiating MGMT promoter methylation from unmethylation.
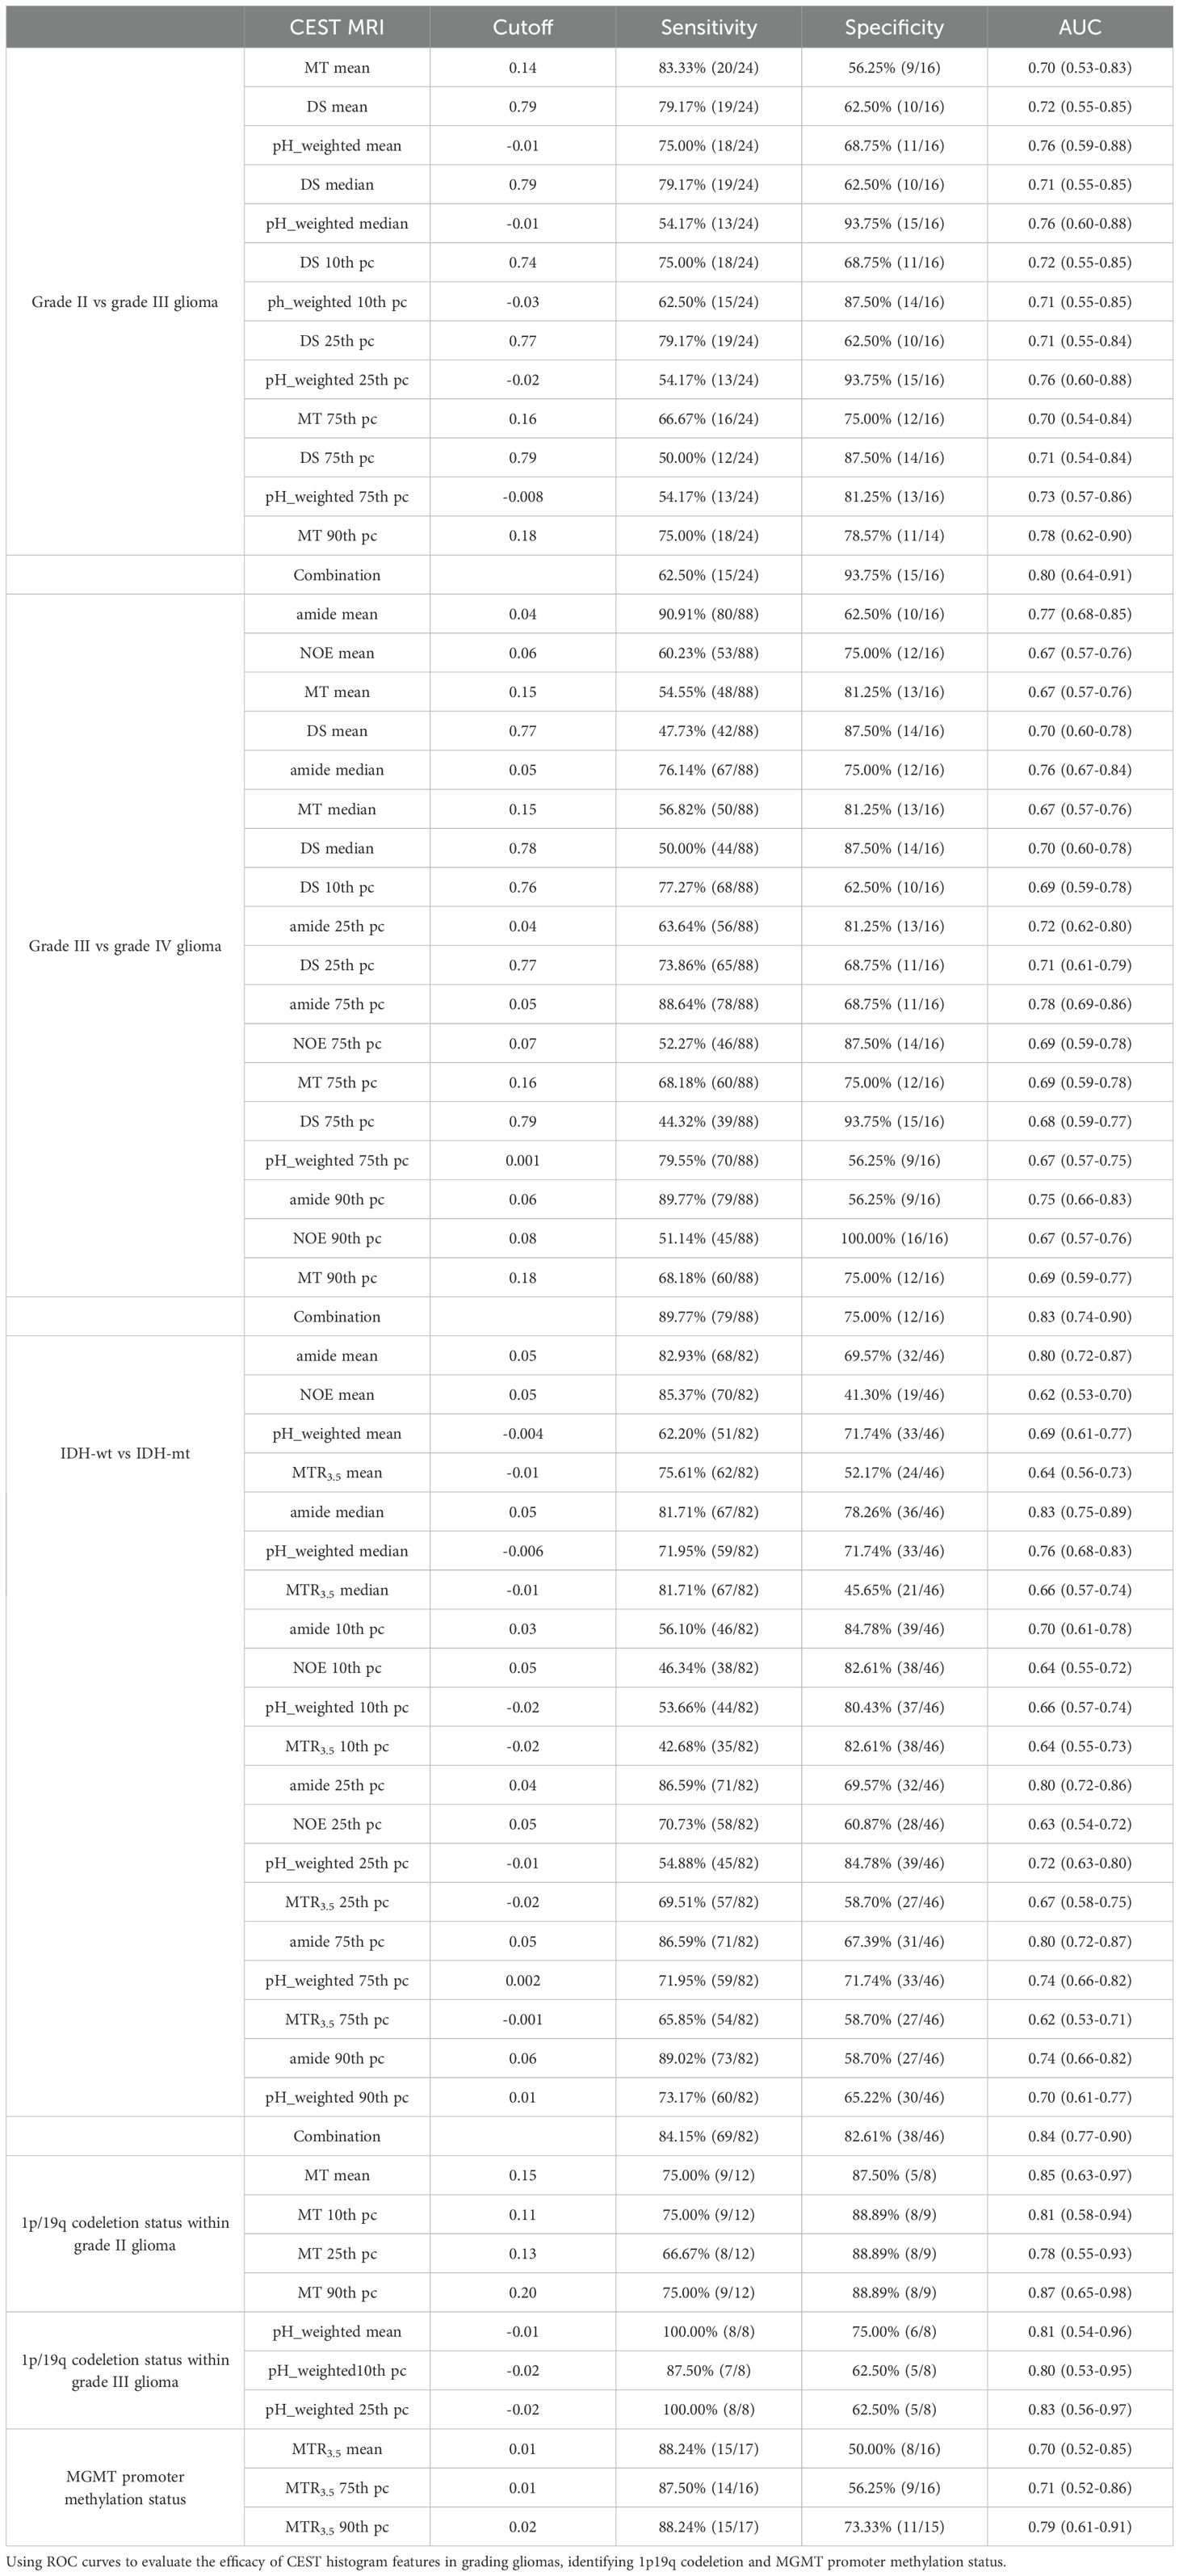
Table 3. The diagnostic performance of signals in evaluating tumor grades, 1p/19q codeletion status and MGMT promoter methylation status.
As shown in Table 2 and Figure 2, grade IV gliomas exhibited higher amide (mean: 0.06 vs 0.04, p = 0.001) (Supplementary Figure S1B), NOE (mean: 0.06 vs 0.05, p = 0.034), MT (mean: 0.16 vs 0.14, p = 0.031), pH_weighted (75th pc: 0.008 vs -0.003, p = 0.037), and lower DS (mean: 0.78 vs 0.80, p = 0.013) compared to grade III gliomas. Specifically, the 75th percentile of amide [p < 0.001, AUC = 0.78 (95% CI: 0.69-0.86)], the 75th percentile of NOE [p = 0.017, AUC = 0.69 (95% CI: 0.59-0.78)], the 90th percentile of MT [p = 0.018, AUC = 0.69 (95% CI: 0.59-0.78)], the 25th percentile of DS [p = 0.009, AUC = 0.71 (95% CI: 0.61-0.79)], and the 75th percentile of pH_weighted [p = 0.037, AUC = 0.67 (95% CI: 0.57-0.75)] showed the best performance for each signal, respectively (Figure 3B, Table 3). The combined model achieved an AUC of 0.83 (95% CI: 0.74-0.90) (Supplementary Table S4).
As shown in Table 4, Figure 4, IDH-wt gliomas exhibited higher amide (mean: 0.06 vs 0.04, p < 0.001) (Supplementary Figure S1E), NOE (mean: 0.06 vs 0.07, p = 0.031), pH_weighted (mean: -0.002 vs -0.009, p < 0.001), and MTR3.5 (mean: 0.003 vs -0.010, p = 0.009) compared to IDH-mut gliomas. Specifically, the median of amide [p < 0.001, AUC = 0.83 (95% CI: 0.75-0.89)], the 10th percentile of NOE [p = 0.013, AUC = 0.64 (95% CI: 0.55-0.72)], the median of pH_weighted [p < 0.001, AUC = 0.76 (95% CI: 0.68-0.83)] and the 25th percentile of MTR3.5 [p = 0.002, AUC = 0.67 (95% CI: 0.58-0.75)] performed the best for each type of signal, respectively (Figure 3C, Table 3). The combined model achieved an AUC of 0.84 (95% CI: 0.77-0.90) (Supplementary Table S4).
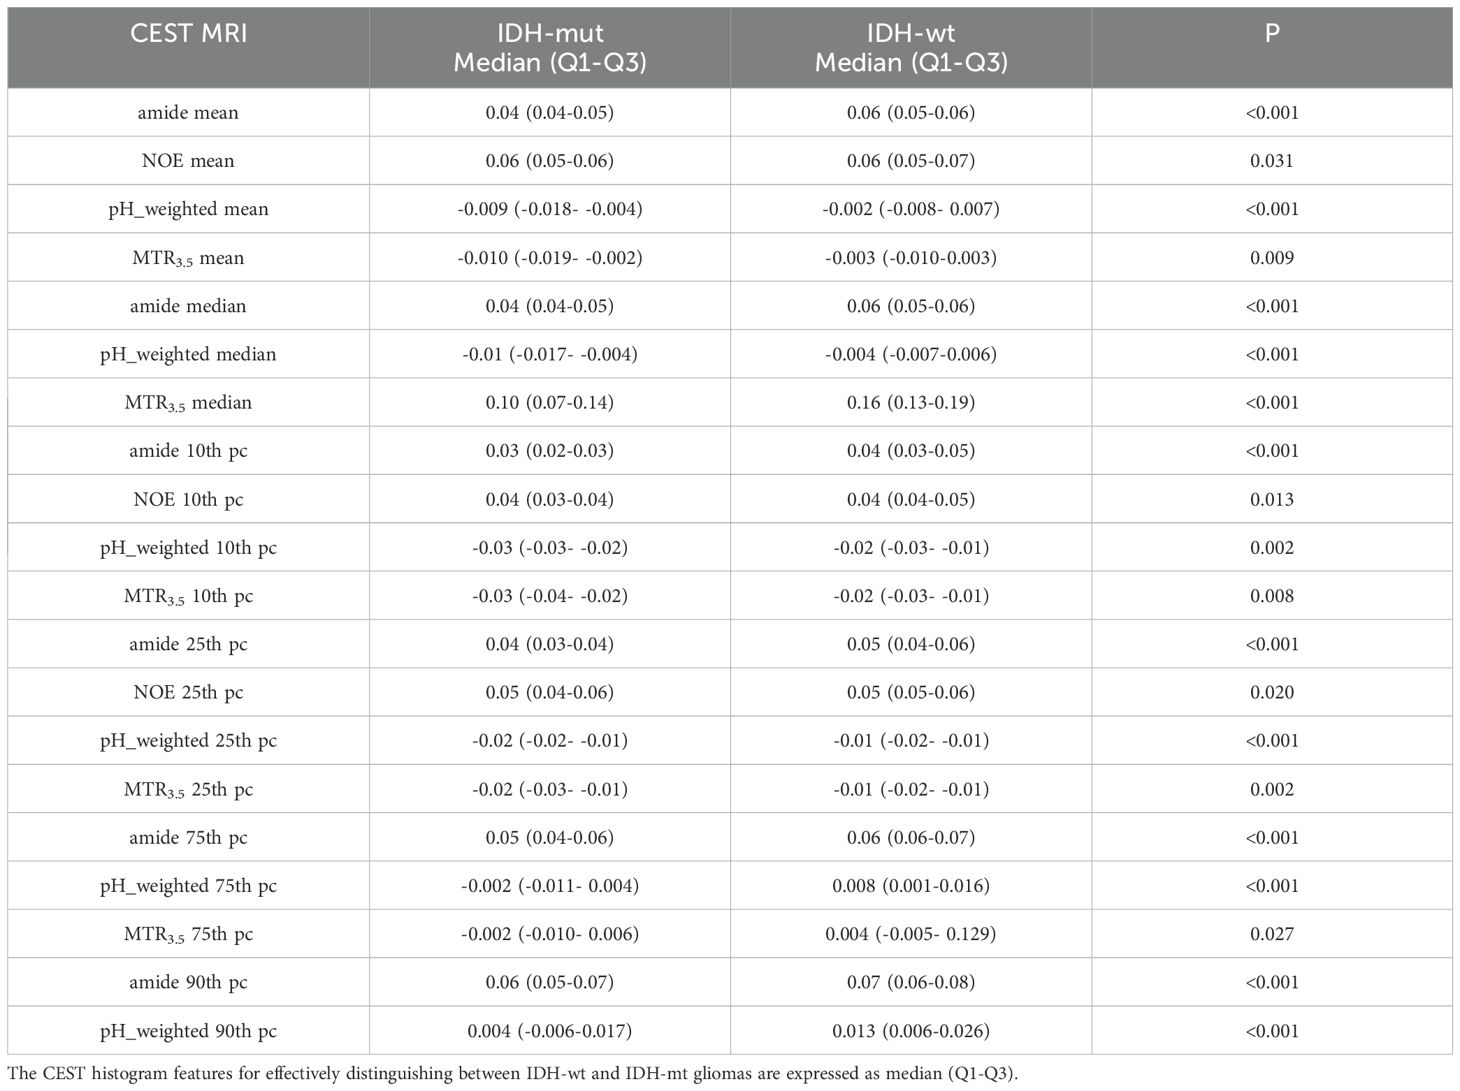
Table 4. Results of histogram analyses of CEST for distinguishing between IDH-wt and IDH-mut gliomas.
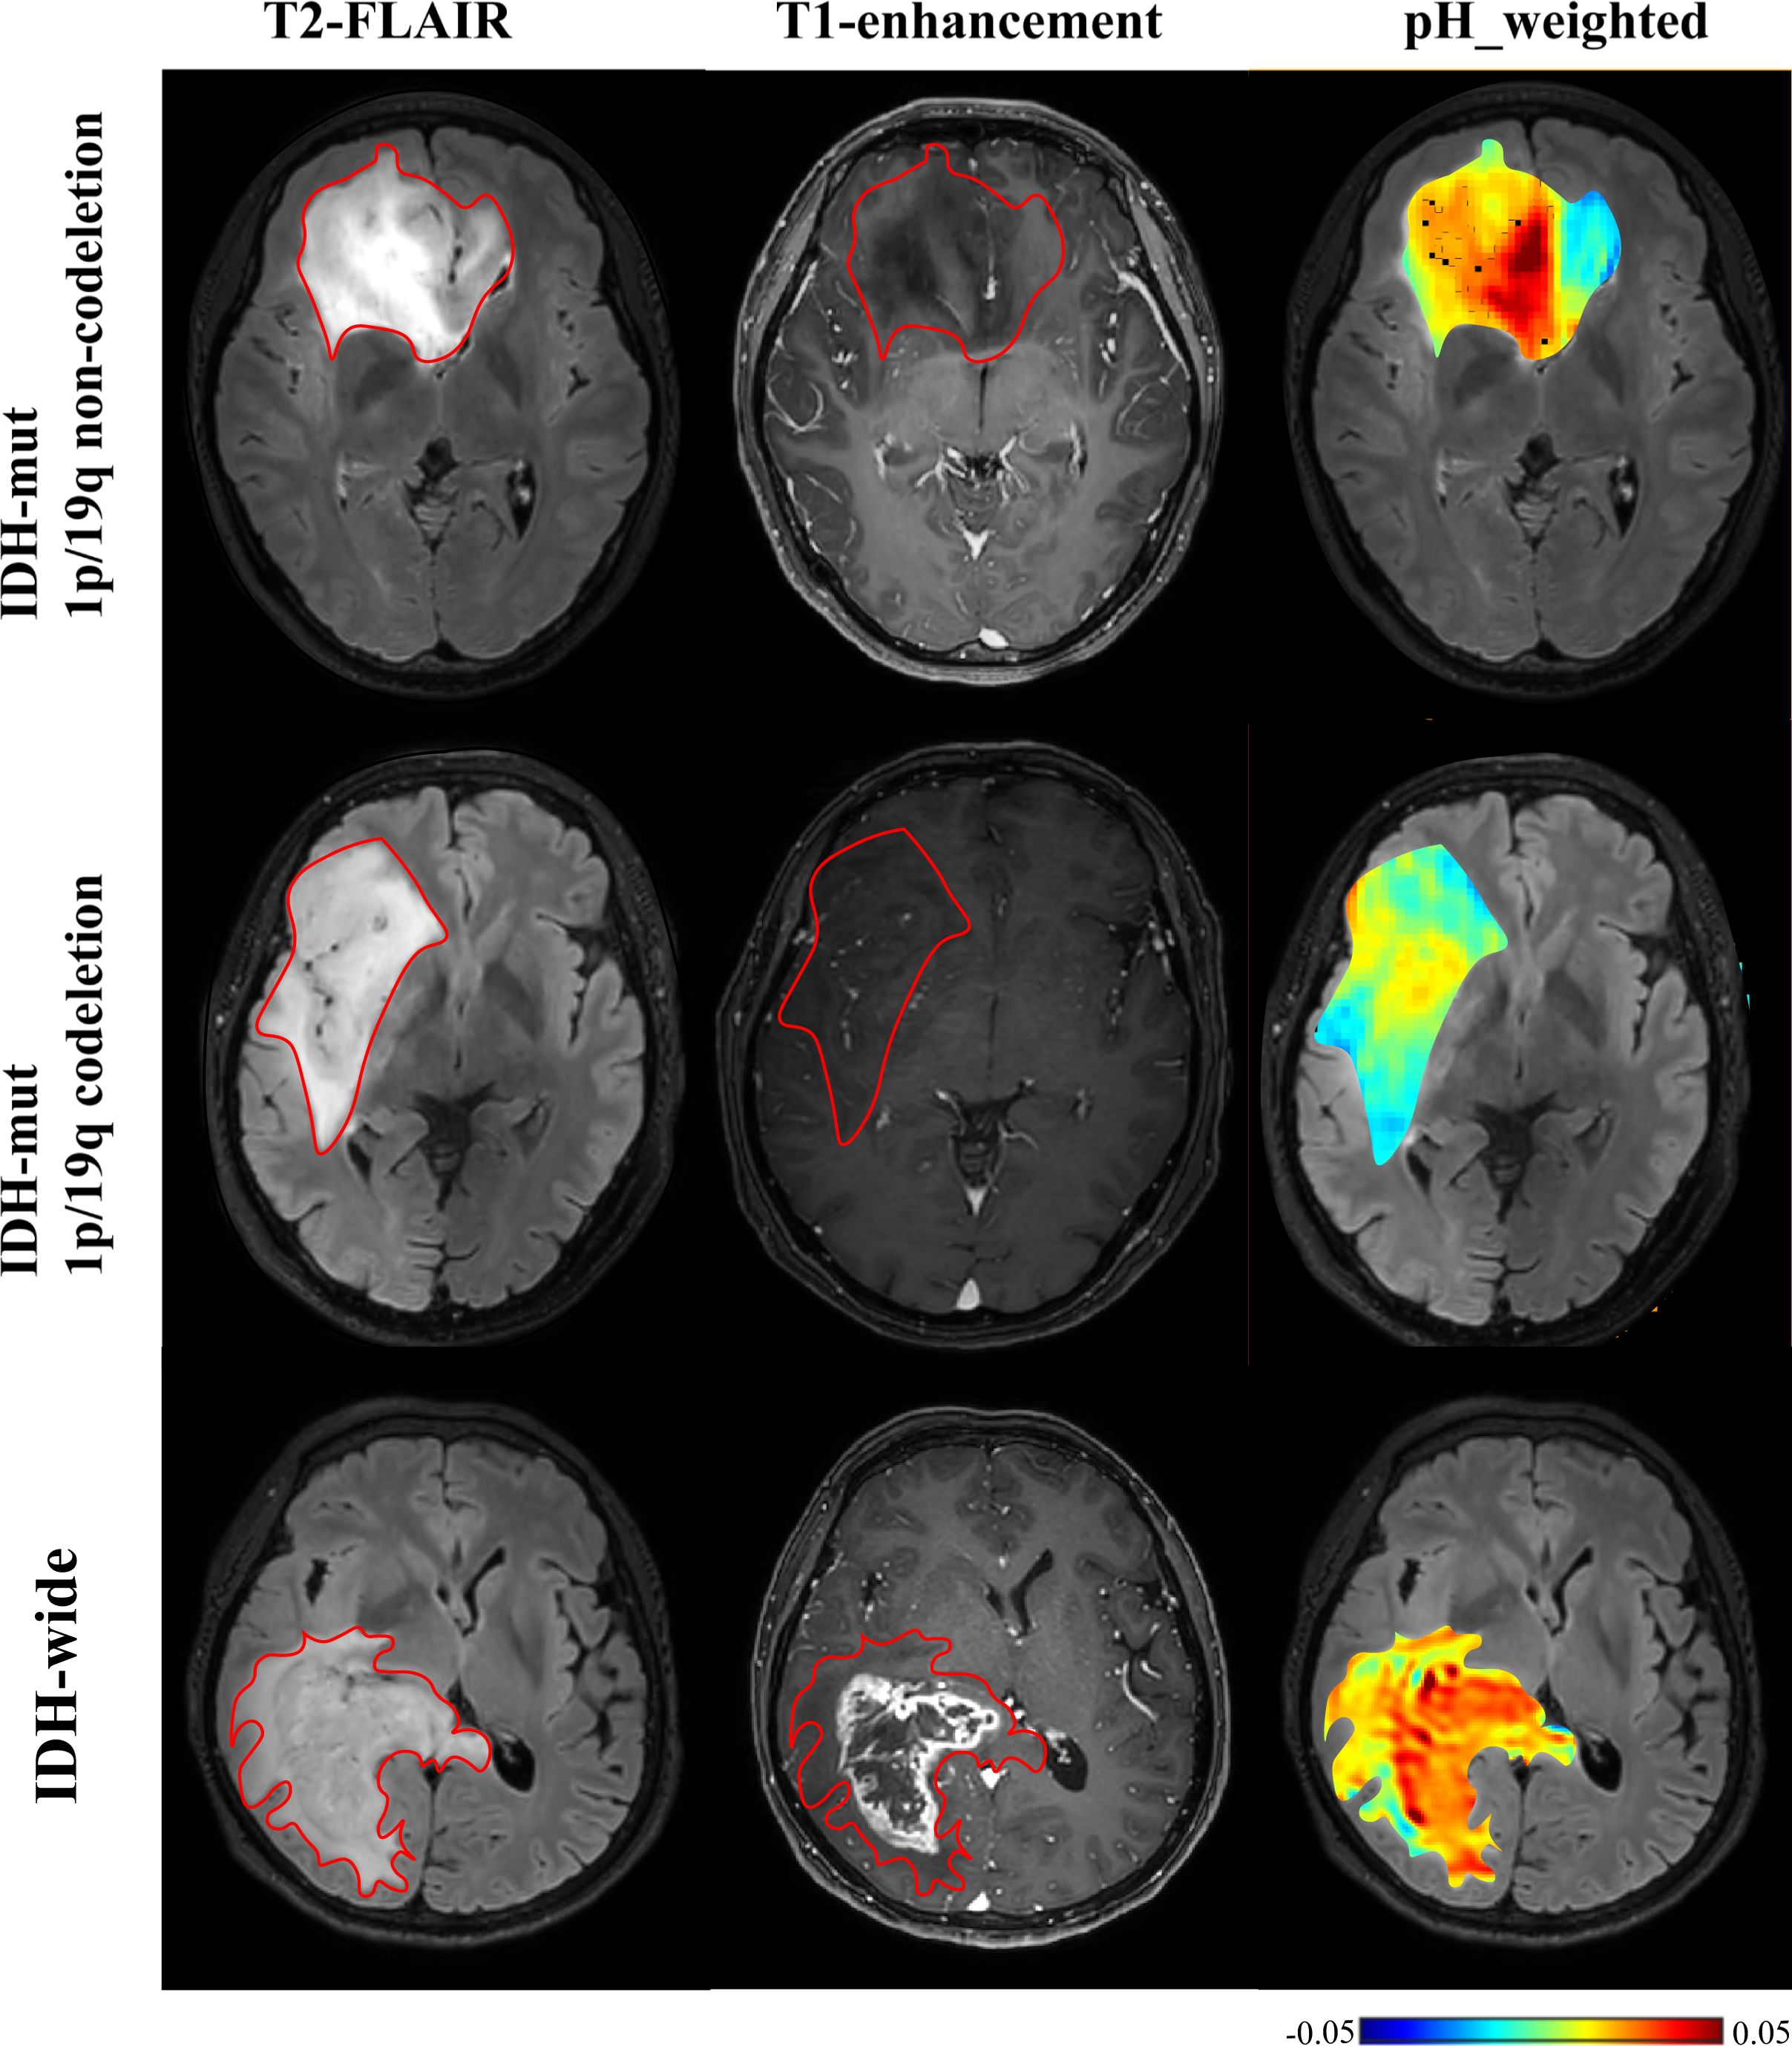
Figure 4. T2-FLAIR, T1-enhancement images and effective CEST derived metric maps of pH_weighted for differentiating between one IDH-mt with 1p/19q noncodeletion glioma patient (29 years old female, WHO III), one IDH- mt with 1p/19q noncodeletion glioma patient (60 years old female, WHO III) and one IDH wide glioma patient(66 years old female, WHO IV). IDH-wt manifested higher tumor acidity compared to IDH-mut. The glioma with 1p/19q codeletion appears to show lower acidity compared to the glioma with no 1p/19q codeletion.
As shown in Table 5 and Figures 4, 5, for grade II gliomas, 1p/19q non-codeletion gliomas exhibited higher MT compared to 1p/19q codeletion gliomas (mean: 0.17 vs 0.14, p = 0.007) (Supplementary Figure S1C). The 90th percentile of MT achieved the best performance [p = 0.003, AUC = 0.87 (95% CI: 0.65-0.98)] (Figure 3D, Table 3). For grade III gliomas, 1p/19q non-codeletion gliomas exhibited higher pH_weighted signals compared to 1p/19q codeletion gliomas (mean: -0.004 vs -0.013, p = 0.038) (Supplementary Figure S1D). The 25th percentile of pH_weighted achieved the best performance [p = 0.028, AUC = 0.83 (95% CI: 0.56-0.97)] (Figure 3E, Table 3).
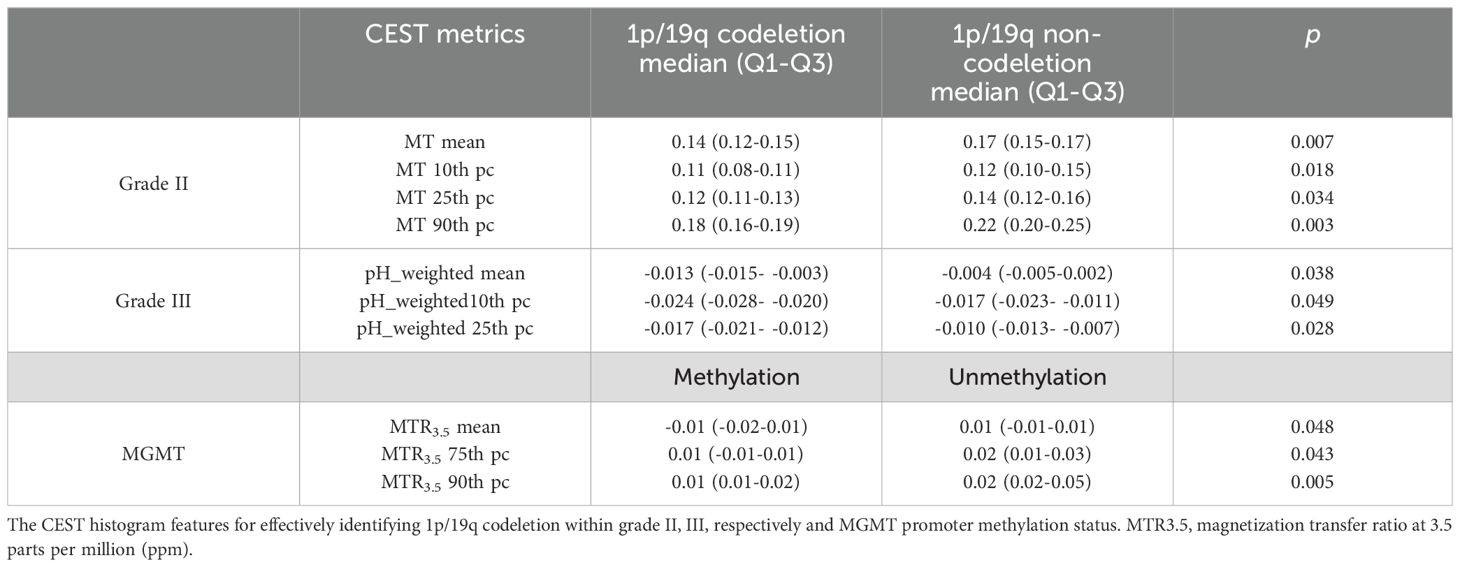
Table 5. Results of histogram analyses of CEST for identifying 1p/19q codeletion and MGMT promoter methylation.
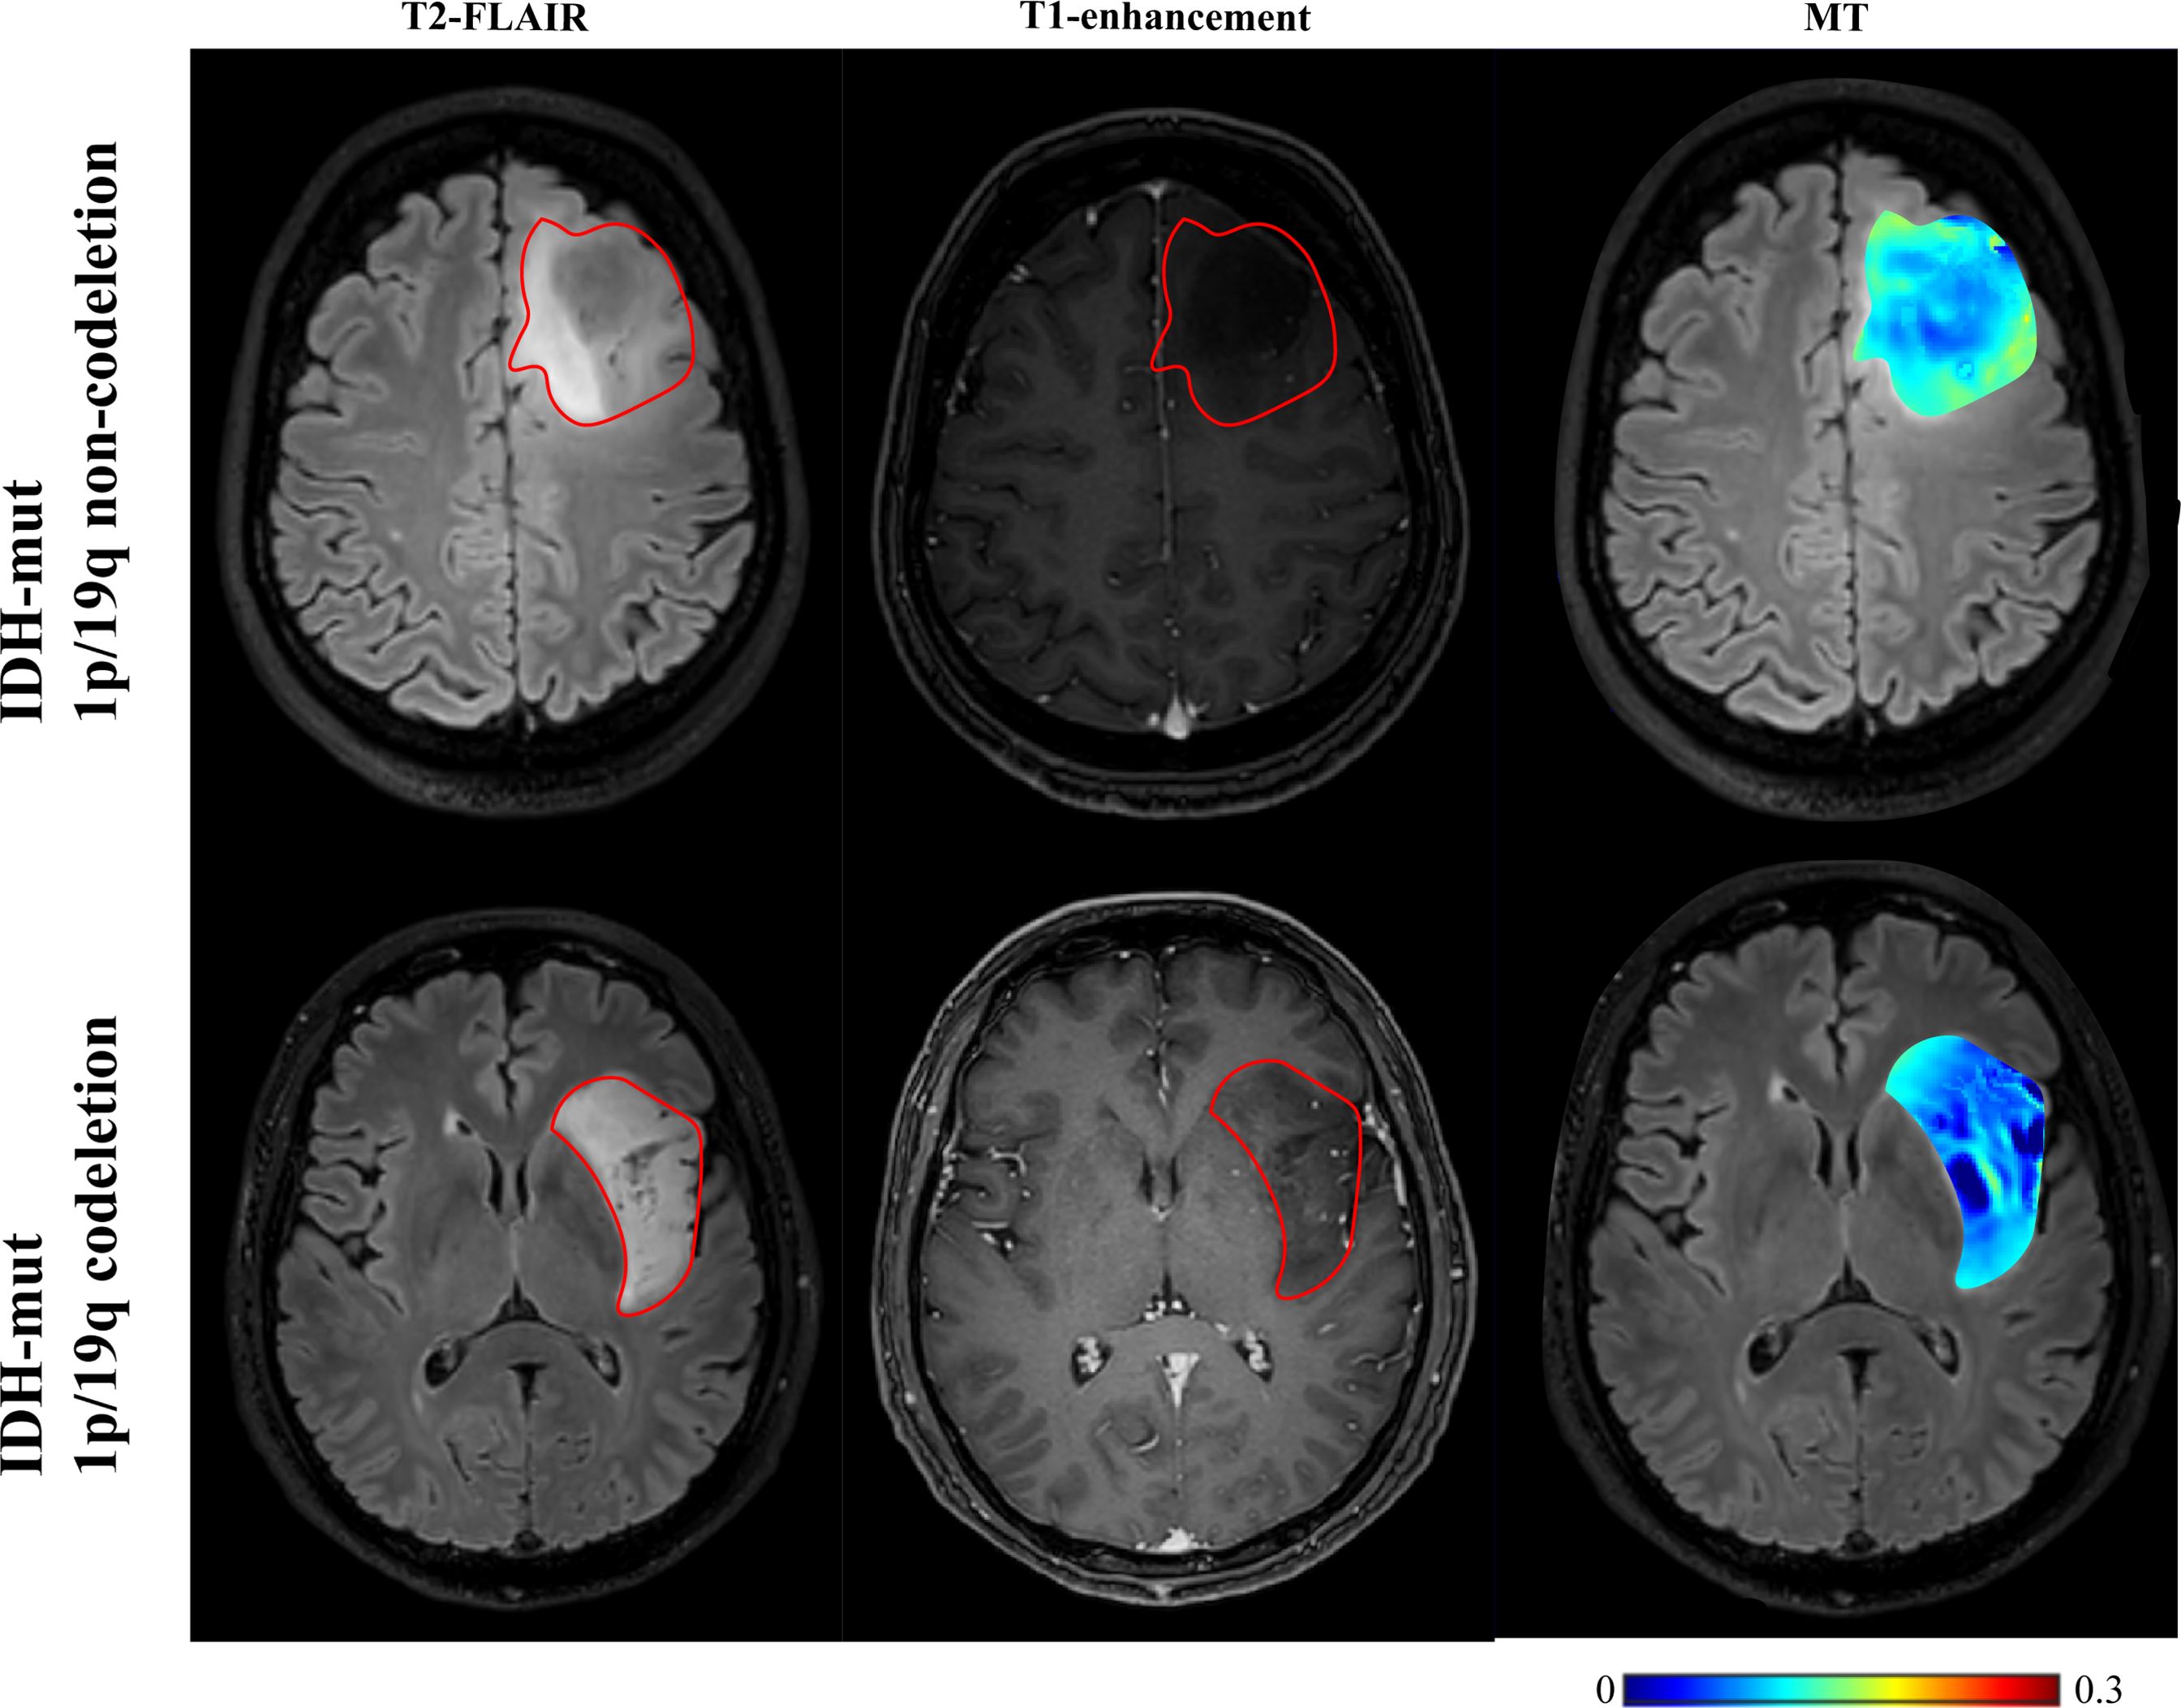
Figure 5. T2-FLAIR, T1-enhancement images and effective CEST derived metric maps of MT for differentiating between one IDH-mt with 1p/19q noncodeletion glioma (45 years old female, WHO II), one IDH-mt with 1p/19q codeletion glioma patient (57 years old male, WHO II). The glioma with 1p/19q codeletion appears to show lower MT compared to the glioma with no 1p/19q codeletion.
As shown in Table 5 and Figure 6, MGMT promoter unmethylated gliomas exhibited higher MTR3.5 signals compared to MGMT promoter methylated gliomas (mean: 0.01 vs -0.01, p = 0.048) (Supplementary Figure S1F). The 90th percentile of MTR3.5 achieved the best performance [p = 0.005, AUC = 0.79 (95% CI: 0.61-0.91)] (Figure 3F, Table 3).
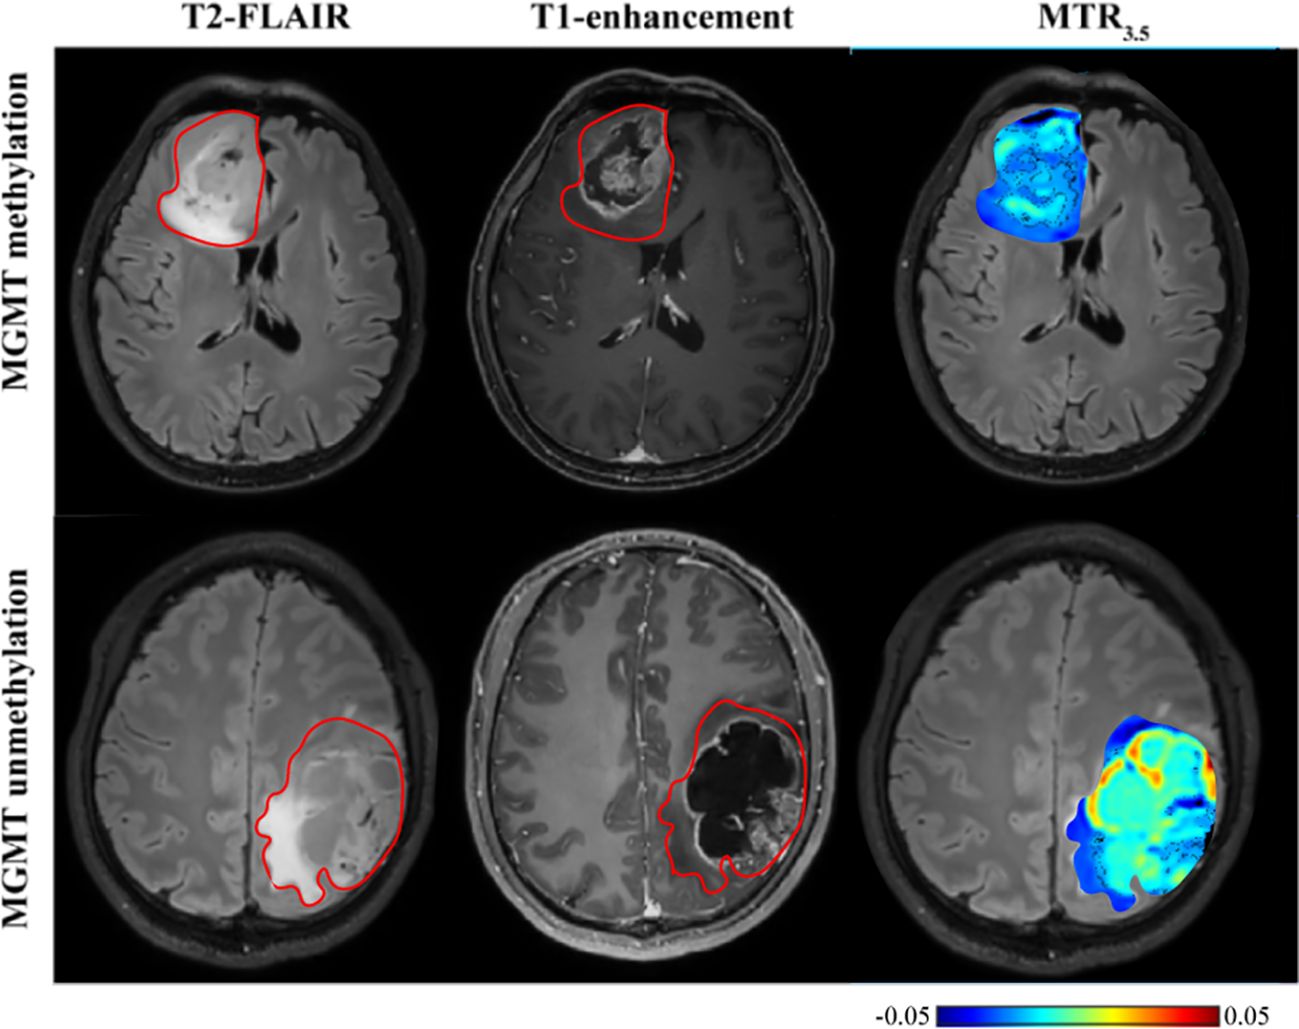
Figure 6. T2-FLAIR, T1-enhancement images and effective CEST derived metric map of MTR3.5 for differentiating between one MGMT promoter methylation glioma (53 years old female, WHO IV) and one MGMT promoter unmethylation glioma patient (30 years old male, WHO IV). MGMT promoter methylation glioma manifested higher MTR3.5 compared to unmethylation glioma.
This study investigated glioma grading and molecular genotyping using CEST-based pH assessment and micro- metabolic profiling within the context of the 2021 WHO CNS classification. Our results indicate that multi-pool Lorentzian analysis and pH-weighted analysis demonstrate diagnostic performance in grading gliomas and ingenotyping for IDH mutation status, 1p/19q co-deletion, and MGMT promoter methylation status.pH_weighted imaging can characterize the acidic microenvironment of tumors. We found that high-grade gliomas, IDH-wt gliomas, and 1p/19q non-codeleted gliomas exhibited higher pH_weighted values compared to low-grade gliomas, IDH-mt gliomas, and 1p/19q codeleted gliomas. Tumor cells preferentially convert glucose to lactic acid even in the presence of oxygen, resulting in excessive lactic acid production. Additionally, poor vascularization in these tumors leads to hypoxic conditions that further drive glycolysis and acid production (15). The higher metabolic activity in more invasive gliomas results in hypoxia and the accumulation of acidic metabolic products, leading to larger pH_weighted values (31). As shown in Figure 5, gliomas with and without 1p/19q codeletion are difficult to differentiate on T2-FLAIR and T1-enhancement images. However, pH_weighted imaging can visually highlight differences between them and better reflect tumor heterogeneity. In the central tumor region, acidity is significantly increased, while in the peritumoral edema zone, tumor acidity is relatively lower. In more invasive IDH-wt gliomas, both the central tumor region and the peritumoral edema zone exhibit higher acidity, partially explaining their greater invasiveness. Therefore, we believe that pH_weighted imaging is a promising biomarker for glioma grading and subtyping analysis.
MT and DS respectively represent the content of semi-solid molecular tissue and water molecules. Grade III gliomas exhibited higher DS and lower MT compared to grade II gliomas. DS is related to tissue water proton density. Research indicates that high-grade gliomas tend to have higher vascular endothelial growth factor (VEGF) expression (32). VEGF is known as a potent growth factor for vascular endothelial cells, playing a crucial role in tumor growth and invasion by promoting the proliferation and migration of tumor vascular endothelial cells, increasing tumor vascular permeability, and inducing tumor lymphangiogenesis (32, 33). The higher VEGF expression corresponds with more severe edema, resulting in higher DS (25). However, our findings showed that DS was lower in grade IV gliomas compared to grade III gliomas, possibly due to differences in ROI selection. In grade III gliomas, where most cases did not show enhancement on T1-weighted images, the entire T2 hyperintense region was selected as the ROI. In contrast, grade IV gliomas were characterized by selecting the enhanced T1 area and excluding the peritumoral edema zone. MT primarily originates from immobile macromolecules, such as proteins and polysaccharides, and may serve as an indicator of white matter integrity (34). MT was higher in grade II gliomas, likely due to their retention of more normal brain tissue structure and composition. In grade IV gliomas, elevated cell density may lead to increased levels of proteins, polysaccharides, and other components within the tumor region, resulting in a higher MT effect. Furthermore, MT was associated with 1p/19q codeletion in grade II gliomas, with 1p/19q codeletion gliomas showing lower MT (Figure 4). Further subclassification of 1p/19q codeletion and non-codeletion within low-grade gliomas is meaningful, as the identification of 1p/19q codeletion in IDH-mt gliomas maybe influenced by histological grading. Distinguishing 1p/19q subtypes in grade II/III gliomas can facilitate more precise treatment planning and efficacy assessment in preoperative or postoperative follow-up.
Amide and NOE reflect the content of amide protons and macromolecules such as lipids within the tissue. Significant differences were observed in amide and NOE signals between grade III and IV gliomas, as well as between IDH-wt and IDH-mt gliomas. IDH-wt gliomas are typically more aggressive and have higher cellular density compared to IDH-mt gliomas. This aggressive phenotype is associated with an increased proliferative rate and elevated protein synthesis (23, 35). In contrast, IDH-mt leads to the production of the oncometabolite 2- hydroxyglutarate (2-HG), which results in abnormal methylation of DNA and histones, affecting gene expression and cell differentiation (36). The higher concentration of proteins and peptides in IDH-wt gliomas likely contributes to a stronger amide and NOE signal. We found that the diagnostic performance of amide is superior to MTR3.5. This maybe because MTR3.5 is influenced by signals such as NOE and DS, and therefore cannot reflect a purer source of the amide signal.
Our study also found that MGMT promoter unmethylated gliomas typically exhibit higher amide signals. MGMT promoter methylation in gliomas is associated with reduced protein expression, which may impact the expression of downstream proteins. Therefore, CEST may serve as a useful imaging biomarker for predicting MGMT methylation status, consistent with previous findings (37). In contrast to previous studies where APT could not predict MGMT promoter methylation, possibly due to smaller sample sizes (26), our results suggest that MTR3.5, despite being affected by multiple factors, can predict MGMT promoter methylation more effectively than the relatively pure amide signals.
In our study, the amine signal showed no significant differences in the grading and molecular classification of gliomas. Notably, Zhu et al.’s research also found no differences in the amine signal between IDH wild-type and mutant gliomas (27). We believe that there are two possible reasons for this result. Firstly, the amine signal has been assumed to mainly represent the contribution from creatine amine protons. However, amine signal obtained through Lorentzian fitting frequently overlaps with other rapidly exchanging pools, like glutamate, making it difficult to isolate them under 3T conditions. Creatine provides phosphate through phospho-creatine for adenosine triphosphate synthesis in the cell energy requirement. Tumor has reduced creatine and tumor creatine further reduces with tumor progression presumably due to elevated energy deficiency (38). There is building evidence that alterations to glutamate homeostasis in gliomas play an important role in diffuse glioma cell survival and increased extra-cellular glutamate causes excitotoxicity to peri-tumoral structures and promotes tumor invasion in pre-clinical studies (39). The complex variations in the contents of various components within the tumor lead to fluctuations in the amine signal. Secondly, our study was conducted using a 3T MRI scanner. Due to the relatively fast exchange rate of the amine signal and its fitting being close to the water peak at 2 ppm, the z-spectrum characteristics may not be distinct enough, making the Lorentzian fitting more challenging. In summary, the amine signal in glioma research may be influenced by various factors. Further research may need to explore more sensitive techniques or methods to better understand the role of the amine signal in gliomas. Based on the above discussion, the combination of multi-pool Lorentz analysis and pH analysis based on CEST demonstrates good performance in improving the grading and IDH gene typing of glioma. MT and pH_weighted can effectively identify 1p/19q codeletion in grade II and grade III gliomas, respectively. MTR3.5 demonstrates potential effect in identifying MGMT promoter methylation. This technology can be implemented on standard MRI equipment, with a scanning time of approximately 5 minutes being clinically feasible. It does not require additional injection of contrast agents, making it relatively safe. In our study, we chose to perform the scans before the injection of the contrast agent to avoid the influence of the contrast agent on the CEST effect (40).
However, our study has several limitations. Firstly, although existing literature has demonstrated that, within lower irradiation power ranges, multi-pool Lorentzian fitting offers superior quantification accuracy compared to the three-frequency offset method and the Lorentzian-Dipolar (LD) method (38). However, multi-pool Lorentzian fitting has several limitations. In situations where the resonance frequencies of different signals are closely spaced or mixed, Lorentzian fitting may struggle to effectively differentiate between these signals. For example, the wide ‘MT’ peak could have multiple contributions especially the NOE(-1.6), which have attracted many interests in recent years (41–44). However, we could not resolve these components precisely in our analysis. Such spectral overlap can lead to inaccuracies in the fitting results, adversely impacting the quantification of specific signals, such as those from amines or other metabolites (27). Besides, Lorentzian fitting exhibits high sensitivity to background noise, particularly when signal intensities are low. The presence of background noise can interfere with the fitting process, resulting in erroneous parameter estimates. Additionally, successful Lorentzian fitting requires careful selection of initial parameters and fitting ranges. Inappropriate parameter choices can lead to convergence on local minima, thus compromising the accuracy and reliability of the fitting results. These limitations underscore the importance of judiciously selecting appropriate fitting methods and parameters in practical applications to ensure the reliability and validity of the results. Secondly, for pH assessment, although research indicates that amine proton-based CEST imaging (with a resonance frequency of approximately 3.0 ppm) can provide pH-weighted image contrast and may serve as an important imaging biomarker for human brain gliomas (17). The measured CEST contrast depends on various technical factors, including the shape, duration, length, amplitude and repetition time of the saturation pulse, and the strength of the scanning field, and the concentration of amine protons. Additionally, the image SNR can affect pH measurements (45). Furthermore, exchangeable protons from other proteins or macromolecules within the tissue may also influence the amine signal (27).Further research is needed to standardize CEST scanning protocols and post-processing techniques to optimize signal acquisition and data fitting. Additionally, larger-scale clinical studies are required to investigate pH variations among different tumor grades and molecular subtypes across the entire tumor. Thirdly, the sample size is relatively small, particularly for the 1p/19q expression status subgroup. Further validation in a larger cohort is necessary. As a single-center study, there are inherent limitations such as reduced generalizability and potential biases. Multi-center studies are needed to validate and expand upon these findings. Lastly, due to time constraints, only 2D single-slice imaging was performed, which might have missed important pathological regions due to intra-tumoral heterogeneity. Implementing 3D acquisition to cover the entire tumor could address this issue.
In summary, our findings indicate that quantitative assessment of tumor metabolism and microenvironment acidity through multi-pool Lorentzian analysis and pH-weighted analysis can serve as indicators for glioma grading, and for predicting IDH mutations, 1p/19q codeletion, and MGMT promoter methylation status. These metrics not only provide valuable insights into tumor subgroups but also reflect the heterogeneity within tumors.
The raw data supporting the conclusions of this article will be made available by the authors, without undue reservation.
The studies involving humans were approved by the institutional review board of Union Hospital affiliated with Tongji Medical College of Huazhong University of Science and Technology. The studies were conducted in accordance with the local legislation and institutional requirements. The participants provided their written informed consent to participate in this study.
XLZ: Data curation, Methodology, Writing – original draft. JL: Data curation, Writing – review & editing. XL: Data curation, Software, Supervision, Writing – review & editing. PS: Methodology, Software, Writing – review & editing. QQ: Data curation, Writing – review & editing. ZX: Data curation, Methodology, Writing – review & editing. LC: Data curation, Methodology, Writing – review & editing. XXZ: Data curation, Methodology, Software, Writing – review & editing. XG: Data curation, Writing – review & editing. JW: Conceptualization, Data curation, Formal analysis, Funding acquisition, Methodology, Project administration, Resources, Supervision, Writing – review & editing.
The author(s) declare financial support was received for the research, authorship, and/or publication of this article. The work presented here was funded by National Natural Science Foundation of China (No. 82371945) to JW.
We are grateful to all the subjects who participated in this work.
The authors declare that the research was conducted in the absence of any commercial or financial relationships that could be construed as a potential conflict of interest.
The author(s) declare that no Generative AI was used in the creation of this manuscript.
All claims expressed in this article are solely those of the authors and do not necessarily represent those of their affiliated organizations, or those of the publisher, the editors and the reviewers. Any product that may be evaluated in this article, or claim that may be made by its manufacturer, is not guaranteed or endorsed by the publisher.
The Supplementary Material for this article can be found online at: https://www.frontiersin.org/articles/10.3389/fonc.2024.1507335/full#supplementary-material
1. Wagner MW, Jabehdar Maralani P, Bennett J, Bennett J, Nobre L, Lim-Fat MJ, et al. Brain tumor imaging in adolescents and young adults: 2021 WHO updates for molecular-based tumor types. Radiology. (2024) 310:e230777. doi: 10.1148/radiol.230777
2. Berger TR, Wen PY, Lang-Orsini M, Chukwueke UN. World health organization 2021 classification of central nervous system tumors and implications for therapy for adult-type gliomas: A review. JAMA Oncol. (2022) 8:1493–501. doi: 10.1001/jamaoncol.2022.2844
3. van den Bent MJ, French PJ, Brat D, Tonn JC, Touat M, Ellingson BM, et al. The biological significance of tumor grade, age, enhancement and extent of resection in IDH mutant gliomas: how should they inform treatment decision in the era of IDH inhibitors? Invited review. Neuro-oncology. (2024) 26(10):1805–22. doi: 10.1093/neuonc/noae107
4. van der Meulen M, Mason WP. First-line chemotherapeutic treatment for oligodendroglioma, WHO grade 3-PCV or temozolomide? Neuro-oncology Pract. (2022) 9:163–4. doi: 10.1093/nop/npac023
5. Ladenhauf VK, Galijasevic M, Kerschbaumer J, Freyschlag CF, Nowosielski M, Birkl-Toeglhofer AM, et al. Peritumoral ADC values correlate with the MGMT methylation status in patients with glioblastoma. Cancers. (2023) 15(5):1384. doi: 10.3390/cancers15051384
6. Han Y, Yan LF, Wang XB, Sun YZ, Zhang X, Liu ZC, et al. Structural and advanced imaging in predicting MGMT promoter methylation of primary glioblastoma: a region of interest based analysis. BMC Cancer. (2018) 18:215. doi: 10.1186/s12885-018-4114-2
7. Gihr G, Horvath-Rizea D, Kohlhof-Meinecke P, Ganslandt O, Henkes H, Härtig W, et al. Diffusion weighted imaging in gliomas: A histogram-based approach for tumor characterization. Cancers. (2022) 14(14):3393. doi: 10.3390/cancers14143393
8. Xie Z, Li J, Zhang Y, Zhou R, Zhang H, Duan C, et al. The diagnostic value of ADC histogram and direct ADC measurements for coexisting isocitrate dehydrogenase mutation and O6-methylguanine-DNA methyltransferase promoter methylation in glioma. Front Neurosci. (2022) 16:1099019. doi: 10.3389/fnins.2022.1099019
9. Zhang HW, Lyu GW, He WJ, Lei Y, Lin F, Wang MZ, et al. DSC and DCE histogram analyses of glioma biomarkers, including IDH, MGMT, and TERT, on differentiation and survival. Acad Radiol. (2020) 27:e263–e71. doi: 10.1016/j.acra.2019.12.010
10. Pons-Escoda A, Garcia-Ruiz A, Naval-Baudin P, Martinez-Zalacain I, Castell J, Camins A, et al. Differentiating IDH-mutant astrocytomas and 1p19q-codeleted oligodendrogliomas using DSC-PWI: high performance through cerebral blood volume and percentage of signal recovery percentiles. Eur Radiol. (2024) 34(8):5320–30. doi: 10.1007/s00330-024-10611-z
11. Kang KM, Song J, Choi Y, Park C, Park JE, Kim HS, et al. MRI scoring systems for predicting isocitrate dehydrogenase mutation and chromosome 1p/19q codeletion in adult-type diffuse glioma lacking contrast enhancement. Radiology. (2024) 311:e233120. doi: 10.1148/radiol.233120
12. Buz-Yalug B, Turhan G, Cetin AI, Dindar SS, Danyeli AE, Yakicier C, et al. Identification of IDH and TERTp mutations using dynamic susceptibility contrast MRI with deep learning in 162 gliomas. Eur J Radiol. (2024) 170:111257. doi: 10.1016/j.ejrad.2023.111257
13. Wang YL, Yao J, Chakhoyan A, Raymond C, Salamon N, Liau LM, et al. Association between Tumor Acidity and Hypervascularity in Human Gliomas Using pH-Weighted Amine Chemical Exchange Saturation Transfer Echo-Planar Imaging and Dynamic Susceptibility Contrast Perfusion MRI at 3T. AJNR Am J neuroradiology. (2019) 40:979–86. doi: 10.3174/ajnr.A6063
14. Helmlinger G, Sckell A, Dellian M, Forbes NS, Jain RK. Acid production in glycolysis-impaired tumors provides new insights into tumor metabolism. Clin Cancer Res. (2002) 8:1284–91.
15. Consolino L, Anemone A, Capozza M, Carella A, Irrera P, Corrado A, et al. Non-invasive investigation of tumor metabolism and acidosis by MRI-CEST imaging. Front Oncol. (2020) 10:161. doi: 10.3389/fonc.2020.00161
16. Yao J, Tan CHP, Schlossman J, Chakhoyan A, Raymond C, Pope WB, et al. pH-weighted amine chemical exchange saturation transfer echoplanar imaging (CEST-EPI) as a potential early biomarker for bevacizumab failure in recurrent glioblastoma. J neuro-oncology. (2019) 142:587–95. doi: 10.1007/s11060-019-03132-z
17. Harris RJ, Cloughesy TF, Liau LM, Prins RM, Antonios JP, Li D, et al. pH-weighted molecular imaging of gliomas using amine chemical exchange saturation transfer MRI. Neuro-oncology. (2015) 17:1514–24. doi: 10.1093/neuonc/nov106
18. Lee DH, Heo HY, Zhang K, Zhang Y, Jiang S, Zhao X, et al. Quantitative assessment of the effects of water proton concentration and water T(1) changes on amide proton transfer (APT) and nuclear overhauser enhancement (NOE) MRI: The origin of the APT imaging signal in brain tumor. Magnetic resonance Med. (2017) 77:855–63. doi: 10.1002/mrm.26131
19. Guo H, Liu J, Hu J, Zhang H, Zhao W, Gao M, et al. Diagnostic performance of gliomas grading and IDH status decoding A comparison between 3D amide proton transfer APT and four diffusion-weighted MRI models. J magnetic resonance imaging: JMRI. (2022) 56:1834–44. doi: 10.1002/jmri.28211
20. Jiang S, Yu H, Wang X, Lu S, Li Y, Feng L, et al. Molecular MRI differentiation between primary central nervous system lymphomas and high-grade gliomas using endogenous protein-based amide proton transfer MR imaging at 3 Tesla. Eur Radiol. (2016) 26:64–71. doi: 10.1007/s00330-015-3805-1
21. Ma B, Blakeley JO, Hong X, Zhang H, Jiang S, Blair L, et al. Applying amide proton transfer-weighted MRI to distinguish pseudoprogression from true progression in Malignant gliomas. J magnetic resonance imaging: JMRI. (2016) 44:456–62. doi: 10.1002/jmri.25159
22. Choi YS, Ahn SS, Lee SK, Chang JH, Kang SG, Kim SH, et al. Amide proton transfer imaging to discriminate between low- and high-grade gliomas: added value to apparent diffusion coefficient and relative cerebral blood volume. Eur Radiol. (2017) 27:3181–9. doi: 10.1007/s00330-017-4732-0
23. Jiang S, Zou T, Eberhart CG, Villalobos MAV, Heo HY, Zhang Y, et al. Predicting IDH mutation status in grade II gliomas using amide proton transfer-weighted (APTw) MRI. Magnetic resonance Med. (2017) 78:1100–9. doi: 10.1002/mrm.26820
24. Joo B, Han K, Ahn SS, Choi YS, Chang JH, Kang SG, et al. Amide proton transfer imaging might predict survival and IDH mutation status in high-grade glioma. Eur Radiol. (2019) 29:6643–52. doi: 10.1007/s00330-019-06203-x
25. Su C, Xu S, Lin D, He H, Chen Z, Damen FC, et al. Multi-parametric Z-spectral MRI may have a good performance for glioma stratification in clinical patients. Eur Radiol. (2022) 32:101–11. doi: 10.1007/s00330-021-08175-3
26. Paech D, Windschuh J, Oberhollenzer J, Dreher C, Sahm F, Meissner JE, et al. Assessing the predictability of IDH mutation and MGMT methylation status in glioma patients using relaxation-compensated multipool CEST MRI at 7.0 T. Neuro-oncology. (2018) 20:1661–71. doi: 10.1093/neuonc/noy073
27. Zhu H, Li Y, Ding Y, Liu Y, Shen N, Xie Y, et al. Multi-pool chemical exchange saturation transfer MRI in glioma grading, molecular subtyping and evaluating tumor proliferation. J neuro-oncology. (2024) 169(2):287–97. doi: 10.1007/s11060-024-04729-9
28. Sun Y, Su C, Deng K, Hu X, Xue Y, Jiang R. Mean apparent propagator-MRI in evaluation of glioma grade, cellular proliferation, and IDH-1 gene mutation status. Eur Radiol. (2022) 32:3744–54. doi: 10.1007/s00330-021-08522-4
29. Cao M, Wang X, Liu F, Xue K, Dai Y, Zhou Y. A three-component multi-b-value diffusion-weighted imaging might be a useful biomarker for detecting microstructural features in gliomas with differences in Malignancy and IDH-1 mutation status. Eur Radiol. (2023) 33:2871–80. doi: 10.1007/s00330-022-09212-5
30. Deshmane A, Zaiss M, Lindig T, Herz K, Schuppert M, Gandhi C, et al. 3D gradient echo snapshot CEST MRI with low power saturation for human studies at 3T. Magnetic resonance Med. (2019) 81:2412–23. doi: 10.1002/mrm.27569
31. Jones KM, Randtke EA, Yoshimaru ES, Howison CM, Chalasani P, Klein RR, et al. Clinical translation of tumor acidosis measurements with acidoCEST MRI. Mol Imaging Biol. (2017) 19:617–25. doi: 10.1007/s11307-016-1029-7
32. Berro A, Assi A, Farhat M, Hatoum L, Saad JP, Mohanna R, et al. Unlocking Hope: Anti-VEGFR inhibitors and their potential in glioblastoma treatment. Crit Rev oncology/hematology. (2024) 198:104365. doi: 10.1016/j.critrevonc.2024.104365
33. Jiang S, Zhu G, Tan Y, Zhou T, Zheng S, Wang F, et al. Identification of VEGFs-related gene signature for predicting microangiogenesis and hepatocellular carcinoma prognosis. Aging. (2024) 16(12):10321–47. doi: 10.18632/aging.205931
34. Su C, Zhao L, Li S, Jiang J, Cai K, Shi J, et al. Amid proton transfer (APT) and magnetization transfer (MT) MRI contrasts provide complimentary assessment of brain tumors similarly to proton magnetic resonance spectroscopy imaging (MRSI). Eur Radiol. (2019) 29:1203–10. doi: 10.1007/s00330-018-5615-8
35. Stadlbauer A, Nikolic K, Oberndorfer S, Marhold F, Kinfe TM, Meyer-Bäse A, et al. Machine learning-based prediction of glioma IDH gene mutation status using physio-metabolic MRI of oxygen metabolism and neovascularization (A bicenter study). Cancers. (2024) 16(6):1102. doi: 10.3390/cancers16061102
36. Rudà R, Horbinski C, van den Bent M, Preusser M, Soffietti R. IDH inhibition in gliomas: from preclinical models to clinical trials. Nat Rev Neurol. (2024) 20:395–407. doi: 10.1038/s41582-024-00967-7
37. Jiang S, Rui Q, Wang Y, Heo HY, Zou T, Yu H, et al. Discriminating MGMT promoter methylation status in patients with glioblastoma employing amide proton transfer-weighted MRI metrics. Eur Radiol. (2018) 28:2115–23. doi: 10.1007/s00330-017-5182-4
38. Zhang XY, Wang F, Li H, Xu J, Gochberg DF, Gore JC, et al. Accuracy in the quantification of chemical exchange saturation transfer (CEST) and relayed nuclear Overhauser enhancement (rNOE) saturation transfer effects. NMR biomedicine. (2017) 30:10.1002/nbm.3716. doi: 10.1002/nbm.v30.7
39. Neal A, Moffat BA, Stein JM, Nanga RPR, Desmond P, Shinohara RT, et al. Glutamate weighted imaging contrast in gliomas with 7 ; Tesla magnetic resonance imaging. NeuroImage Clin. (2019) 22:101694. doi: 10.1016/j.nicl.2019.101694
40. Tee YK, Donahue MJ, Harston GW, Payne SJ, Chappell MA. Quantification of amide proton transfer effect pre- and post-gadolinium contrast agent administration. J magnetic resonance imaging: JMRI. (2014) 40:832–8. doi: 10.1002/jmri.24441
41. Zu Z. Ratiometric NOE(-1.6) contrast in brain tumors. NMR Biomedicine. (2018) 31:e4017. doi: 10.1002/nbm.4017
42. Zu Z, Lin EC, Louie EA, Xu J, Li H, Xie J, et al. Relayed nuclear Overhauser enhancement sensitivity to membrane Cho phospholipids. Magnetic resonance Med. (2020) 84:1961–76. doi: 10.1002/mrm.28258
43. Foo LS, Larkin JR, Sutherland BA, Ray KJ, Yap WS, Goh CH, et al. Investigation of relayed nuclear Overhauser enhancement effect at -1.6 ppm in an ischemic stroke model. Quantitative Imaging Med Surg. (2023) 13:7879–92. doi: 10.21037/qims-23-510
44. Chang YC, Liu HQ, Chang JH, Chang YY, Lin EC. Role of the cholesterol hydroxyl group in the chemical exchange saturation transfer signal at -1.6 ppm. NMR biomedicine. (2020) 33:e4356. doi: 10.1002/nbm.v33.9
45. Harris RJ, Cloughesy TF, Liau LM, Nghiemphu PL, Lai A, Pope WB, et al. Simulation, phantom validation, and clinical evaluation of fast pH-weighted molecular imaging using amine chemical exchange saturation transfer echo planar imaging (CEST-EPI) in glioma at 3 T. NMR biomedicine. (2016) 29:1563–76. doi: 10.1002/nbm.v29.11
Keywords: glioma, IDH, 1p/19q codeletion, MGMT, pH assessment
Citation: Zhang X, Lu J, Liu X, Sun P, Qin Q, Xiang Z, Cheng L, Zhang X, Guo X and Wang J (2024) Multipool-CEST and CEST-based pH assessment as predictive tools for glioma grading, IDH mutation, 1p/19q codeletion, and MGMT promoter methylation in gliomas. Front. Oncol. 14:1507335. doi: 10.3389/fonc.2024.1507335
Received: 07 October 2024; Accepted: 04 December 2024;
Published: 20 December 2024.
Edited by:
Jürgen Schlegel, Technical University of Munich, GermanyReviewed by:
Yee Kai Tee, Tunku Abdul Rahman University, MalaysiaCopyright © 2024 Zhang, Lu, Liu, Sun, Qin, Xiang, Cheng, Zhang, Guo and Wang. This is an open-access article distributed under the terms of the Creative Commons Attribution License (CC BY). The use, distribution or reproduction in other forums is permitted, provided the original author(s) and the copyright owner(s) are credited and that the original publication in this journal is cited, in accordance with accepted academic practice. No use, distribution or reproduction is permitted which does not comply with these terms.
*Correspondence: Jing Wang, amp3aW5mbG93ZXJAMTI2LmNvbQ==
Disclaimer: All claims expressed in this article are solely those of the authors and do not necessarily represent those of their affiliated organizations, or those of the publisher, the editors and the reviewers. Any product that may be evaluated in this article or claim that may be made by its manufacturer is not guaranteed or endorsed by the publisher.
Research integrity at Frontiers

Learn more about the work of our research integrity team to safeguard the quality of each article we publish.