- 1Fujian Provincial Hospital, Provincial Clinical Medical College, Fujian Medical University, Fuzhou, China
- 2Fujian Provincial Hospital, Fujian Provincial Key Laboratory of Critical Care Medicine, Fuzhou, China
- 3Department of Ultrasound, Fujian Provincial Hospital, Fuzhou, China
Purpose: This study aims to assess the diagnostic efficacy of conventional ultrasound (CUS) and contrast-enhanced ultrasound (CEUS) in detecting fat-poor angiomyolipomas(AML) with dimensions less than 5 cm. Additionally, the study seeks to identify independent indicators for predicting the presence of fat-poor AML.
Methods: We conducted a retrospective analysis of patients diagnosed with renal AML and renal cell carcinoma, who were admitted and underwent surgery at Fujian Provincial Hospital from January 2013 to October 2023. A total of 154 renal tumors were included (104 renal cell carcinomas and 50 fat-poor AMLs). Prior to radical or partial nephrectomy, these patients underwent both CUS and CEUS examinations. We systematically analyzed the features observed in CUS and CEUS, identified independent factors through multifactorial regression analysis, and evaluated diagnostic efficacy by calculating the area under the curve (AUC).
Results: Univariate analysis revealed significant distinctions in fat-poor AML concerning gender, age, morphology, internal hyperechoic features (starry-sky sign, crescent sign), enhancement uniformity, and delayed enhancement, all displaying significance compared to renal cell carcinoma (RCC) (p < 0.05). Multivariate analysis demonstrated that internal hyperechoic features (p < 0.01, Odds Ratio [OR] = 0.003, 95% Confidence Interval [CI]: 0.000-0.0028) and enhancement uniformity (p < 0.01, OR = 0.016, 95% CI: 0.001-0.229) independently predicted fat-poor AML. The Receiver Operating Characteristic (ROC) curve’s area under the curve (AUC) for internal hyperechoic features (starry-sky sign, crescent sign) was 0.88 (95% CI: 0.80–0.95), with a sensitivity of 78.00%, specificity of 97.12%, positive predictive value of 92.85%, and negative predictive value of 90.18%. Conversely, the ROC curve AUC for enhancement uniformity was 0.70 (95% CI: 0.62–0.78), with a sensitivity of 96.00%, specificity of 44.23%, positive predictive value of 45.28%, and negative predictive value of 95.83%.
Conclusion: This study suggests that both CUS and CEUS possess discriminative value in differentiating fat-poor AMLs from RCCs. Notably, internal hyperechoic features (starry-sky sign, crescent sign) and uniform enhancement within renal tumors emerge as potential independent indicators for predicting fat-poor AML.
Introduction
Renal angiomyolipoma (AML), characterized by the presence of smooth muscle, blood vessels, and adipose tissue, stands as the most prevalent benign tumor within the kidney (1, 2) and is affiliated with the PEComa family, constituting 2.0-6.4% of all renal tumors. Most AML cases require only follow-up observation without the need for surgical intervention (3). Among them, epithelioid AML is characterized by perivascular epithelioid cells. Although it has malignant potential, partial nephrectomy, such as robot-assisted partial nephrectomy (4), and minimally invasive treatments (e.g., radiofrequency ablation, microwave ablation) are options (5). However, smaller lesions can be managed conservatively, similar to traditional AML treatment (6, 7). In contrast, renal cell carcinoma (RCC) is treated primarily through surgical resection (8, 9). However, the challenge arises in distinguishing fat-poor AMLs from RCC, which may lead to misdiagnosis. Reports indicate that for renal tumors smaller than 4 cm, partial nephrectomy often results in a benign pathology, with half of these cases being AML (10, 11). Hence, achieving a clear distinction between fat-poor AMLs and RCC in imaging is imperative. This distinction aids in determining whether essential surgery or vigilant follow-up is warranted (12).
In most instances, the typical ultrasound (US) presentation of renal AML is hyperechoic, facilitating a clear distinction from malignant tumors and establishing itself as a highly specific marker for AML (13–15). Fat-poor AML can be classified into hyperattenuating type and isoattenuating type based on the findings of unenhanced CT (14), with hyperattenuating type accounting for 4-5% of AML (16). Pathologically, the fat content of hyperattenuation type is less than 4%, while that of the isoattenuating type pathologically has less than 25% fat content (14, 15). To date, careful interpretation of computed tomography (CT) and magnetic resonance imaging (MRI) have certain advantages in differentiating fat poor AML from RCC (14, 16). However, it often remains challenging and requires further renal mass biopsy (14, 16–19), which may introduce additional risks, costs, and potential contraindications for certain patients (20). With continuous advancements in US technology, two-dimensional US now offers greater clarity. The use of color Doppler US, three-dimensional US, and particularly the discovery of contrast-enhanced ultrasound(CEUS), has become increasingly valuable. Although there has been several researches on the combination of conventional US and CEUS for differentiating classical AMLs from RCC, limited research exists on their effectiveness in distinguishing fat-poor AMLs from RCC (3). Our objective is to pinpoint distinctive imaging features on ultrasound and CEUS, mitigating the risk of misdiagnosing fat-poor AMLs, thereby reducing unnecessary surgical interventions and benefiting patients. Recognizing that larger renal tumors may pose challenges due to hemorrhage, necrosis, cystic changes, or metastasis interfering with imaging interpretation, our study concentrates on tumors smaller than 5 cm.
This study aims to assess the diagnostic effectiveness of CUS and CEUS in discriminating fat-poor AMLs from RCC, and to identify independent indicators predicting fat-poor AMLs.
Materials and methods
Patients
This study is a single-center retrospective analysis. The study was approved by the Institutional Review Board of Fujian Provincial Hospital, and written informed consent was obtained from all patients, who were aware of and consented to undergoing contrast-enhanced ultrasound examinations. A total of 57 patients with fat-poor AMLs underwent partial or radical nephrectomy between January 2013 and October 2023. Additionally, 114 RCC patients who underwent partial or radical nephrectomy during the same period were randomly selected in a 1:2 ratio. Inclusion criteria for the study were as follows: patients underwent CUS and CEUS before radical or partial nephrectomy; lesions exhibited hypoechoic or predominantly hypoechoic characteristics; solid masses with a maximum diameter less than 5 cm; and patients had not undergone any invasive treatment before CUS and CEUS. The study enrolled a total of 156 patients with 159 renal tumors, consisting of 53 cases with fat-poor AMLs and 106 cases of RCC. Exclusion criteria for CUS and CEUS analysis included: unclear CUS images; predominantly cystic lesions (n=1); lack of contrast enhancement (n=2), or inadequate contrast enhancement due to a brief recording time (n=1) or image jitter (n=1).
Ultimately, this study included 154 cases, comprising 50 fat-poor AMLs, with 20 males and 30 females, and a mean age of 48.54 ± 12.71 years. There were 104 RCC cases, with 64 males and 38 females, and a mean age of 53.46 ± 15.43 years.
CUS and CEUS examination
CUS and CEUS examinations were performed by a single ultrasound specialist (W.S.S and C.S), possessing 20 years of abdominal ultrasound experience and 13 years of specialized expertise in CEUS at our institution. Utilizing a Philips iU22 color Doppler ultrasound system equipped with a C5-2 transducer (frequency 2-5 MHz) for the initial CUS assessment, the objective was to ascertain the tumor’s location, size, morphology, and internal echoes. Subsequently, the most optimal section covering the entire renal lesion and adjacent normal renal parenchyma was chosen, prompting a transition to CEUS mode. In this study, we employed SonoVue (Bracco, Milan, Italy) as the contrast agent, comprised of sulfur hexafluoride microbubbles stabilized by phospholipids. The SonoVue lyophilized powder was reconstituted with 5.0 ml of normal saline to form a suspension. Depending on the patient’s weight, height, and age, 1.6-2.2 ml of the suspension was administered through the antecubital vein, followed by a 5.0 ml saline flush. The injection was precisely synchronized with the timer and video recorder buttons. Patients maintained a slow breathing pattern, and each dynamic contrast-enhanced image was observed for a minimum of 3 minutes. If the assessment of the tumor yields suboptimal results, a second injection is administered 15 minutes after the initial administration. Individual images and video clips from both CEUS and CUS are meticulously stored on a local hard drive for subsequent analysis.
Imaging interpretation and data evaluation
The images and video clips stored on the local hard drive underwent independent, blinded review by two ultrasound physicians (L.X. and Z.X.T), with a random allocation, ensuring no knowledge of the pathological outcomes. Both ultrasound physicians, each boasting over 7 years of expertise in abdominal ultrasound interpretation and 5 years in CEUS reading, remained uninformed about the pathological results. Assessment of the CUS images encompassed tumor location, size, shape, and internal hyperechoic features. Internal hyperechoic features within the mass were defined as echoes resembling those of the renal sinus, presenting as either punctate (starfield sign) or arc-shaped (crescent sign). Echogenic features not slightly exceeding the renal sinus echo were excluded, as were strong echoes surpassing the renal sinus echo, accompanied by a comet tail artifact.
With reference to the normal renal cortex adjacent to the renal mass, we conducted an analysis of the CEUS features of the renal mass. The CEUS characteristics encompassed intensity level, enhancement uniformity, enhancement pattern, and washout pattern. Intensity levels were categorized as high enhancement, iso-enhancement, and low enhancement. Enhancement uniformity was classified as either uniform or non-uniform. Uniformity indicated a singular form of enhancement pattern, while non-uniformity suggested a diverse form of enhancement. Enhancement patterns included rapid-in, synchronous, and slow-in, while washout patterns encompassed rapid-out, synchronous, and slow-out. In instances where there was a disparity in conclusions between the two ultrasound physicians, a consultation with a third, more experienced ultrasound specialist was sought to achieve a final consensus through thorough discussion.
Statistical analysis
The quantitative data were presented as mean ± standard deviation (SD). Independent sample t-tests and Mann-Whitney U tests were applied for comparing quantitative data between fat-poor AML and RCC. Pearson’s chi-square test and Fisher’s exact test were employed for comparing categorical data between groups. Multivariate logistic regression analysis was conducted for variables that exhibited favorable performance in univariate analysis, aiming to predict fat-poor AML. Odds ratios (OR), 95% confidence intervals (CIs), and p-values were calculated. Variables demonstrating significant and independent effects were isolated to construct Receiver Operating Characteristic (ROC) curves, determining the area under the ROC curve (AUC). The optimal cutoff value for the representative index with the highest AUC was identified. Sensitivity, specificity, positive predictive value, and negative predictive value were computed accordingly. Statistical analysis was performed using IBM SPSS Statistics version 22.0 (IBM Corporation, Armonk, NY, USA). A p-value < 0.05 was considered statistically significant.
Results
Characteristics of the enrolled patients
A total of 154 cases of renal tumors were enrolled in this study, with 104 cases (67.53%) identified as RCCs and 50 cases (32.47%) as fat-poor AMLs. Within the RCCs subgroup, clear cell carcinomas (ccRCCs) comprised 93 cases (89.42%), papillary renal cell carcinomas (pRCCs) accounted for 6 cases (5.77%), and chromophobe renal cell carcinomas (cRCCs) were present in 5 cases (4.81%). Pathologically, all AML lesions demonstrated ≤15% fat content, consistent with the diagnosis of fat-poor AML. Eight cases exhibited an epithelioid AML subtype, while 42 cases were classified as classical AMLs, showcasing a predominant presence of epithelioid and spindle cells under microscopic examination. Significantly divergent age and gender distributions were noted between patients with fat-poor AMLs and RCCs (p<0.05) (Table 1).
CUS characteristics of renal masses
Fat-poor AML demonstrate noteworthy distinctions from RCC concerning internal hyperechoic features, yielding a p-value of < 0.01. Among fat-poor AMLs, 39 out of 50 cases exhibit internal hyperechoic signals, characterized by either a punctate distribution (resembling a starry sky) or a linear/arcuate distribution (resembling a crescent moon) (Figures 1, 2). In contrast, only 3 out of 104 RCC cases display internal hyperechoic signals, primarily with a punctate distribution. Both fat-poor AML and RCC frequently manifest with regular shapes, predominantly circular or oval. Nevertheless, irregular shapes are noted in 7 out of 50 fat-poor AML cases and 3 out of 104 RCC cases, with the mushroom-like configuration being a prevalent variation (Table 2). No statistically significant distinctions were discerned concerning tumor position, location, or size between fat-poor AMLs and RCCs.
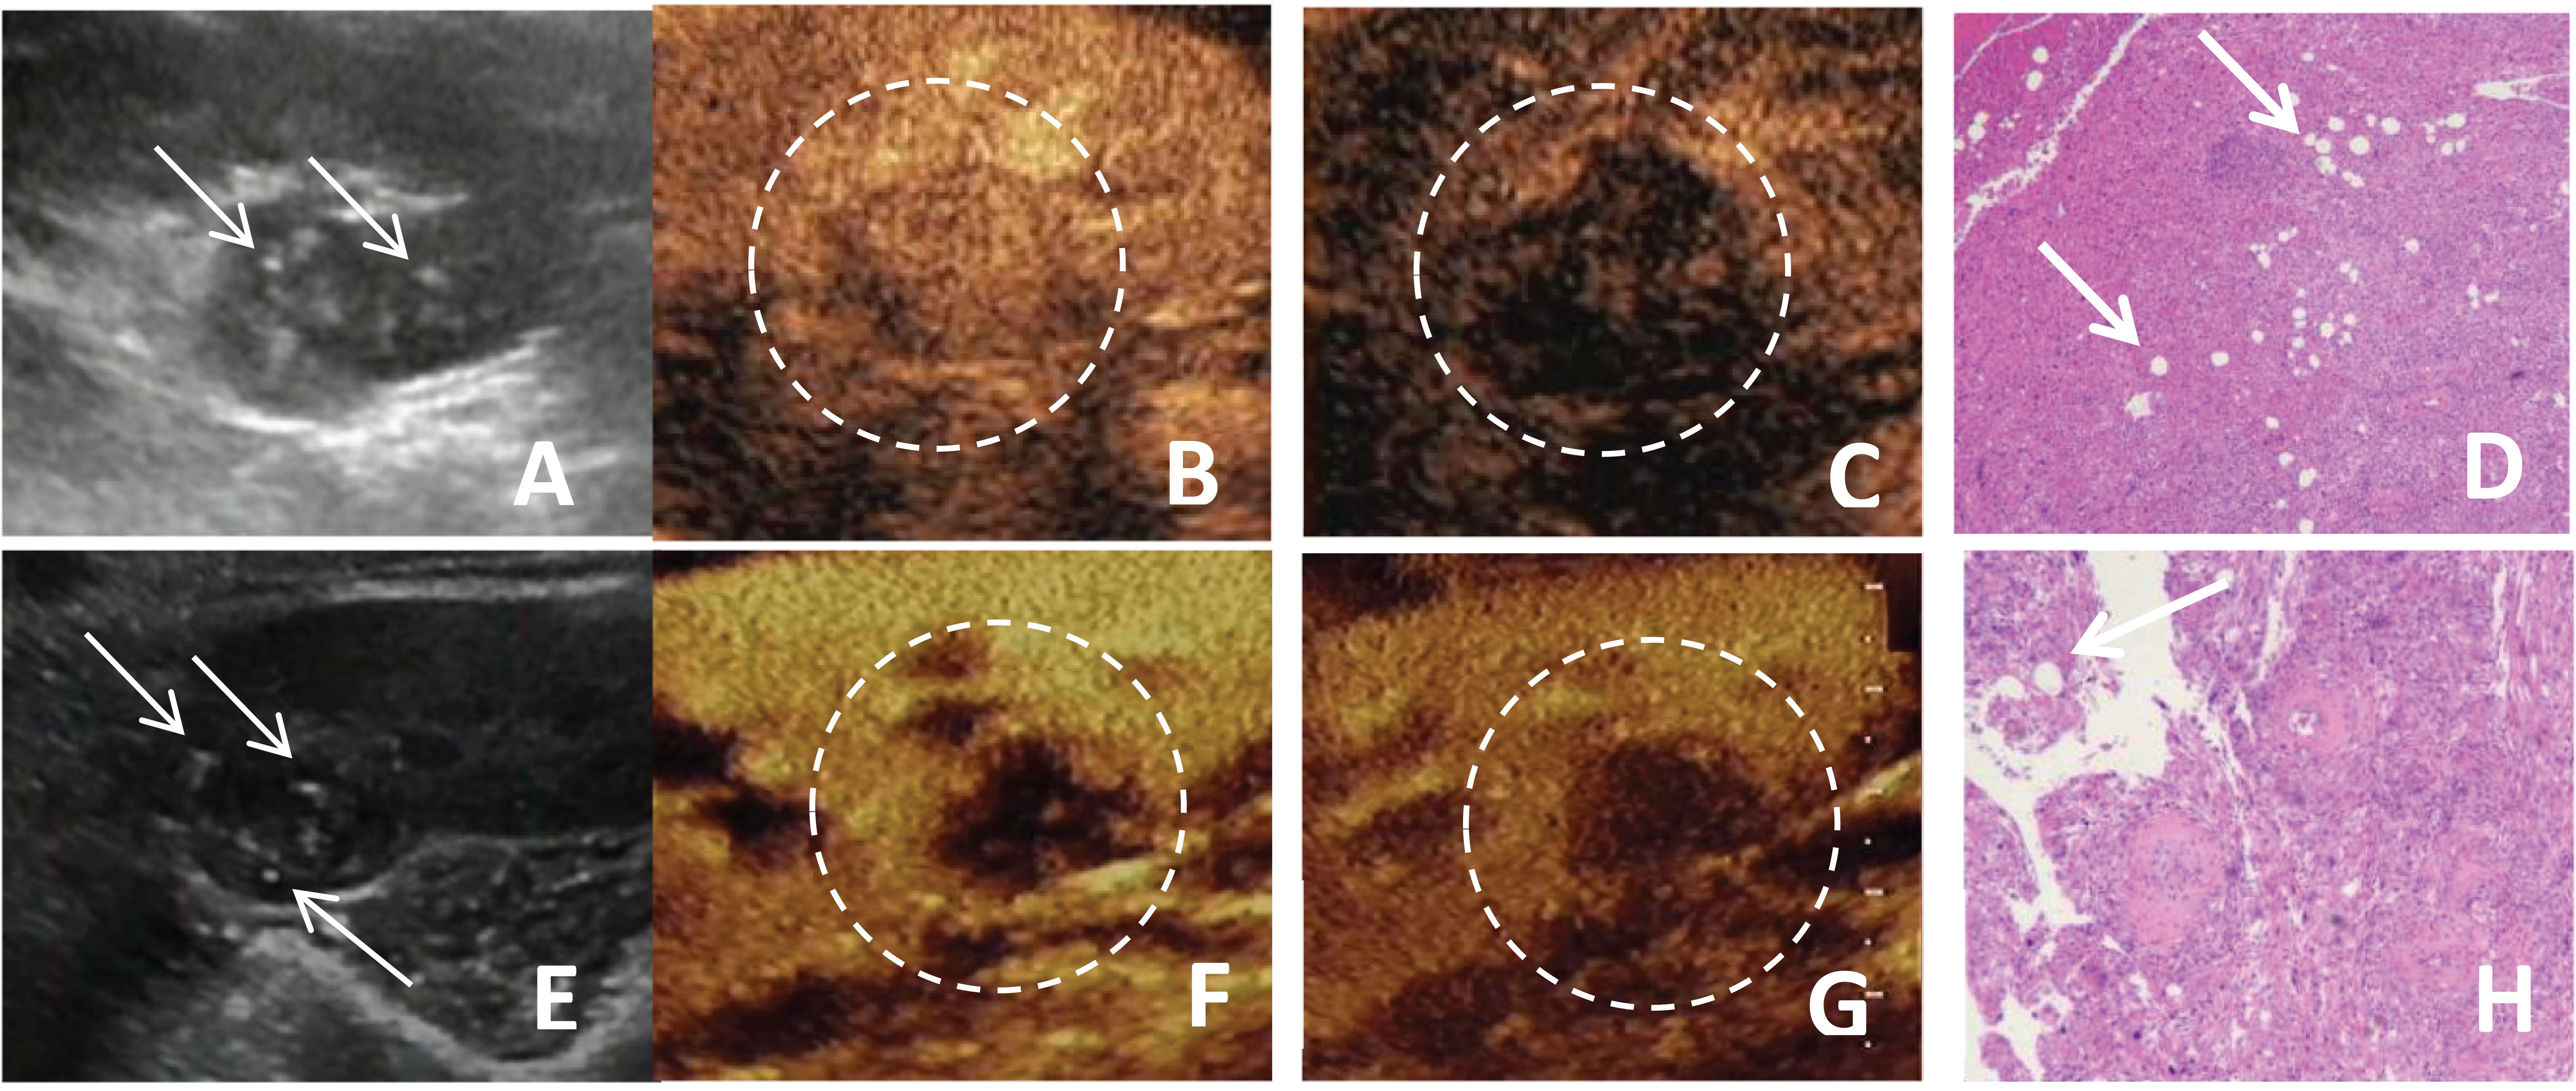
Figure 1. (A-D) A 51-year-old female patient with a fat-poor angiomyolipoma(AML) in the left kidney; (E-H) A 44-year-old female patient with a fat-poor AML in the right kidney. (A, E) Ultrasound images of fat-poor AML demonstrate heterogeneous internal echoes with multiple foci of hyperechoic regions (indicated by arrows). (B) Contrast-enhanced ultrasound (CEUS) shows a homogeneously iso-enhanced peak. (C) CEUS shows low enhancement in the late phase. (F) CEUS shows a homogeneously low-enhanced peak. (G) CEUS shows low enhancement in the late phase. (D, H) Corresponding histopathological sections show scattered clusters of adipocytes (indicated by arrows) (original magnification, ×10; hematoxylin and eosin [H&E] staining).
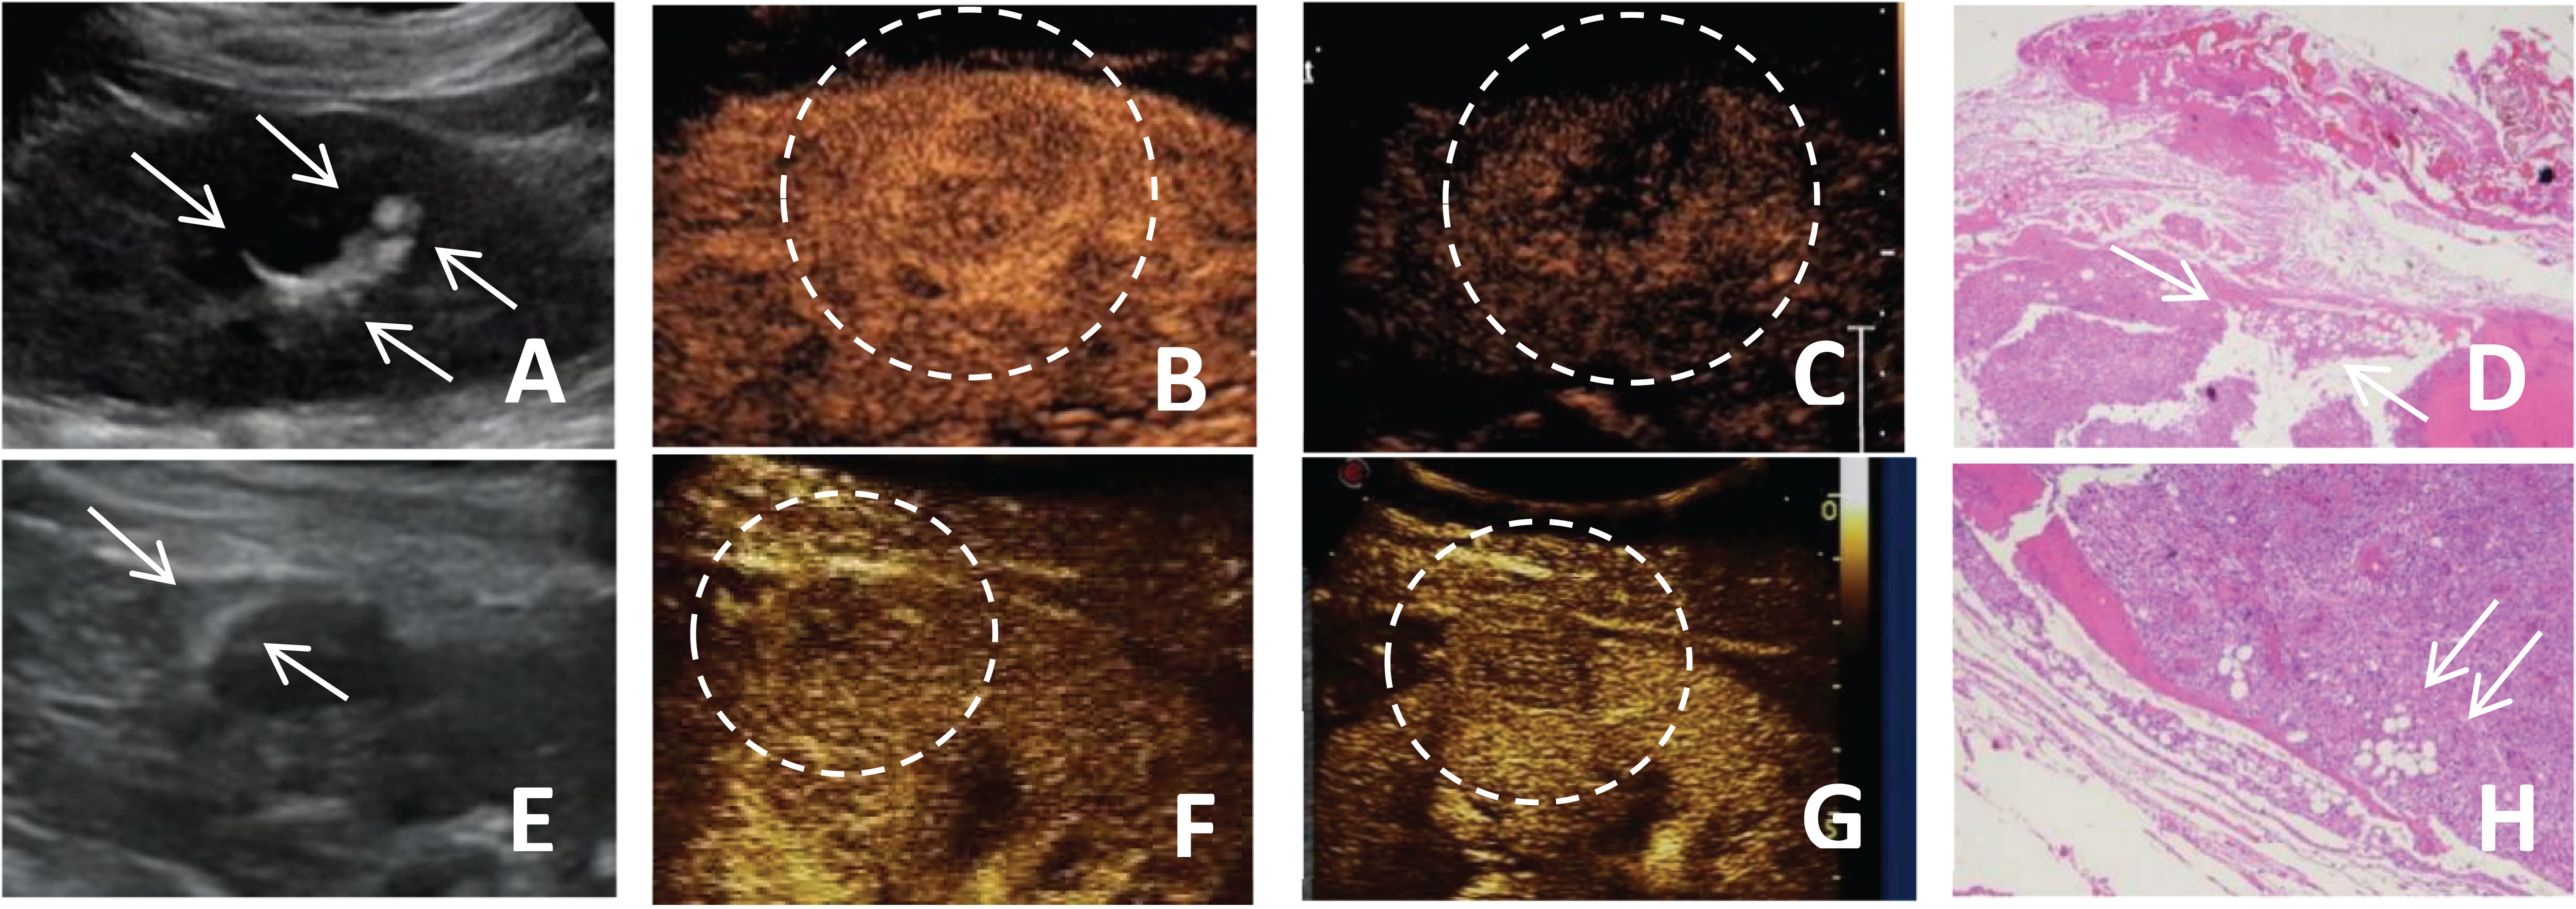
Figure 2. (A-D) A 51-year-old female patient with a fat-poor angiomyolipoma(AML) in the left kidney; (E-H) A 48-year-old female patient with a fat-poor AML in the right kidney. (A, E) Ultrasound images of fat-poor AML show crescent-shaped hyperechoic areas along the lesion margins (indicated by arrows). (B) Contrast-enhanced ultrasound (CEUS) shows a homogeneously hyper-enhanced peak. (C) CEUS shows low enhancement in the late phase. (F) CEUS shows a homogeneously iso-enhanced peak. (G) CEUS shows low enhancement in the late phase. (D, H) Corresponding histopathological sections show scattered clusters of adipocytes (indicated by arrows) (original magnification, ×10; hematoxylin and eosin [H&E] staining).
CEUS characteristics of renal masses
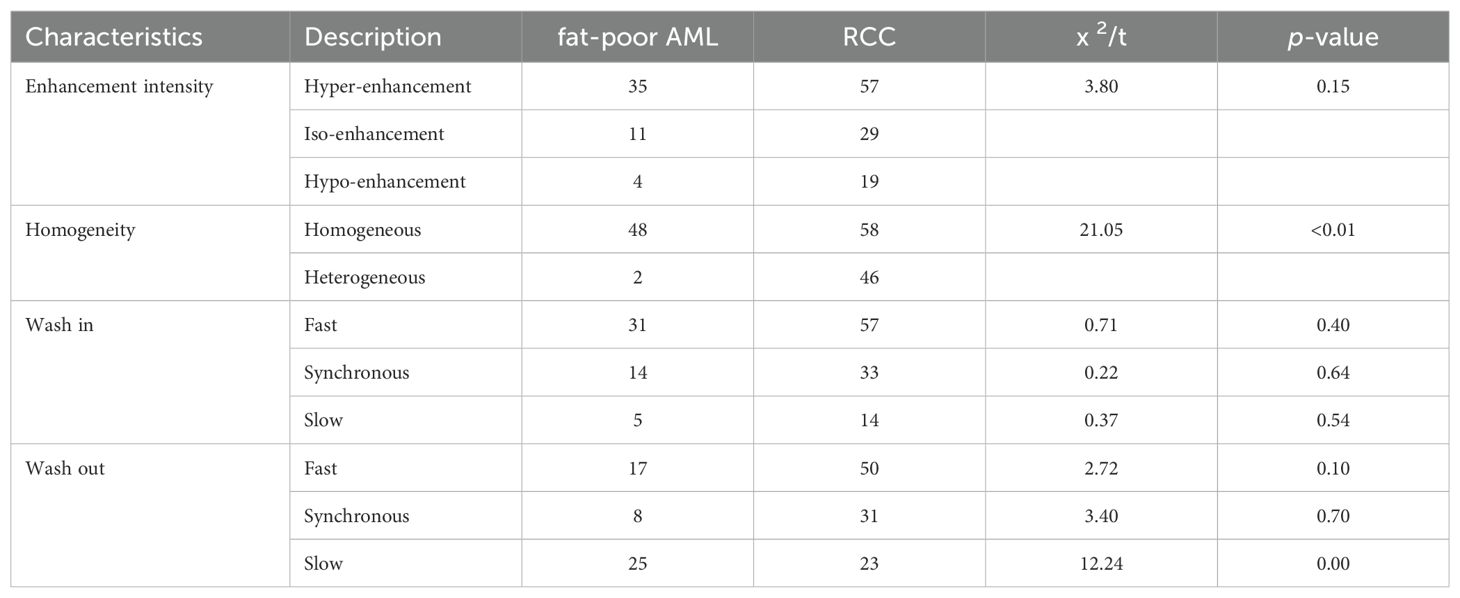
The CEUS characteristics of renal masses are summarized in Table 3. Noteworthy distinctions exist between fat-poor AMLs and RCCs regarding enhancement uniformity and delayed washout, both demonstrating significant differences (both p values < 0.00). However, there were no statistically significant variations observed in peak intensity, rapid inflow, plateau phase, slow inflow, rapid outflow, or plateau phase outflow.
The independent indicators correlated with RCCs
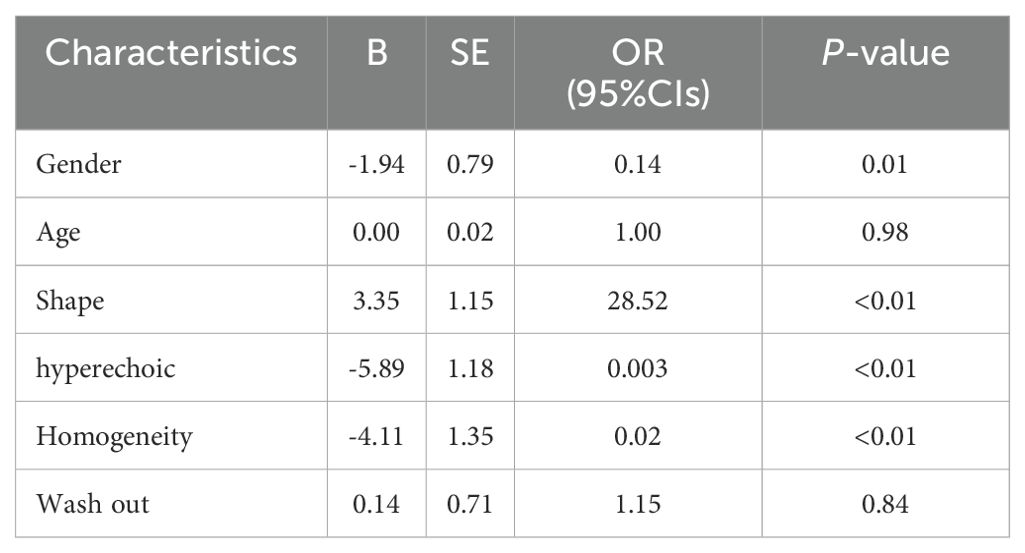
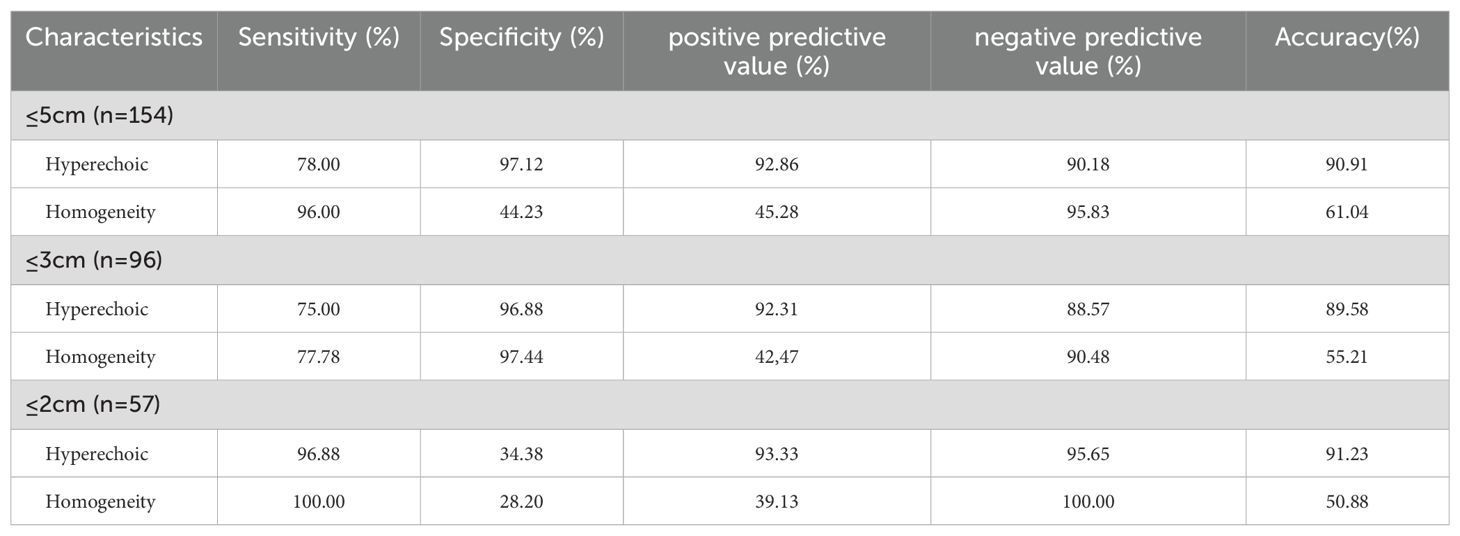
A multifactorial analysis was conducted to discern independent indicators associated with fat-poor AML. The findings indicate that gender, morphology, internal hyperechoic features, and enhancement uniformity are autonomous factors correlated with fat-poor AMLs (Table 4). Notably, internal hyperechoic features, characterized by starry sky and crescent moon signs, along with enhancement uniformity, demonstrated the most robust correlations. The area under the ROC curve for internal hyperechoic features was 0.88 (95% CI: 0.80–0.95), featuring a sensitivity of 78.00%, specificity of 97.12%, positive predictive value of 92.85%, and negative predictive value of 90.18%. Conversely, the ROC curve area for enhancement uniformity was 0.70 (95% CI: 0.62–0.78), with a sensitivity of 96.00%, specificity of 44.23%, positive predictive value of 45.28%, and negative predictive value of 95.83% (Table 5, Figure 3). The diagnostic performance of fat-poor AMLs of varying sizes with respect to hyperechoic and homogeneity is detailed in Table 6.
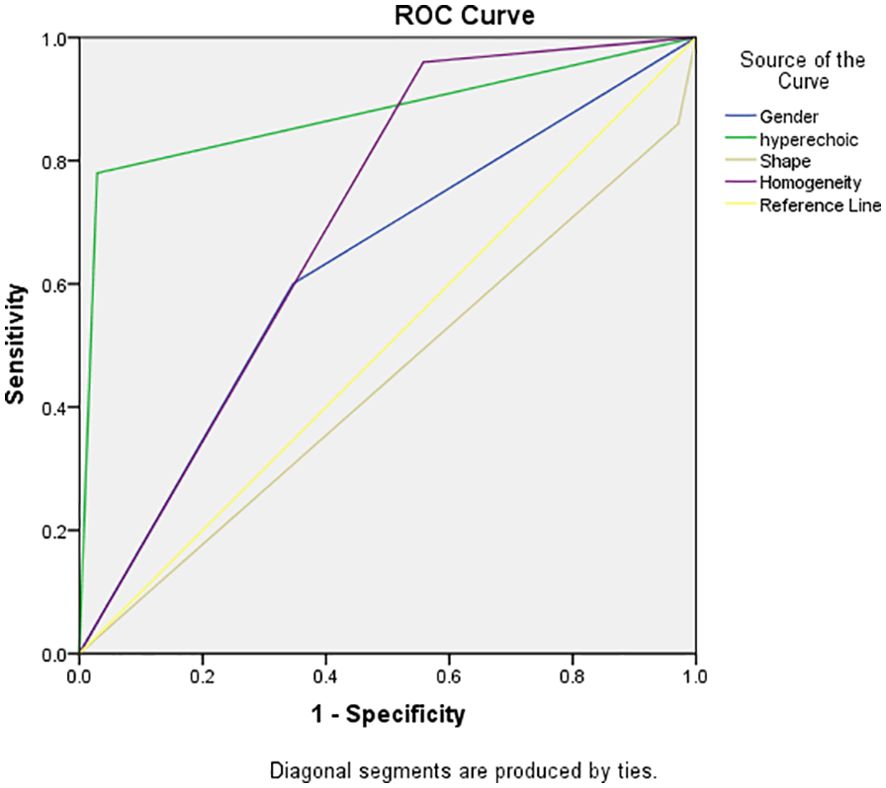
Figure 3. Receiver operating characteristic (ROC) curve demonstrated sensitivities and specificities of significant indicators of fat-poor AML. The areas under the curves were 0.88 and 0.70 for hyperechoic and enhancement uniformity, respectively.
Discussion
Renal AML can be classified into two subtypes based on the proportion of fat within the tumor: fat-poor AML and classic AML (1). The diagnosis of most renal AML relies on the identification of visible fat on CT or MRI (3). Although specific imaging features can be helpful for diagnosing fat-poor AML, such as homogeneous enhancement on contrast-enhanced CT (CECT) (21), and high T1 signal, low T2 signal, and delayed enhancement on MRI (22), their use is limited by concerns about nephrotoxicity, cost, and the need for contrast material administration (23). CEUS combined with CUS has limited application in the differential diagnosis of renal tumors (24–26). We investigated patient demographic characteristics that might aid in distinguishing fat-poor AML from RCC. We found a significantly higher prevalence of female patients with renal AML compared to males (p<0.01). In our study, 60.0% of patients with fat-poor AML were female, whereas only 34.6% of patients with RCC were female, which is consistent with previous reports (27). The mean age in the RCC group was 53.46 ± 15.43 years, compared to 48.54 ± 12.71 years in the fat-poor AML group. This difference in age was statistically significant (p=0.04). The distribution of tumors across the right, left, upper, middle, and lower kidneys did not reveal any statistically significant differences.
Hypoechoic renal masses are often considered malignant on ultrasound. Conversely, hyperechoic and isoechoic masses are typically considered benign (28). However, the distinction in internal echo patterns between fat-poor AML and RCC remains challenging due to the lack of fat in some AMLs, leading to a predominantly hypoechoic appearance on ultrasound. Our study identified the presence of internal hyperechogenicity within hypoechoic renal masses as an independent predictor of fat-poor AML (p=0.00, OR=0.01, AUC=0.88). The sensitivity, specificity, positive predictive value, and negative predictive value were 78.00%, 97.12%, 92.85%, and 90.18%, respectively. When the size is ≤2 cm, the sensitivity for hyperechoicity increases, but the specificity decreases. Importantly, the presence of residual fat within fat-poor AMLs manifests as internal hyperechogenicity on ultrasound, potentially aiding in differentiation from RCC. Fat in well-organized areas appears hypoechoic, while fat within a disorganized mass appears hyperechoic, possibly due to the presence of reflective interfaces. Preoperative ultrasound findings and postoperative pathology confirmed that internal hyperechogenicity within hypoechoic renal masses represented fat tissue. The distribution of this hyperechogenicity also demonstrated a pattern. The predominant cellular components of AML are smooth muscle or vascular perithelial-like cells. Scattered residual fat tissue manifested as a “starry sky” sign on ultrasound (Figure 1), indicating minimal fat content. When compressed to one side, the residual fat can appear as a crescent sign, characterized by localized arc-shaped hyperechogenicity at the tumor margin (Figure 2). Notably, this finding was rarely observed in RCC (3/104, 2.88%), with limited reports in the literature. The renal sinus, rich in fat content, served as a reference for interpreting internal hyperechogenicity within the masses. While RCC typically displays slightly hyperechoic internal features, it may also exhibit linear or granular high-to-strong hyperechogenicity. However, image magnification revealed that linear hyperechogenicity in RCC stemmed from posterior echo enhancement of tiny cysts (Figure 4). Granular hyperechogenicity often presented with a comet tail or acoustic shadow, and these postoperative pathological findings confirmed the presence of calcifications. The frequent occurrence of hemorrhage, necrosis, and cystic degeneration in RCC contributes to these findings (29), highlighting that these hyperechoic areas do not represent fat tissue. In conclusion, the presence of hyperechoic areas within hypoechoic renal masses is a characteristic feature of fat-poor AML, which can significantly improve diagnostic accuracy. Patients exhibiting these features may undergo conservative treatment rather than surgical intervention, thereby avoiding unnecessary surgery and benefiting the patient. However, the presence of hyperechoic areas combined with significant indicators in CUS and CUES does not further enhance the diagnostic efficacy for fat-poor AML.
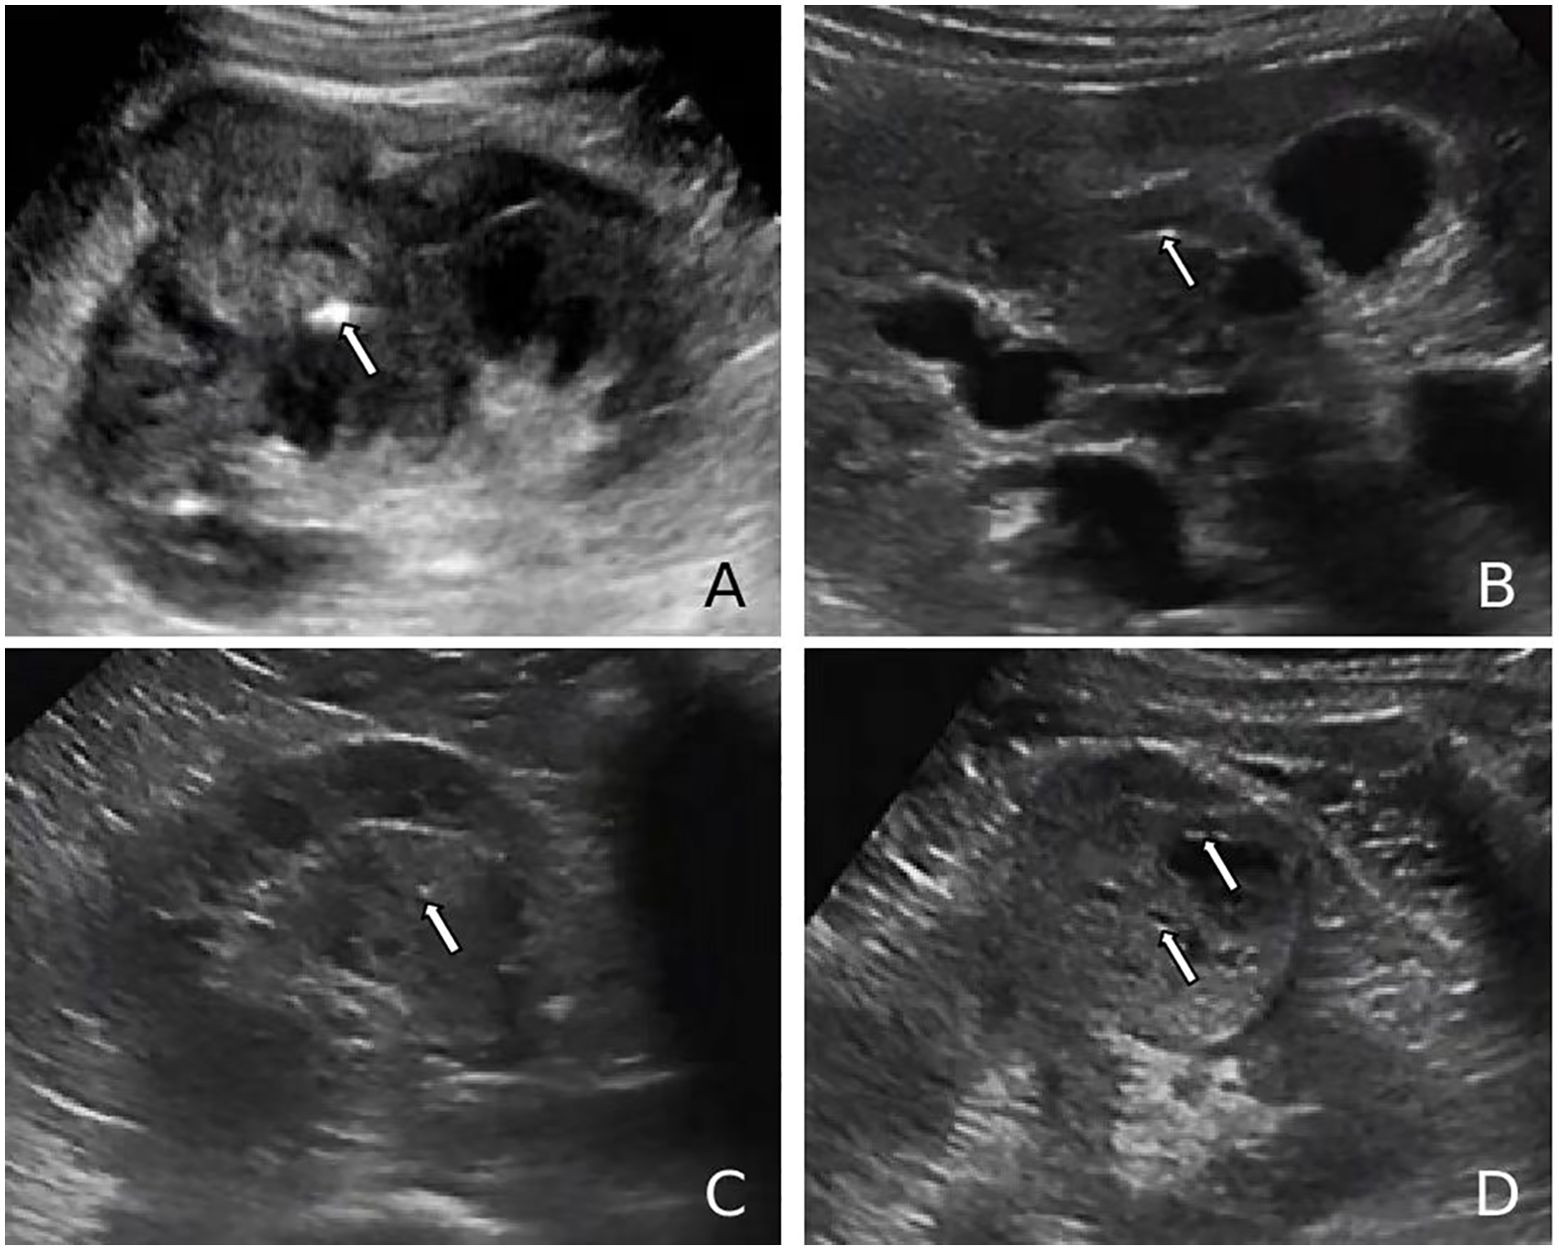
Figure 4. (A, B) Ultrasound images of renal cell carcinoma (RCC) demonstrating a markedly hyperechoic intratumoral lesion (arrows), exceeding the echogenicity of the renal sinus, consistent with a calcification focus. (C, D) Ultrasound images of RCC showing punctate hyperechoic foci within the lesion and anechoic areas peripherally (arrows), suggestive of posterior acoustic enhancement and calcified cyst wall.
Several studies support the utility of CEUS in differentiating between fat-poor AML and RCC (30–34). Our analysis identified uniform enhancement on CEUS as a statistically significant factor for distinguishing these entities in both univariate and multivariate models (p<0.01). Consistent with this, 48 of 50 (96.0%) fat-poor AMLs in our study demonstrated uniform enhancement. This observation likely reflects the slow growth pattern of smaller AMLs, which reduces the likelihood of encountering necrosis, cystic degeneration, or hemorrhage. Hemorrhage, if present, is typically observed in larger AMLs and manifests as spontaneous bleeding (35). Our findings are further corroborated by Hongli Cao et al (28), who reported uniform enhancement in 77.3% (17/22) of AMLs on CEUS, suggesting a higher prevalence of uniform enhancement in AML compared to RCC. Conversely, the rapid growth of RCC tumor cells and their susceptibility to ischemic necrosis contribute to the more frequent occurrence of non-uniform enhancement on CEUS in this malignancy (36)(Figure 5). Our study demonstrated delayed contrast enhancement in half of the fat-poor AML cases. However, multivariate analysis did not identify delayed enhancement as an independent predictor for differentiating AML from RCC. This finding contrasts with the work of Liu et al (37), who reported persistent enhancement in 88.0% (29/33) of AMLs. This discrepancy may be attributed to the composition of the AMLs studied. In their study, 88.0% were classic type, rich in fat content. Conversely, all AMLs in our investigation were devoid of fat. These observations suggest that intra-lesional fat content might influence the pattern of contrast agent washout on CEUS. Further studies are warranted to elucidate this potential association.
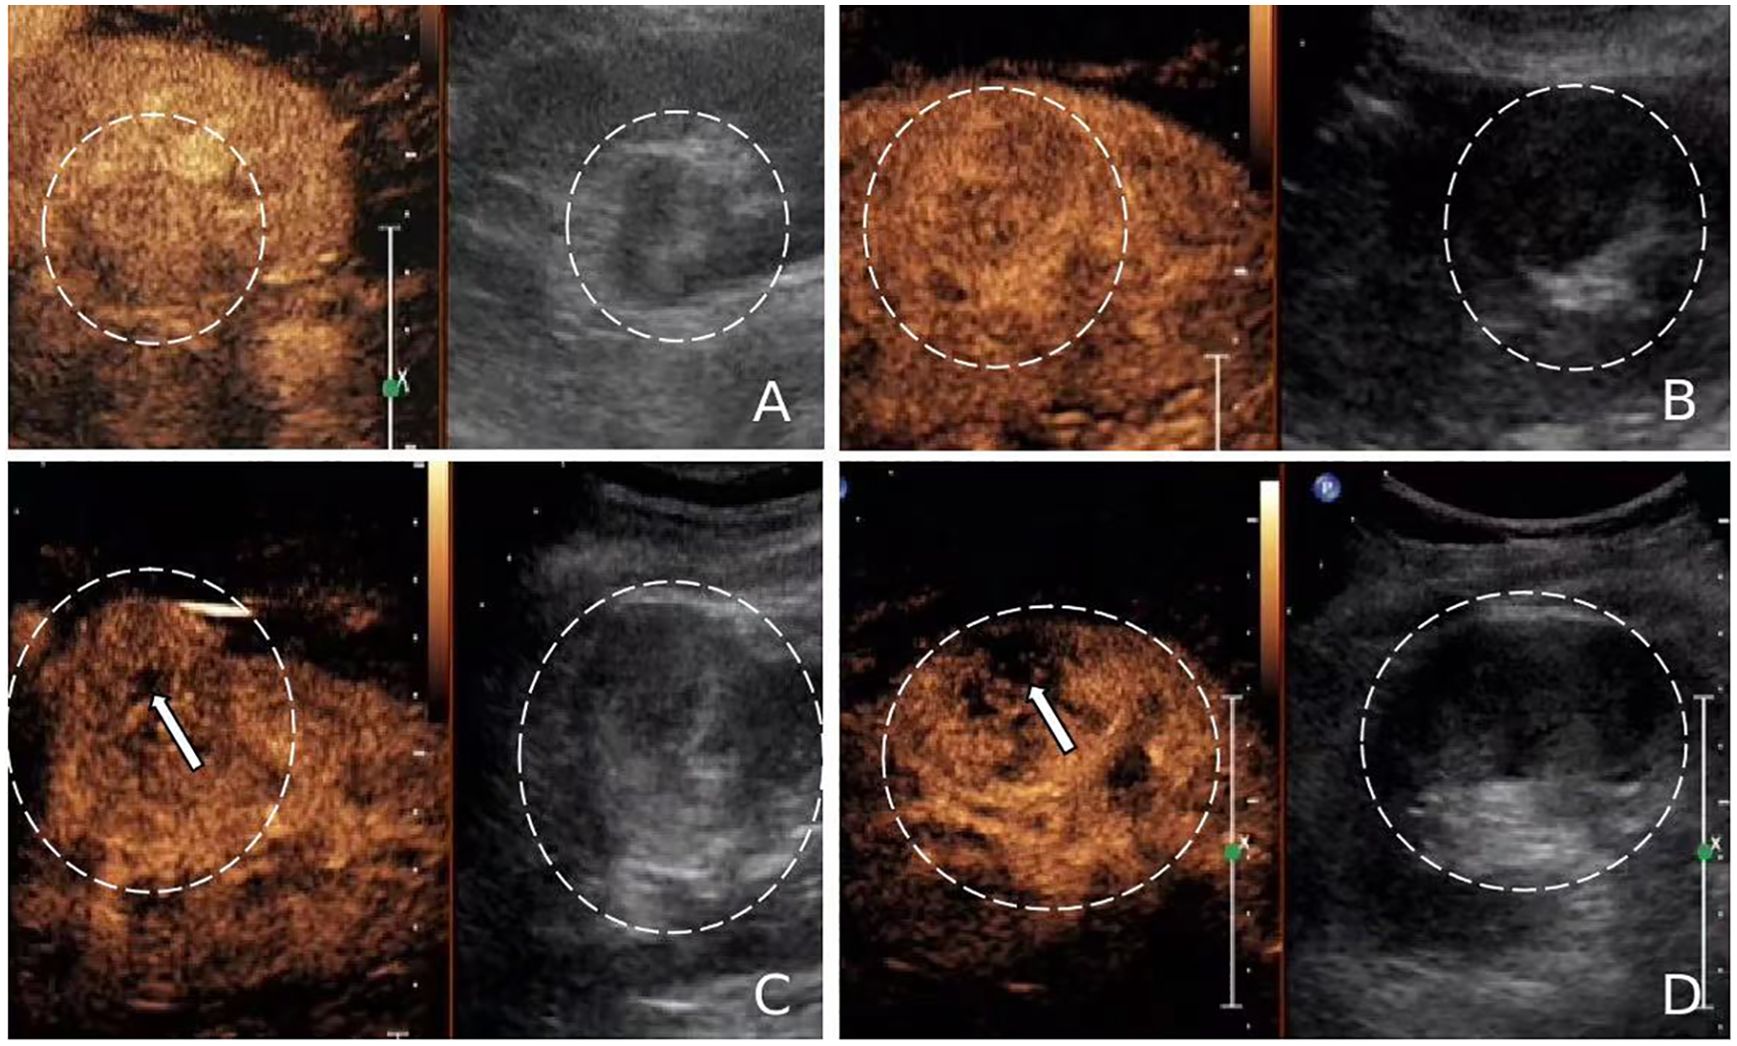
Figure 5. (A, B) Contrast-enhanced ultrasound (CEUS) images of fat-poor angiomyolipoma(AML) (circled) showing uniform enhancement without unenhanced areas. (C, D) CEUS images of renal cell carcinoma (RCC) (circled) exhibiting heterogeneous enhancement with unenhanced areas (arrows).
Our study identified intriguing morphological differences between fat-poor AML and RCC on multivariate analysis (p<0.01). Although the area under the receiver operating characteristic curve (AUC) was low (0.44), shape emerged as an independent predictor in the model. Fat-poor AMLs frequently exhibited irregular morphology, with a predominance of mushroom-like shapes, particularly in lesions near the renal capsule. This finding aligns with the morphology of classic AMLs (38). The absence of a restraining capsule in fat-poor AMLs likely allows for expansive growth patterns. When subjected to uneven mechanical forces, these lesions are more prone to adopting irregular shapes. Conversely, RCC, being a malignant tumor, exhibits expansive growth with the formation of a pseudocapsule that interacts with surrounding renal parenchyma, resulting in a more regular morphology (39). Several studies have described unique radiological features of fat-poor AML, including the corner interface sign, ice cream cone sign, and spilled beer sign (40). Marshall Strother et al (41), further identified the spilled beer sign (OBS) as a potential marker for improved diagnostic sensitivity of hypoechoic AML.
Our study has several limitations: First, this is a single-center retrospective study, and the number of pathological specimens obtained from fat-poor AMLs is limited. A study by Fank et al (42). showed that the frequency of benign tumors among resected renal tumors ≤5 cm is 9.9%, and the incidence of hypoechoic types in RCC is relatively low. To address this, we collected data over a 10-year span, during which ultrasound techniques and imaging have evolved. These factors may introduce biases, necessitating multicenter, large-scale prospective studies to validate our findings. Second, our analysis was limited to fat-poor AMLs and RCCs, without considering their subtypes, other benign tumors, or other malignant tumors; future studies could include a broader range of lesions. Third, the assessment of hyperechoic areas within tumors was based on subjective human judgment, which is prone to error. Combining this with CEUS might aid in diagnosis, as hyperechoic areas in fat-poor AML show uniform enhancement, while calcifications and post-cystic echo enhancement exhibit non-uniform enhancement under CEUS. The use of artificial intelligence for image analysis could provide more objective and accurate results. Fourth, the cases we selected were based solely on ultrasound findings, without incorporating imaging diagnostic criteria from CT or MRI, which introduces significant subjectivity. This can be addressed in future studies by incorporating stricter imaging diagnostic criteria, or by establishing a multidisciplinary evaluation team to minimize subjective factors in surgical decision-making, thereby reducing unnecessary resections of benign tumors.
Overall, we hope to conduct long-term follow-up multicenter prospective studies in the future, incorporating a broader range of tumor types and imaging modalities, to further validate the diagnostic performance of CUS and CEUS in fat-poor AMLs, thereby reducing the resection rates of benign tumors.
Conclusion
Our study suggests that intralesional hyperechogenicity, manifested as starry sky or crescent moon signs on ultrasound, and uniform contrast enhancement may function as independent predictors of fat-poor AML. This imaging signature could potentially aid in differentiating fat-poor AML from RCC, particularly in lesions less than 5 cm. This distinction might facilitate more targeted clinical management strategies, potentially reducing unnecessary surgical interventions.
Data availability statement
The datasets presented in this study can be found in online repositories. The names of the repository/repositories and accession number(s) can be found in the article/supplementary material.
Author contributions
XL: Conceptualization, Data curation, Formal Analysis, Funding acquisition, Investigation, Methodology, Project administration, Resources, Software, Supervision, Validation, Visualization, Writing – original draft, Writing – review & editing. X-TZ: Conceptualization, Data curation, Formal Analysis, Funding acquisition, Investigation, Methodology, Project administration, Resources, Software, Supervision, Validation, Visualization, Writing – original draft, Writing – review & editing. Z-LH: Conceptualization, Data curation, Formal Analysis, Funding acquisition, Investigation, Methodology, Project administration, Resources, Software, Supervision, Validation, Visualization, Writing – original draft, Writing – review & editing. M-JS: Data curation, Writing – original draft, Writing – review & editing. J-CY: Writing – original draft, Writing – review & editing. S-SW: Conceptualization, Data curation, Formal Analysis, Funding acquisition, Investigation, Methodology, Project administration, Resources, Software, Supervision, Validation, Visualization, Writing – original draft, Writing – review & editing.
Funding
The author(s) declare that financial support was received for the research, authorship, and/or publication of this article. Fujian Science and Technology Innovation Joint Fund project climbing project (2023Y9332).
Acknowledgments
The authors are thankful to Fujian Provincial Hospital and Fujian Medical University for their management of our patient database. The authors are thankful to S-SW for helping critically revise the manuscript for important intellectual content and helping collect data and design the study.
Conflict of interest
The authors declare that the research was conducted in the absence of any commercial or financial relationships that could be construed as a potential conflict of interest.
Publisher’s note
All claims expressed in this article are solely those of the authors and do not necessarily represent those of their affiliated organizations, or those of the publisher, the editors and the reviewers. Any product that may be evaluated in this article, or claim that may be made by its manufacturer, is not guaranteed or endorsed by the publisher.
References
1. Hartman DS, Goldman SM, Friedman AC, Davis CJ Jr, Madewell JE, Sherman JL. Angiomyolipoma: ultrasonic-pathologic correlation. Radiology. (1981) 139(2):451–8. doi: 10.1148/radiology.139.2.7220890
2. Esheba GS, Esheba NS. Angiomyolipoma of the kidney: Clinicopathological and immunohistochemical study. J Egypt Natl Canc Inst. (2013) 25(3):125–34. doi: 10.1016/j.jnci.2013.05.002
3. Qing Lu MD, Huang B-j, Wen-ping W. Qualitative and quantitative analysis with contrast Enhanced ultrasonography: diagnosis value in hypoechoic renal angiomyolipoma. Korean J Radiol. (2015) 16(2):334–41. doi: 10.3348/kjr.2015.16.2.334
4. Pandolfo SD, Wu Z, Campi R, Bertolo R, Amparore D, Mari A, et al. Outcomes and techniques of robotic-assisted partial nephrectomy (RAPN) for renal hilar masses: A comprehensive systematic review. Cancers. (2024) 16:693. doi: 10.3390/cancers16040693
5. Aveta A, Iossa V, Spena G, Conforti P, Pagano G, Dinacci F, et al. Ablative treatments for small renal masses and management of ecurrences: A comprehensive review. Life. (2024) 14:450. doi: 10.3390/life14040450
6. Aydin H, Magi-Galluzzi C, Lane BR, Sercia L, Lopez JI, Rini BI, et al. Renal angiomyolipoma: clinicopathologic study of 194 cases with emphasis on the epithelioid histology and tuberous sclerosis association. Am J Surg Pathol. (2009) 33:289–97. doi: 10.1097/PAS.0b013e31817ed7a6
7. Serrano Frago P, Del Agua Arias Camisón C, Gil Sanz MJ, Allué López M, Gonzalvo Ibarra A, Plaza Mas L, et al. Controversies related to epithelioid variant of renal angiomyolipoma: a review of the literature. Urology. (2006) 67:846.e3–5. doi: 10.1016/j.urology.2005.10.030
8. Yamashita Y, Honda S, Nishiharu T, Urata J, Takahashi M. Detection of pseudocapsule of renal cell carcinoma with MR imaging and CT. AJR Am J Roentgenol. (1996) 166(5):1151–5. doi: 10.2214/ajr.166.5.8615260
9. Markić D, Krpina K, Ahel J, Španjol J, Gršković A, Štifter S, et al. Different presentations of renal cell cancer on ultrasound and computerized tomography. Urologia. (2014) 81(4):228–32. doi: 10.5301/uro.5000085
10. Jeon HG, Lee SR, Kim KH, Oh YT, Cho NH, Rha KH, et al. Benign lesions after partial nephrectomy for presumed renal cell carcinoma in masses 4 cm or less: prevalence and predictors in Korean patients. Urology. (2010) 76:574–9. doi: 10.1016/j.urology.2009.11.082
11. Woo S, Cho JY. Imaging findings of common benign renal tumors in the era of small renal masses: differential diagnosis from small renal cell carcinoma: current status and future perspectives. Korean J Radiol. (2015) 16:99–113. doi: 10.3348/kjr.2015.16.1.99
12. Catalano OA, Samir AE, Sahani DV, Hahn PF. Pixel distribution analysis: can it be used to distinguish clear cell carcinomas from angiomyolipomas with minimal fat? Radiology. (2008) 247:738–46. doi: 10.1148/radiol.2473070785
13. Halpenny D, Snow A, McNeill G, Torreggiani WC. The radiological diagnosis and treatment of renal angiomyolipomacurrent status. Clin Radiol. (2010) 65:99–108. doi: 10.1016/j.crad.2009.09.014
14. Jinzaki M, Silverman SG, Akita H, Nagashima Y, Mikami S, Oya M. Renal angiomyolipoma: a radiological classification and update on recent developments in diagnosis and management. Abdom Imaging. (2014) 39:588. doi: 10.1007/s00261-014-0083-3
15. Siegel CL, Middleton WD, Teefey SA, McClennan BL. Angiomyolipoma and renal cell carcinoma: US differentiation. Radiology. (1996) 198:789–93. doi: 10.1148/radiology.198.3.8628873
16. Jinzaki M, Tanimoto A, Narimatsu Y, Ohkuma K, Kurata T, Shinmoto H, et al. Angiomyolipoma: imaging findings in lesions with minimal fat. J Urol. (1998) 159(4):1402–2. doi: 10.1016/S0022-5347(01)63635-8
17. Hindman N, Ngo L, Genega EM, Melamed J, Wei J, Braza JM, et al. Angiomyolipoma with minimal fat: can it be differentiated from clear cell renal cell carcinoma by using standard MR techniques? Radiology. (2012) 265(2):468–77. doi: 10.1148/radiol.12112087
18. Ljungberg B, Bensalah K, Canfield S, Dabestani S, Hofmann F, Hora M, et al. EAU guidelines on renal cell carcinoma: 2014 update. Eur Urol. (2015) 67(5):913–24. doi: 10.1016/j.eururo.2015.01.005
19. Park BK. Renal angiomyolipoma based on new classification: how to differentiate it from renal cell carcinoma. Am J Roentgenol. (2019) 212:582–8. doi: 10.2214/AJR.18.20408
20. Marconi L, Dabestani S, Lam TB, Proud K, Rubinas T, Picken M, et al. Systematic review and metaanalysis of diagnostic accuracy of percutaneous renal tumour biopsy. Eur Urol. (2016) 69:660–73. doi: 10.1016/j.eururo.2015.07.072
21. Milner J, McNeil B, Alioto J, Proud K, Rubinas T, Picken M, et al. Fat poor renal angiomyolipoma: patient, computerized tomography and histological findings. J Urol. (2006) 176:905–9. doi: 10.1016/j.juro.2006.04.016
22. Sasiwimonphan K, Takahashi N, Leibovich BC, Carter RE, Atwell TD, Kawashima A. Small (< 4 cm) renal mass: differentiation of angiomyolipoma without visible fat from renal cell carcinoma utilizing MR imaging. Radiology. (2012) 263:160–8. doi: 10.1148/radiol.12111205
23. Chen L, Wang L, Diao X, Qian W, Fang L, Pang Y, et al. The diagnostic value of contrast-enhanced ultrasound in differentiating small renal carcinoma and angiomyolipoma. Biosci Trends. (2015) 9(4):252–8. doi: 10.5582/bst.2015.01080
24. Pysz MA, Guracar I, Foygel K, Tian L, Willmann JK. Quantitative assessment of tumor angiogenesis using realtime motion-compensated contrast-enhanced ultrasound imaging. Angiogenesis. (2012) 15:433–42. doi: 10.1007/s10456-012-9271-3
25. Goertz RS, Bernatik T, Strobel D, Hahn EG, Haendl T. Softwarebased quantification of contrast-enhanced ultrasound in focal liver lesions–a feasibility study. Eur J Radiol. (2010) 75:e22–6. doi: 10.1016/j.ejrad.2009.11.004
26. Aoki S, Hattori R, Yamamoto T, Funahashi Y, Matsukawa Y, Gotoh M, et al. Contrast-enhanced ultrasound using a timeintensity curve for the diagnosis of renal cell carcinoma. BJU Int. (2011) 108:349–54. doi: 10.1111/j.1464-410X.2010.09799.x
27. Lim RS, McInnes MDF, Siddaiah M, Flood TA, Lavallee LT, Schieda N. Are growth patterns on MRI in small (<4 cm) solid renal masses useful for predicting benign histology? Eur Radiol. (2018) 28:3115–24. doi: 10.1007/s00330-018-5324-3
28. Cao H, Fang L, Chen L, Zhan J, Diao X, Liu Y, et al. The independent indicators for differentiating renal cell carcinoma from renal angiomyolipoma by contrastenhanced ultrasound. BMC Med Imaging. (2020) 20:32. doi: 10.1186/s12880-020-00436-9
29. Jh R. Renal cell carcinoma. Curr Opin Oncol. (1992) 4(3):427–34. doi: 10.1097/00001622-199206000-00002
30. Xu ZF, Xu HX, Xie XY, Liu GJ, Zheng YL, Lu MD. Renal cell carcinoma and renal angiomyolipoma: differential diagnosis with real-time contrast-enhanced ultrasonography, J. Ultrasound Med. (2010) 29(5):709–17. doi: 10.7863/jum.2010.29.5.709
31. Ascenti G, Mazziotti S, Zimbaro G, Settineri N, Magno C, Melloni D, et al. Complex cystic renal masses: characterization with contrast-enhanced US. Radiology. (2007) 243(1):158–65. doi: 10.1148/radiol.2431051924
32. Klezl P, Kaspar M, Klecka J, Richterova R, Stanc O, Burgetova A, et al. The role of contrast-enhanced pulse inversion harmonic imaging (CEUS) and contrast-enhanced computed tomography (CECT) in the preoperative diagnosis of renal lesions. Urologe A. (2018) 57(2):181–90. doi: 10.1007/s00120-018-0572-z
33. Ziegelmüller BK, Spek A, Szabados B, Casuscelli J, Clevert DA, Staehler M. Epidemiology and diagnostic assessment of small renal masses. Urologe A. (2018) 57(3):274–9. doi: 10.1007/s00120-018-0585-7
34. Gummadi S, Eisenbrey JR, Lyshchik A. Contrast-enhanced ultrasonography in interventional oncology. Abdom Radiol (NY). (2018) 43:3166–75. doi: 10.1007/s00261-018-1581-5
35. King KG, Gulati M, Malhi H, Hwang D, Gill IS, Cheng PM, et al. Quantitative assessment of solid renal masses by contrast-enhanced ultrasound with time-intensity curves: how we do it. Abdom Imaging. (2015) 40(7):2461–71. doi: 10.1007/s00261-015-0468-y
36. Fan L, Lianfang D, Jinfang X, Yijin S, Ying W. Diagnostic efficacy of contrast-enhanced ultrasonography in solid renal parenchymal lesions with maximum diameters of 5 cm, J. Ultrasound Med. (2008) 27(6):875–85. doi: 10.7863/jum.2008.27.6.875
37. Liu H, Cao H, Chen L, Fang L, Liu Y, Zhan J, et al. The quantitative evaluation of contrast-enhanced ultrasound in the differentiation of small renal cell carcinoma subtypes and angiomyolipoma. Quant Imaging Med Surg. (2022) 12(1):106–18. doi: 10.21037/qims-21-248
38. Anthony F, Chen JP, McGahan MD. Are there ultrasound features to distinguish small (<3 cm) peripheral renal angiomyolipomas from renal cell carcinomas? J Ultrasound Med. (2023) 9999:1–12. doi: 10.1002/jum.16229
39. Azhar RA, De Castro Abreu AL, Broxham E, Broxham E, Sherrod A, Ma Y, Cai J, et al. Histological analysis of the kidney tumor-parenchyma interface. J Urol. (2015) 193:415–22. doi: 10.1016/j.juro.2014.08.010
40. Verma SK, Mitchell DG, Yang R, Roth CG, O’Kane P, Verma M, et al. Exophytic renal masses: angular interface with renal parenchyma for distinguishing benign from Malignant lesions at MR imaging. Radiology. (2010) 255:501–7. doi: 10.1148/radiol.09091109
41. Strother M, Uzzo RN, Handorf E. Distinguishing lipid-poor angiomyolipoma from renal carcinoma using tumor shape. Urologic Oncol: Semin Original Investigations. (2023) 41:208.e9–208.e14. doi: 10.1016/j.urolonc.2023.01.008
Keywords: fat-poor angiomyolipoma, renal cell carcinoma, contrast-enhanced ultrasound, conventional ultrasound, starry-sky sign
Citation: Liang X, Zeng X-T, Hong Z-L, Su M-J, Yang J-C and Wu S-S (2024) Determinants of conventional and contrast-enhanced ultrasound diagnosis of fat-poor angiomyolipoma <5 cm. Front. Oncol. 14:1446801. doi: 10.3389/fonc.2024.1446801
Received: 10 June 2024; Accepted: 14 November 2024;
Published: 13 December 2024.
Edited by:
Savio Domenico Pandolfo, Federico II University Hospital, ItalyReviewed by:
Achille Aveta, University of Naples Federico II, ItalySimone Cilio, Ospedali Riuniti San Giovanni di Dio e Ruggi d’Aragona, Italy
Roberto Contieri, Humanitas University, Italy
Masahiro Jinzaki, Keio University, Japan
Copyright © 2024 Liang, Zeng, Hong, Su, Yang and Wu. This is an open-access article distributed under the terms of the Creative Commons Attribution License (CC BY). The use, distribution or reproduction in other forums is permitted, provided the original author(s) and the copyright owner(s) are credited and that the original publication in this journal is cited, in accordance with accepted academic practice. No use, distribution or reproduction is permitted which does not comply with these terms.
*Correspondence: Song-Song Wu, d3Vfc29uZ3NvbmdAMTI2LmNvbQ==
†These authors have contributed equally to this work and share first authorship
 Xia Liang1,2,3†
 Song-Song Wu

