 Xin Jiang
 Ruilong Zhou3†
 Fengle Jiang
 Jianmin Wang
94% of researchers rate our articles as excellent or good
Learn more about the work of our research integrity team to safeguard the quality of each article we publish.
Find out more
ORIGINAL RESEARCH article
Front. Oncol., 15 May 2024
Sec. Gastrointestinal Cancers: Hepato Pancreatic Biliary Cancers
Volume 14 - 2024 | https://doi.org/10.3389/fonc.2024.1401496
This article is part of the Research TopicLiver Cancer Awareness Month 2023: Current Progress and Future Prospects on Advances in Primary Liver Cancer Investigation and TreatmentView all 21 articles
Liver cancer is one of the most prevalent forms of cancer worldwide. A significant proportion of patients with hepatocellular carcinoma (HCC) are diagnosed at advanced stages, leading to unfavorable treatment outcomes. Generally, the development of HCC occurs in distinct stages. However, the diagnostic and intervention markers for each stage remain unclear. Therefore, there is an urgent need to explore precise grading methods for HCC. Machine learning has emerged as an effective technique for studying precise tumor diagnosis. In this research, we employed random forest and LightGBM machine learning algorithms for the first time to construct diagnostic models for HCC at various stages of progression. We categorized 118 samples from GSE114564 into three groups: normal liver, precancerous lesion (including chronic hepatitis, liver cirrhosis, dysplastic nodule), and HCC (including early stage HCC and advanced HCC). The LightGBM model exhibited outstanding performance (accuracy = 0.96, precision = 0.96, recall = 0.96, F1-score = 0.95). Similarly, the random forest model also demonstrated good performance (accuracy = 0.83, precision = 0.83, recall = 0.83, F1-score = 0.83). When the progression of HCC was categorized into the most refined six stages: normal liver, chronic hepatitis, liver cirrhosis, dysplastic nodule, early stage HCC, and advanced HCC, the diagnostic model still exhibited high efficacy. Among them, the LightGBM model exhibited good performance (accuracy = 0.71, precision = 0.71, recall = 0.71, F1-score = 0.72). Also, performance of the LightGBM model was superior to that of the random forest model. Overall, we have constructed a diagnostic model for the progression of HCC and identified potential diagnostic characteristic gene for the progression of HCC.
According to the recent data on global cancer burden in 2020, liver cancer ranked as the sixth most common cancer in terms of incidence rate and the third highest in terms of mortality (1). A considerable percentage of patients diagnosed with hepatocellular carcinoma (HCC) are at an advanced stage. Therefore, the identification of diagnostic markers is of immense importance (2–4). The development of HCC is a gradual process. Patients with chronic liver disease experience persistent liver inflammation, fibrosis, and abnormal regeneration of liver cells. These abnormalities can lead to cirrhosis and gradually give rise to dysplastic nodules of precancerous lesions. Finally, the patients will develop HCC (5). However, the marker gene for HCC progression remain unclear.
Thus, there is an urgent need to identify markers and develop precise diagnostic model for progression of HCC. With the development of artificial intelligence, machine learning has shown promise in cancer diagnosis and treatment (6, 7). For example, Zhang (8) developed a machine learning-based model for the early detection of liver cancer by utilizing low-depth whole genome sequencing of cell-free DNA. The model achieved an AUC of 0.995, a sensitivity of 0.968, and a specificity of 0.988 in differentiating between liver cancer and non-liver cancer. According to feature selection, Tang (9) used Least Absolute Shrinkage and Selector Operation (Lasso), Support Vector Machine (SVM), and Random Forest (RF) to construct HCC classification models for HCC saliva samples. The diagnostic accuracy of the LASSO-HCC model was 0.706, the diagnostic accuracy of the SVM-HCC model was 0.812, and the diagnostic accuracy of the RF-HCC model was 0.859.
However, these studies exclusively focused on particular stages in the progression of HCC. In this research, we aim to develop an accurate diagnostic model for the progression of HCC by utilizing machine learning algorithms, such as RF and LightGBM. The RF and LightGBM models are two commonly used machine learning algorithms known for their strong performance and effectiveness in dealing with classification and regression problems.
RF is an ensemble learning algorithm that enhances prediction accuracy by constructing multiple decision trees and taking the average of the predictions from these trees. RF can reduce overfitting, is tolerant to missing values, and can assess the importance of each feature, aiding in data comprehension (10, 11). LightGBM is a distributed and high-performance algorithm designed for gradient-boosting decision trees, specifically based on the Histogram algorithm, characterized by efficiency, speed, and high accuracy. Principle of LightGBM is to iteratively train multiple decision trees and train the next tree based on the results of the previous tree to minimize the loss function (12, 13). Combining the RF and LightGBM models can yield more comprehensive and accurate results in research. These two algorithms have outstanding performance in cancer diagnostics (14).
In this research, we classified 118 samples from GSE114564 into three groups: normal liver, precancerous lesion, and HCC. The RF model and LightGBM model showed strong performance and identified 12 characteristic genes. Additionally, the diagnostic model still exhibited high efficacy when categorizing the progression of HCC into six finely stratified stages. To the best of our knowledge, this research represented the first application of machine learning to comprehensively cover all stages of HCC progression.
This research employed the RNA-sequencing dataset GSE114564 (15), retrieved from the GEO database, which included transcriptome data from 118 tissue samples representing different stages of HCC. The dataset included 15 normal liver samples, 20 chronic hepatitis samples, 10 liver cirrhosis samples, 10 dysplastic nodule samples, 18 early stage HCC samples, and 45 advanced HCC samples. This comprehensive dataset covers almost all stages for progression of HCC.
We obtained the file “GSE114564_Liver_Cancer_FPKM.txt.gz” from the GEO database (https://www.ncbi.nlm.nih.gov/geo/query/acc.cgi?acc=GSE114564). FPKM (fragments per kilobase of exon model per million mapped fragments) of 118 samples were used as the input file, which can effectively eliminate the impact of sequencing depth and gene length on the results. Following that, we conducted an 8:2 random split (16–18) to partition the 118 available samples into training and validation sets. The 8:2 ratio is commonly regarded as a reasonable choice, because it ensures an adequate sample size for the training set, while also providing a certain number of samples for the validation set to evaluate model performance. Next, we kept genes that are expressed (FPKM>0) in at least three samples and these genes are in scanpy (19) (scanpy.pp.filter_genes). Then, the data matrix is log-transformed (scanpy.pp.log1p). In the end, we selected the top 1000 genes (20–22) by the ranking variances of all samples (scanpy.pp.highly_variable_genes), which was performed variance calculation in Scanpy. More specifically, a normalized variance for each gene is computed. First, the data are standardized (i.e., z-score normalization per feature) with a regularized standard deviation. Next, the normalized variance is computed as the variance of each gene after the transformation. Genes are ranked by the normalized variance. Finally, we selected the top 1,000 genes (Supplementary Table S1) that demonstrated the highest overall variance in FPKM as the foundation for constructing RF and LightGBM models. The variance calculation and above data processing steps were all implemented in scanpy.
Subsequently, we employed the Python framework sklearn (23) to construct the RF model using the RF program (sklearn.ensemble.RandomForestClassifier) and LightGBM program (Lightgbm.sklearn), with all parameters set to default values. The framework sklearn available online is: https://scikit-learn.org/stable/supervised_learning.html. Cross-validation was used in this study to find the optimal parameters of the classification model and help the model alleviate overfitting. This study uses fivefold cross-validation on the training dataset, and uses accuracy, precision, recall, and F1-score to evaluate the model performance, and the results are in Supplementary Table S2.
The RF and LightGBM models calculated the gene importance and identified the top 50 most important genes (24), separately (Supplementary Table S3). Furthermore, the intersection of these 50 genes was taken to obtain the feature genes. Upon constructing the aforementioned model, we obtained a set of characteristic genes. Following that, we generated expression heatmap using TBtools HeatMap illustrator program. TBtools is an integrative toolkit developed for interactive analyses of big biological data (25, 26). Survival analysis was performed using the GEPIA2 database, and GO pathway enrichment was performed using clusterProfiler R package (27, 28). Finally, we used the GeneCards database (29) to identify characteristic genes associated with occurrence of HCC (https://www.genecards.org/). The workflow diagram for this research was depicted in Figure 1.
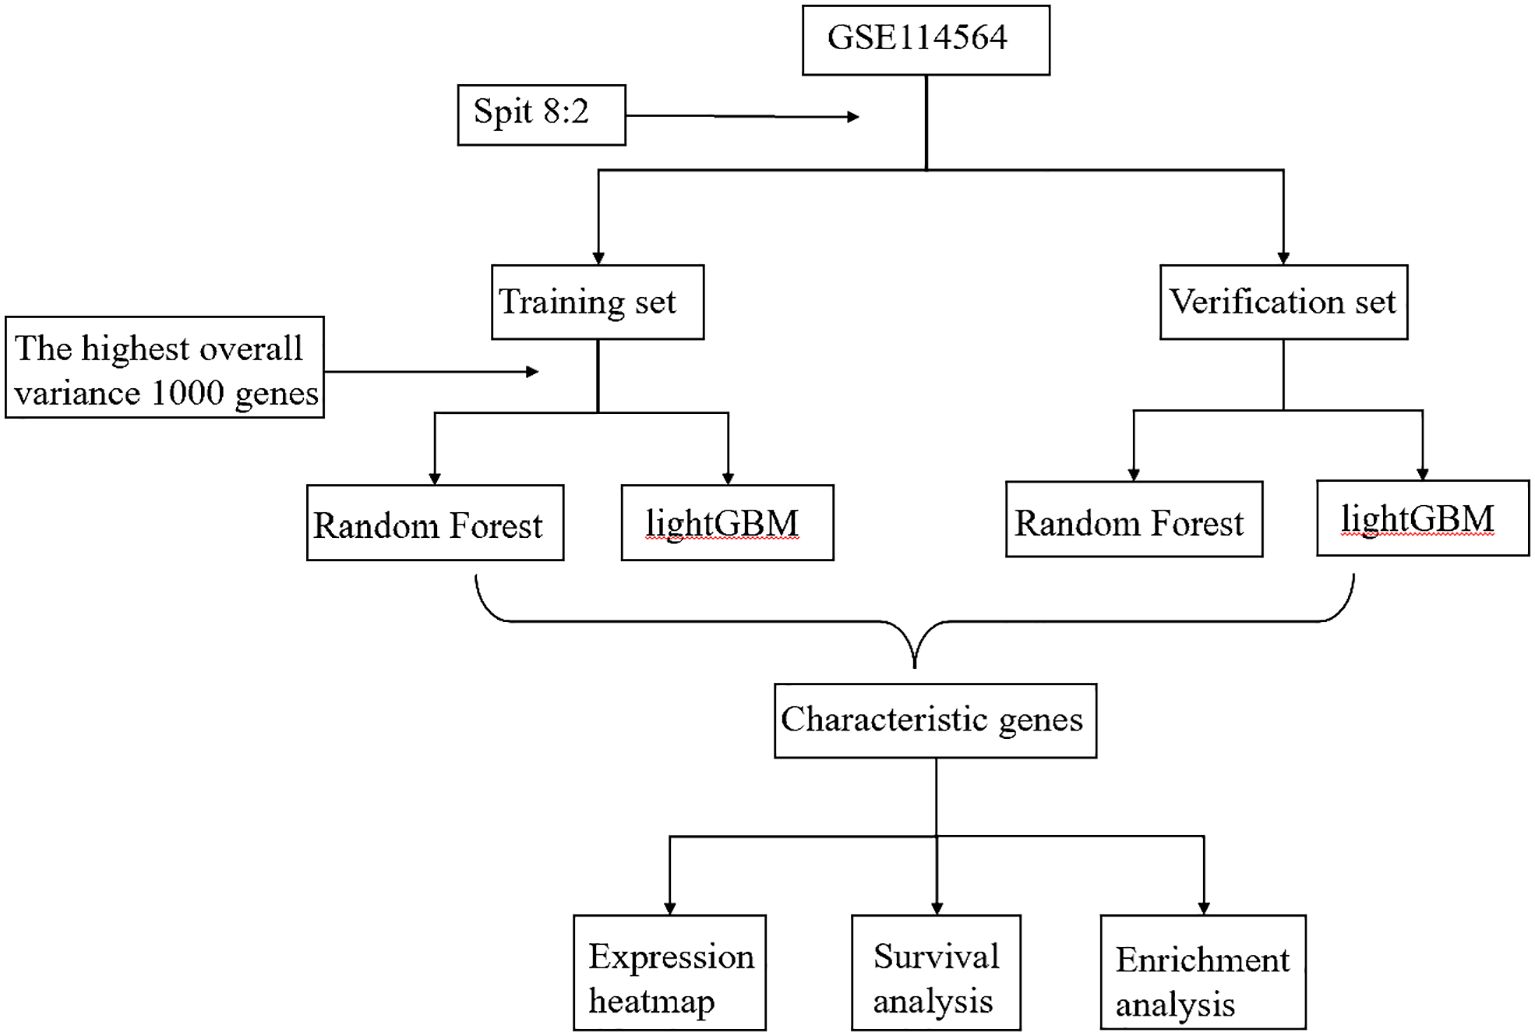
Figure 1 Workflow diagram in this research.
Based on the transformative process of HCC, the data can be categorized into three groups: normal liver, precancerous lesion (including chronic hepatitis, liver cirrhosis, dysplastic nodule), and HCC (including early stage HCC and advanced HCC). We employed the RF and LightGBM algorithms of machine learning to develop a diagnostic model for the progression of HCC. Performance measure of the RF model was presented in Figure 2 and Table 1, indicating an accuracy of 0.83, precision of 0.83, recall of 0.83, and F1-score of 0.83. Similarly, performance measure of the LightGBM model indicated an accuracy of 0.96, precision of 0.96, recall of 0.96, and F1-score of 0.95.
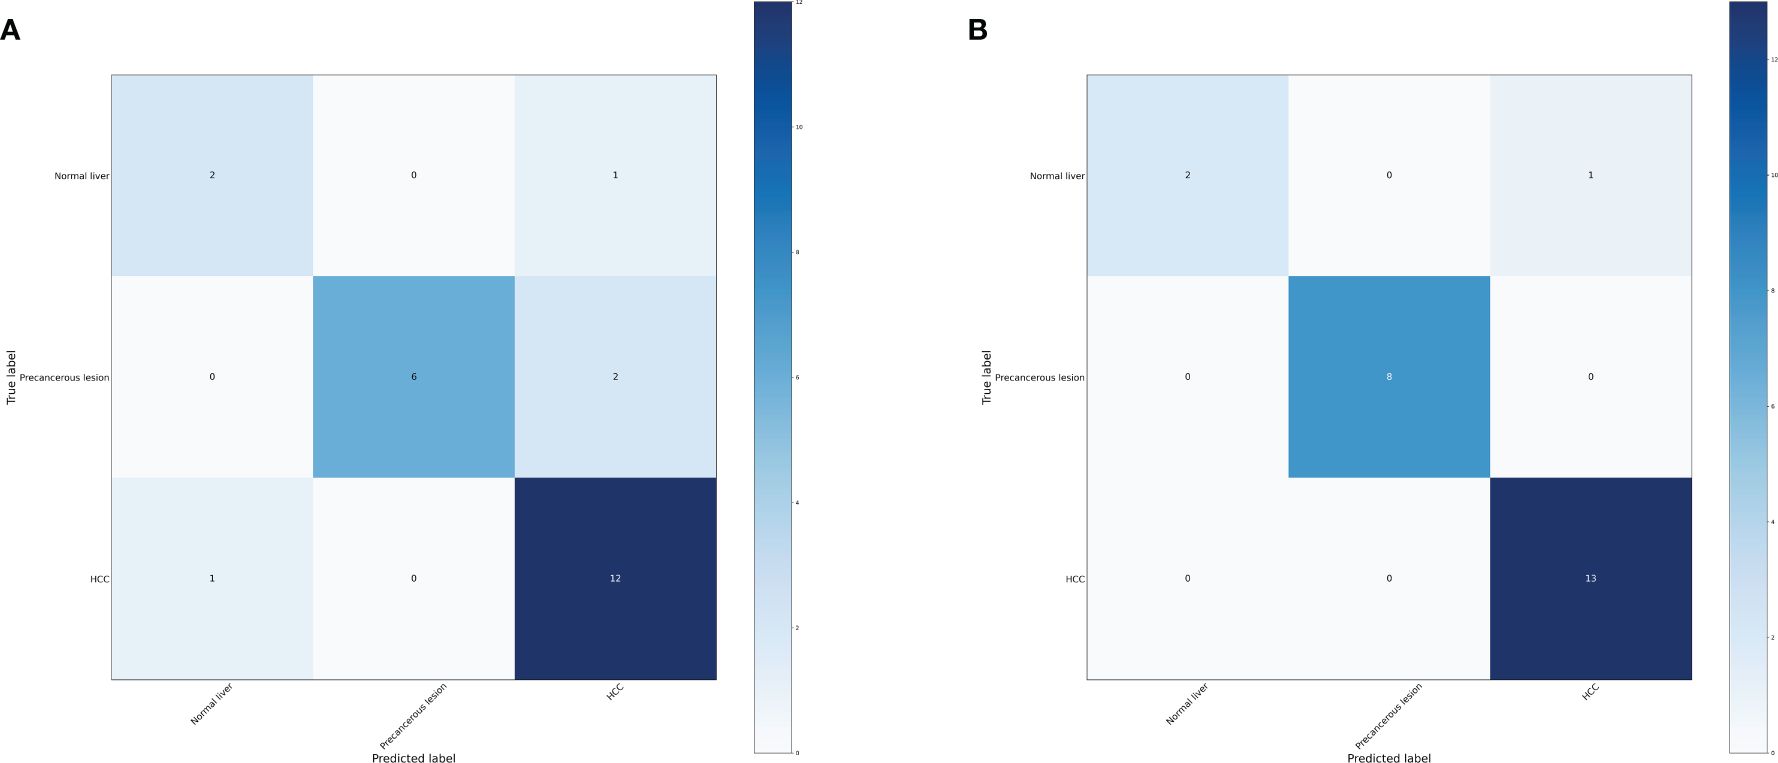
Figure 2 Confusion matrix of the models. (A) Confusion matrix of the random forest model. (B) Confusion matrix of the LightGBM model.

Table 1 Performance measure of machine learning models based three distinct groups.
According to the method, the models above comprised a total of 12 characteristic genes (CLEC3B, RN7SL5P, RP11–977G19.10, ASPDH, CFP, CDC37L1-AS1, RN7SL752P, U3, IGFALS, MASP2, RN7SKP255, RP11–162P23.2). Next, we utilized TBtools to generate expression heatmap for these 12 characteristic genes (Supplementary Figure S1). The characteristic genes are primarily involved in complement activation, activation of immune response, cytoplasmic vesicle lumen, complement binding, oxidoreductase activity, and other pathways (q < 0.05; Figure 3).
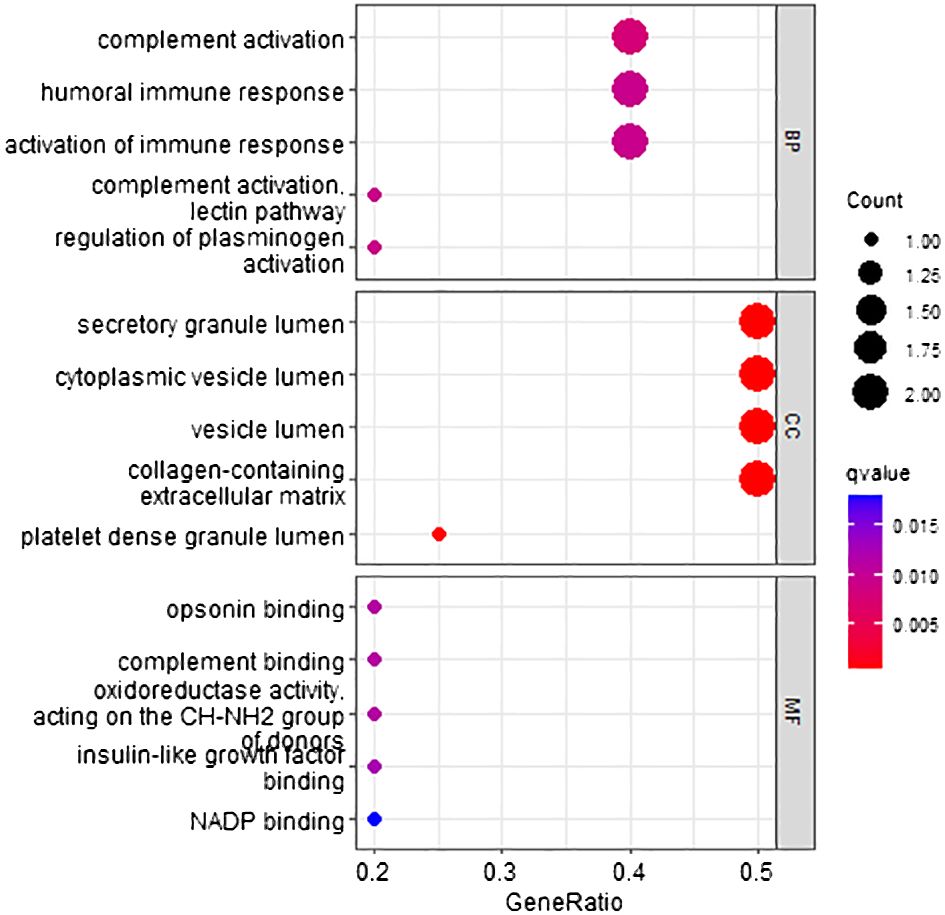
Figure 3 Go pathway enrichment of characteristic genes.
Among these genes, we found that poor prognosis was associated with low expression of CLEC3B, CDC37L1-AS1, IGFALS, and MASP2 (Logrank p < 0.05; Figure 4). Moreover, both CLEC3B and IGFALS showed a strong association with the occurrence of HCC (Table 2) (30, 31).
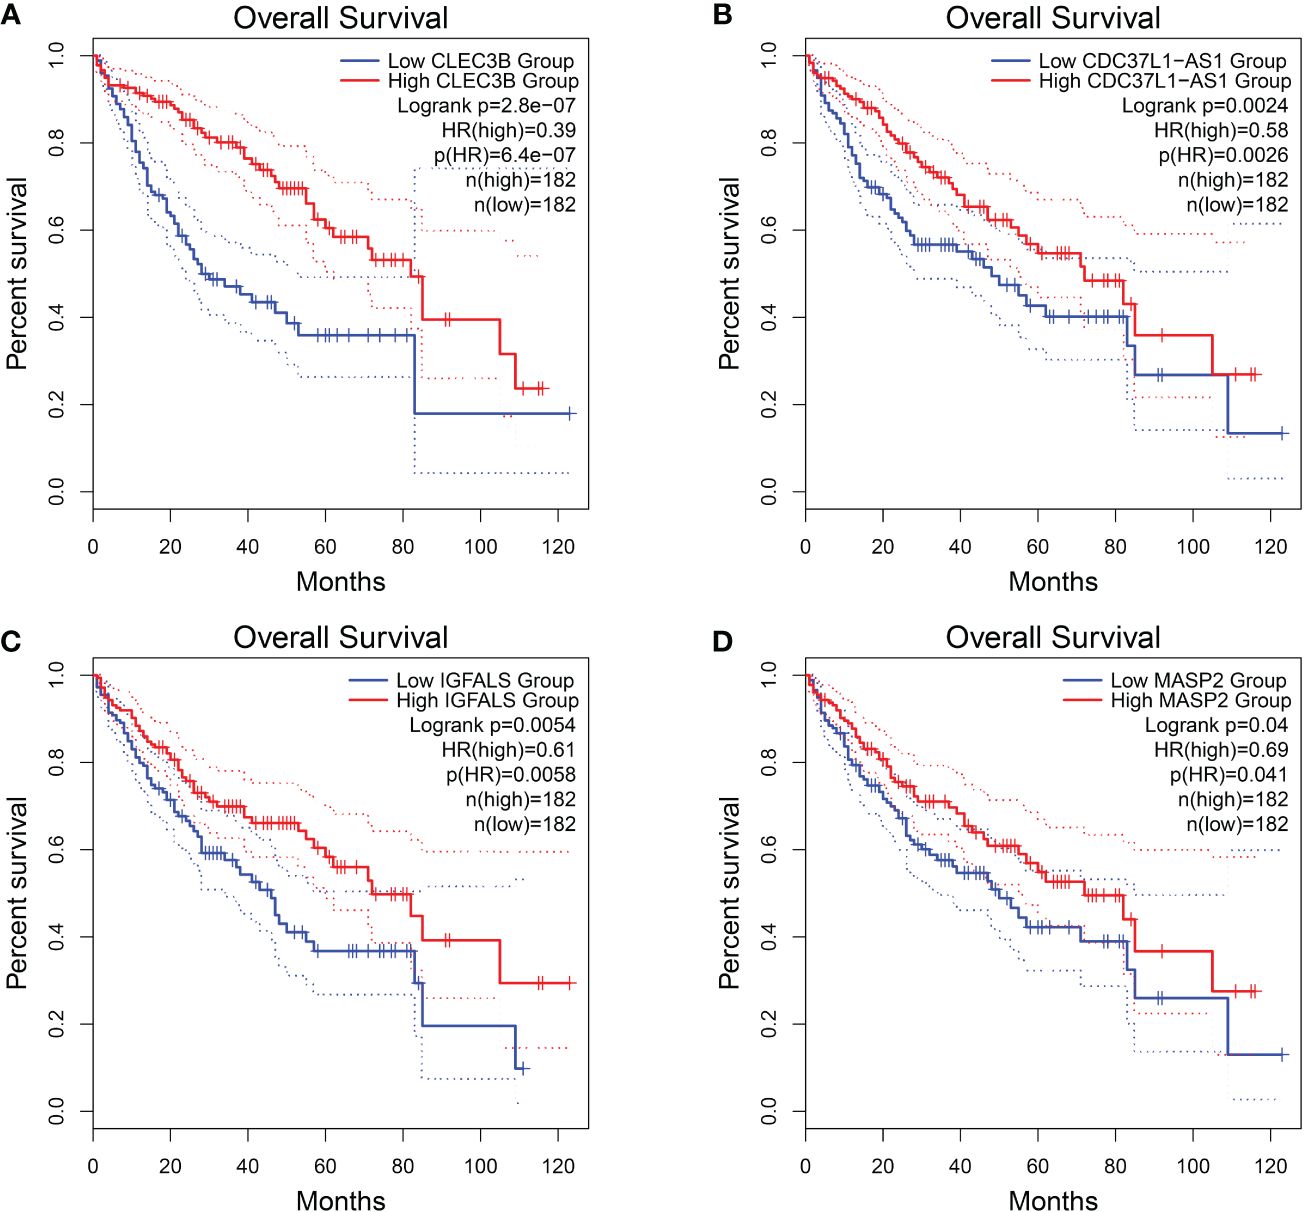
Figure 4 Overall survival of HCC genes in GEPIA2 database. (A) Overall survival of CLEC3B. (B) Overall survival of CDC37L1-AS1. (C) Overall survival of IGFALS. (D) Overall survival of MASP2.
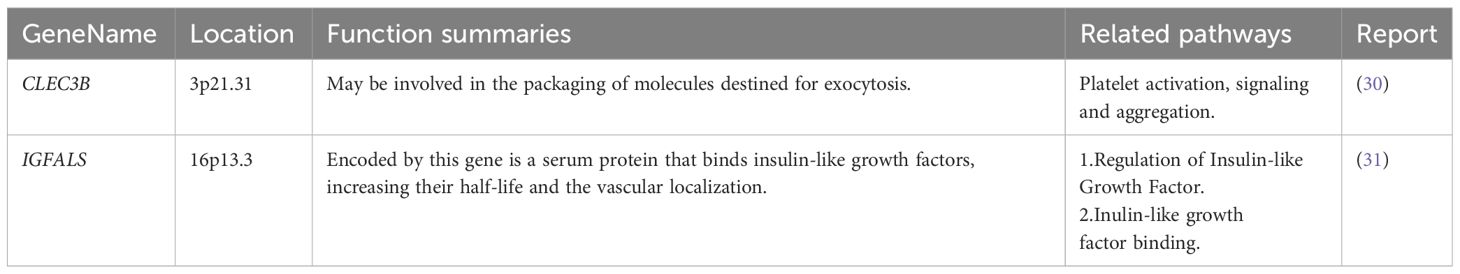
Table 2 CLEC3B and IGFALS reported in HCC from GeneCards database.
In order to further investigate the effectiveness of machine learning models in classifying early stage HCC, we categorized the data into four groups: normal liver, precancerous lesion (including chronic hepatitis, liver cirrhosis, dysplastic nodule), early stage HCC, and advanced HCC. Performance measure of the random forest model was presented in Figure 5, Table 3, indicating an accuracy of 0.83, precision of 0.83, recall of 0.83, and F1-score of 0.83. Similarly, performance measure of the LightGBM model indicated an accuracy of 0.75, precision of 0.75, recall of 0.75, and F1-score of 0.76.
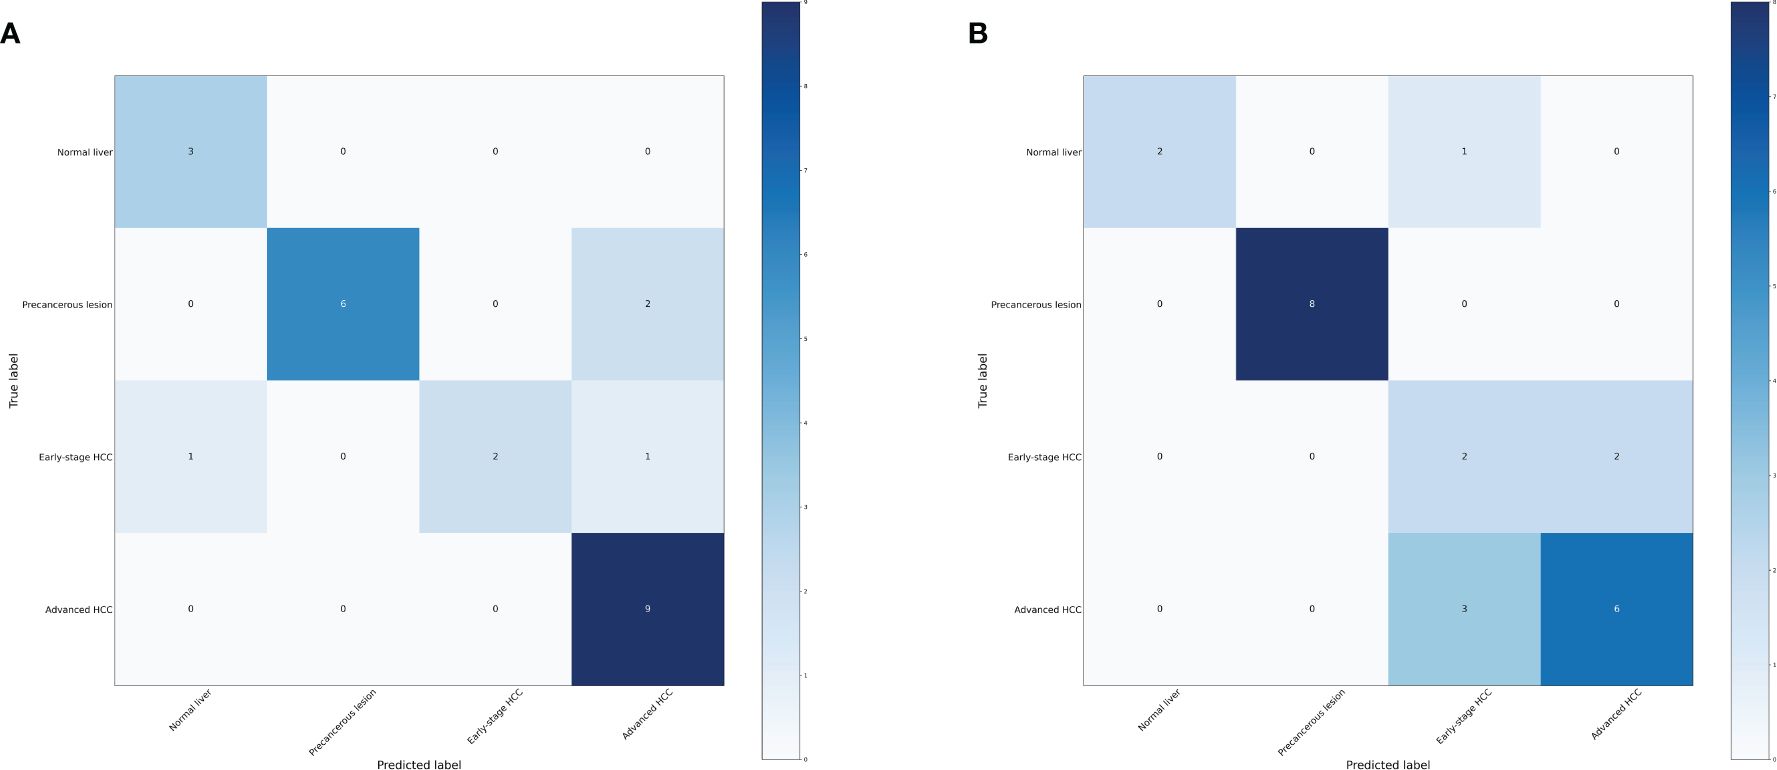
Figure 5 Confusion matrix of the models. (A) Confusion matrix of the random forest model. (B) Confusion matrix of the LightGBM model.
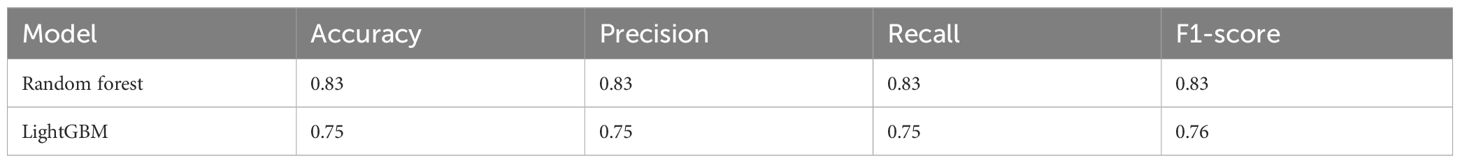
Table 3 Performance measure of machine learning models based four distinct groups.
According to the method, the models above comprised a total of 12 characteristic genes (HBA2, RP11–977G19.10, AC004538.3, INS-IGF2, RNU2–63P, RN7SL752P, U3, VIPR1, MASP2, TDO2, RN7SKP255, RP11–162P23.2). Furthermore, we utilized TBtools to generate expression heatmap for these 12 characteristic genes (Supplementary Figure S2). The characteristic genes are primarily enriched in pathways associated with the tryptophan metabolic process, hemoglobin complex, oxygen binding, and other pathways (q < 0.05; Figure 6).
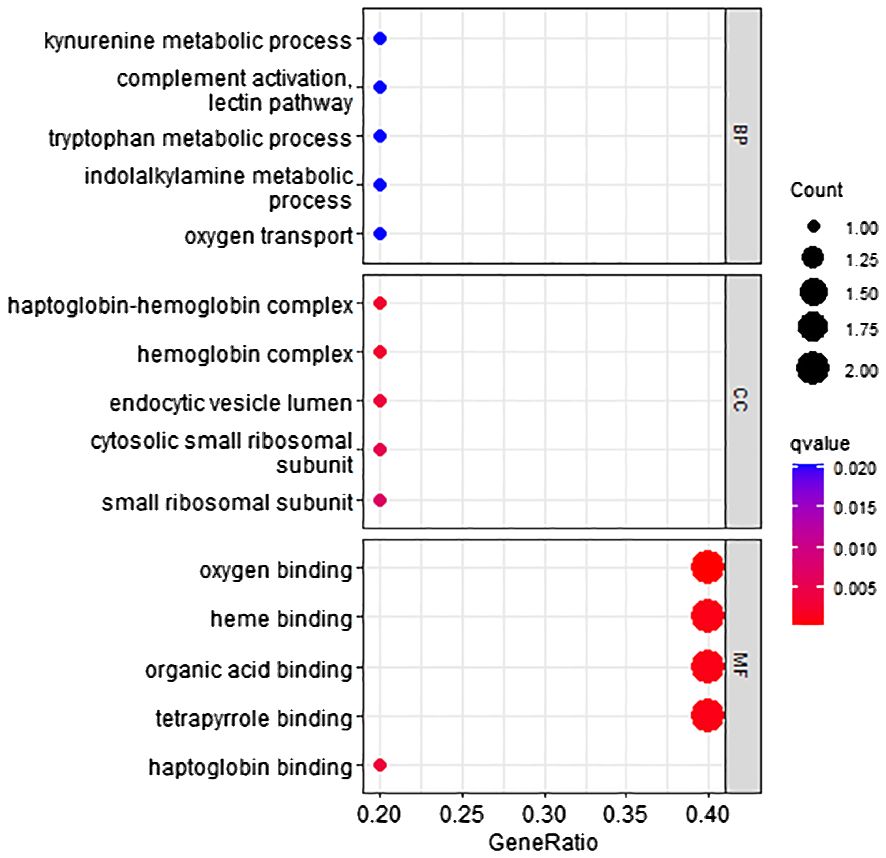
Figure 6 GO pathway enrichment of characteristic genes.
Regarding these genes, low expression of AC004538.3, VIPR1, and MASP2 was associated with a poor prognosis (Logrank p < 0.05; Figure 7). Furthermore, VIPR1 exhibited a strong association with the occurrence of HCC (Table 4) (32).
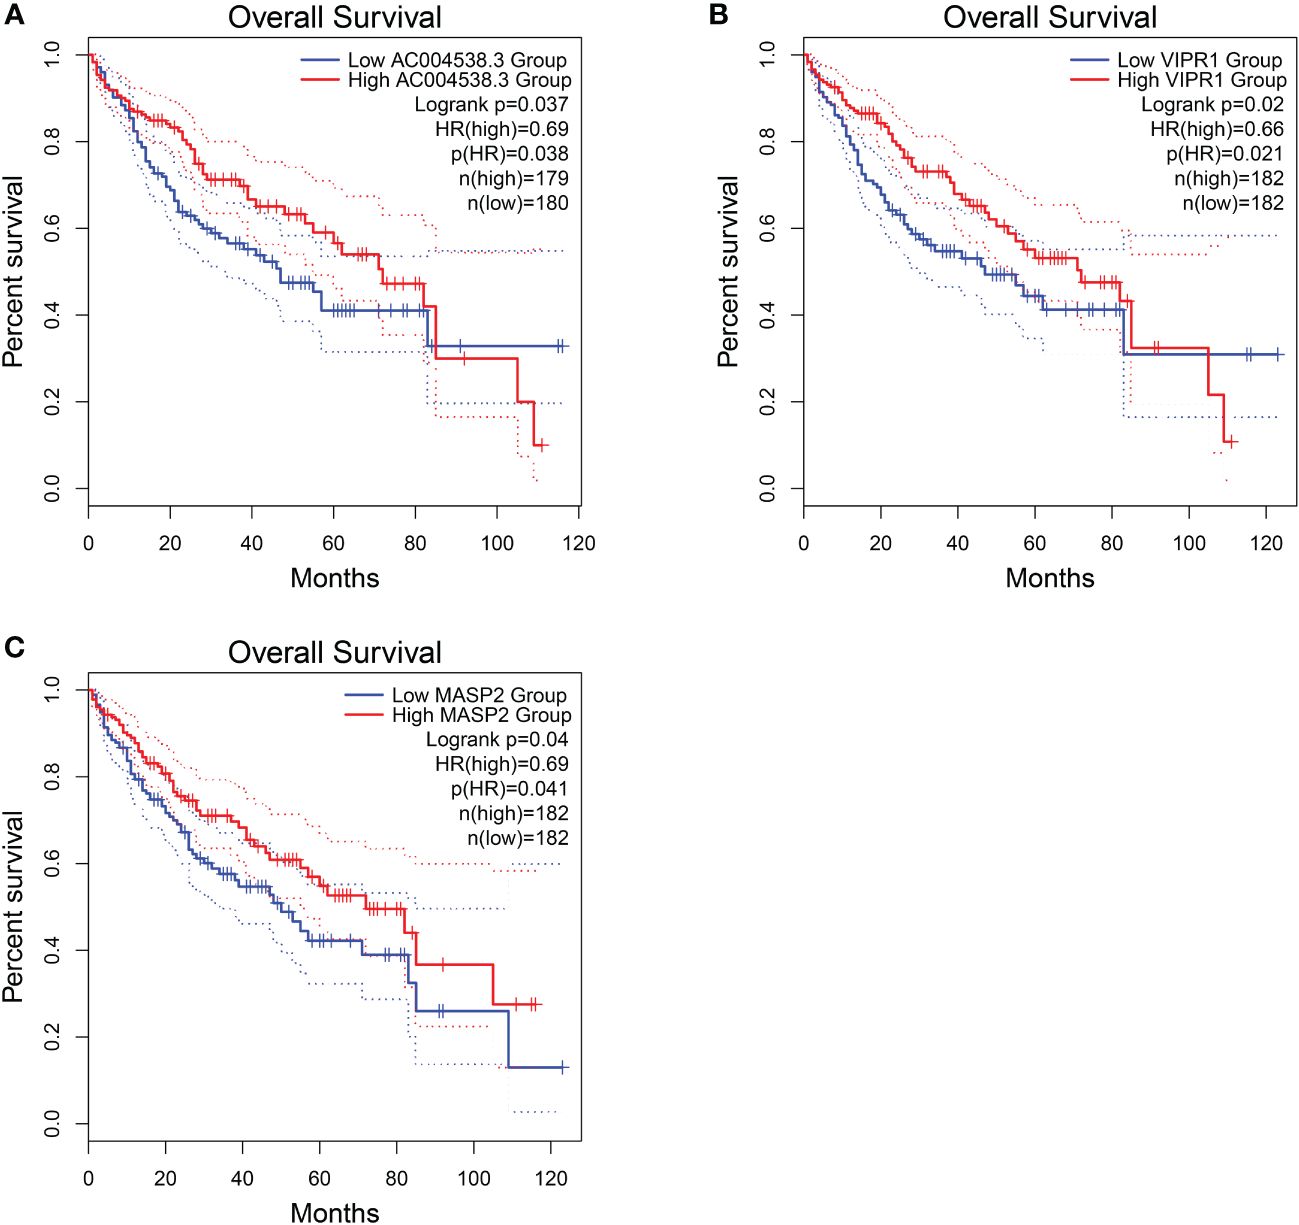
Figure 7 Overall survival of HCC genes in GEPIA2 database. (A) Overall survival of AC004538.3. (B) Overall survival of VIPR1. (C) Overall survival of MASP2..
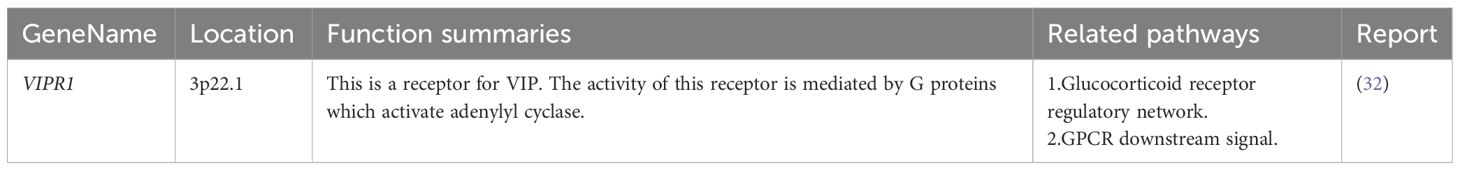
Table 4 VIPR1 reported in HCC from GeneCards database.
We further investigated the efficacy of classifying the progression of HCC across all various stages. To achieve this, we categorized the data into six groups: normal liver, chronic hepatitis, liver cirrhosis, dysplastic nodule, early stage HCC, and advanced HCC. Performance measure of the random forest model was presented in Figure 8 and Table 5, indicating an accuracy of 0.63, precision of 0.63, recall of 0.63, and F1-score of 0.59. Similarly, performance measure of the LightGBM model indicated an accuracy of 0.71, precision of 0.71, recall of 0.71, and F1-score of 0.72.
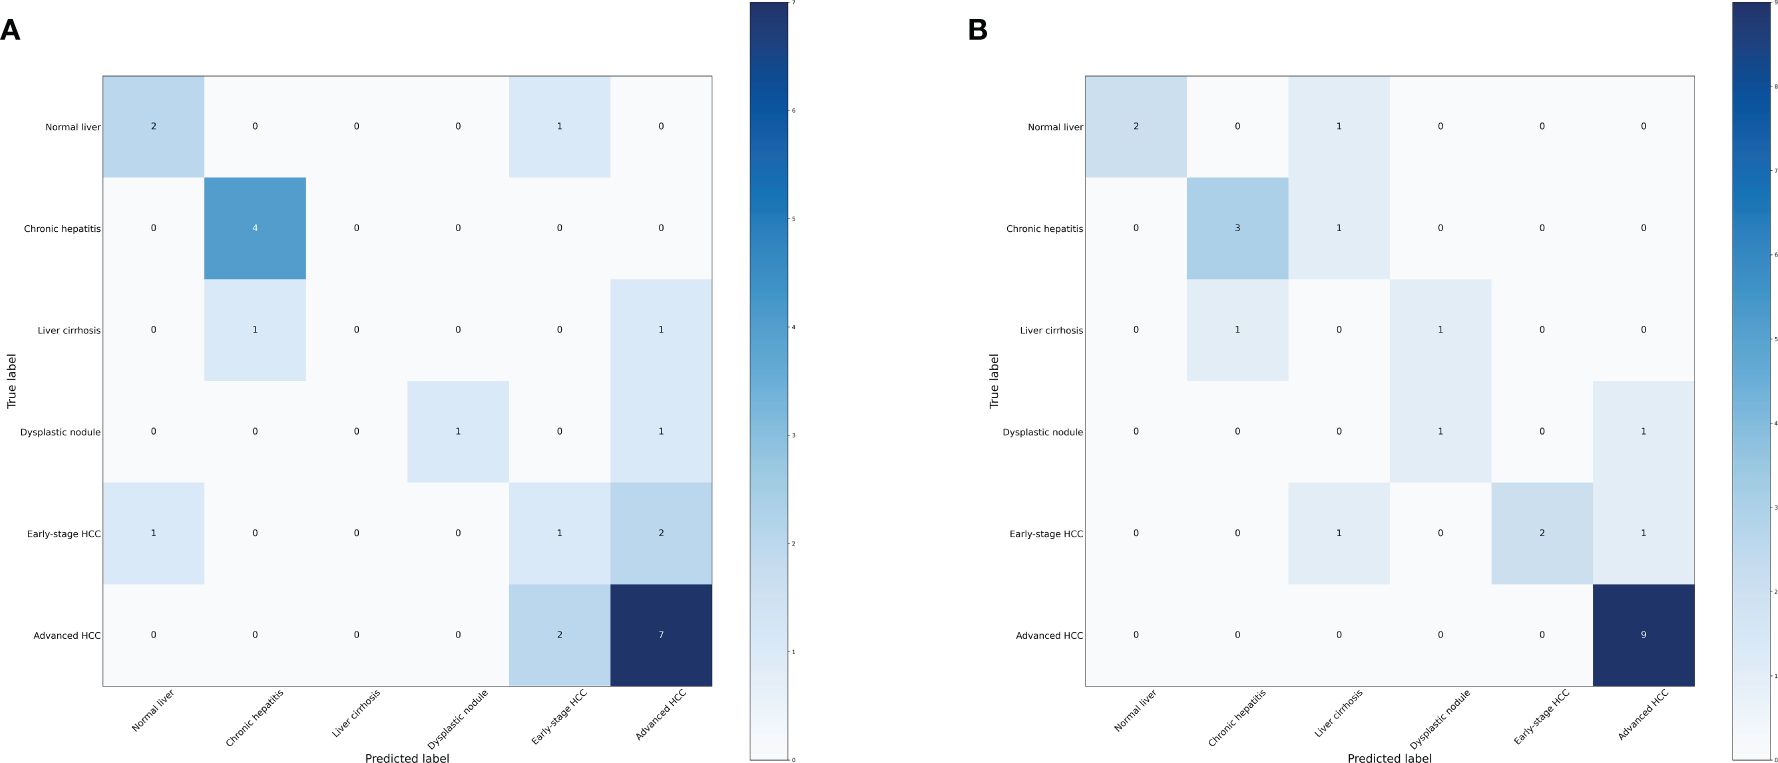
Figure 8 Confusion matrix of the models. (A) Confusion matrix of the random forest model. (B) Confusion matrix of the LightGBM model.

Table 5 Performance measure of machine learning models based six distinct groups.
According to the method, the models above comprised a total of 16 characteristic genes (C1QTNF1, JUNB, CLEC3B, SERPINA11, RP11–977G19.10, CCNB1, CDC37L1-AS1, CFB, RN7SL752P, CCL14, U3, F12, ACSL4, MOGAT2, RN7SKP255, and TERC). Furthermore, we utilized TBtools to generate expression heatmap for these 16 characteristic genes (Supplementary Figure S3). The characteristic genes are primarily enriched in pathways associated with regulation of plasminogen activation, positive regulation of protein processing, and other pathways (q < 0.05; Figure 9).
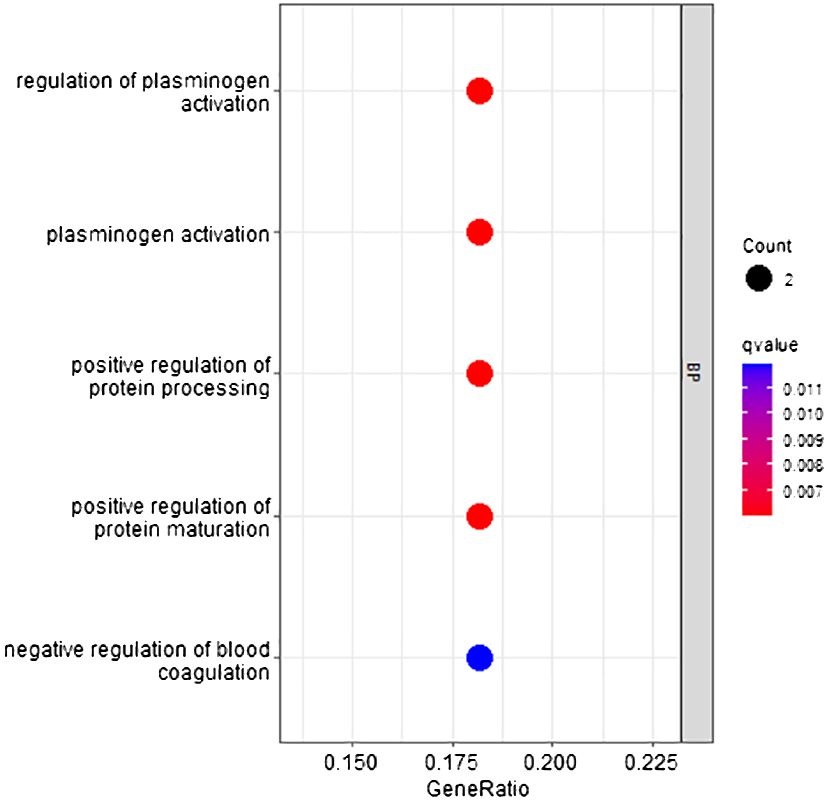
Figure 9 GO pathway enrichment of characteristic genes.
Regarding these genes, low expression of CLEC3B, CDC37L1-AS1, CFB, CCL14, and MOGAT2 was associated with poor prognosis, while high expression of CCNB1 and ACSL4 was associated with a poor prognosis (Figure 10). Furthermore, CLEC3B, CCNB1, CCL14, and ACSL4 exhibited a strong association with the occurrence of HCC (Table 6) (30, 33–35).
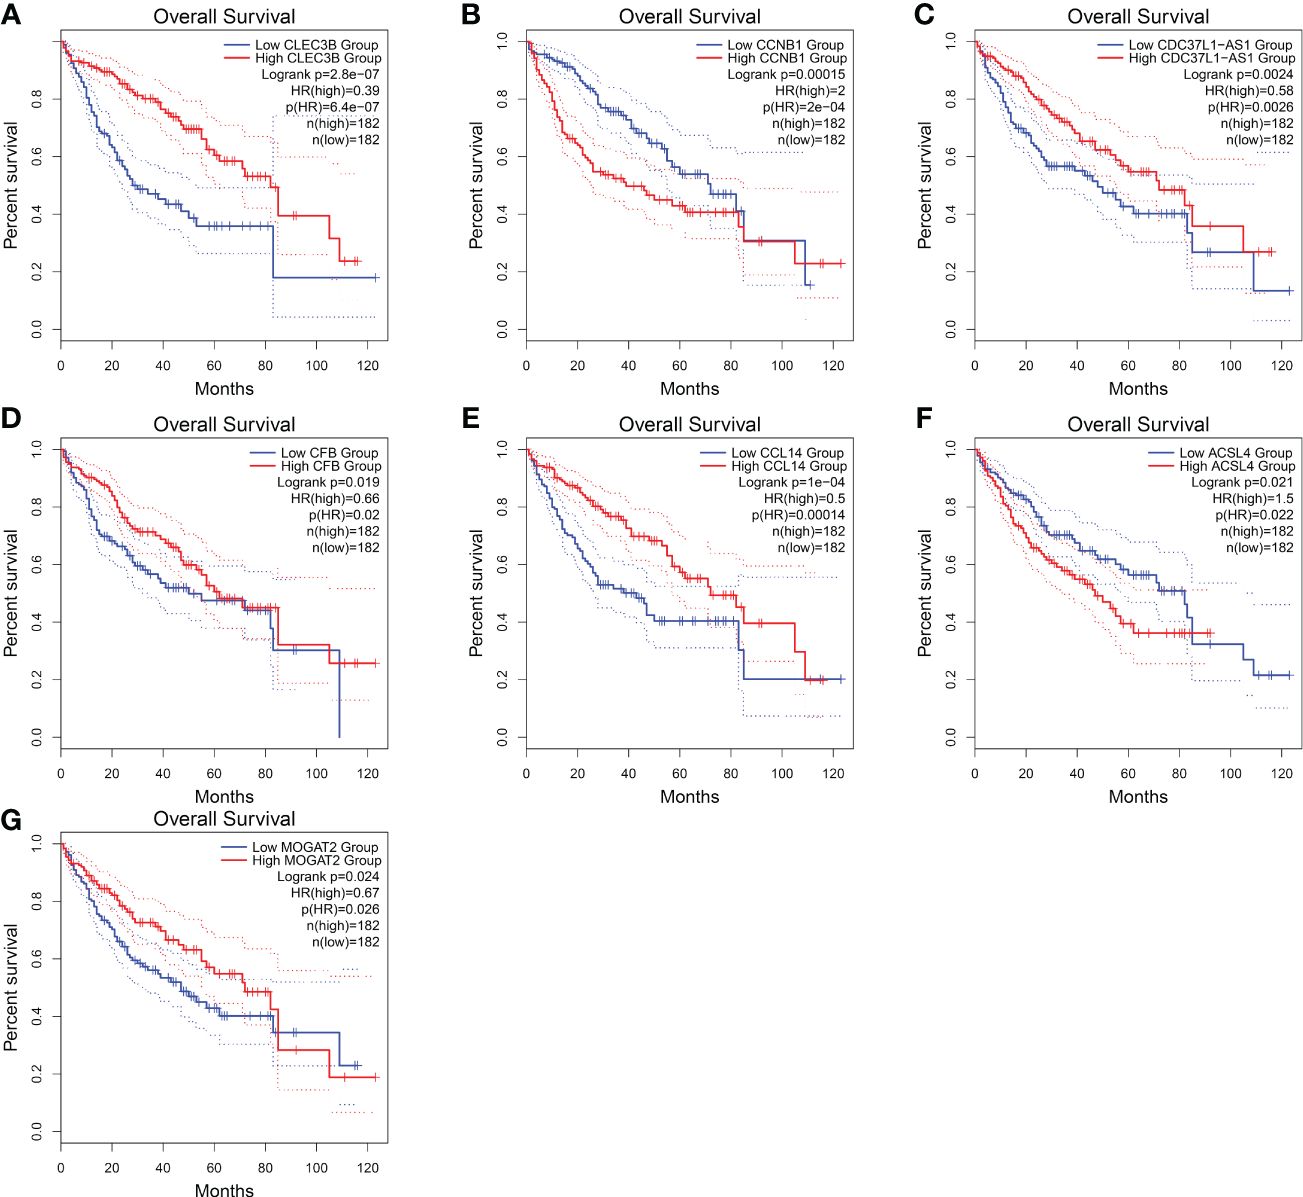
Figure 10 Overall survival of HCC genes in GEPIA2 database. (A) Overall survival of CLEC3B. (B) Overall survival of CCNB1. (C) Overall survival of CDC37L1-AS1. (D) Overall survival of CFB. (E) Overall survival of CCL14. (F) Overall survival of ACSL4. (G) Overall survival of MOGAT2.
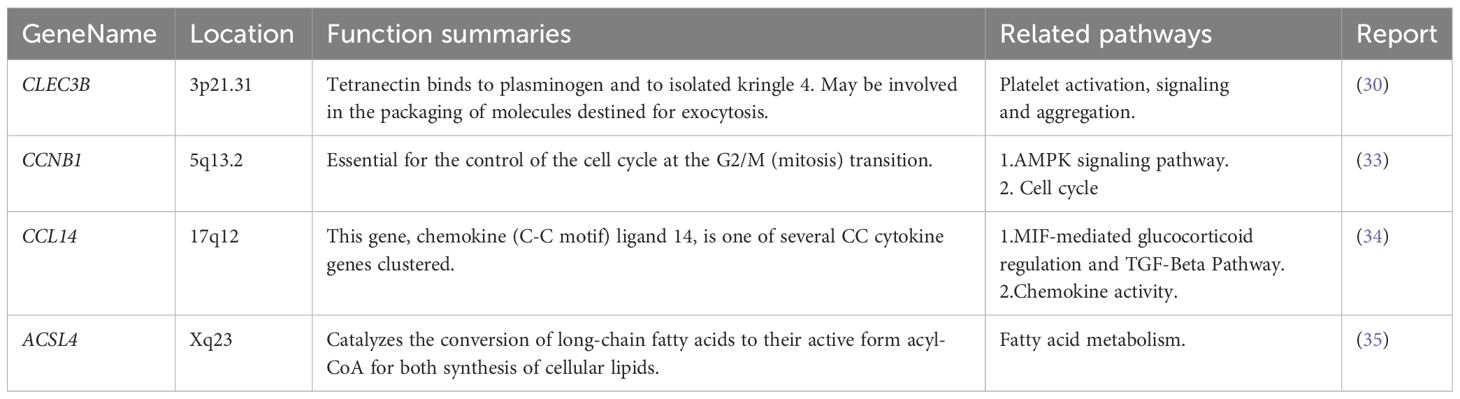
Table 6 CLEC3B, CCNB1, CCL14, and ACSL4 reported in HCC from GeneCards database.
In this research, we employed machine learning algorithms, specifically random forest and LightGBM, to develop accurate diagnostic models for progression of HCC. After multiple analyses, we have identified potential diagnostic markers for the progression of HCC. Interestingly, when we categorized samples into three groups, the classification accuracy of LightGBM algorithm exceeded 0.95. Also, performance of the random forest model was slightly inferior compared to the LightGBM model. The 12 characteristic genes are primarily involved in complement activation, activation of immune response pathways. Simultaneously, among the characteristic gene CLEC3B generated from the model, exosomes derived from HCC with downregulated CLEC3B were found to promote the migration, invasion, and epithelial-mesenchymal transition of both tumor cells and endothelial cells (30). In addition, the IGFALS, a tumor suppressor gene, undergoes epigenetic silencing, leading to dysregulation of the IGF-II signaling in HCC (31). Our research indicated that the CLEC3B and IGFALS may be involved in the progression from normal liver to precancerous lesions to HCC, but their functions require further investigation.
Furthermore, we explored whether this model can accurately distinguish early stage HCC and assessed the potential benefits of early stage HCC diagnosis. And when the samples were categorized into four groups, the random forest model achieved a classification accuracy exceeding 0.83. Moreover, performance of the LightGBM model was slightly inferior compared to the random forest model. The 12 characteristic genes are primarily enriched in pathway associated with metabolic process. Among the characteristic gene generated from the model, loss of VIPR1 expression in HCC facilitated CAD phosphorylation and tumor progression, suggesting that the restoration of VIPR1 and treatment with the VIPR1 agonist may represent a promising approach for HCC treatment (32, 36). Our research suggested that VIPR1 may play a role in the classification of early stage HCC and advanced HCC, but further research is needed to determine its specific function.
Moreover, when categorizing the stages of HCC into six distinct levels, the model still exhibits high diagnostic efficacy. These findings provide a solid foundation for precise treatment. The 16 characteristic genes are primarily enriched in pathway associated with positive regulation of protein processing. Among the characteristic gene generated from the model, CCNB1 may participate in the cell cycle of HCC by regulating DNA replication, thus promoting the development of HCC (33). And, CCL14 was a potential prognostic biomarker for determining HCC progression and was associated with immune cell infiltration in HCC (34, 37). ACSL4 promoted the progression of HCC by stabilizing c-Myc through the ERK/FBW7/c-Myc axis (38). Our research suggested that these genes may be involved in all stages of HCC progression and serve as potential biomarkers. However, further in-depth research is needed.
In the past 20 years, sequencing technologies have continuously advanced, leading to explosive growth in available data. Artificial intelligence is often used for the characterization of sequencing data, which can enhance the ability to detect HCC tumors and provide information for disease diagnosis and staging (39).
Xie (40) utilized gene expression profiles from peripheral blood to develop an artificial neural network (ANN) model that could differentiate HCC patients from the control group with a sensitivity of 96% and specificity of 86%. Harpreet (41) utilized a large-scale transcriptomic analysis dataset containing a total of 2,316 HCC samples and 1,665 non-tumor tissue samples to identify HCC samples using machine learning, with an accuracy ranging from 93% to 98%. Although these studies have demonstrated good predictive performance, they did not further differentiate and study non-tumor tissues (pre-cancerous stages).
In addition, A single-center prospective study in the UK recruited 331 cases of liver cell carcinoma, with a control group involving only 339 patients with chronic liver disease. A logistic regression analysis model was constructed, with an AUROC of 0.97 indicating excellent predictive performance. However, the study was only validated in a cohort of patients with fatty liver disease (42). Xing (43) conducted mass spectrometry proteomics sequencing and built a random forest machine learning model that clearly distinguished between HCC and healthy individuals (sensitivity 0.975, specificity 1.000), as well as between HCC and cirrhosis (sensitivity 0.925, specificity 0.915). However, these studies did not cover all stages of liver cancer progression.
In our study, we comprehensively cover all stages of liver cancer development, including normal liver, chronic hepatitis, liver cirrhosis, dysplastic nodule, early stage HCC, and advanced HCC. Furthermore, we conducted detailed classifications into three categories, four categories, and six categories respectively, in order to systematically study relevant models of liver cancer progression. When we categorized three groups: normal liver, precancerous lesion (including chronic hepatitis, liver cirrhosis, dysplastic nodule) and HCC (including early stage HCC and advanced HCC), The LightGBM model exhibited outstanding performance (accuracy = 0.96, precision = 0.96, recall = 0.96, F1-score = 0.95). Surprisingly, when the progression of HCC was categorized into the most refined six stages, the diagnostic model still demonstrated high performance (accuracy = 0.71, precision = 0.71, recall = 0.71, F1 score = 0.72). In conclusion, we successfully constructed the most detailed model of HCC progression stages using machine learning methods, providing a theoretical basis for accurate diagnosis of HCC.
In summary, this research represented the pioneering construction of a diagnostic model for HCC progression through the utilization of machine learning methods. The development of liver cancer is a gradual process. Liver cancer patients undergo a process from hepatitis and liver fibrosis to abnormal nodules, ultimately developing into liver cancer. By subdividing into different stages, we can more finely assess the disease progression stage of liver cancer patients and intervene with precision medicine. We hope that targeted early intervention and treatment can prevent the progression of HCC to advanced stage in the future. Additionally, we have identified key genes associated with the progression of liver cancer. Further research on these genes will facilitate the development of effective targets for liver cancer progression. It is important to note that the HCC progression characteristic genes identified in our research still lack sufficient research concerning their impact on progression of HCC, and further exploration is warranted. Of course, it is crucial to validate effectiveness of the model using a larger sample size. Due to the reduced cost of transcriptome sequencing, increasing dataset will arise in the future. In a word, this research holds potential for clinical application due to its significance and prospect.
The original contributions presented in the study are included in the article/Supplementary Material. Further inquiries can be directed to the corresponding author.
XJ: Data curation, Formal analysis, Writing – original draft, Writing – review & editing. RZ: Data curation, Formal analysis, Software, Writing – original draft. FJ: Data curation, Investigation, Writing – review & editing. YY: Conceptualization, Investigation, Writing – review & editing. ZZ: Conceptualization, Supervision, Writing – original draft. JW: Conceptualization, Funding acquisition, Investigation, Writing – review & editing, Writing – original draft.
The author(s) declare financial support was received for the research, authorship, and/or publication of this article. The authors gratefully acknowledge the financial support of the Science Foundation of the Excellent Youth Scholars of Fujian Provincial Health Commission (Grant 2021ZQNZD009), Natural Science Foundation of Fujian Province (Grant 2021J01445).
The authors are grateful for the open source data from GEO.
The authors declare that the research was conducted in the absence of any commercial or financial relationships that could be construed as a potential conflict of interest.
All claims expressed in this article are solely those of the authors and do not necessarily represent those of their affiliated organizations, or those of the publisher, the editors and the reviewers. Any product that may be evaluated in this article, or claim that may be made by its manufacturer, is not guaranteed or endorsed by the publisher.
The Supplementary Material for this article can be found online at: https://www.frontiersin.org/articles/10.3389/fonc.2024.1401496/full#supplementary-material
1. Sung H, Ferlay J, Siegel RL, Laversanne M, Soerjomataram I, Jemal A, et al. Global cancer statistics 2020: GLOBOCAN estimates of incidence and mortality worldwide for 36 cancers in 185 countries. CA Cancer J Clin. (2021) 71:209–49. doi: 10.3322/caac.21660
2. Bruix J, Reig M, Sherman M. Evidence-based diagnosis, staging, and treatment of patients with hepatocellular carcinoma. Gastroenterology. (2016) 150:835–53. doi: 10.1053/j.gastro.2015.12.041
3. Li L, Wang H. Heterogeneity of liver cancer and personalized therapy. Cancer Lett. (2016) 379:191–7. doi: 10.1016/j.canlet.2015.07.018
4. Chan LK, Tsui YM, Ho DW, Ng IO. Cellular heterogeneity and plasticity in liver cancer. Semin Cancer Biol. (2022) 82:134–49. doi: 10.1016/j.semcancer.2021.02.015
5. Villanueva A. Hepatocellular carcinoma. N Engl J Med. (2019) 380:1450–62. doi: 10.1056/NEJMra1713263
6. Swanson K, Wu E, Zhang A, Alizadeh AA, Zou J. From patterns to patients: Advances in clinical machine learning for cancer diagnosis, prognosis, and treatment. Cell. (2023) 186:1772–91. doi: 10.1016/j.cell.2023.01.035
7. Kann BH, Hosny A, Aerts H. Artificial intelligence for clinical oncology. Cancer Cell. (2021) 39:916–27. doi: 10.1016/j.ccell.2021.04.002
8. Zhang X, Wang Z, Tang W, Wang X, Liu R, Bao H, et al. Ultrasensitive and affordable assay for early detection of primary liver cancer using plasma cell-free DNA fragmentomics. Hepatology. (2022) 76:317–29. doi: 10.1002/hep.32308
9. Tang Z, Zhang F, Wang Y, Zhang C, Li X, Yin M, et al. Diagnosis of hepatocellular carcinoma based on salivary protein glycopatterns and machine learning algorithms. Clin Chem Lab Med. (2022) 60:1963–73. doi: 10.1515/cclm-2022–0715
10. Chen X, Ishwaran H. Random forests for genomic data analysis. Genomics. (2012) 99:323–9. doi: 10.1016/j.ygeno.2012.04.003
11. Sheehy J, Rutledge H, Acharya UR, Loh HW, Gururajan R, Tao X, et al. Gynecological cancer prognosis using machine learning techniques: A systematic review of the last three decades (1990–2022). Artif Intell Med. (2023) 139:102536. doi: 10.1016/j.artmed.2023.102536
12. Zhu J, Su Y, Liu Z, Liu B, Sun Y, Gao W, et al. Real-time biomechanical modelling of the liver using LightGBM model. Int J Med Robot. (2022) 18:e2433. doi: 10.1002/rcs.2433
13. Hamed EA, Salem MA, Badr NL, Tolba MF. An efficient combination of convolutional neural network and lightGBM algorithm for lung cancer histopathology classification. Diagnostics (Basel). (2023) 13:2469. doi: 10.3390/diagnostics13152469
14. Penson A, Camacho N, Zheng Y, Varghese AM, Al-Ahmadie H, Razavi P, et al. Development of genome-derived tumor type prediction to inform clinical cancer care. JAMA Oncol. (2020) 6:84–91. doi: 10.1001/jamaoncol.2019.3985
15. Eun JW, Jang JW, Yang HD, Kim J, Kim SY, Na MJ, et al. Serum proteins, HMMR, NXPH4, PITX1 and THBS4; A panel of biomarkers for early diagnosis of hepatocellular carcinoma. J Clin Med. (2022) 11:2128. doi: 10.3390/jcm11082128
16. Zhao X, Li X, Lin Y, Ma R, Zhang Y, Xu D, et al. Survival prediction by Bayesian network modeling for pseudomyxoma peritonei after cytoreductive surgery plus hyperthermic intraperitoneal chemotherapy. Cancer Med. (2023) 12:2637–45. doi: 10.1002/cam4.5138
17. Li X, Zhao Y, Zhang D, Kuang L, Huang H, Chen W, et al. Development of an interpretable machine learning model associated with heavy metals’ exposure to identify coronary heart disease among US adults via SHAP: Findings of the US NHANES from 2003 to 2018. Chemosphere. (2023) 311:137039. doi: 10.1016/j.chemosphere.2022.137039
18. Liu XZ, Duan M, Huang HD, Zhang Y, Xiang TY, Niu WC, et al. Predicting diabetic kidney disease for type 2 diabetes mellitus by machine learning in the real world: a multicenter retrospective study. Front Endocrinol (Lausanne). (2023) 14:1184190. doi: 10.3389/fendo.2023.1184190
19. Wolf FA, Angerer P, Theis FJ. SCANPY: large-scale single-cell gene expression data analysis. Genome Biol. (2018) 19:15. doi: 10.1186/s13059–017-1382–0
20. Xu RH, Wei W, Krawczyk M, Wang W, Luo H, Flagg K, et al. Circulating tumour DNA methylation markers for diagnosis and prognosis of hepatocellular carcinoma. Nat Mater. (2017) 16:1155–61. doi: 10.1038/nmat4997
21. Eraslan G, Simon LM, Mircea M, Mueller NS, Theis FJ. Single-cell RNA-seq denoising using a deep count autoencoder. Nat Commun. (2019) 10:390. doi: 10.1038/s41467–018-07931–2
22. Su C, Xu Z, Shan X, Cai B, Zhao H, Zhang J. Cell-type-specific co-expression inference from single cell RNA-sequencing data. Nat Commun. (2023) 14:4846. doi: 10.1038/s41467–023-40503–7
23. Peng HY, Duan SJ, Pan L, Wang MY, Chen JL, Wang YC, et al. Development and validation of machine learning models for nonalcoholic fatty liver disease. Hepatobiliary Pancreat Dis Int. (2023) 22:615–21. doi: 10.1016/j.hbpd.2023.03.009
24. Lotfollahi M, Rybakov S, Hrovatin K, Hediyeh-Zadeh S, Talavera-López C, Misharin AV, et al. Biologically informed deep learning to query gene programs in single-cell atlases. Nat Cell Biol. (2023) 25:337–50. doi: 10.1038/s41556-022-01072-x
25. Chen C, Chen H, Zhang Y, Thomas HR, Frank MH, He Y, et al. TBtools: an integrative toolkit developed for interactive analyses of big biological data. Mol Plant. (2020) 13:1194–202. doi: 10.1016/j.molp.2020.06.009
26. Chen C, Wu Y, Li J, Wang X, Zeng Z, Xu J, et al. TBtools-II: A “one for all, all for one” bioinformatics platform for biological big-data mining. Mol Plant. (2023) 16:1733–42. doi: 10.1016/j.molp.2023.09.010
27. Tang Z, Kang B, Li C, Chen T, Zhang Z. GEPIA2: an enhanced web server for large-scale expression profiling and interactive analysis. Nucleic Acids Res. (2019) 47:W556–W60. doi: 10.1093/nar/gkz430
28. Wu T, Hu E, Xu S, Chen M, Guo P, Dai Z, et al. clusterProfiler 4.0: A universal enrichment tool for interpreting omics data. Innovation (Camb). (2021) 2:100141. doi: 10.1016/j.xinn.2021.100141
29. Luo D, Fang M, Shao L, Wang J, Liang Y, Chen M, et al. The EMT-related genes GALNT3 and OAS1 are associated with immune cell infiltration and poor prognosis in lung adenocarcinoma. Front Biosci (Landmark Ed). (2023) 28:271. doi: 10.31083/j.fbl2810271
30. Dai W, Wang Y, Yang T, Wang J, Wu W, Gu J. Downregulation of exosomal CLEC3B in hepatocellular carcinoma promotes metastasis and angiogenesis via AMPK and VEGF signals. Cell Commun Signal. (2019) 17:113. doi: 10.1186/s12964–019-0423–6
31. Neumann O, Kesselmeier M, Geffers R, Pellegrino R, Radlwimmer B, Hoffmann K, et al. Methylome analysis and integrative profiling of human HCCs identify novel protumorigenic factors. Hepatology. (2012) 56:1817–27. doi: 10.1002/hep.25870
32. Fu Y, Liu S, Rodrigues RM, Han Y, Guo C, Zhu Z, et al. Activation of VIPR1 suppresses hepatocellular carcinoma progression by regulating arginine and pyrimidine metabolism. Int J Biol Sci. (2022) 18:4341–56. doi: 10.7150/ijbs.71134
33. Rong MH, Li JD, Zhong LY, Huang YZ, Chen J, Xie LY, et al. CCNB1 promotes the development of hepatocellular carcinoma by mediating DNA replication in the cell cycle. Exp Biol Med (Maywood). (2022) 247:395–408. doi: 10.1177/15353702211049149
34. Gu Y, Li X, Bi Y, Zheng Y, Wang J, Li X, et al. CCL14 is a prognostic biomarker and correlates with immune infiltrates in hepatocellular carcinoma. Aging (Albany NY). (2020) 12:784–807. doi: 10.18632/aging.102656
35. Chen J, Ding C, Chen Y, Hu W, Lu Y, Wu W, et al. ACSL4 promotes hepatocellular carcinoma progression via c-Myc stability mediated by ERK/FBW7/c-Myc axis. Oncogenesis. (2020) 9:42. doi: 10.1038/s41389-020-0226-z
36. Lin XH, Zhang DY, Liu ZY, Tang WQ, Chen RX, Li DP, et al. lncRNA-AC079061.1/VIPR1 axis may suppress the development of hepatocellular carcinoma: a bioinformatics analysis and experimental validation. J Transl Med. (2022) 20:379. doi: 10.1186/s12967–022-03573–7
37. Zhu M, Xu W, Wei C, Huang J, Xu J, Zhang Y, et al. CCL14 serves as a novel prognostic factor and tumor suppressor of HCC by modulating cell cycle and promoting apoptosis. Cell Death Dis. (2019) 10:796. doi: 10.1038/s41419–019-1966–6
38. Chen J, Ding C, Chen Y, Hu W, Yu C, Peng C, et al. ACSL4 reprograms fatty acid metabolism in hepatocellular carcinoma via c-Myc/SREBP1 pathway. Cancer Lett. (2021) 502:154–65. doi: 10.1016/j.canlet.2020.12.019
39. Calderaro J, Seraphin TP, Luedde T, Simon TG. Artificial intelligence for the prevention and clinical management of hepatocellular carcinoma. J Hepatol. (2022) 76:1348–61. doi: 10.1016/j.jhep.2022.01.014
40. Xie H, Xue YQ, Liu P, Zhang PJ, Tian ST, Yang Z, et al. Multi-parameter gene expression profiling of peripheral blood for early detection of hepatocellular carcinoma. World J Gastroenterol. (2018) 24:371–8. doi: 10.3748/wjg.v24.i3.371
41. Kaur H, Dhall A, Kumar R, Raghava GPS. Identification of platform-independent diagnostic biomarker panel for hepatocellular carcinoma using large-scale transcriptomics data. Front Genet. (2020) 10:1306. doi: 10.3389/fgene.2019.01306
42. Johnson PJ, Pirrie SJ, Cox TF, Berhane S, Teng M, Palmer D, et al. The detection of hepatocellular carcinoma using a prospectively developed and validated model based on serological biomarkers. Cancer Epidemiol Biomarkers Prev. (2014) 23:144–53. doi: 10.1158/1055–9965.EPI-13–0870
Keywords: liver cancer, machine learning, random forest model, LightGBM model, the progression of HCC
Citation: Jiang X, Zhou R, Jiang F, Yan Y, Zhang Z and Wang J (2024) Construction of diagnostic models for the progression of hepatocellular carcinoma using machine learning. Front. Oncol. 14:1401496. doi: 10.3389/fonc.2024.1401496
Received: 15 March 2024; Accepted: 29 April 2024;
Published: 15 May 2024.
Edited by:
Francisco Tustumi, University of São Paulo, BrazilReviewed by:
Jonathan Soldera, University of Caxias do Sul, BrazilCopyright © 2024 Jiang, Zhou, Jiang, Yan, Zhang and Wang. This is an open-access article distributed under the terms of the Creative Commons Attribution License (CC BY). The use, distribution or reproduction in other forums is permitted, provided the original author(s) and the copyright owner(s) are credited and that the original publication in this journal is cited, in accordance with accepted academic practice. No use, distribution or reproduction is permitted which does not comply with these terms.
*Correspondence: Jianmin Wang, d2FuZ2ptODYwNUAxNjMuY29t
†These authors have contributed equally to this work
Disclaimer: All claims expressed in this article are solely those of the authors and do not necessarily represent those of their affiliated organizations, or those of the publisher, the editors and the reviewers. Any product that may be evaluated in this article or claim that may be made by its manufacturer is not guaranteed or endorsed by the publisher.
Research integrity at Frontiers
Learn more about the work of our research integrity team to safeguard the quality of each article we publish.