
94% of researchers rate our articles as excellent or good
Learn more about the work of our research integrity team to safeguard the quality of each article we publish.
Find out more
ORIGINAL RESEARCH article
Front. Oncol. , 25 July 2024
Sec. Cancer Epidemiology and Prevention
Volume 14 - 2024 | https://doi.org/10.3389/fonc.2024.1398679
This article is part of the Research Topic The Impact of Specific Environmental Exposures on Breast, Lung, and Colon Cancer: Advancing Public Health Strategies for Enhanced Outcomes View all 16 articles
 Jia Zhao1†
 Ruihang Ren2†
 Narasimha M. Beeraka3,4,5*
 Mahesh PA6
 Nannan Xue7
 Pengfei Lu8Wenhua Bai2Zhihan Mao2Hemanth Vikram PR9Kirill V. Bulygin4
 Vladimir N. Nikolenko4
 Ruitai Fan2
 Junqi Liu2*
Background: Tracheal, Bronchus, and Lung (TBL) cancer continues to represent the majority of cancer-related incidence and mortality in United States (U.S.). While air pollutants are considered essential risk factors, both global and national average concentrations of major harmful air pollutants have significantly decreased over the decades. Green space may have a beneficial effect on human health.
Methods: We obtained data on national and state-level burden of TBL cancer, the annual average concentration of main air pollutants, and levels of green spaces in 2007, 2013, and 2019. According to generalized estimating equation (GEE), we examine the associations among incidence and mortality of TBL cancer, air pollutants, and greenspaces, represented by the Normalized Difference Vegetation Index (NDVI) in different age groups with models adjusted with meteorological, and socio-demographic. We observed additional effects of the interaction between the NDVI, Ozone, PM2.5, and other factors, which helped us to interpret and understand our results. Also, we collated states that witnessed net increments in forest coverage and conducted the same analysis separately.
Results: In our analysis, the majority of associations between NDVI and air pollutants with TBL cancer remained significantly positive, particularly noticeable among individuals aged 20 to 54. However, our findings did not explore air pollution as a potential mediator between greenspace exposure and TBL cancer. While the associations of PM2.5 with TBL cancer remained positive, the other four pollutants showed positive but statistically insignificant associations. Our interaction analysis yielded that there were positive associations between NDVI and ozone, PM2.5, and tobacco use. Max NDVI acts as a protective factor along with high HDI. Additionally, PM2.5 and HDI also showed a negative association. In 18 states with more forest, NDVI acts as a protective factor along with higher health care coverage, better health status, and participation in physical activities.
Conclusion: In the state-level of U.S., the effects of total greenspace with TBL cancer are mixed and could be modified by various socio-economic factors. PM2.5 has a direct correlation with TBL cancer and the effects can be influenced by underlying socioeconomic conditions.
Tracheal, bronchus, and lung (TBL) cancer stands as one of the significant contributors to cancer-related fatalities in U.S. as of 2023. It is projected to constitute 21% of cancer-related deaths and 12% of cancer diagnoses. Despite its profound impact on public health, TBL cancer exhibits a comparatively low survival rate (1, 2). According to the Cancer Tomorrow report by GLOBOCAN, incident cases of TBL in U.S. are forecasted to surge by approximately 38% by 2040, with mortality cases expected to rise by about 45%. Furthermore, the majority of TBL cancer cases in U.S. occur in individuals aged 50 and above. However, roughly 20% of total TBL cancer deaths are not linked to tobacco use, potentially placing it as the eighth most prevalent cause of cancer-related mortality (1, 3, 4).
According to the International Agency for Research on Cancer (IARC), outdoor air pollution is classified as a Group 1 human carcinogen and significantly contributes to the burden of diseases, including lung cancer (5). Moreover, ambient PM2.5 air pollution has been identified as a contributing factor in nearly 14.1% of lung cancer deaths globally (6). The persistence of unhealthy air pollution levels for more than one-third of Americans underscores the need for continued research and public health interventions (1, 4, 7). The evolutionary and developmental mechanisms underlying TBL cancer remain complex. Exposure to air pollution may play a role in the progression of TBL cancer through the activation of signal transduction pathways, DNA damage, inflammation, metabolism, and epigenetic regulation (8). Recent studies have revealed a mechanistic relationship between air pollution and lung cancer, both in functional mouse models and clinical cohorts (9–11).
Based on the findings from seven European cohorts participating in the “Effects of Low-level Air Pollution: a Study in Europe” (ELAPSE), researchers have discovered a significant link between long-term exposure to PM2.5 and an increased risk of lung cancer, even at concentrations below the current European Union (EU) limit values. Similarly, the Adventist Health and Smog Study-2 (AHSMOG-2) cohort study also observed significant positive associations between incident lung cancer and PM2.5 exposure, particularly among individuals who have never smoked or are past smokers, at low concentrations (12, 13). Moreover, a case study in Canada suggests that never-smoking patients have indicated relationships with air pollution exposures, and chronic exposure to home air pollution is linked to an elevated risk of lung cancer in Nepal among never-smokers (14, 15). Besides, more than half of lung cancer patients in Taiwan are individuals who have never smoked. Elevated levels of PM2.5 can influence both the occurrence and the survival of patients with adenocarcinoma lung cancer (16, 17). Similarly, in Pennsylvania and California, air pollution could affect the survival rates of lung cancer patients following diagnosis (18, 19).
Greenspace was considered to provide health benefits and higher access to greenspace is positively correlated with longer life expectancy (20–22). Exposure to green spaces is inversely associated with overall and cause-specific mortality, indicating that it provides a protective role (23–25). For TBL cancer, green spaces may act as a protective role or work as an effective tool to improve air quality. Studies in France and Belgium have reported varying associations between exposure to greenspace, cancer incidence, and mortality. However, a retrospective cohort study in Taiwan revealed that increased exposure to green space may mitigate the harmful impacts of PM2.5 and reduce the risk of lung cancer (26–28). For other cancers, including breast and prostate cancer, there might be a protective relationship between exposure to greenspace and the development of malignancies (29).
Despite extensive studies on the health benefits of green spaces and the detrimental effects of air pollution, the specific interactions between green space, air pollution, and TBL cancer at the state level in the United States remain underexplored. This study addresses the following gaps: (1) Limited exploration of green space and cancer links: While existing research validates the general health benefits of green spaces, there is a lack of detailed exploration regarding their specific association with TBL cancer. This study aims to provide a more comprehensive understanding of how green spaces influence TBL cancer incidence and mortality. (2) Reconfirmation of PM2.5 impact: Although the link between PM2.5 air pollution and TBL cancer has been established, this study reconfirms this connection within the context of green space exposure, emphasizing the need to consider multiple environmental factors simultaneously. (3) Need for nuanced analysis: Current research often overlooks the complex interactions between green spaces, air pollution, lung cancer, and varying population demographics. This study highlights the necessity of a more nuanced and precise analysis that accounts for these interactions to better inform future research and public health policies.
By addressing these gaps, the study aims to enhance our understanding of the interplay between environmental factors and TBL cancer, ultimately providing valuable insights for the development of more effective health interventions and policies. Therefore, in this study, we conducted a comprehensive analysis to assess the interplay between green spaces, air pollutant levels, and the risk of tracheal, bronchus, and lung (TBL) cancer across different age groups (over 20 years, 20–54 years, and over 55 years) at the state level in U.S. Furthermore, we explored potential underlying mechanisms by investigating their associations with meteorological, sociodemographic, and socioeconomic factors.
The contiguous U.S. spans approximately 9,834,633 square kilometers and is inhabited by nearly 330 million people. It comprises 50 states and the District of Columbia. Our analysis focused on 48 states along with the District of Columbia. The health system at the state level in U.S. holds significant authority. Alaska and Hawaii, along with overseas territories, were excluded from our research due to the non-applicability of study variables (30).
The Global Burden of Diseases (GBD) data visualization tool was developed by the Institute for Health metrics and Evaluation (IHME) in U.S (31). It provides statistics on the incidence and mortality rate of TBL cancer data by state, age, and year. Using the terminology defined in the GBD research, the state-wide incidence and mortality rate of TBL cancer were calculated (32). GBD is a reliable data source in U.S., compiling and summarizing data from various national databases. For individuals aged 20 and older, 20 to 54, and over 55, we estimated the incidence and mortality rate of TBL cancer for the 48 states and the District of Columbia, spanning three specific years: 2007, 2013, and 2019. We rounded the collected epidemiological data to integers for the convenience of subsequent research.
In accordance with the US Environment Protection Agency (EPA), “greenspace” is any vegetated land, including gardens, lawns, forests, wetlands, and agricultural land (33). Using the NDVI, green space was estimated based on land surface reflectance, NDVI is a remote sense indicator that has been extensively utilized in epidemiological studies to evaluate the association between greenness and health. The following formula was used to obtain the NDVI proportions: NDVI = (NIR − R)/(NIR + R) (34). The MODIS images, composed of surface reflectance images updated every 16 days with a spatial resolution of 1000m per pixel, were primarily employed to assess the greenness on www.gisrs.cn (accessed on 30 April 2023). This website offers annual state-level estimates of the NDVI in U.S. An NDVI value of ‘0’ indicates the absence of vegetation, while values approaching ‘1’ indicate the highest level of greenness (35).
Data sources from EPA were used to calculate the concentrations of main ambient air pollutants (36). The routine air quality monitoring stations in the U.S. gathered annual average concentrations of nitrogen dioxide (NO2), sulfur dioxide (SO2), ozone (O3), and particulate matter with diameters up to 2.5 µm (PM2.5) and 10 µm (PM10) for the years 2007, 2013, and 2019. We downloaded the average annual data of different time nodes for corresponding states and calculated the average values. The data were measured in various units, including parts per billion (ppb) and parts per million (ppm), and these were converted to micrograms per cubic meter (µg/m³).
Data from the National Centers for Environmental Information (NCEI) and the Statewide Mapping and Climate at a Glance online sources were utilized to gather meteorological information for the states across U.S. for the years 2007, 2013, and 2019 (37). We selected a time scale of 12 months to obtain the yearly average temperature(°F) and annual precipitation(in inches). Data on PD (population density) and GDP (gross domestic product) for each state were compiled from the U.S. Bureau of Economic Analysis and the U.S. Census Bureau (38, 39). In assessing educational attainment, we used the rate of college completion as an indicator of higher education levels (40). State-level tobacco use age-adjusted prevalence was sourced from the BRFSS Prevalence & Trends Data portal (41). For the state-level HDI, we acquired the data from https://globaldatalab.org/shdi/, version v7.0 (42). Additionally, we collected potential socioeconomic factors, including healthcare coverage, health status, obesity rate, and participation in physical activities (43). We did not adjust the collected relevant factors as they met the criteria for our research. To explore the impact of different types of green spaces, We identified 18 states with increasing net forest coverage from 2000 to 2020 (44).
Utilizing state-level map charts and data visualization techniques, we depicted the variations in mean NDVI, TBL cancer incidence, and mortality across 48 states and Washington D.C. from 2007, 2013, to 2019. Two-dimensional multiple line graphs were employed to explore the relationship between TBL cancer data and mean NDVI (Y1 and Y2-axis) over the specified periods on the horizontal axis (X-axis), using R studio. The statistical software R, v.4.3.0, facilitated the plotting of multiple variables, utilizing gg-plot for bubble charts. The bubble plot, resembling a scatterplot, portrayed the average concentrations of pollutants and mean NDVI across the X-axis and Y-axis.
Initially, we assessed the correlations among air pollutants and between air pollutants and meteorological factors using Spearman’s correlations. Subsequently, the association between NDVI and TBL cancer incidence and mortality for each year was examined, controlling for individual air pollutants. A Poisson regression model was applied for each year, adjusting for meteorological parameters, GDP, and population density. Then, integrating the three-time points into a single model using a Generalized Estimating Equation (GEE) with a Poisson link, we estimated the association between NDVI (as the primary exposure variable) and TBL cancer incidence and mortality across different subgroups. Additionally, we investigated how NDVI and air pollution interacted with other relevant factors over the three time periods in the GEE model. All statistical analyses were two-sided, with effect estimates and 95% confidence intervals (CI) provided for associations with a p-value less than 0.05, indicating strong evidence of association. These statistical analyses were conducted using R Studio.
Although TBL cancer incidence and mortality in over 20 years subgroup peaked in 2019 with relatively similar numbers (86.87 in 2007; 82.33 in 2013, and 88.69 in 2019), overall trends remained consistent and declined over the three time periods. The overall incidence and mortality rates of adult TBL cancer for individuals aged 20–54 years and over 55 years decreased across the three time periods (Table 1). The East South-Central region of U.S. showed higher rates of TBL cancer incidence and mortality among individuals over 55 years (Figure 1). The overall mean NDVI values in U.S. ranged from 0.70 in 2007 to 0.71 in 2013 to 0.72 in 2019 (Figure 1). The East and East Central regions of U.S. had higher mean NDVI values in 2007, 2013, and 2019. Conversely, the Western region, including states with high altitudes such as Arizona, Nevada, Utah, New Mexico, and Wyoming, exhibited comparatively lower NDVI values.
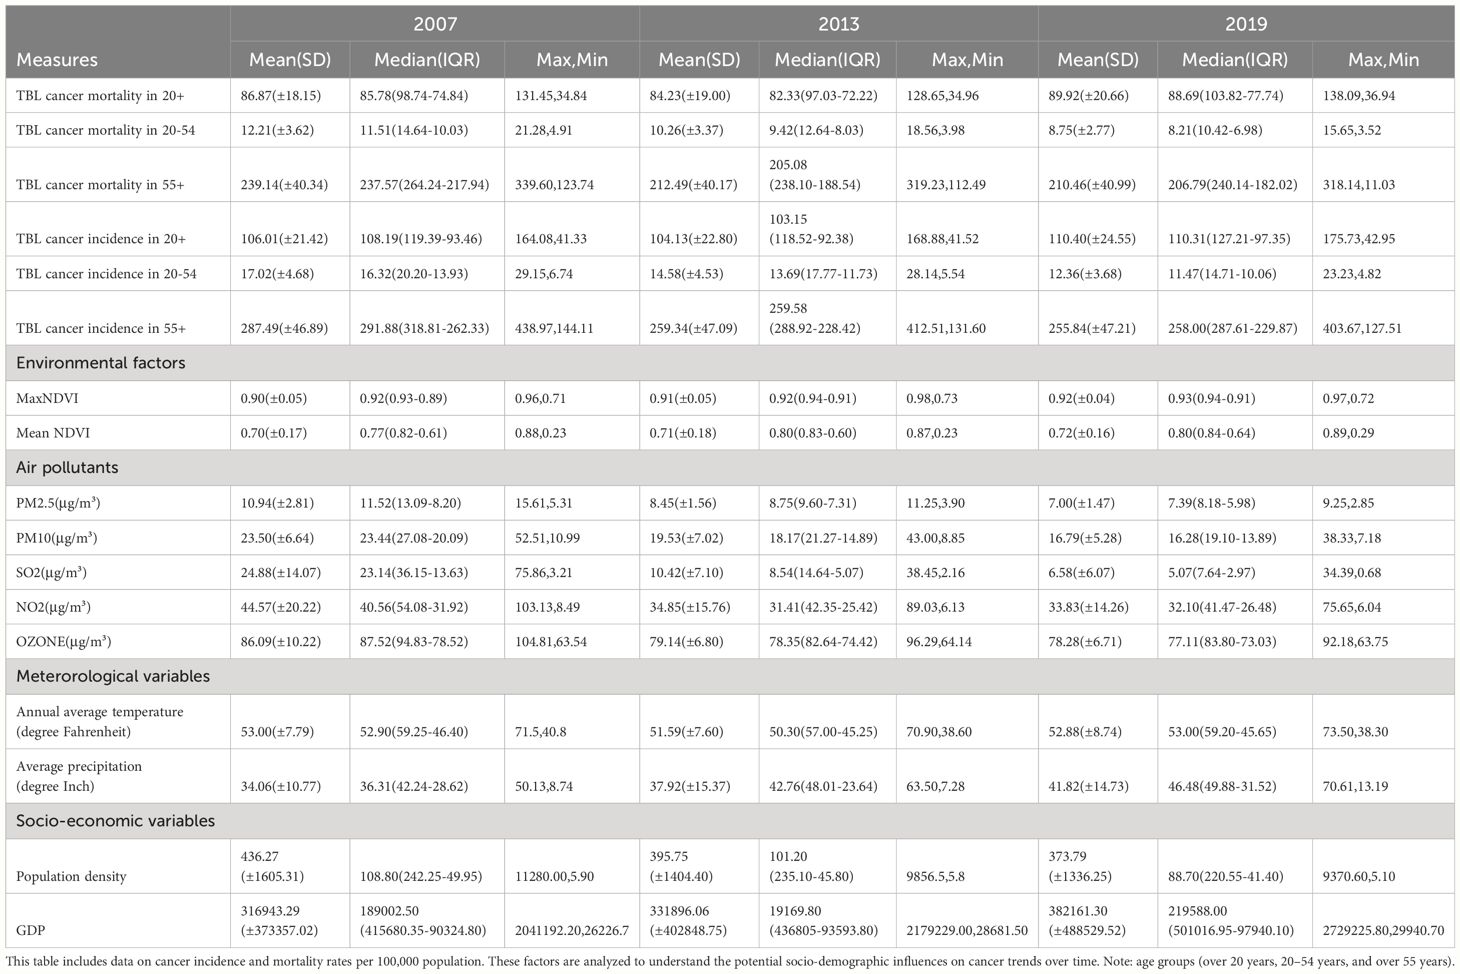
Table 1 Summary statistics for the incidence and mortality rates of Tracheal, Bronchus, and Lung (TBL) cancers, along with other socio-demographic factors in U.S. states for the years 2007, 2013, and 2019.
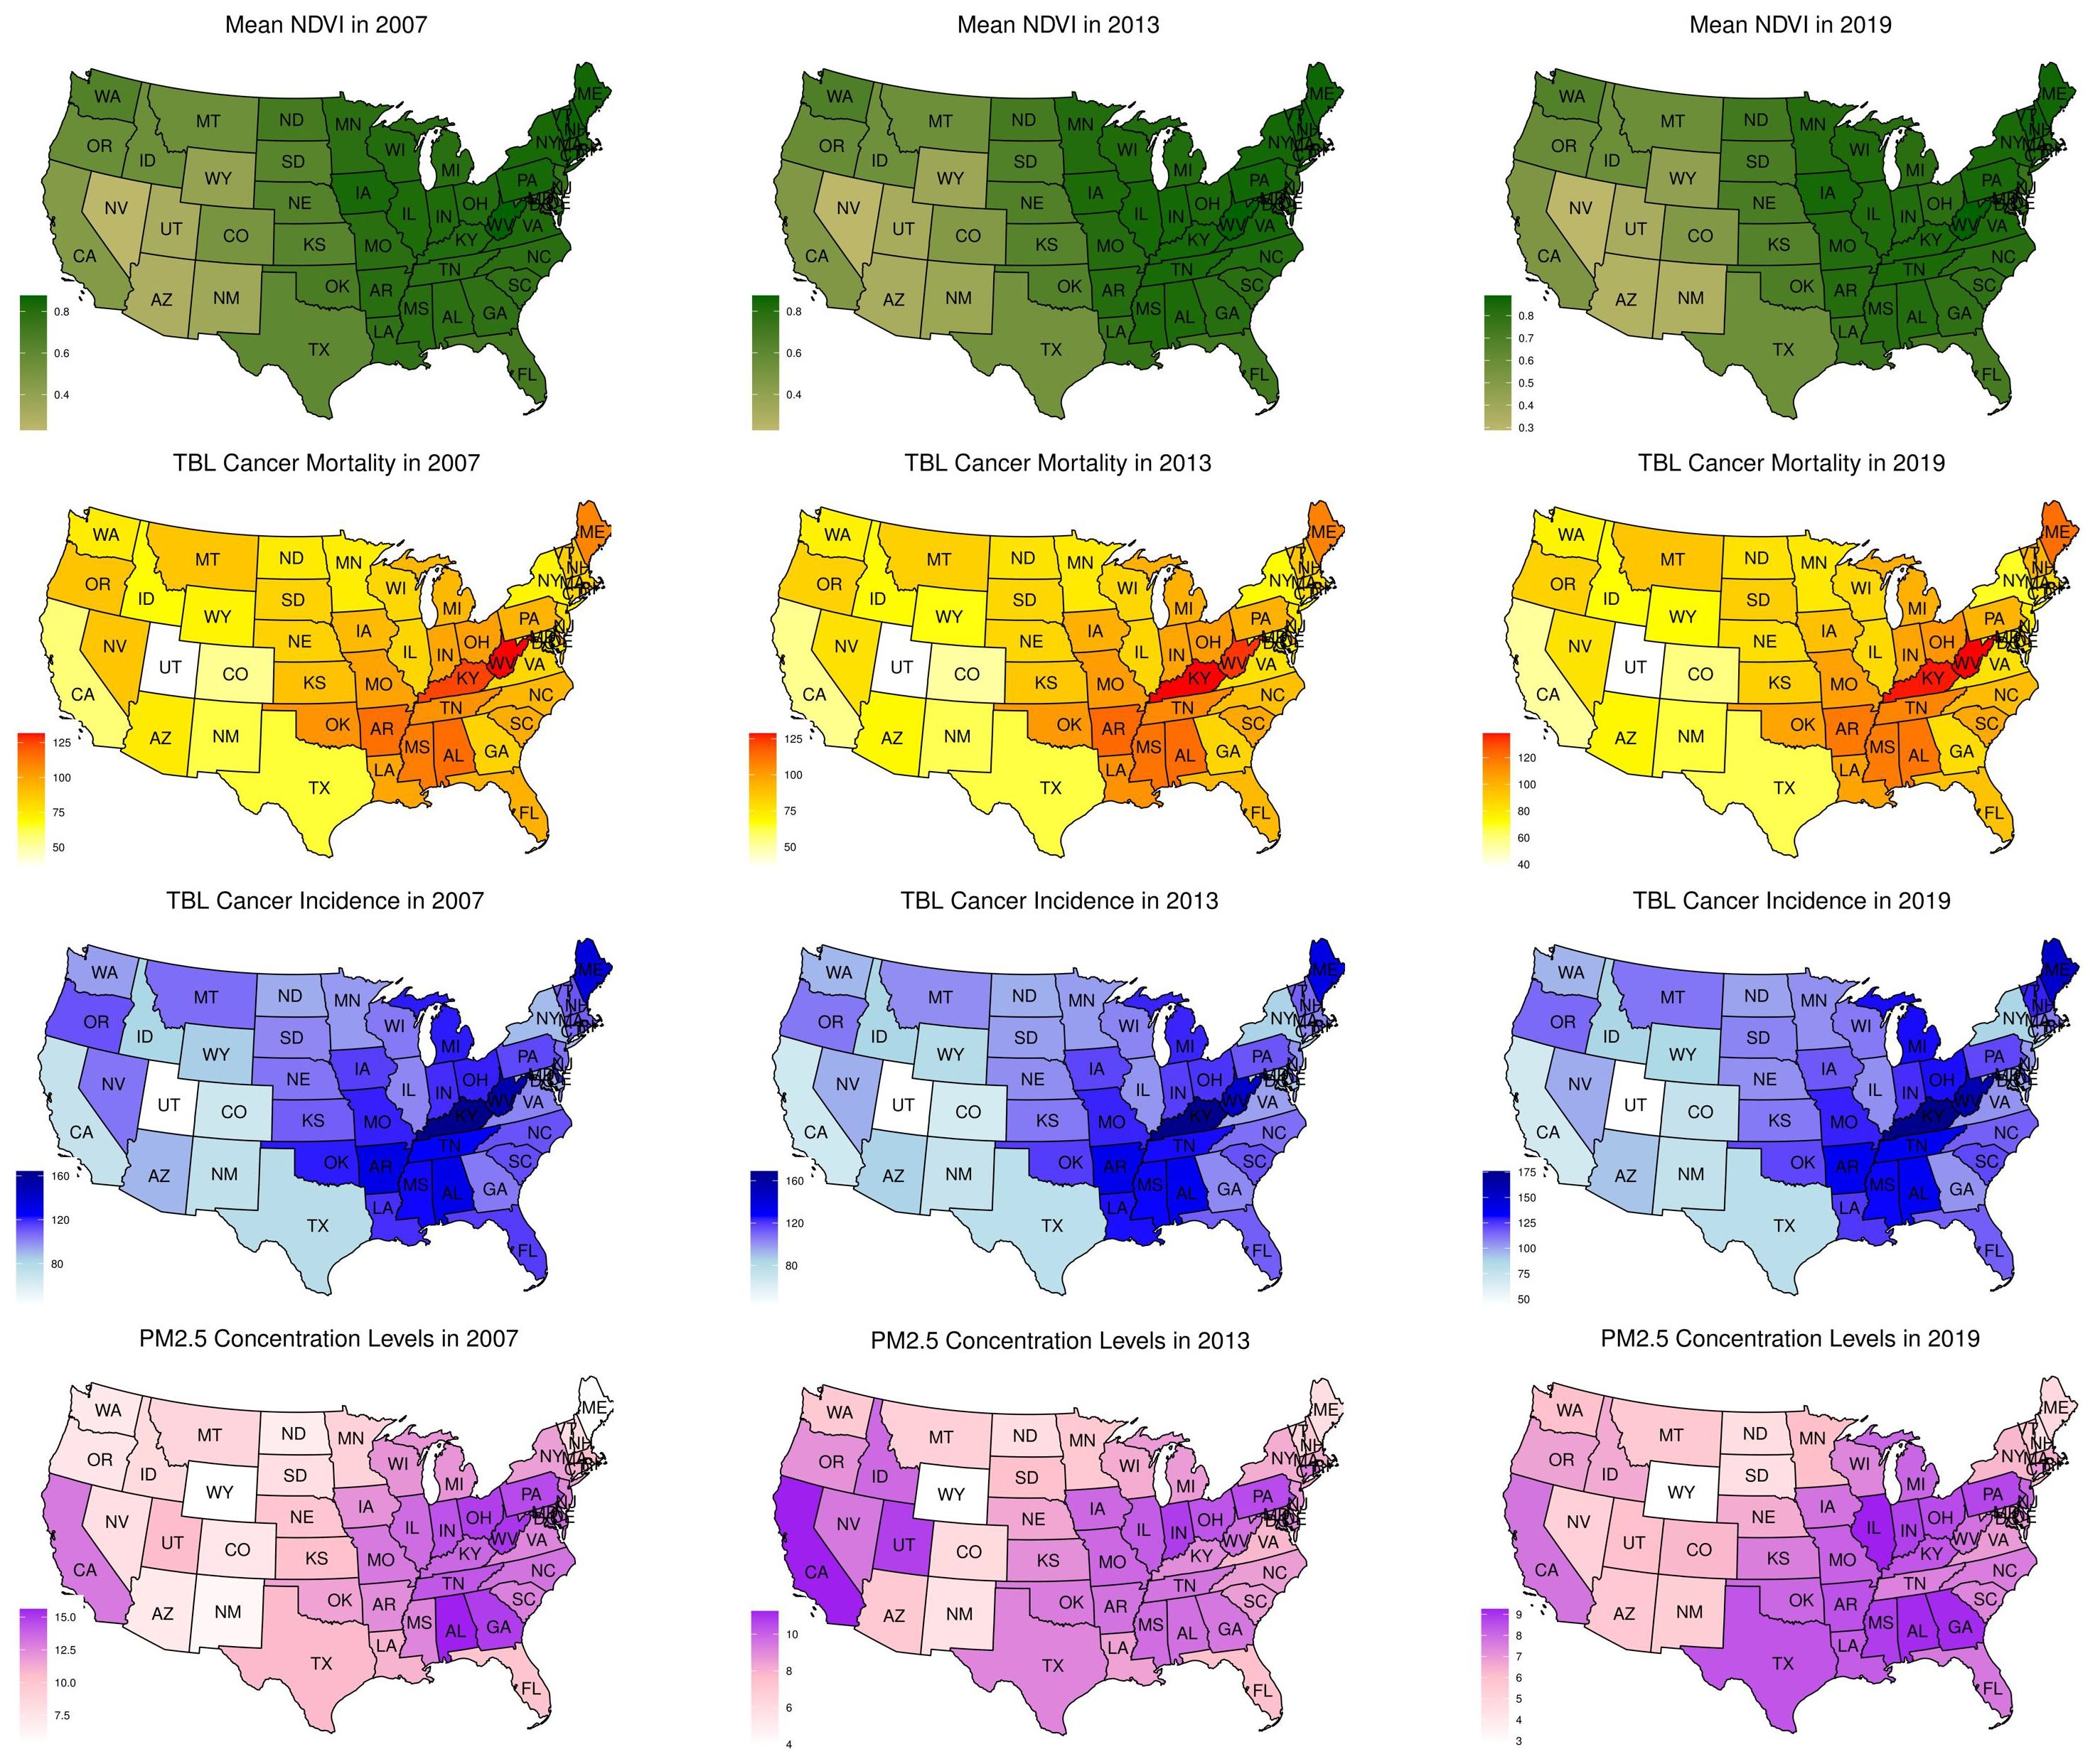
Figure 1 Distribution of mean NDVI, TBL cancer mortality, TBL cancer incidence, and mean PM2.5 concentration levels in ages over 20 years in the U.S. in 2007, 2013, and 2019. The normalized differential vegetation index (NDVI) values for 2007 (left), 2013 (middle), and 2019 (right), are shown on a spectrum of light green (least value) to dark green (highest value). Mean NDVI values of 0 to 0.2 are categorized as low, >0.2 to 4.0 as moderate, and >0.4 as high levels of greenspaces. Rates of TBL cancer incidence and mortality in ages over 55 years are shown on a spectrum of white (least value) to red (highest value) and dark blue (highest value).
There was a strong correlation between PM2.5 and SO2, while the other air pollutants showed weak to moderate relationships (Supplementary Table S1). PM2.5, PM10, NO2, and Ozone levels exhibited moderate and positive correlations with the annual average temperature. On the contrary, annual average precipitation was negatively and moderately correlated with PM10 and Ozone. Controlling for specific pollutants, NDVI was primarily associated with TBL cancer incidence and mortality in individuals over 20 years old across all three years (Supplementary Table S2). We also employed a unified model to evaluate all three years, adjusting for meteorological and socio-demographic factors. In this analysis, the associations between NDVI, air pollutants, and TBL cancer incidence and mortality remained largely positive.
The study found a significant association between the NDVI and the incidence of TBL cancer in individuals aged 20 and above. Specifically, for PM2.5, the association was quantified with a β coefficient of 0.713 (95% CI: 0.856, 1.140; p < 0.01). Similar significant associations were observed for other air pollutants: PM10 (β = 0.756; 95% CI: 0.590, 0.922; p < 0.001), SO2 (β = 0.692; 95% CI: 0.525, 0.859; p < 0.001), NO2 (β = 0.730; 95% CI: 0.557, 0.903; p < 0.001), and Ozone (β = 0.808; 95% CI: 0.626, 0.990; p < 0.001).
Similarly, NDVI was associated with TBL cancer mortality in the same age group. The β coefficient for PM2.5 was 0.664 (95% CI: 0.426, 0.902; p < 0.01). For other pollutants, the associations were: PM10 (β = 0.748; 95% CI: 0.579, 0.917; p < 0.001), SO2 (β = 0.669; 95% CI: 0.496, 0.842; p < 0.001), NO2 (β = 0.712; 95% CI: 0.540, 0.884; p < 0.001), and Ozone (β = 0.796; 95% CI: 0.610, 0.982; p < 0.001) (Table 2). Especially, more pronounced effects were observed among individuals aged 20 to 54 in terms of mortality (0.777 – 1.780) (Table 2). These findings were further supported by subgroup analyses, which demonstrated statistically significant correlations in both middle-aged individuals (20–54 years old) and older adults (55 years and above), reinforcing the overall relationship between NDVI, air pollution, and TBL cancer outcomes. The consistent significance across multiple pollutants and age groups underscores the robustness of the observed associations and suggests a broad impact of vegetation and air quality on TBL cancer incidence and mortality.
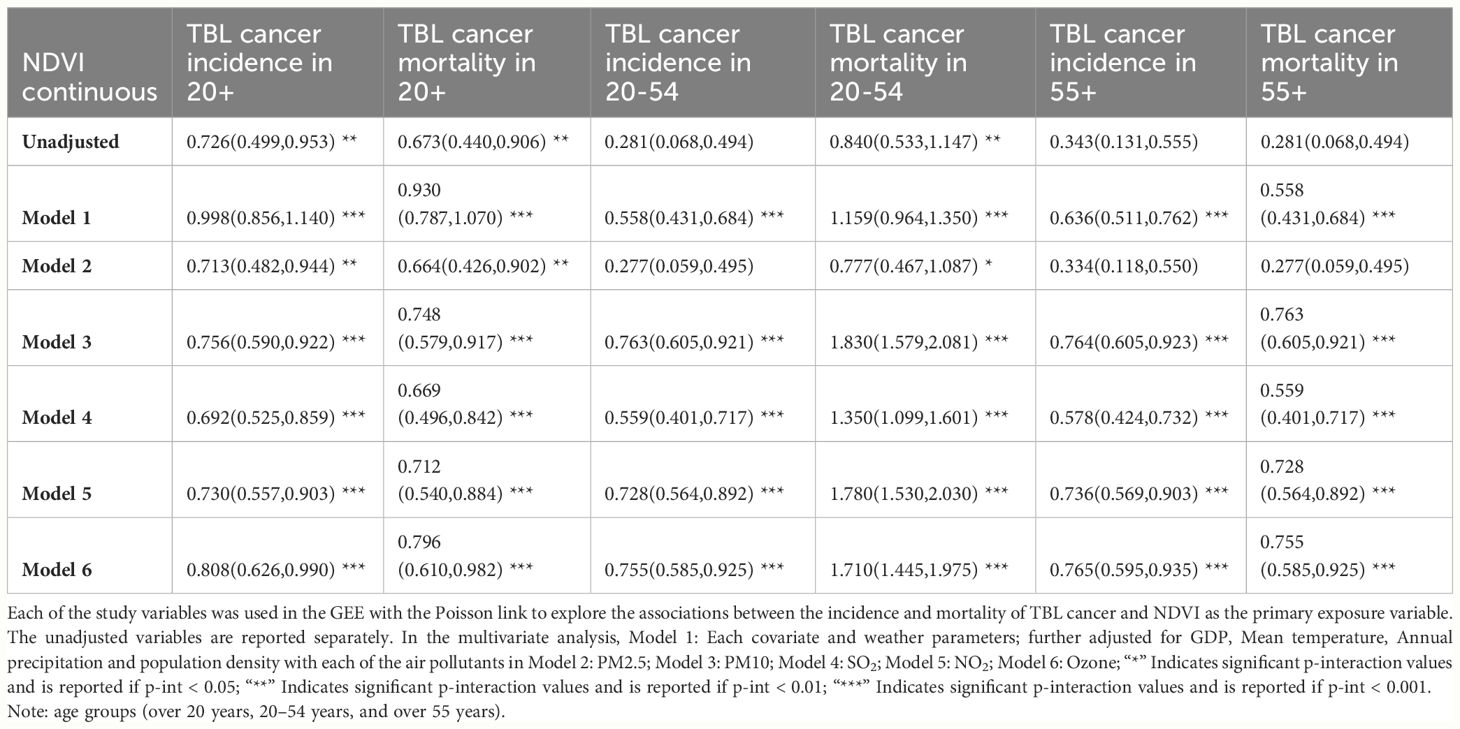
Table 2 Generalized estimation equation (GEE) result coefficients (β) (95% CI, lower, upper) of NDVI for association of TBL cancer incidence, mortality and air pollutants.
Furthermore, the associations of PM2.5 with TBL cancer remained significantly positive after adjusting for meteorological and socio-demographic variables, ranging from 0.012 to 0.080. Notably, PM2.5 was associated with TBL cancer mortality in individuals aged 20–54 years (β = 0.076; 95% CI =0.070, 0.082; p < 0.001) for PM10, along with SO2, NO2, and Ozone (β = 0.062; 95% CI = 0.053, 0.070; p < 0.001), (β = 0.079; 95% CI = 0.072, 0.085; p < 0.001), and (β = 0.080; 95% CI = 0.073, 0.087; p < 0.001), respectively (Table 3). Despite this, the associations for the other four pollutants were positive but not statistically significant (Table 3).
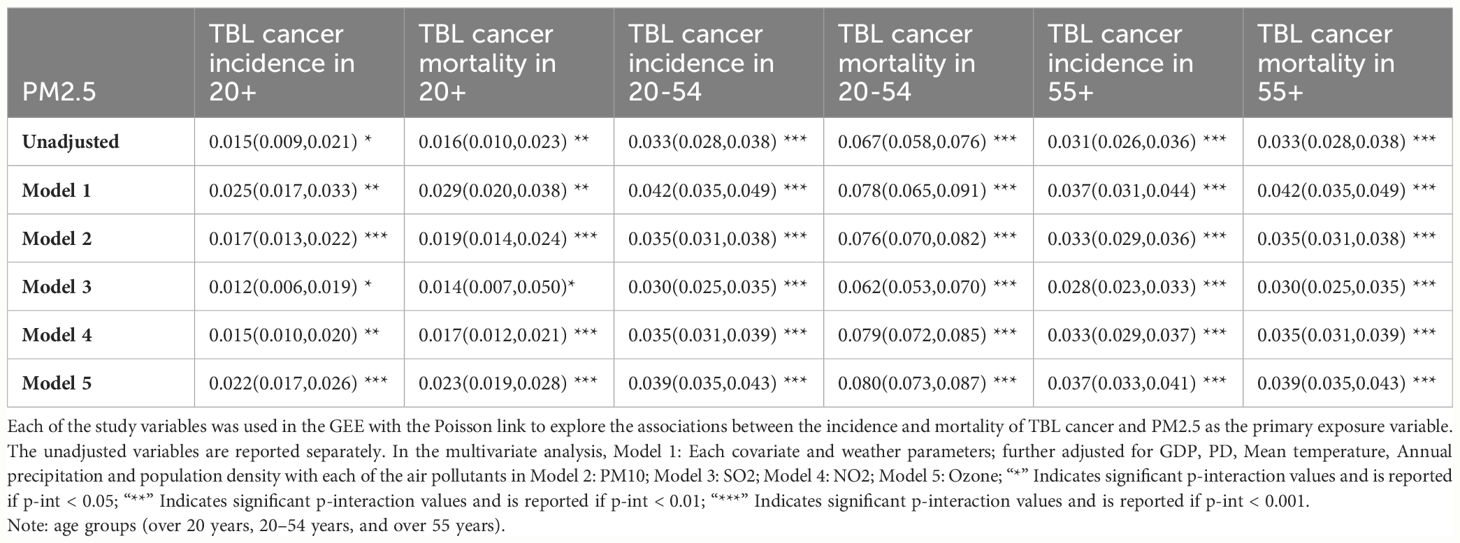
Table 3 Generalized estimation equation (GEE) result coefficients (β) (95% CI, lower, upper) of PM2.5 for association of TBL cancer incidence, mortality and air pollutants.
Our interaction analysis between NDVI and ozone revealed positive associations with all TBL cancer rates, while concentrations of other air pollutants showed no significant associations. Interaction between PM2.5 and HDI showed a negative association (β = -0.324; 95% CI = -0.177, -0.471; p < 0.05) (β = -0.351; 95% CI = -0.484, -0.219; p < 0.01) with TBL cancer incidence and mortality in individuals over 20 years old. The interaction between PM2.5 and educational level was negatively associated with TBL cancer rates in all subgroups except for TBL cancer incidence in individuals aged over 55. Our interaction analysis between tobacco use and PM2.5 concentration levels indicated a positive association (β = 2.710; 95% CI = 1.510, 3.910; p < 0.05) (β = 2.710; 95% CI = 1.640, 3.780; p < 0.05) with TBL cancer incidence and mortality in individuals over 20 years old. Additionally, the interaction between max NDVI and HDI was negatively associated with TBL cancer incidence in the individuals aged 20–54 (β = -25.053; 95% CI = -13.052, -37.054; p < 0.05), as well as TBL cancer mortality in individuals aged 20 to 54 and those aged over 55 (β = -64.227; 95% CI = -18.502, -82.794; p < 0.001) (β = -25.053; 95% CI = -13.052, -37.054; p < 0.05) (Table 4).
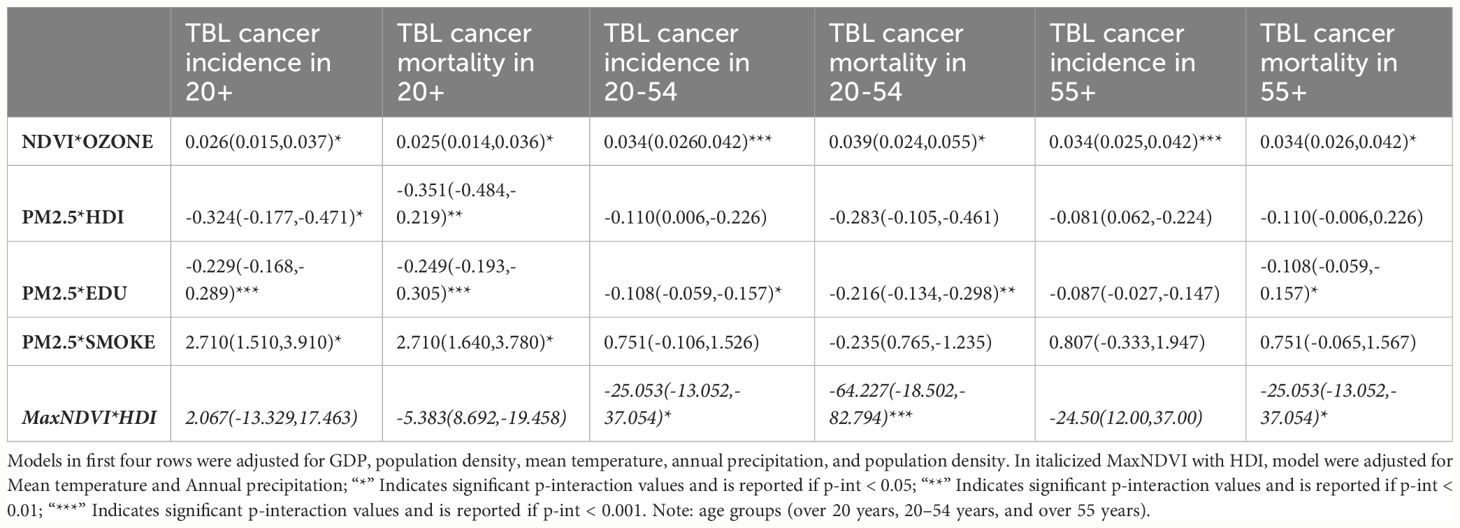
Table 4 GEE interaction analysis result (β) (95% CI, lower, upper) of related factors for association of TBL cancer incidence, mortality and air pollutants in different age groups.
In the analysis of 18 states with increasing net forest coverage from 2000 to 2020, we observed additional effects between mean NDVI and health care coverage, health status, obesity rate, and participation in physical activities, separately. (Supplementary Table S3). Regarding health care coverage, better health status, and participation in physical activities, NDVI indicated a protective role. However, when interacting with high BMI individuals, NDVI was positively associated with TBL cancer rates.
The graph depicts the TBL cancer incidence and mortality rates (per 100,000 population) among individuals aged over 55 years and the mean NDVI across 49 states in the United States for the years 2007, 2013, and 2019 (Figure 2). The lines on the graph illustrate the temporal trends of the data series, with blue lines representing cancer incidence, orange lines representing cancer mortality, and green lines indicating the mean NDVI. The horizontal axis (X-axis) displays the three time periods (2007, 2013, and 2019), while the Y1-axis on the left side corresponds to the cancer rates, and the Y2-axis on the right side corresponds to the mean NDVI (Figure 2). Selected states in U.S. of our study: (1) Alabama, (2) Arizona, (3) Arkansas, (4) California, (5) Colorado, (6) Connecticut, (7) Delaware, (8) District of Columbia, (9) Florida, (10) Georgia, (11) Idaho, (12) Illinois, (13) Indiana, (14) Iowa, (15) Kansas, (16) Kentucky, (17) Louisiana, (18) Maine, (19) Maryland, (20) Massachusetts, (21) Michigan, (22) Minnesota, (23) Mississippi, (24) Missouri, (25) Montana, (26) Nebraska, (27) Nevada, (28) New Hampshire,(29) New Jersey, (30) New Mexico, (31) New York, (32) North Carolina, (33) North Dakota, (34) Ohio, (35) Oklahoma, (36) Oregon, (37) Pennsylvania, (38) Rhode Island, (39) South Carolina, (40) South Dakota, (41) Tennessee, (42) Texas, (43) Utah, (44) Vermont, (45) Virginia, (46) Washington, (47) West Virginia, (48) Wisconsin, and (49) Wyoming (Figure 2).
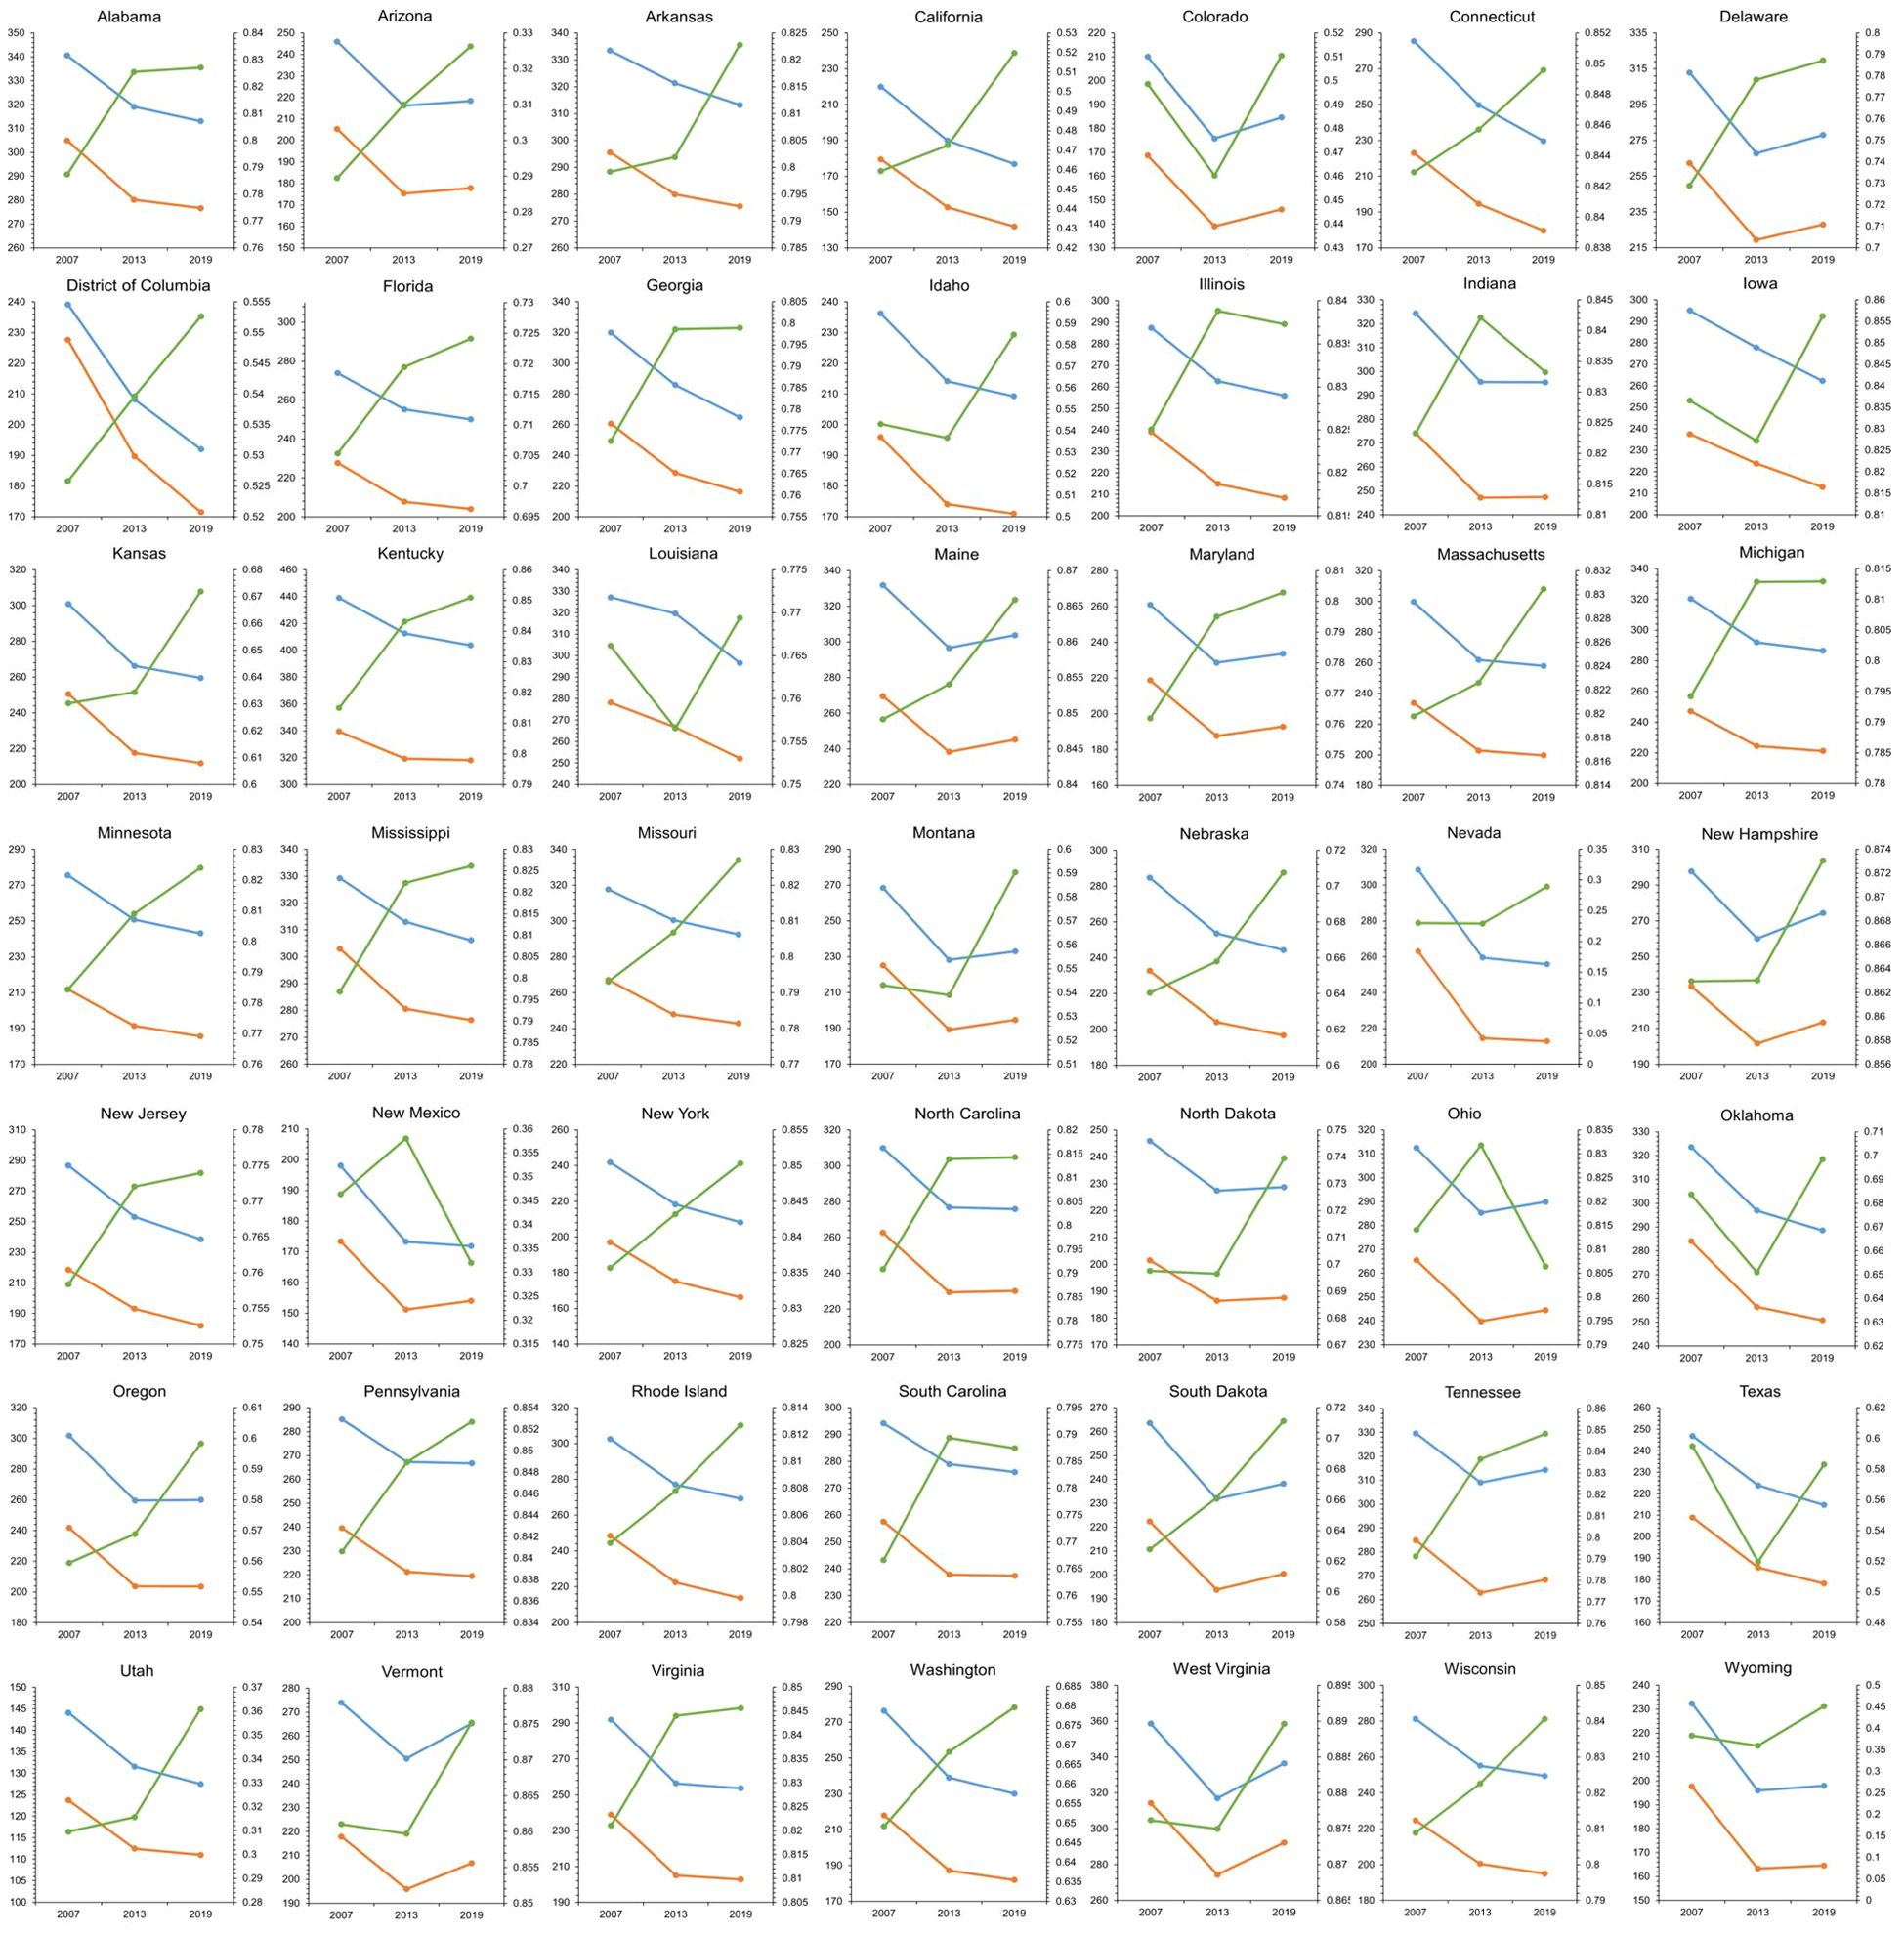
Figure 2 Data depicts the TBL cancer incidence and mortality (per 100,000 population) among individuals aged over 55 years, alongside the mean NDVI across 49 states in the United States for the years 2007, 2013, and 2019. Temporal trends are depicted by lines on the graph, with blue lines representing cancer incidence, orange lines representing cancer mortality, and green lines indicating the mean NDVI. The horizontal axis (X-axis) spans the three time periods of 2007, 2013, and 2019, while the Y1-axis on the left represents the cancer rate, and the Y2-axis on the right represents the mean NDVI.
Figure 3 presents the mean NDVI and concentrations of PM2.5 and Ozone across states for the years 2007, 2013, and 2019. In the left panel, the association between the mean NDVI (Y-axis) and the levels of PM2.5 or Ozone concentration (X-axis) is depicted. The size and color of the bubbles indicate the TBL cancer incidence and mortality for each state across the three time periods. Note: The data are represented as asthma prevalence (cases per 100,000 population), NDVI as the mean value, PM2.5 (particulate matter of diameter 2.5 µm or smaller), PM10 (particulate matter of diameter 10 µm or smaller), NO2 (nitrogen dioxide), SO2 (sulfur dioxide), O3 (ozone) in µg/m3, annual average temperature in degrees Fahrenheit, average annual precipitation in inches, GDP (gross domestic product), PD (population density) as persons/sqkm. Average values are presented as mean (± standard deviation), with minimum (Min) and maximum (Max) values, and percentile measures at 25th, 50th, 75th (Figure 3).
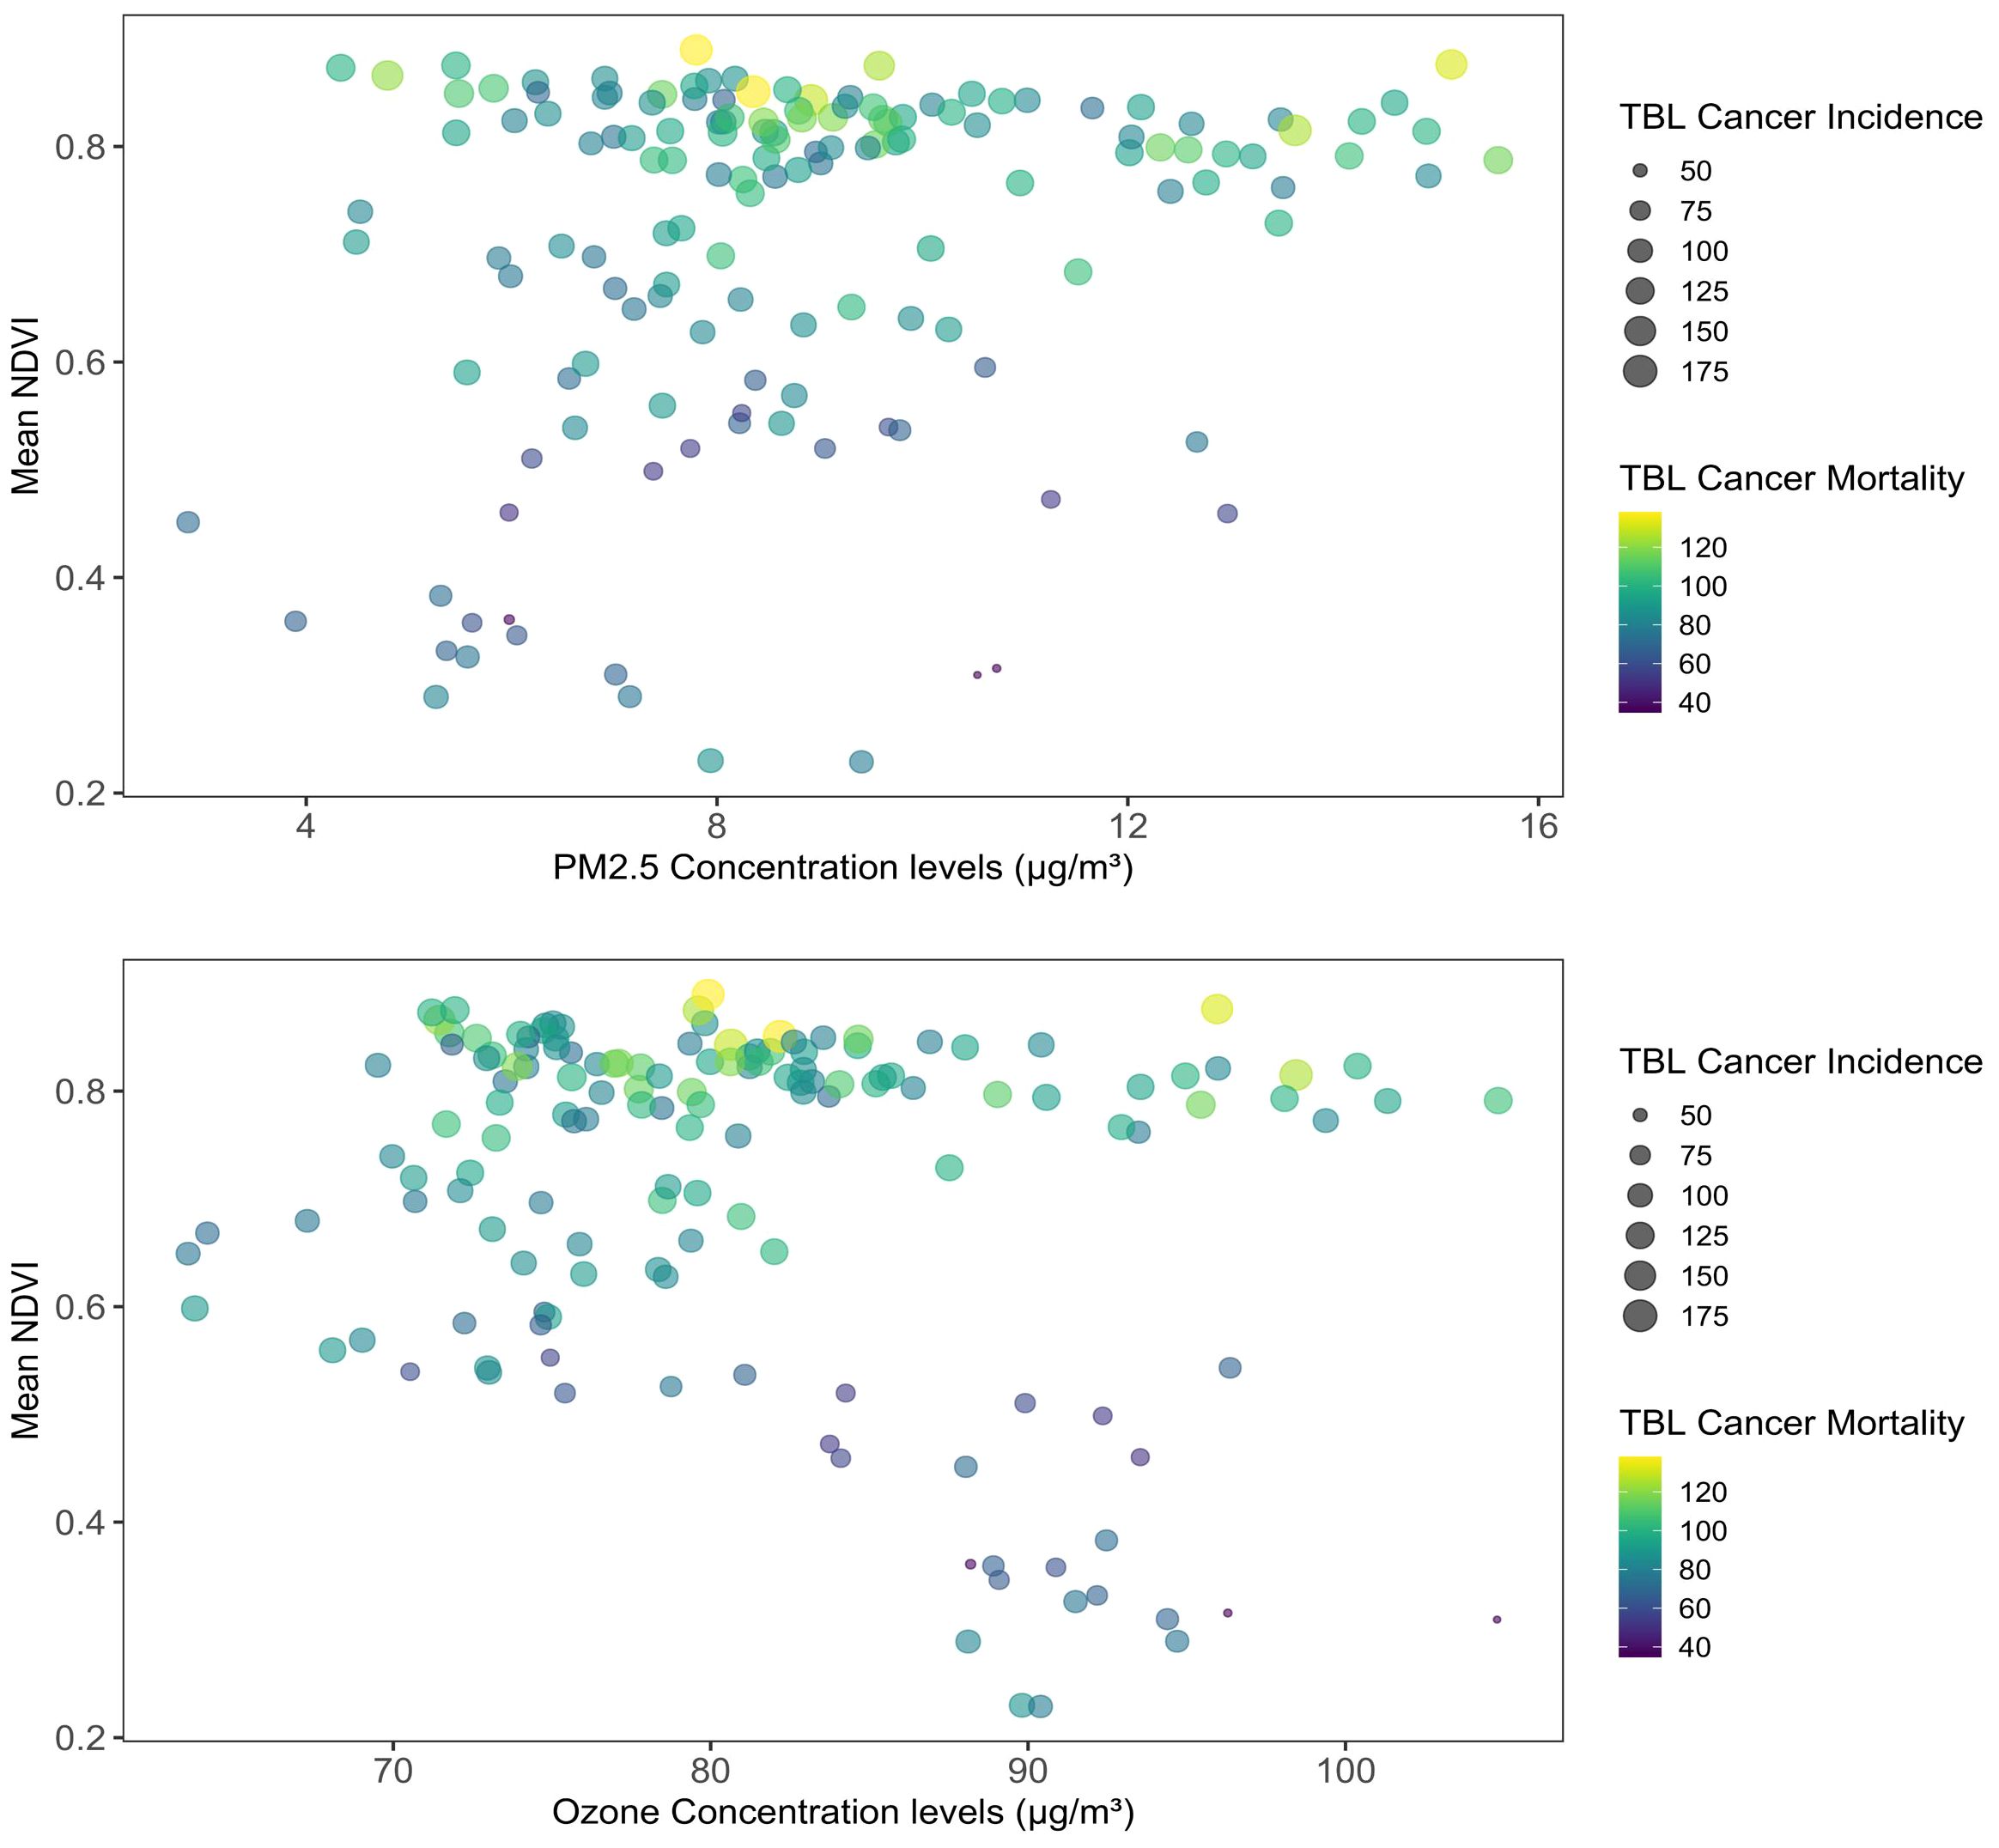
Figure 3 Mean NDVI and concentrations of PM2.5 and ozone across the states in the years 2007, 2013, 2019. Note: the left panel shows the association of the mean NDVI along the Y-axis and the PM2.5 or Ozone concentration levels on the X-axis. The size and colors of the bubbles measure the TBL cancer incidence and mortality of each state in the three time periods.
In this research, we investigated the relationship between greenspace, air pollutant concentration, and TBL cancer across different age groups at the state level in U.S. Our findings uncovered a direct relationship between the average NDVI and PM2.5 levels with TBL cancer rates across all age groups, particularly notable in the 20 to 54 age range. This study stands as the first at the state level to identify such a connection. In our examination of interactions, we noted positive correlations between ozone and NDVI, as well as between PM2.5 and tobacco consumption. Conversely, we observed negative associations between PM2.5 concentration and educational attainment as well as HDI, and between maximum NDVI and HDI in the GEE models analyzing TBL cancer data.
Several studies have investigated the impact of greenspace on TBL cancer and other types of cancer. These studies have identified variability in the observed relationships, influenced by factors such as the type of greenspace, method of exposure measurement, individual attributes, and geographic location. For instance, studies in France and Spain found different results depending on the type of greenery. In France, spending more time near farmland was positively linked to a higher chance of getting breast cancer. Meanwhile, in Spain, it was linked to a higher risk of getting any type of cancer (26, 45). While exposure to neighborhood-level greenspace in Australia is speculated to be linked to higher risks of having skin cancer (46). In addition to a cross-sectional study conducted in Philadelphia, when green parcels as tiny as 1m² are included as greenspace, there is a positive correlation between the density of greenspace and both overall and cause-specific mortality (47). A recent meta-analysis compiled data from nine papers investigating the link between greenspace exposure and lung cancer, eventually, the combined findings suggested no significant association (29). Therefore, the relationship between green space and health appears to be nuanced, potentially varying based on geographical context, study methodologies, and the techniques used to assess exposure in the studies (48).
In our analysis of the interaction between maximum NDVI and HDI, we observed a protective effect of high greenspace in areas with high HDI. We theorized those individuals residing in high socioeconomic status areas, compared to those in low-income regions, exhibited lower rates of TBL lung cancer and stronger health preservation. This may be attributed to the likelihood that individuals with higher incomes are more inclined to benefit from the protective effects of greenspaces (49, 50). Additionally, we observed a positive correlation between NDVI and ozone levels with all TBL cancer rates. We considered the possibility that greenspaces could emit hydrocarbons, such as isoprene and terpenes, which serve as precursors to ozone. These biogenic hydrocarbons might contribute to the development of TBL cancer (51). According to research conducted in California, there was a moderate association observed between ozone levels and patients diagnosed with either squamous cell carcinoma or adenocarcinoma, which are two subtypes of lung cancer (19).
In the analysis of 18 states with increasing net forest coverage, we observed the NDVI exhibited a protective effect with higher healthcare coverage, improved health status, and engagement in physical activities (Supplementary Table S3). This indicates that the health impacts of different types of green spaces are diverse. States with net increases in forest coverage exhibit a more significant and positive effect on health promotion compared to states with unchanged or decreasing green spaces, demonstrating a better fit between the health effects and the presence of green spaces (52).
Our study did not account for other air pollution as a possible mediator between greenspace exposure and TBL cancer. However, it is hypothesized that certain trees and plants may release pollen, exacerbating allergies, while other aspects of urban vegetation may impede air circulation, leading to the accumulation of air pollutants (51). A study conducted in Los Angeles found higher levels of PM2.5 in areas adjacent to greenspaces compared to the parks or the broader region (49). This underscores the importance of considering potential unintended consequences when increasing green space in urban areas. For instance, it may create conditions favorable for the survival of infectious pathogens, potentially contributing to the spread of diseases (53). However, despite these considerations, the evidence regarding the association between access to green space and physical activity remains inconclusive (54).
With regard to our analysis, there is a significant positive relation between PM2.5 with TBL cancer mortality, which was similar to mortality attributable to risk factors of ambient particular pollution in the GBD compare visualization tool and one related research (55). As an avoidable cause of TBL cancer, attention to outdoor air pollution had perhaps been distracted away owing to the dominance of tobacco smoking. It is generally accepted that hazardous ambient emissions could be reduced to improve air quality, thus improving the morbidity and mortality of lung cancer (56). Interestingly, research on PM2.5 exposure in Europe, Japan, and Canada has uncovered several significant findings. Both long-term and short-term exposure to PM2.5 can contribute to lung cancer. Moreover, even exposure levels lower than the current EU limit values and possibly the WHO Air Quality Guidelines have been linked to lung cancer risk (12, 57, 58). In a population study conducted in Pennsylvania, researchers observed “U-shaped” dose-response curves, suggesting that both low and high exposures to PM10 can have a similar impact on lung cancer survival (18). In a cohort study in Canada, researchers applied a newly developed class of concentration-response models and observed sublinear associations between lung cancer incidence and PM2.5 (58). However, due to socioeconomic inequalities such as ethnicity, income level geography specificity, and so on, it is challenging to determine whether disparities in air pollution have been rising or falling in U.S (59). A study of U.S. veterans found that black individuals and those in socioeconomically deprived areas face a higher risk of PM2.5-related deaths from non-accidental and non-communicable causes, highlighting the impact of socioeconomic and racial factors (60).
In our interaction analysis, we found protective effects between PM2.5 and HDI, as well as educational level, respectively. Increased indoor PM2.5 concentrations were noted in rural U.S. households during winter, especially among those using wood stoves for heating. Additionally, urbanization overall has a notably positive impact on HDI (61, 62). Educational interventions have demonstrated efficacy in lowering indoor PM2.5 levels in specific subsets of households studied (63). It’s worth noting that air pollution can impact school performance, particularly in test scores. Air pollution does affect school performance, in particular test scores (64, 65). Regarding the combined effects of air pollution and smoking, we observed significant positive associations between PM2.5 and tobacco use. Hence, it is crucial to assess the risks of air pollution-related lung cancer alongside smoking risks. Remarkably, individuals with lung cancer who have never smoked showed significant associations with ambient air pollution exposure, compared to those who have ever smoked. Hence, it is vital to consider cumulative exposure to ambient air pollutants when assessing the risk of developing lung cancer, alongside accurately quantifying traditional risk factors like smoking. As smoking prevalence continues to decrease, the lung cancer risks associated with long-term current and previous ambient air quality may become relatively more important to public health (66).
Our subgroup analyses based on age revealed some evidence of effect modification by selected individual characteristics. The TBL cancer mortality of 20–54 years subgroup was found to be strongest and positively associated with all the variables. Age appeared to modify the association between TBL cancer and exposure to PM2.5, with stronger impacts among young individuals compared to the elderly. This finding is consistent with a cohort study in Canada, which also indicated a tendency for stronger associations between lung cancer incidence with PM2.5 among younger adults (58). We attributed our findings to several factors distinguishing young adults from the elderly. For instance, they exhibit varying patterns of response to negative stimuli, with older adults showing different mobility performance compared to their younger counterparts. Additionally, young adults may not experience increased self-confidence due to their greater reliance on the Internet for cancer care. Notably, there are significant differences in immune profiles between adults and the elderly among colorectal cancer patients. A study conducted in U.S. revealed that the elderly group had notably higher levels of monocyte chemoattractant protein-1 (MCP-1) and lower levels of epidermal growth factor (EGF) compared to adults (67–71).
Our study has a few limitations, one of which is the constrained accessibility of the EPA air quality monitoring network for measuring state-level air pollutant concentrations in specific cities. For greenspace, our measure of state-wide greenness was rather crude in that it lacked specification of the space type. Annual green space may be influenced by weather and geographical characteristics. Furthermore, contact with green space is indirect, complex, and multidimensional exposure. Green space including agriculture, lawns, forests, wetlands, and gardens, may contribute differently to public health. The risk of TBL cancer is influenced by numerous factors, and our findings regarding the association between green space exposure, air pollutants, socioeconomic factors, and TBL cancer should be interpreted cautiously. The benefits offered by green space may be overshadowed by other conditions and accompanying lifestyles. Additionally, our study’s findings may not apply to other regions globally due to differences in urban morphology, air quality improvement efforts, and car-oriented lifestyles, particularly in U.S. Unfortunately, we lacked information on other significant factors potentially related to cancer, which could confound our analyses. There is an urgent need for standardized methods of analysis when considering green space exposure and its various forms. Existing and future studies focusing on greenness in specific areas should be interpreted with caution (72). The characteristics such as access, biodiversity, facilities, and aesthetics would influence green spaces when exerting their health benefits to the public (73, 74). Future studies should aim to adjust for a comprehensive set of covariates, assess the quality of greenspace, and explore the association of greenspace exposure with different cancer subtypes (20, 23, 29, 75, 76).
In U.S., the distribution of greenspace and air pollution concentrations varies from east to west, with both factors being linked to TBL cancer along with distinct socioeconomic variables and other correlated risk factors. This study represents the first attempt to investigate the relationship between greenspace, air pollutants, socioeconomic factors, and TBL cancer at the state level in U.S. By correlating and contrasting with existing research on air pollution, greenspace, and various diseases, this study contributes to a better understanding of the association between the natural environment and health issues.
The original contributions presented in the study are included in the article/Supplementary Material. Further inquiries can be directed to the corresponding authors.
JZ: Conceptualization, Writing – original draft, Writing – review & editing. RR: Conceptualization, Data curation, Methodology, Validation, Writing – original draft, Writing – review & editing. NB: Conceptualization, Data curation, Formal analysis, Writing – review & editing. MP: Conceptualization, Writing – review & editing. NX: Conceptualization, Writing – original draft, Writing – review & editing. PL: Conceptualization, Data curation, Writing – original draft, Writing – review & editing. WB: Conceptualization, Data curation, Writing – original draft, Writing – review & editing. ZM: Conceptualization, Data curation, Writing – review & editing, Writing – original draft. HP: Conceptualization, Data curation, Writing – original draft, Writing – review & editing. KV: Formal analysis, Writing – review & editing. VN: Writing – review & editing. RF: Conceptualization, Writing – review & editing. JL: Writing – original draft, Writing – review & editing.
The author(s) declare financial support was received for the research, authorship, and/or publication of this article. This study was supported by the Henan Province Medical Science and Technology Research Program Joint Construction Project (No. LHGJ20190203). The funder has no role, if any, in the writing of the manuscript or the decision to submit it for publication.
The authors thank the supporting staff of the cancer center, The First affiliated hospital of Zhengzhou University.
The authors declare that the research was conducted in the absence of any commercial or financial relationships that could be construed as a potential conflict of interest.
All claims expressed in this article are solely those of the authors and do not necessarily represent those of their affiliated organizations, or those of the publisher, the editors and the reviewers. Any product that may be evaluated in this article, or claim that may be made by its manufacturer, is not guaranteed or endorsed by the publisher.
The Supplementary Material for this article can be found online at: https://www.frontiersin.org/articles/10.3389/fonc.2024.1398679/full#supplementary-material
1. Siegel RL, Miller KD, Wagle NS, Jemal A. Cancer statistics, 2023. CA Cancer J Clin. (2023) 73:17–48. doi: 10.3322/caac.21763
2. Sung H, Ferlay J, Siegel RL, Laversanne M, Soerjomataram I, Jemal A, et al. Global cancer statistics 2020: GLOBOCAN estimates of incidence and mortality worldwide for 36 cancers in 185 countries. CA: A Cancer J Clin. (2021) 71:209–49. doi: 10.3322/caac.21660
3. Deng Y, Zhao P, Zhou L, Xiang D, Hu J, Liu Y, et al. Epidemiological trends of tracheal, bronchus, and lung cancer at the global, regional, and national levels: a population-based study. J Hematol Oncol. (2020) 13:98. doi: 10.1186/s13045-020-00915-0
5. IARC. Outdoor air pollution. IARC monographs on the evaluation of carcinogenic risks to humans (2016), 1–454.
6. Collaborators GBDRF. Global, regional, and national comparative risk assessment of 84 behavioural, environmental and occupational, and metabolic risks or clusters of risks for 195 countries and territories, 1990-2017: a systematic analysis for the Global Burden of Disease Study 2017. Lancet. (2018) 392:1923–94. doi: 10.1016/S0140-6736(18)32225-6
7. Zhou Z, Xinyi S, Zejun L, Xi Y, Xiaoliang B, Holmes MA, et al. Association between particulate matter (PM) 2· 5 air pollution and clinical antibiotic resistance: a global analysis. Lancet Planet Health. (2023) 7(8):e649–59.
8. Xue Y, Wang L, Zhang Y, Zhao Y, Liu Y. Air pollution: A culprit of lung cancer. J Hazard Mater. (2022) 434:128937. doi: 10.1016/j.jhazmat.2022.128937
9. Ledford H. How air pollution causes lung cancer - without harming DNA. Nature. (2023) 616(7957):419–20. doi: 10.1038/d41586-023-00989-z
10. Balmain A. Air pollution’s role in the promotion of lung cancer. Nature. (2023) 35–36. doi: 10.1038/d41586-023-00929-x
11. Hill W, Lim E, Weeden C, Lee C, Augustine M, Chen K, et al. Lung adenocarcinoma promotion by air pollutants. Nature. (2023) 616:159–67. doi: 10.1038/s41586-023-05874-3
12. Hvidtfeldt UA, Severi G, Andersen ZJ, Atkinson R, Bauwelinck M, Bellander T, et al. Long-term low-level ambient air pollution exposure and risk of lung cancer - A pooled analysis of 7 European cohorts. Environ Int. (2021) 146:106249. doi: 10.1016/j.envint.2020.106249
13. Gharibvand L, Shavlik D, Ghamsary M, Beeson WL, Soret S, Knutsen R, et al. The association between ambient fine particulate air pollution and lung cancer incidence: results from the AHSMOG-2 study. Environ Health Perspect. (2017) 125:378–84. doi: 10.1289/EHP124
14. Raspanti GA, Hashibe M, Siwakoti B, Wei M, Thakur BK, Pun CB, et al. Household air pollution and lung cancer risk among never-smokers in Nepal. Environ Res. (2016) 147:141–5. doi: 10.1016/j.envres.2016.02.008
15. Myers R, Brauer M, Dummer T, Atkar-Khattra S, Yee J, Melosky B, et al. High-Ambient air pollution exposure among never smokers versus ever smokers with lung cancer. J Thorac Oncol. (2021) 16:1850–8. doi: 10.1016/j.jtho.2021.06.015
16. Tseng CH, Tsuang BJ, Chiang CJ, Ku KC, Tseng JS, Yang TY, et al. The relationship between air pollution and lung cancer in nonsmokers in Taiwan. J Thorac Oncol. (2019) 14:784–92. doi: 10.1016/j.jtho.2018.12.033
17. Lo W-C, Ho C-C, Tseng E, Hwang J-S, Chan C-C, Lin H-H. Long-term exposure to ambient fine particulate matter (PM2.5) and associations with cardiopulmonary diseases and lung cancer in Taiwan: a nationwide longitudinal cohort study. Int J Epidemiol. (2022) 51:1230–42. doi: 10.1093/ije/dyac082
18. McKeon TP, Anil V, Penning TM, Hwang WT. Air pollution and lung cancer survival in Pennsylvania. Lung Cancer. (2022) 170:65–73. doi: 10.1016/j.lungcan.2022.06.004
19. Eckel SP, Cockburn M, Shu YH, Deng H, Lurmann FW, Liu L, et al. Air pollution affects lung cancer survival. Thorax. (2016) 71:891–8. doi: 10.1136/thoraxjnl-2015-207927
20. Nieuwenhuijsen MJ. Green infrastructure and health. Annu Rev Public Health. (2021) 42:317–28. doi: 10.1146/annurev-publhealth-090419-102511
21. Connolly R, Lipsitt J, Aboelata M, Yanez E, Bains J, Jerrett M. The association of green space, tree canopy and parks with life expectancy in neighborhoods of Los Angeles. Environ Int. (2023) 173:107785. doi: 10.1016/j.envint.2023.107785
22. Porcherie M, Linn N, Le Gall AR, Thomas MF, Faure E, Rican S, et al. Relationship between urban green spaces and cancer: A scoping review. Int J Environ Res Public Health. (2021) 18(4):1751. doi: 10.3390/ijerph18041751
23. Yang BY, Zhao T, Hu LX, Browning M, Heinrich J, Dharmage SC, et al. Greenspace and human health: An umbrella review. Innovation (Camb). (2021) 2:100164. doi: 10.1016/j.xinn.2021.100164
24. Bereziartua A, Chen J, de Hoogh K, Rodopoulou S, Andersen ZJ, Bellander T, et al. Exposure to surrounding greenness and natural-cause and cause-specific mortality in the ELAPSE pooled cohort. Environ Int. (2022) 166:107341. doi: 10.1016/j.envint.2022.107341
25. Bauwelinck M, Casas L, Nawrot TS, Nemery B, Trabelsi S, Thomas I, et al. Residing in urban areas with higher green space is associated with lower mortality risk: A census-based cohort study with ten years of follow-up. Environ Int. (2021) 148:106365. doi: 10.1016/j.envint.2020.106365
26. Zare Sakhvidi MJ, Yang J, Siemiatycki J, Dadvand P, de Hoogh K, Vienneau D, et al. Greenspace exposure and cancer incidence: a 27-year follow-up of the French GAZEL cohort. Sci Total Environ. (2021) 787:147553. doi: 10.1016/j.scitotenv.2021.147553
27. Rodriguez-Loureiro L, Verdoodt F, Lefebvre W, Vanpoucke C, Casas L, Gadeyne S. Long-term exposure to residential green spaces and site-specific cancer mortality in urban Belgium: A 13-year follow-up cohort study. Environ Int. (2022) 170:107571. doi: 10.1016/j.envint.2022.107571
28. Huang YJ, Lee PH, Chen LC, Lin BC, Lin C, Chan TC. Relationships among green space, ambient fine particulate matter, and cancer incidence in Taiwan: A 16-year retrospective cohort study. Environ Res. (2022) 212:113416. doi: 10.1016/j.envres.2022.113416
29. Zare Sakhvidi MJ, Yang J, Mehrparvar AH, Dzhambov AM, Ebrahimi A, Dadvand P, et al. Exposure to greenspace and cancer incidence, prevalence, and mortality: A systematic review and meta-analyses. Sci Total Environ. (2022) 838(Pt 2):15618. doi: 10.1016/j.scitotenv.2022.156180
30. Thomas R, Rosenau P, Unruh LY, Barnes AJ. “United States: Health System Review.” Health systems in transition (2020) 22(2):1–441.
31. Global burden of disease study 2019 (GBD 2019) results. Seattle, United States: Institute for Health Metrics and Evaluation (IHME (2020). Available at: https://vizhub.healthdata.org/gbd-results/.
32. Diseases GBD, Injuries C. Global burden of 369 diseases and injuries in 204 countries and territories, 1990-2019: a systematic analysis for the Global Burden of Disease Study 2019. Lancet. (2020) 396:1204–22. doi: 10.1016/S0140-6736(20)30925-9
33. Pilant A, Endres K, Rosenbaum D, Gundersen G. US EPA EnviroAtlas meter-scale urban land cover (MULC): 1-m pixel land cover class definitions and guidance. Remote Sens. (2020) 12:1909.
34. Tucker CJ. Red and photographic infrared linear combinations for monitoring vegetation. United States: NASA Center for Aerospace Information (CASI (1978).
35. Savtchenko A, Ouzounov D, Ahmad S, Acker J, Leptoukh G, Koziana J, et al. Aqua MODIS products available from NASA GES DAAC. Adv Space Res. (2004) 34(4):710–4. doi: 10.1016/j.asr.2004.03.012
37. NOAA National Centers for Environmental information. Climate at Glance: Statewide Mapping (2023). Available online at: https://www.ncei.noaa.gov/access/monitoring/climate-at-a-glance/statewide/mapping.
38. U.S. Bureau of Economic Analysis. "SASUMMARY State annual summary statistics: personal income, GDP, consumer spending, price indexes, and employment" (Accessed September 14, 2023).
39. Available online at: https://www.census.gov/data/tables/time-series/dec/density-data-text.html.
40. Dobkin F, Kerr G. Demographic disparities in United States Clean Air Act PM2. 5 attainment counties: assessing population living in nonattainment conditions. J Environ Stud Sci. (2024) 1–12.
41. Smoke Centers for Disease Control and Prevention, National Center for Chronic Disease Prevention and Health Promotion. Division of population health. BRFSS prevalence & Trends data (2015). Available online at: https://www.cdc.gov/brfss/brfssprevalence/.
42. Data retrieved from the Subnational HDI Database of the Global Data Lab . Available online at: https://globaldatalab.org/shdi/.
43. Wang C, Zheng W, Yongjie X, Yadi Z, Zilin L, Wei C, et al. Disparities in the global burden of tracheal, bronchus, and lung cancer from 1990 to 2019. Chinese Medical Journal Pulmonary and Critical Care Medicine. (2023) 1:36–45. doi: 10.1016/j.pccm.2023.02.001
44. Accessed through global forest watch on 04/10/2022 . Available online at: www.globalforestwatch.org.
45. O'Callaghan-Gordo C, Kogevinas M, Cirach M, Castano-Vinyals G, Aragones N, Delfrade J, et al. Residential proximity to green spaces and breast cancer risk: The multicase-control study in Spain (MCC-Spain). Int J Hyg Environ Health. (2018) 221:1097–106. doi: 10.1016/j.ijheh.2018.07.014
46. Astell-Burt T, Feng X, Kolt GS. Neighbourhood green space and the odds of having skin cancer: multilevel evidence of survey data from 267072 Australians. J Epidemiol Community Health. (2014) 68:370–4. doi: 10.1136/jech-2013-203043
47. Wang H, Tassinary LG. Effects of greenspace morphology on mortality at the neighbourhood level: a cross-sectional ecological study. Lancet Planet Health. (2019) 3:e460–8. doi: 10.1016/S2542-5196(19)30217-7
48. Mueller W, Milner J, Loh M, Vardoulakis S, Wilkinson P. Exposure to urban greenspace and pathways to respiratory health: An exploratory systematic review. Sci Total Environ. (2022) 829:154447. doi: 10.1016/j.scitotenv.2022.154447
49. Su JG, Jerrett M, de Nazelle A, Wolch J. Does exposure to air pollution in urban parks have socioeconomic, racial or ethnic gradients? Environ Res. (2011) 111:319–28. doi: 10.1016/j.envres.2011.01.002
50. The trust for public land, in: 2018 city park facts (2018). Available online at: www.tpl.org/cityparkfacts (Accessed 3 Sepetember 2023).
51. Hartig T, Mitchell R, de Vries S, Frumkin H. Nature and health. Annu Rev Public Health. (2014) 35:207–28. doi: 10.1146/annurev-publhealth-032013-182443
52. Watson JEM, Evans T, Venter O, Watson JEM, Evans T, Venter O, et al. The exceptional value of intact forest ecosystems. Nat Ecol Evol. (2018) 2:599–610. doi: 10.1038/s41559-018-0490-x
53. Lohmus M, Balbus J. Making green infrastructure healthier infrastructure. Infect Ecol Epidemiol. (2015) 5:30082. doi: 10.3402/iee.v5.30082
54. Lachowycz K, Jones AP. Greenspace and obesity: a systematic review of the evidence. Obes Rev. (2011) 12:e183–189. doi: 10.1111/j.1467-789X.2010.00827.x
55. Safiri S, Sohrabi MR, Carson-Chahhoud K, Bettampadi D, Taghizadieh A, Almasi-Hashiani A, et al. Burden of tracheal, bronchus, and lung cancer and its attributable risk factors in 204 countries and territories, 1990 to 2019. J Thorac Oncol. (2021) 16(6):945–59.
56. Kamis A, Cao R, He Y, Tian Y, Wu C. Predicting lung cancer in the United States: A multiple model examination of public health factors. Int J Environ Res Public Health. (2021) 18(11):6127. doi: 10.3390/ijerph18116127
57. Ma C, Jung CR, Nakayama SF, Tabuchi T, Nishihama Y, Kudo H, et al. Short-term association of air pollution with lung cancer mortality in Osaka, Japan. Environ Res. (2023) 224:115503. doi: 10.1016/j.envres.2023.115503
58. Bai L, Shin S, Burnett RT, Kwong JC, Hystad P, van Donkelaar A, et al. Exposure to ambient air pollution and the incidence of lung cancer and breast cancer in the Ontario Population Health and Environment Cohort. Int J Cancer. (2020) 146:2450–9. doi: 10.1002/ijc.32575
59. Jbaily A, Zhou X, Liu J, Lee TH, Kamareddine L, Verguet S, et al. Air pollution exposure disparities across US population and income groups. Nature. (2022) 601:228–33. doi: 10.1038/s41586-021-04190-y
60. Bowe B, Xie Y, Yan Y, Al-Aly Z. Burden of cause-specific mortality associated with PM2.5 air pollution in the United States. JAMA Netw Open. (2019) 2:e1915834. doi: 10.1001/jamanetworkopen.2019.15834
61. Tripathi S. How does urbanization affect the human development index? A cross-country analysis. Asia-Pacific J Regional Sci. (2021) 5:1053–80. doi: 10.1007/s41685-021-00211-w
62. Walker ES, Noonan CW, Semmens EO, Ware D, Smith P, Boyer BB, et al. Indoor fine particulate matter and demographic, household, and wood stove characteristics among rural US homes heated with wood fuel. Indoor Air. (2021) 31:1109–24. doi: 10.1111/ina.12808
63. Walker ES, Noonan CW, Belcourt A, Boulafentis J, Garcia C, Graham J, et al. Efficacy of air filtration and education interventions on fine particulate matter among rural Native American homes heated with wood stoves: Results from the EldersAIR randomized trial. Sci Total Environ. (2022) 843:157029. doi: 10.1016/j.scitotenv.2022.157029
64. Miller SJ, Vela MA. The effects of air pollution on educational outcomes: evidence from Chile. IDB Publications (Working Papers) 4756, Inter-American Development Bank (2013).
65. Balakrishnan U, Tsaneva M. Air pollution and academic performance: Evidence from India. World Dev. (2021) 146:105553. doi: 10.1016/j.worlddev.2021.105553
66. Lipfert FW, Wyzga RE. Longitudinal relationships between lung cancer mortality rates, smoking, and ambient air quality: a comprehensive review and analysis. Crit Rev Toxicol. (2019) 49:790–818. doi: 10.1080/10408444.2019.1700210
67. Fernandez-Aguilar L, Latorre JM, Martinez-Rodrigo A, Moncho-Bogani JV, Ros L, Latorre P, et al. Differences between young and older adults in physiological and subjective responses to emotion induction using films. Sci Rep. (2020) 10:14548. doi: 10.1038/s41598-020-71430-y
68. van der Kruk E, Strutton P, Koizia LJ, Fertleman M, Reilly P, Bull AMJ. Why do older adults stand-up differently to young adults?: investigation of compensatory movement strategies in sit-to-walk. NPJ Aging. (2022) 8:13. doi: 10.1038/s41514-022-00094-x
69. Eng L, Bender J, Hueniken K, Kassirian S, Yang D, Mitchell L, et al. et al: Cancer care-related social media (SM) and internet usage differences between adolescents and young adults (AYA), adults and elderly patients with cancer. Ann Oncol. (2018) 29(Suppl 8):VIII624. doi: 10.1093/annonc/mdy300.065
70. Budhi IB, Bagus MI, Ayu SI, Darmawan I, Widyanti S, Kristanto YY. The immune profiles in young, adult and elderly of advanced stage colorectal cancer patients. Ann Oncol. (2019) 30(Suppl 11):XI6. doi: 10.1093/annonc/mdz447.018
71. Valiathan R, Ashman M, Asthana D. Effects of ageing on the immune system: infants to elderly. Scand J Immunol. (2016) 83:255–66. doi: 10.1111/sji.12413
72. Fuertes E, Markevych I, von Berg A, Bauer CP, Berdel D, Koletzko S, et al. Greenness and allergies: evidence of differential associations in two areas in Germany. J Epidemiol Community Health. (2014) 68:787–90. doi: 10.1136/jech-2014-203903
73. Knobel P, Dadvand P, Alonso L, Costa L, Español M, Maneja R. Development of the urban green space quality assessment tool (RECITAL). Urban Forestry Urban Greening. (2021) 57(126895). doi: 10.1016/j.ufug.2020.126895
74. Knobel P, Dadvand P, Maneja-Zaragoza R. A systematic review of multi-dimensional quality assessment tools for urban green spaces. Health Place. (2019) 59 (102198). doi: 10.1016/j.healthplace.2019.102198
75. Nguyen PY, Astell-Burt T, Rahimi-Ardabili H, Feng X. Green space quality and health: A systematic review. Int J Environ Res Public Health. (2021) 18(21):11028. doi: 10.3390/ijerph182111028
Keywords: air pollutants, particulate matter, greenspace, TBL cancer, age groups
Citation: Zhao J, Ren R, Beeraka NM, PA M, Xue N, Lu P, Bai W, Mao Z, PR HV, Bulygin KV, Nikolenko VN, Fan R and Liu J (2024) Correlation of time trends of air pollutants, greenspaces and tracheal, bronchus and lung cancer incidence and mortality among the adults in United States. Front. Oncol. 14:1398679. doi: 10.3389/fonc.2024.1398679
Received: 10 March 2024; Accepted: 08 July 2024;
Published: 25 July 2024.
Edited by:
Chitra Thakur, Stony Brook University, United StatesReviewed by:
Mohammad Salehi, Golestan University of Medical Sciences, IranCopyright © 2024 Zhao, Ren, Beeraka, PA, Xue, Lu, Bai, Mao, PR, Bulygin, Nikolenko, Fan and Liu. This is an open-access article distributed under the terms of the Creative Commons Attribution License (CC BY). The use, distribution or reproduction in other forums is permitted, provided the original author(s) and the copyright owner(s) are credited and that the original publication in this journal is cited, in accordance with accepted academic practice. No use, distribution or reproduction is permitted which does not comply with these terms.
*Correspondence: Junqi Liu, ZmNjbGl1anFAenp1LmVkdS5jbg==; Narasimha M. Beeraka, Ym5tdXJ0aHkyNEBnbWFpbC5jb20=; YmlyYWthX25Ac3RhZmYuc2VjaGVub3YucnU=
†These authors have contributed equally to this work
Disclaimer: All claims expressed in this article are solely those of the authors and do not necessarily represent those of their affiliated organizations, or those of the publisher, the editors and the reviewers. Any product that may be evaluated in this article or claim that may be made by its manufacturer is not guaranteed or endorsed by the publisher.
Research integrity at Frontiers
Learn more about the work of our research integrity team to safeguard the quality of each article we publish.