 Huiling Shi1,2Yong Tan3Chao Ma1,2Yushan Wei1,2Fengling Shi1,2
 Juan Wang1,2Caihua Xu4*
 Rongrui Liang1,2,4*
- 1Department of Oncology, The Fourth Affiliated Hospital of Soochow University, Suzhou, China
- 2Division of Clinical Oncology, Medical Center of Soochow University, Suzhou, China
- 3School of Physical Education, Soochow University, Suzhou, China
- 4Department of Oncology, The First Affiliated Hospital of Soochow University, Suzhou, China
Objective: To evaluate the efficacy and safety of various first-line initial treatment systemic regimens for patients with unresectable esophageal squamous carcinoma(ESCC), utilizing a network meta-analysis approach.
Methods: A comprehensive search for randomized controlled trials focusing on the primary treatment of esophageal cancer ESCC was conducted across multiple databases including PubMed, Embase, Cochrane Library, and Web of Science, up until November 17, 2023. The quality of the included studies was rigorously assessed using Review Manager software. Subsequently, data analysis was meticulously carried out employing R software. The first-line treatment regimens examined were: CD (Cisplatin + Docetaxel), CET-CF (Cetuximab + Cisplatin + Fluorouracil), CF (Cisplatin + Fluorouracil), N-CF (Nivolumab + Cisplatin + Fluorouracil), NI (Nivolumab + Ipilimumab), Nim-CF (Nimotuzumab + Cisplatin + Fluorouracil), P-CF (Pembrolizumab + Cisplatin + Fluorouracil), and Ser-CF (Serplulimab + Cisplatin + Fluorouracil). The Primary endpoints included the overall survival(OS),progression-free survival (PFS),objective response rate (ORR) and disease control rate (DCR).The secondary endpoint was adverse effects(AEs).
Results: The analysis encompassed eight studies, incorporating a total of 3,051 patients with untreated esophageal cancer. There are 45 people in the CD regimen,32 in the CET-CF regimen,1,212 in the CF regimen,447 in the N-CF regimen,456 in the NI regimen,53 in the Nim-CF regimen,447 in the P-CF regimen and 368 in the Ser-CF regimen. The network meta-analysis revealed that, in comparison to the CF regimen, the other regimens (CD, CET-CF, N-CF, NI, Nim-CF, P-CF, and Ser-CF) did not demonstrate a statistically significant impact on overall survival (OS) or progression-free survival (PFS). However, Ser-CF potentially offers superior outcomes in terms of OS and PFS when juxtaposed with other regimens. Notably, N-CF was associated with a substantial increase in the objective response rate (ORR), and CET-CF markedly improved the disease control rate (DCR). In terms of adverse effects, N-CF was more likely to cause anorexia, whereas CET-CF was significantly associated with nausea, vomiting, neutropenia, and skin disorders.
Conclusion: The current evidence suggests that N-CF may provide the most favorable outcomes in terms of ORR, while CET-CF could be the optimal choice for enhancing DCR in patients with untreated esophageal cancer.
1 Introduction
Esophageal cancer is recognized as a highly lethal malignancy with a rapidly rising global incidence. Notably, it stands as the fourth most common cause of cancer-related mortality worldwide, showcasing a 5-year survival rate between 15% and 25%. The disease poses a significant challenge to public health. Predominantly, esophageal cancer manifests in two primary histological forms: esophageal adenocarcinoma (EADC) and esophageal squamous cell carcinoma (ESCC), with the latter being more common (1). Particularly in developed nations, EADC tends to be the prevalent diagnosis among esophageal cancer patients. Contrastingly, in China, ESCC accounts for over 90% of cases, especially prevalent in the northern Taihang Mountains region, where it stands as the leading cause of death (2).
The development of ESCC is closely linked with factors such as low socioeconomic status, consumption of tobacco and alcohol, ingestion of hot beverages, and exposure to nitrosamines. Additionally, insufficient levels of micronutrients like vitamin C, vitamin E, and folate are also implicated in ESCC risk. Conversely, risk factors for EADC include conditions like Barrett’s esophagus, gastroesophageal reflux disease (GERD), obesity, and tobacco use (3). Esophageal cancer ESCC is known for its aggressive nature and tendency to be diagnosed at advanced stages due to the typically late emergence of symptoms. For years, the CF regimen (Cisplatin + fluorouracil) was the standard treatment, yet its efficacy in tumor suppression is suboptimal (4), the prevalence of esophageal cancer remains high (5). Recent years have witnessed significant strides in cancer treatment, particularly with the advent of targeted therapies and immunotherapies. Notably, the effectiveness of pembrolizumab in combination with chemotherapy over chemotherapy alone has been documented (6). Moreover, positive outcomes from the Checkmate 649 study have positioned Nivolumab combined with chemotherapy as a frontline therapy for advanced EADC (7). Additionally, the combination of Nivolumab and Ipilimumab (NI) has received approval for treating advanced ESCC patients (8).
Presently, a variety of first-line treatment options are available, including CF, CD, CET-CF, N-CF, NI, Nim-CF, P-CF, and Ser-CF. However, the absence of direct comparisons among these treatments and the urgent need to identify the most effective approach have led us to pursue a meta-analysis. Our endeavor aims to clarify the debate over the optimal treatment regimen, potentially offering novel references for future clinical applications.
2 Methods and materials
2.1 Literature search
A systematic review was performed to assess the effectiveness and safety of first-line treatments for esophageal cancer. This review entailed a computer-based search of randomized controlled trials (RCTs) within the Cochrane, PubMed, Embase, and Web of Science databases, culminating on November 17, 2023. The search methodology incorporated a blend of controlled vocabulary terms and free-text keywords including “esophageal cancer,” “newly diagnosed,” “untreated,” “first-line,” “front-line,” and “initial.” The specifics of the search strategies are delineated in Suplementary Table S1.
2.2 Inclusion and exclusion criteria
Inclusion Criteria: This review rigorously selected studies involving adult patients who have been diagnosed with esophageal cancer. The interventions scrutinized included Cisplatin and Docetaxel (CD), Cisplatin, Epirubicin, and Capecitabine (CET-CF), Nedaplatin and Capecitabine (N-CF), Nedaplatin and Irinotecan (NI), Nimotuzumab and Capecitabine (Nim-CF), Paclitaxel and Capecitabine (P-CF), and S-1 and Capecitabine (Ser-CF), compared against a control group receiving Capecitabine (CF) alone. The primary objectives of this review were to assess overall survival (OS), progression-free survival (PFS), the objective response rate (ORR), and the disease control rate (DCR). Secondary outcomes were focused on the evaluation of adverse events. Only studies designed as randomized controlled trials (RCTs) met the criteria for inclusion.
Exclusion Criteria: The review excluded studies if they were redundant publications, animal research, case reports, conference abstracts, or reviews. Furthermore, studies were excluded if they included patients with concurrent organic diseases.
2.3 Data extraction
The selection of studies was meticulously undertaken by two authors, who independently applied the pre-established inclusion and exclusion criteria. Any discrepancies that arose during this process were amicably resolved through mutual discussion between the authors. If a consensus could not be reached, the matter was escalated to a third, neutral party for arbitration. The data harvested from the studies that met these criteria encompassed critical variables, including but not limited to the primary author’s name, the year of publication, the country of origin, the sample size, the distribution of participants by gender, their ages, the ECOG (Eastern Cooperative Oncology Group) performance status, the nature of the interventions administered, and the metrics used to gauge the outcomes.
2.4 Quality assessment
The evaluation of bias risk was conducted in accordance with the most current guidelines stipulated by the Cochrane Risk of Bias Assessment Tool 2.0 (ROB 2.0) (9). This comprehensive tool outlines five critical domains to scrutinize: bias emerging from the randomization process, bias resulting from deviations from the intended interventions, bias associated with missing outcome data, bias in the measurement of outcomes, and bias in the selection of reported results. The assessment of quality categorized the studies into three distinct levels: “low risk of bias,” “some concerns,” or “high risk of bias.” To ensure reliability, the findings were independently verified by two reviewers. Any inconsistencies identified during this process were meticulously addressed, either by reaching a consensus through discussion or, if necessary, by seeking the judgment of a third party.
2.5 Data analysis
A Bayesian network meta-analysis was performed utilizing R software version 4.2.3 (R Foundation for Statistical Computing) (10, 11), adopting a priori vague random-effects models. The analysis employed Markov chain Monte Carlo techniques, as described by (12), to derive optimal combined estimates and associated probabilities for each treatment option. For representing survival data, hazard ratios (HRs) and their 95% credible intervals (CIs) were used, while binary outcomes were depicted through odds ratios (ORs) and their 95% CIs.
The Surface Under the Cumulative Ranking curve (SUCRA) was calculated to gauge the likelihood of each intervention being the most effective. Network and funnel plots were generated using STATA version 15.0, utilizing a direct macro command for their creation. In the network plot, drugs are represented by circles, with the size of each circle being proportional to the number of patients included in the respective trials. The links between circles (edges) denote the direct comparisons available between drugs. Furthermore, cumulative probability distributions were visualized using the ggplot2 package in R.
3 Results
3.1 Data screening process and results
An initial search of the databases retrieved a total of 1,737 articles. After the elimination of duplicates, this number was reduced to 407. A detailed screening of titles and abstracts led to the exclusion of 1,263 articles. Further scrutiny through full-text review resulted in the removal of 69 more articles. Ultimately, eight articles (13–20) were selected for in-depth analysis, as depicted in Figure 1.
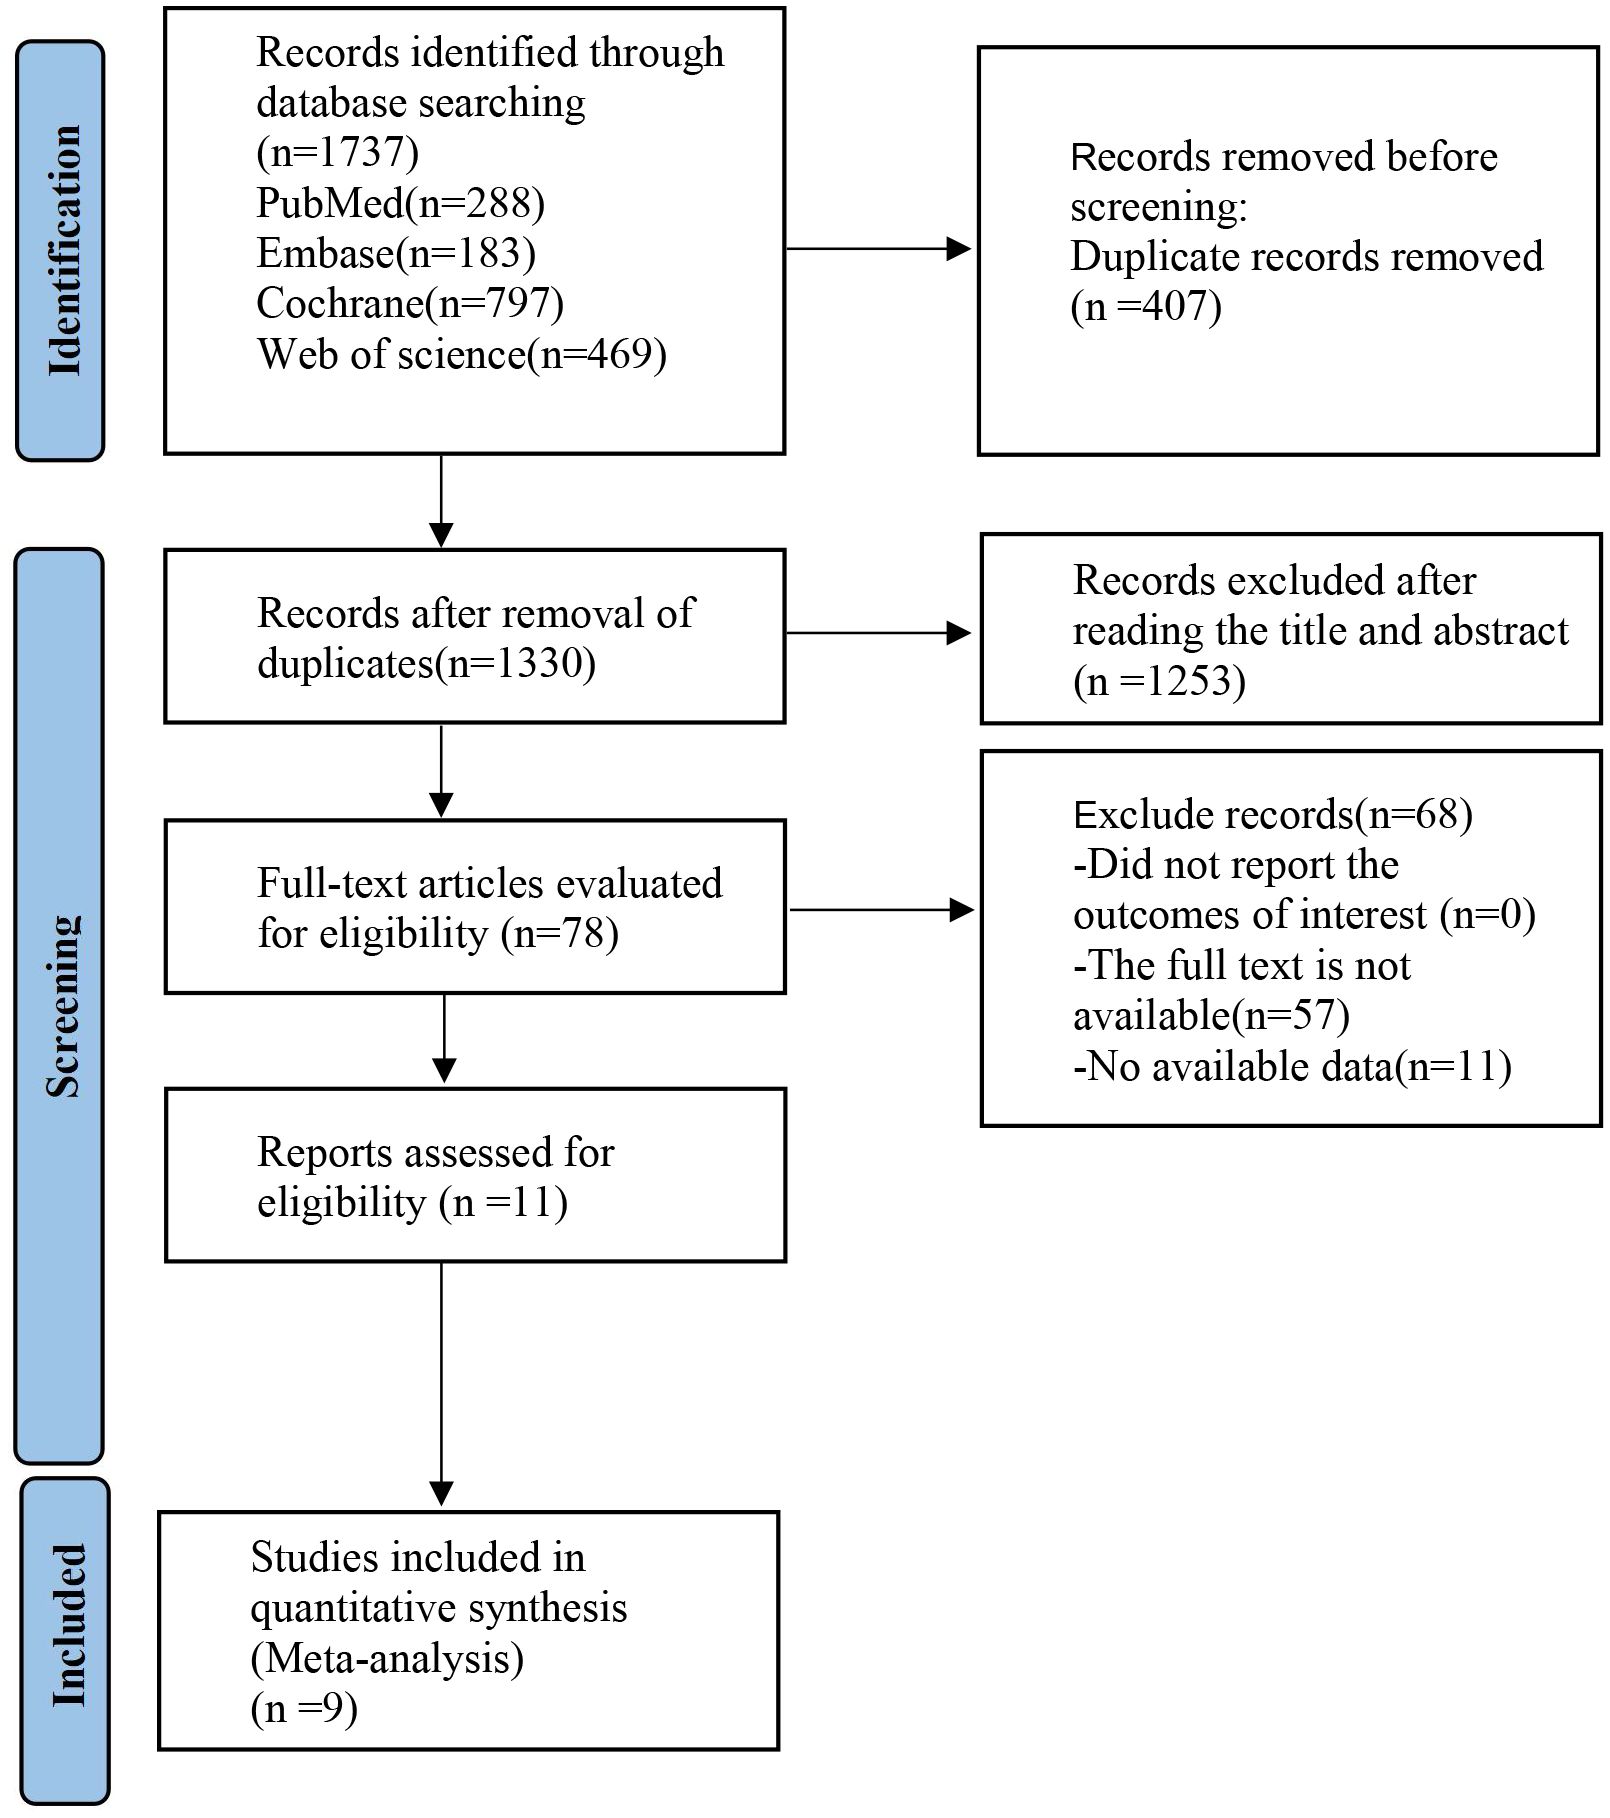
Figure 1. Literature search flowchart.
3.2 Basic characteristics of included studies and risk of bias assessment
The analysis encompassed eight articles, comprising a total of 3051 untreated esophageal cancer patients. Specific characteristics of the included studies can be found in Table 1. All studies included in this analysis clearly described their blinding methods. High risk primarily stemmed from deviations in the expected intervention measures, and the risk of bias assessment for the included studies can be found in Figures 2 and 3.
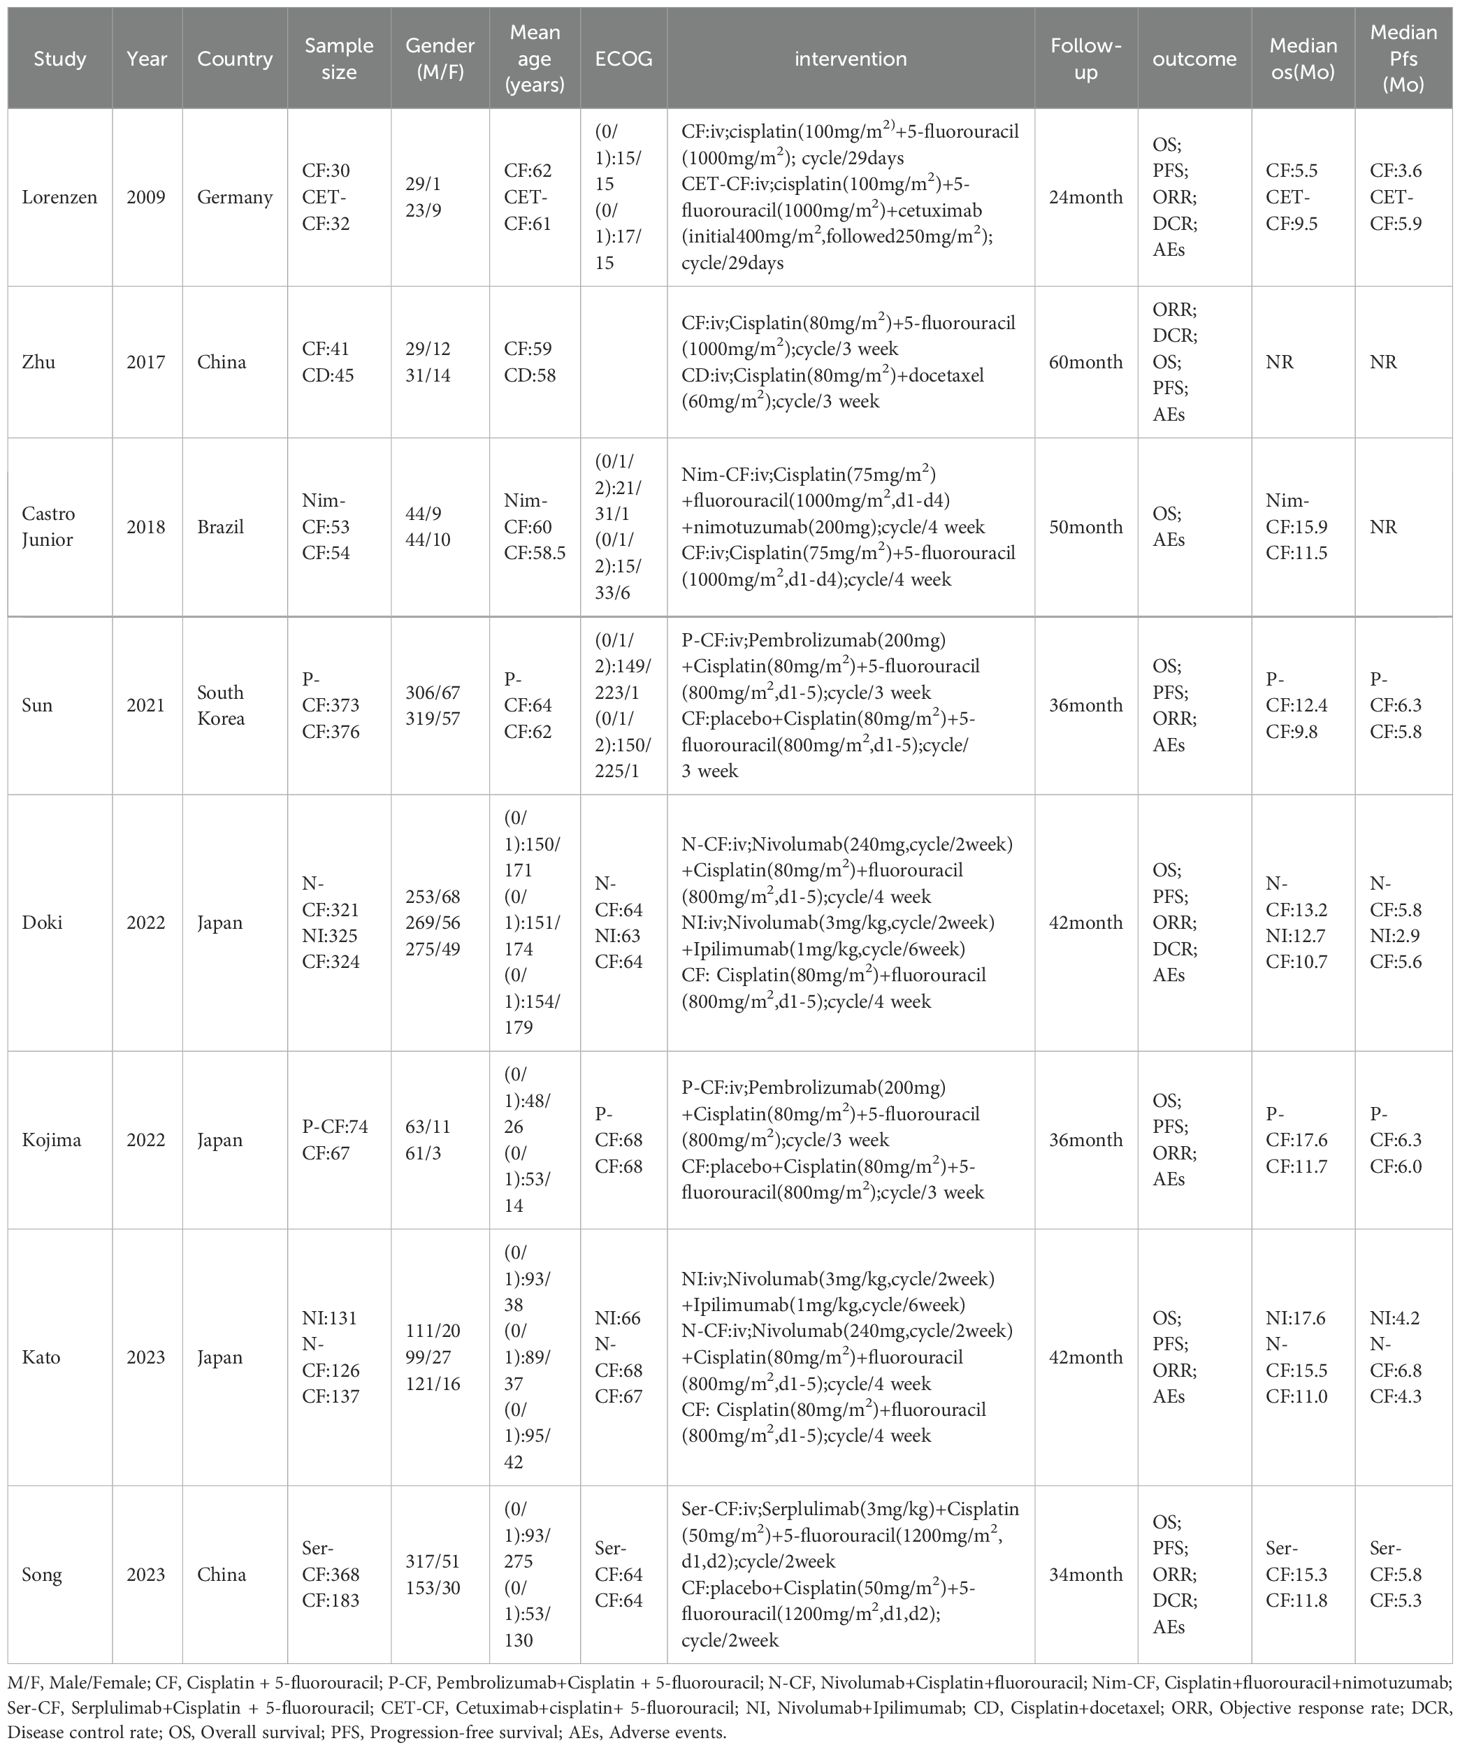
Table 1. Literature characteristics table.
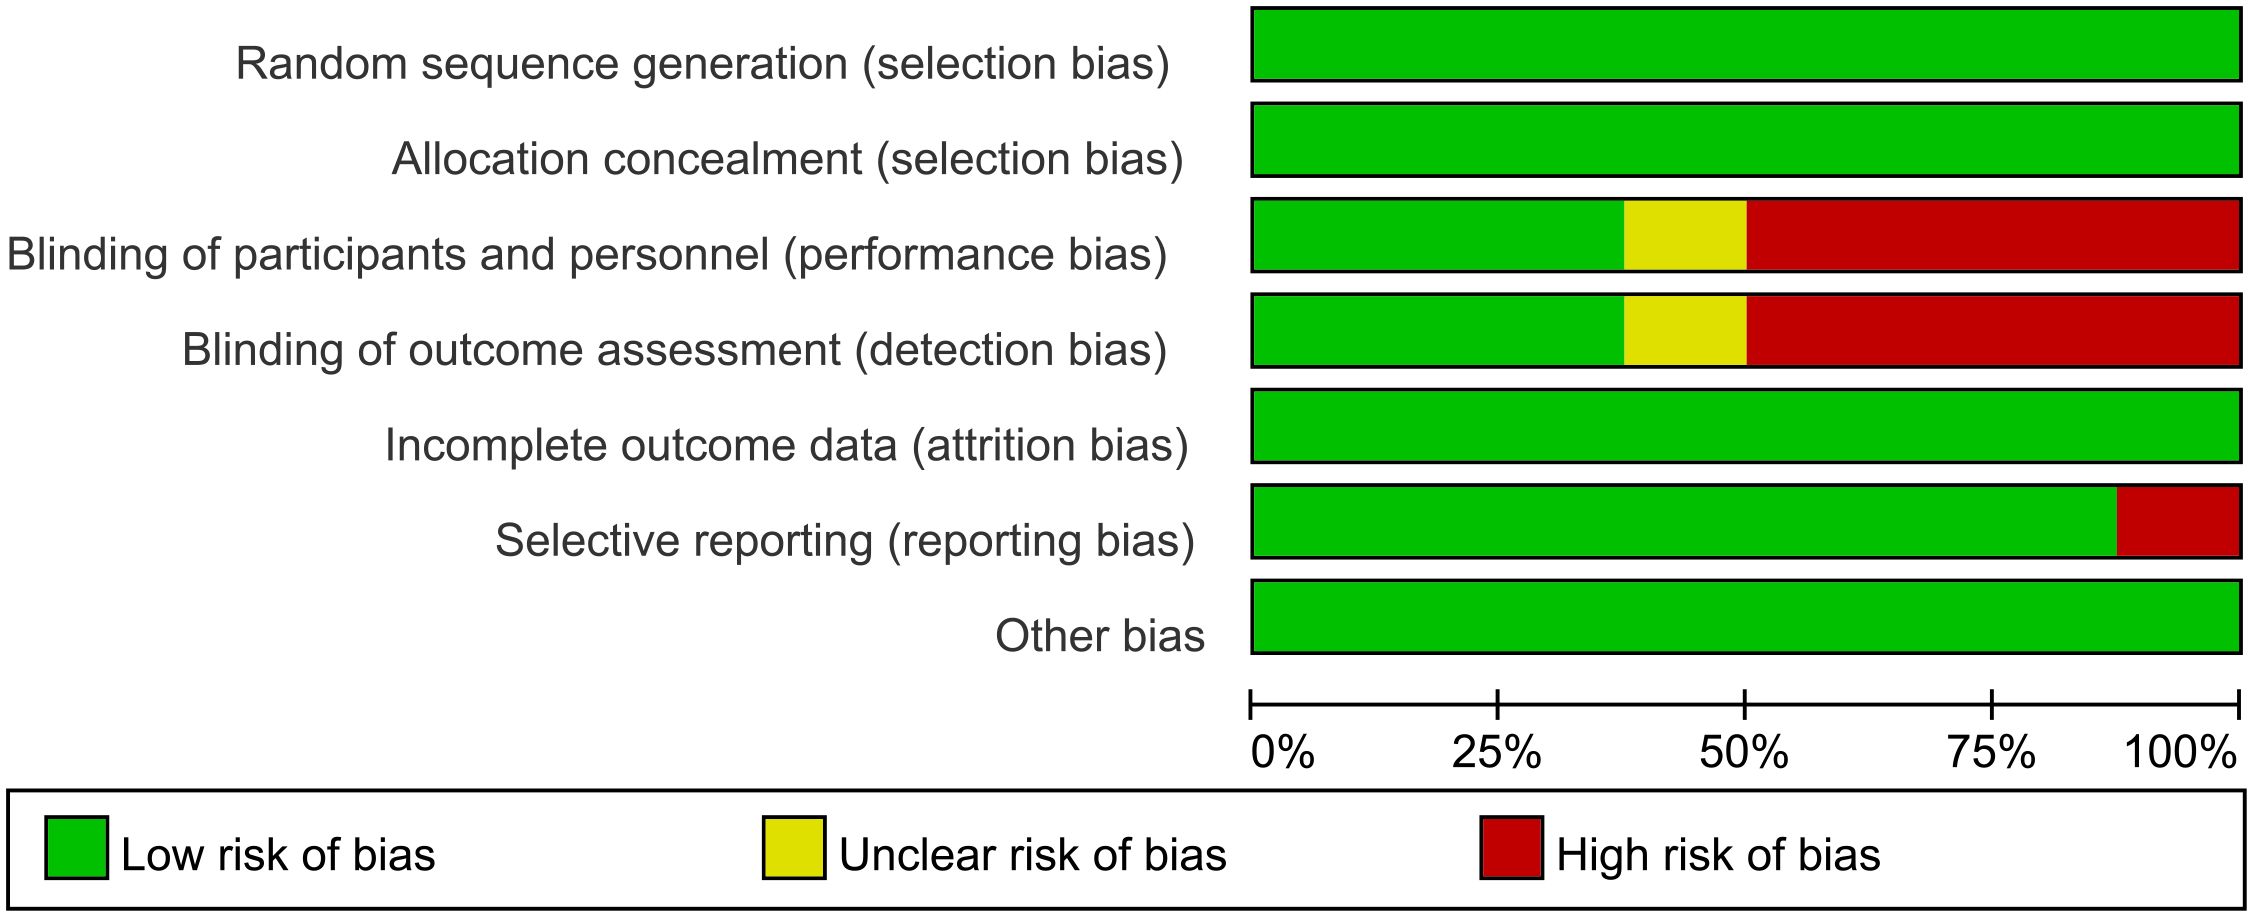
Figure 2. Risk of bias graph.
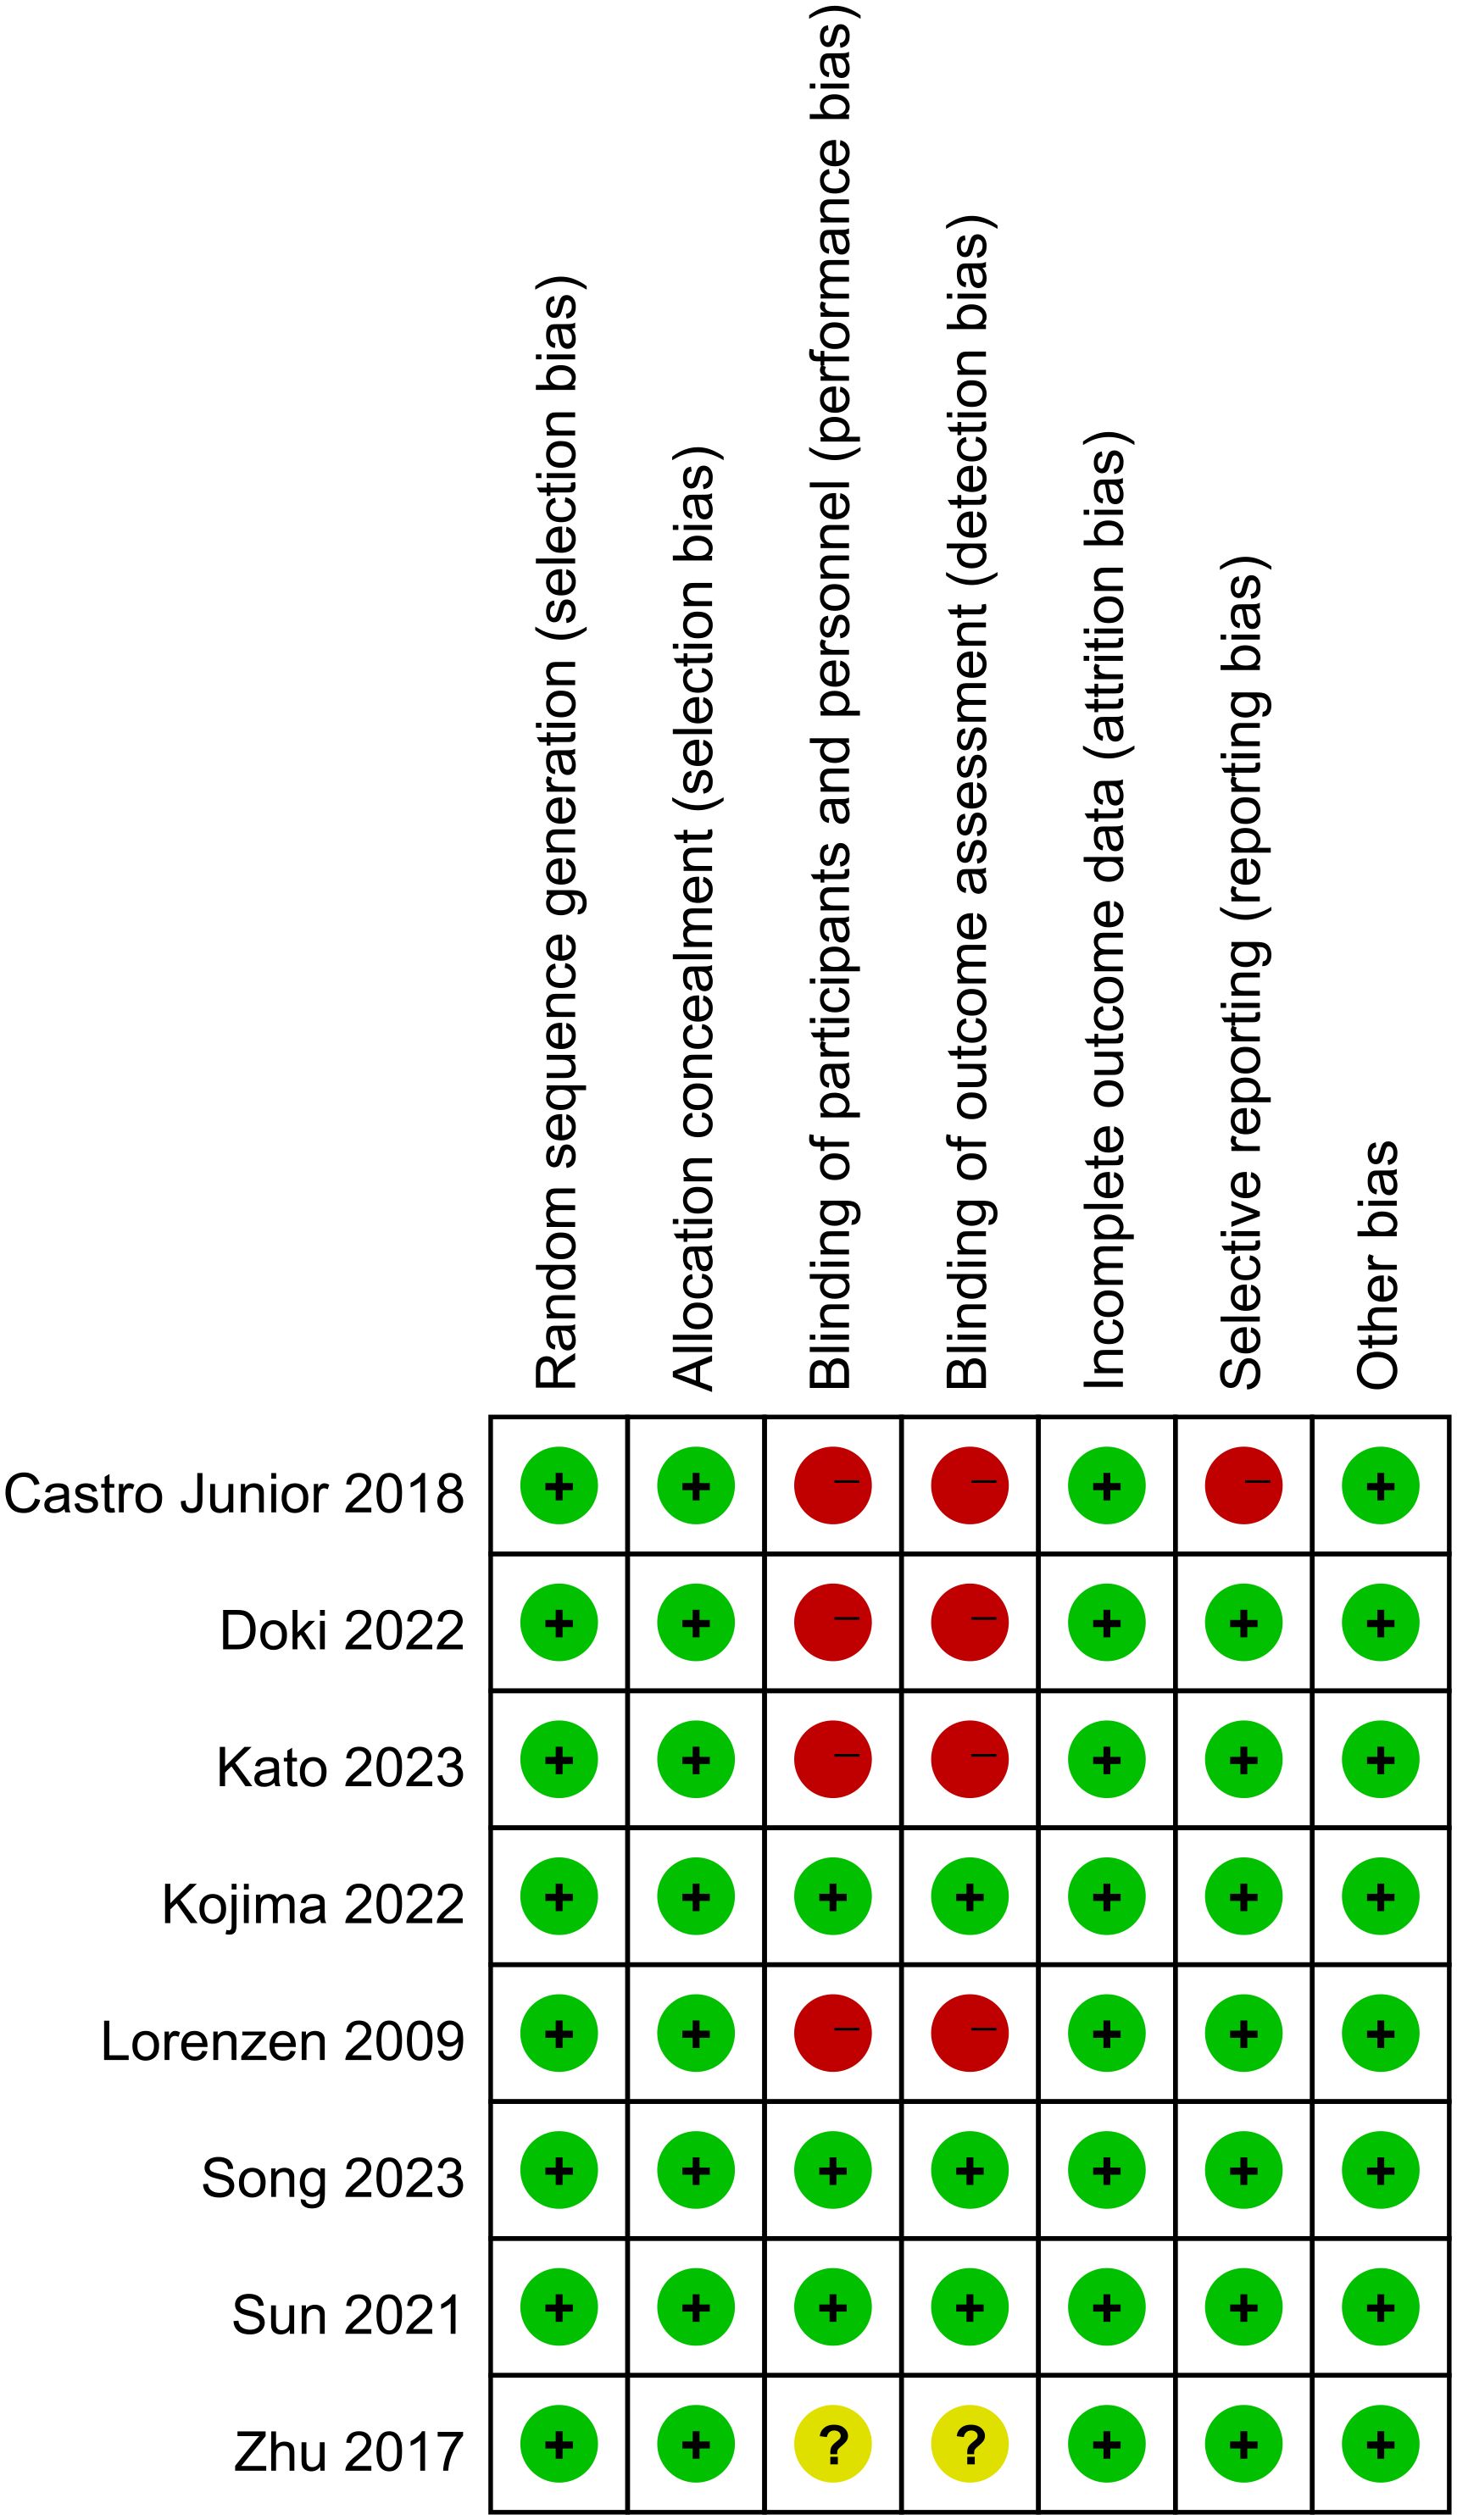
Figure 3. Risk of bias summary.
3.3 Network meta-analysis results
3.3.1 Overall survival
In a network meta-analysis comprising eight studies (13–20), overall survival (OS) outcomes were evaluated (refer to Figure 4). The network graph depicted in Figure 4A indicated the absence of closed loops, allowing for direct comparisons among various treatment regimens: CF with NI, N-CF, Nim-CF, P-CF, Ser-CF, CD, and CET-CF.
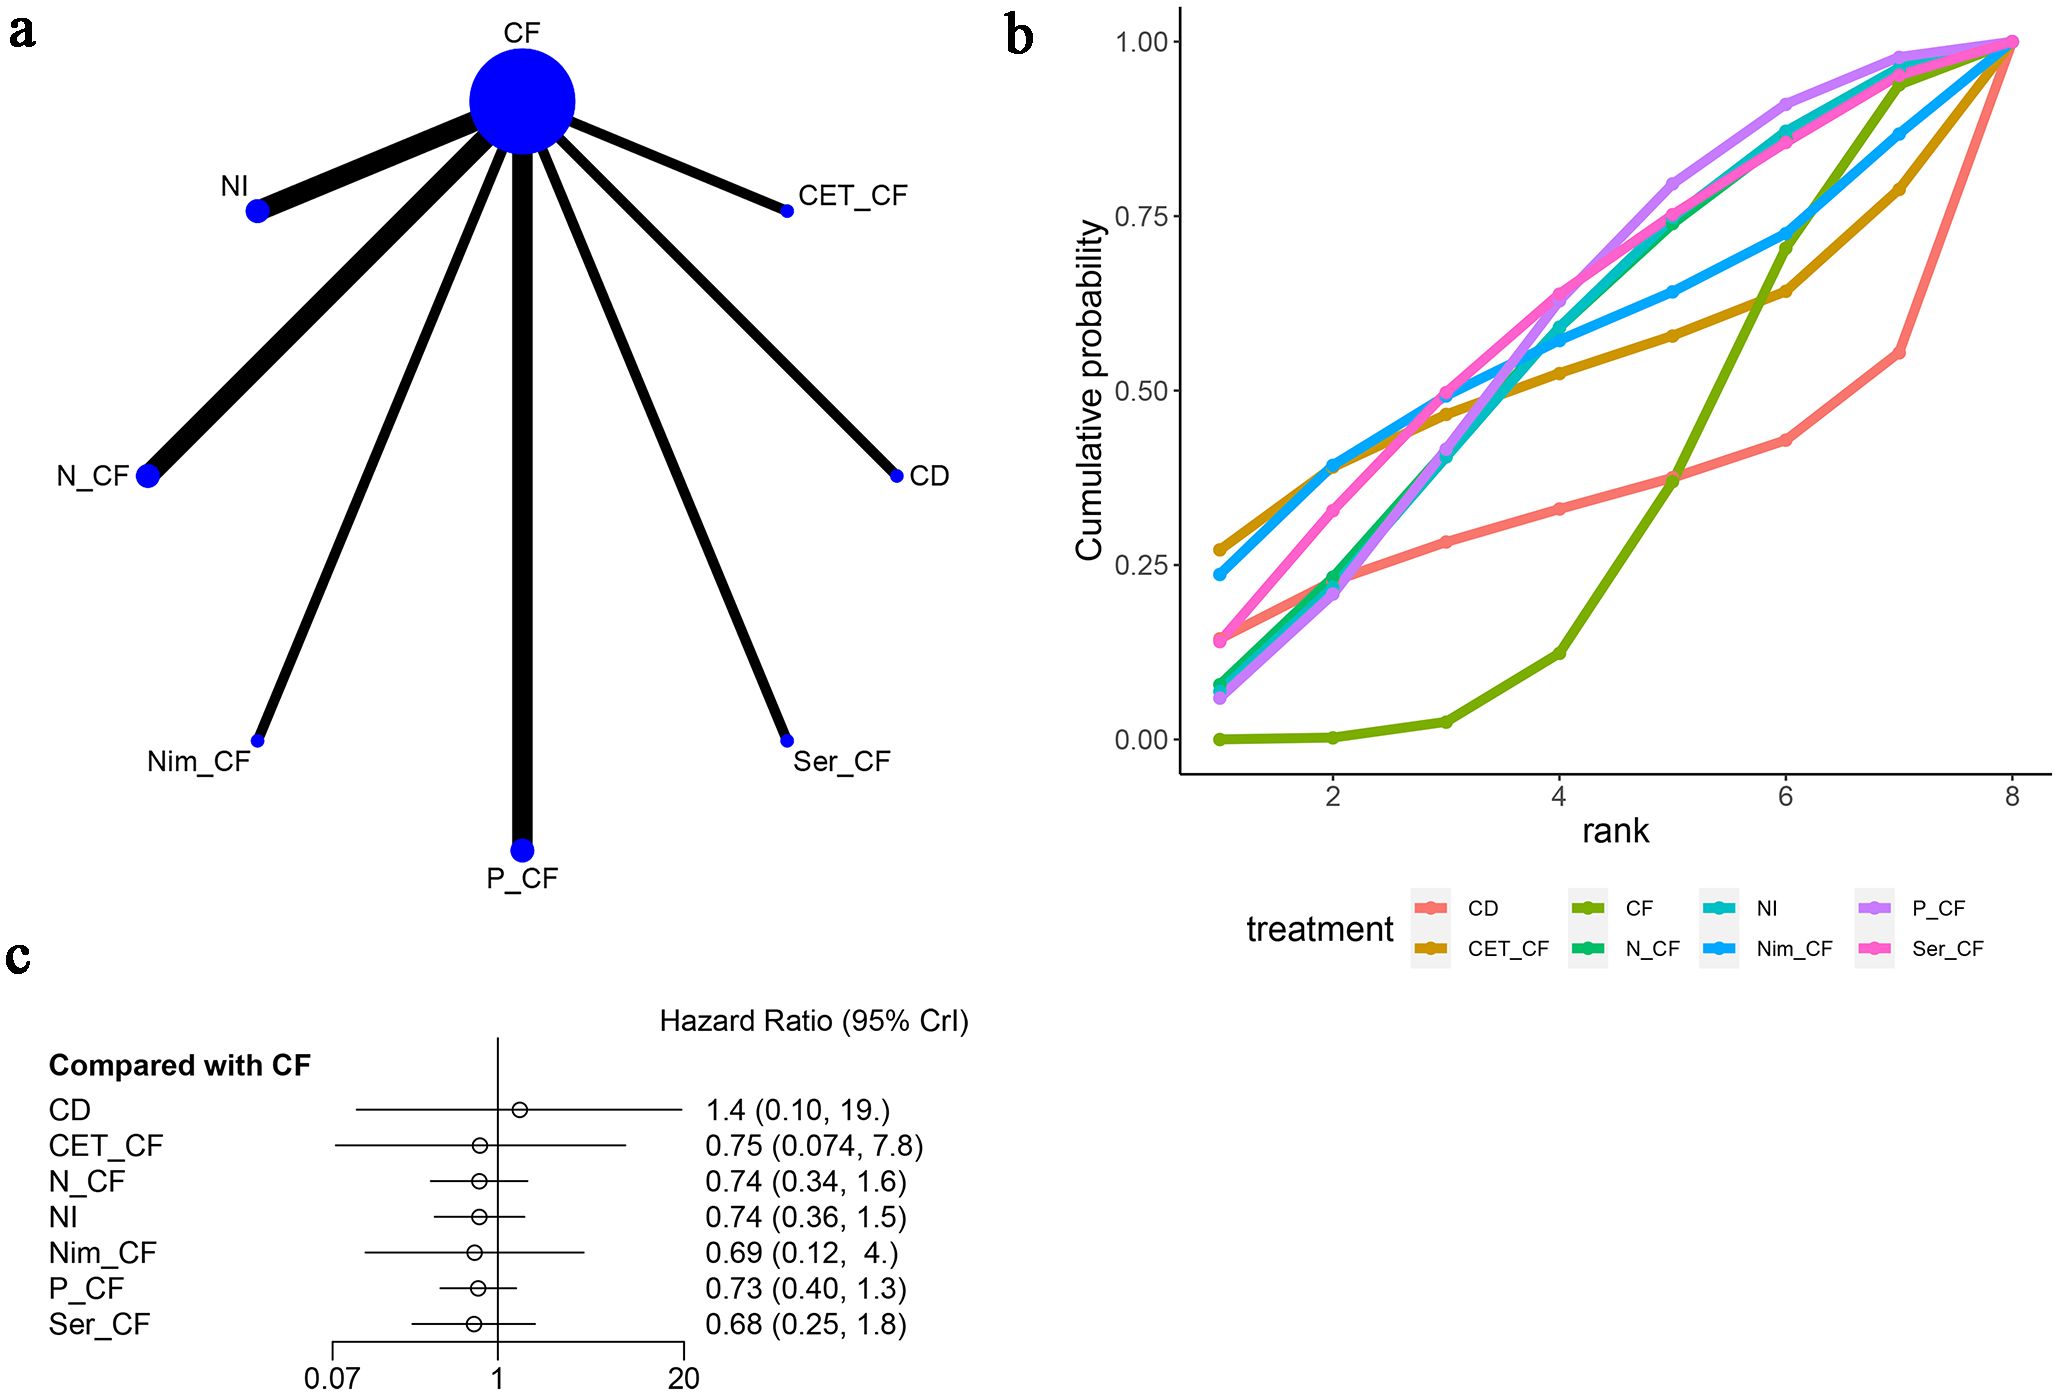
Figure 4. Meta-Analysis of Overall Survival (OS). (A) Network Plot(Each circle represents a different intervention, with the size of the circle proportional to the number of people in that intervention, and the line between the circles represents the existence of a direct comparison between the two interventions, with the thickness of the line representing the proportional number of studies), (B) Area under the Cumulative Probability Curve(Surface Under the Cumulative Ranking Curve of different intervention, CD, Cisplatin + Docetaxel; CF, Cisplatin + Fluorouracil; NI, Nivolumab + Ipilimumab,P-CF, Pembrolizumab + Cisplatin + Fluorouracil,CET-CF, Cetuximab + Cisplatin + Fluorouracil,N-CF, Nivolumab + Cisplatin + Fluorouracil,Nim-CF, Nimotuzumab + Cisplatin + Fluorouracil,Ser-CF, Serplulimab + Cisplatin + Fluorouracil); (C) Forest Plot.
When juxtaposed with CF, the hazard ratios (HRs) for each treatment were as follows: for CD, HR=1.42 with a 95% confidence interval (CI) of (0.1, 19.19); for CET-CF, HR=0.75, CI (0.074, 7.8); for N-CF, HR=0.74, CI (0.34, 1.6); for NI, HR=0.74, CI (0.36, 1.5); for Nim-CF, HR=0.69, CI (0.12, 4.0); for P-CF, HR=0.73, CI (0.40, 1.3); and for Ser-CF, HR=0.68, CI (0.25, 1.8). Despite these findings, none of the interventions demonstrated a significant impact on OS, as illustrated in Figure 4C, and no notable differences were observed among the various first-line treatment regimens (Table 2A).
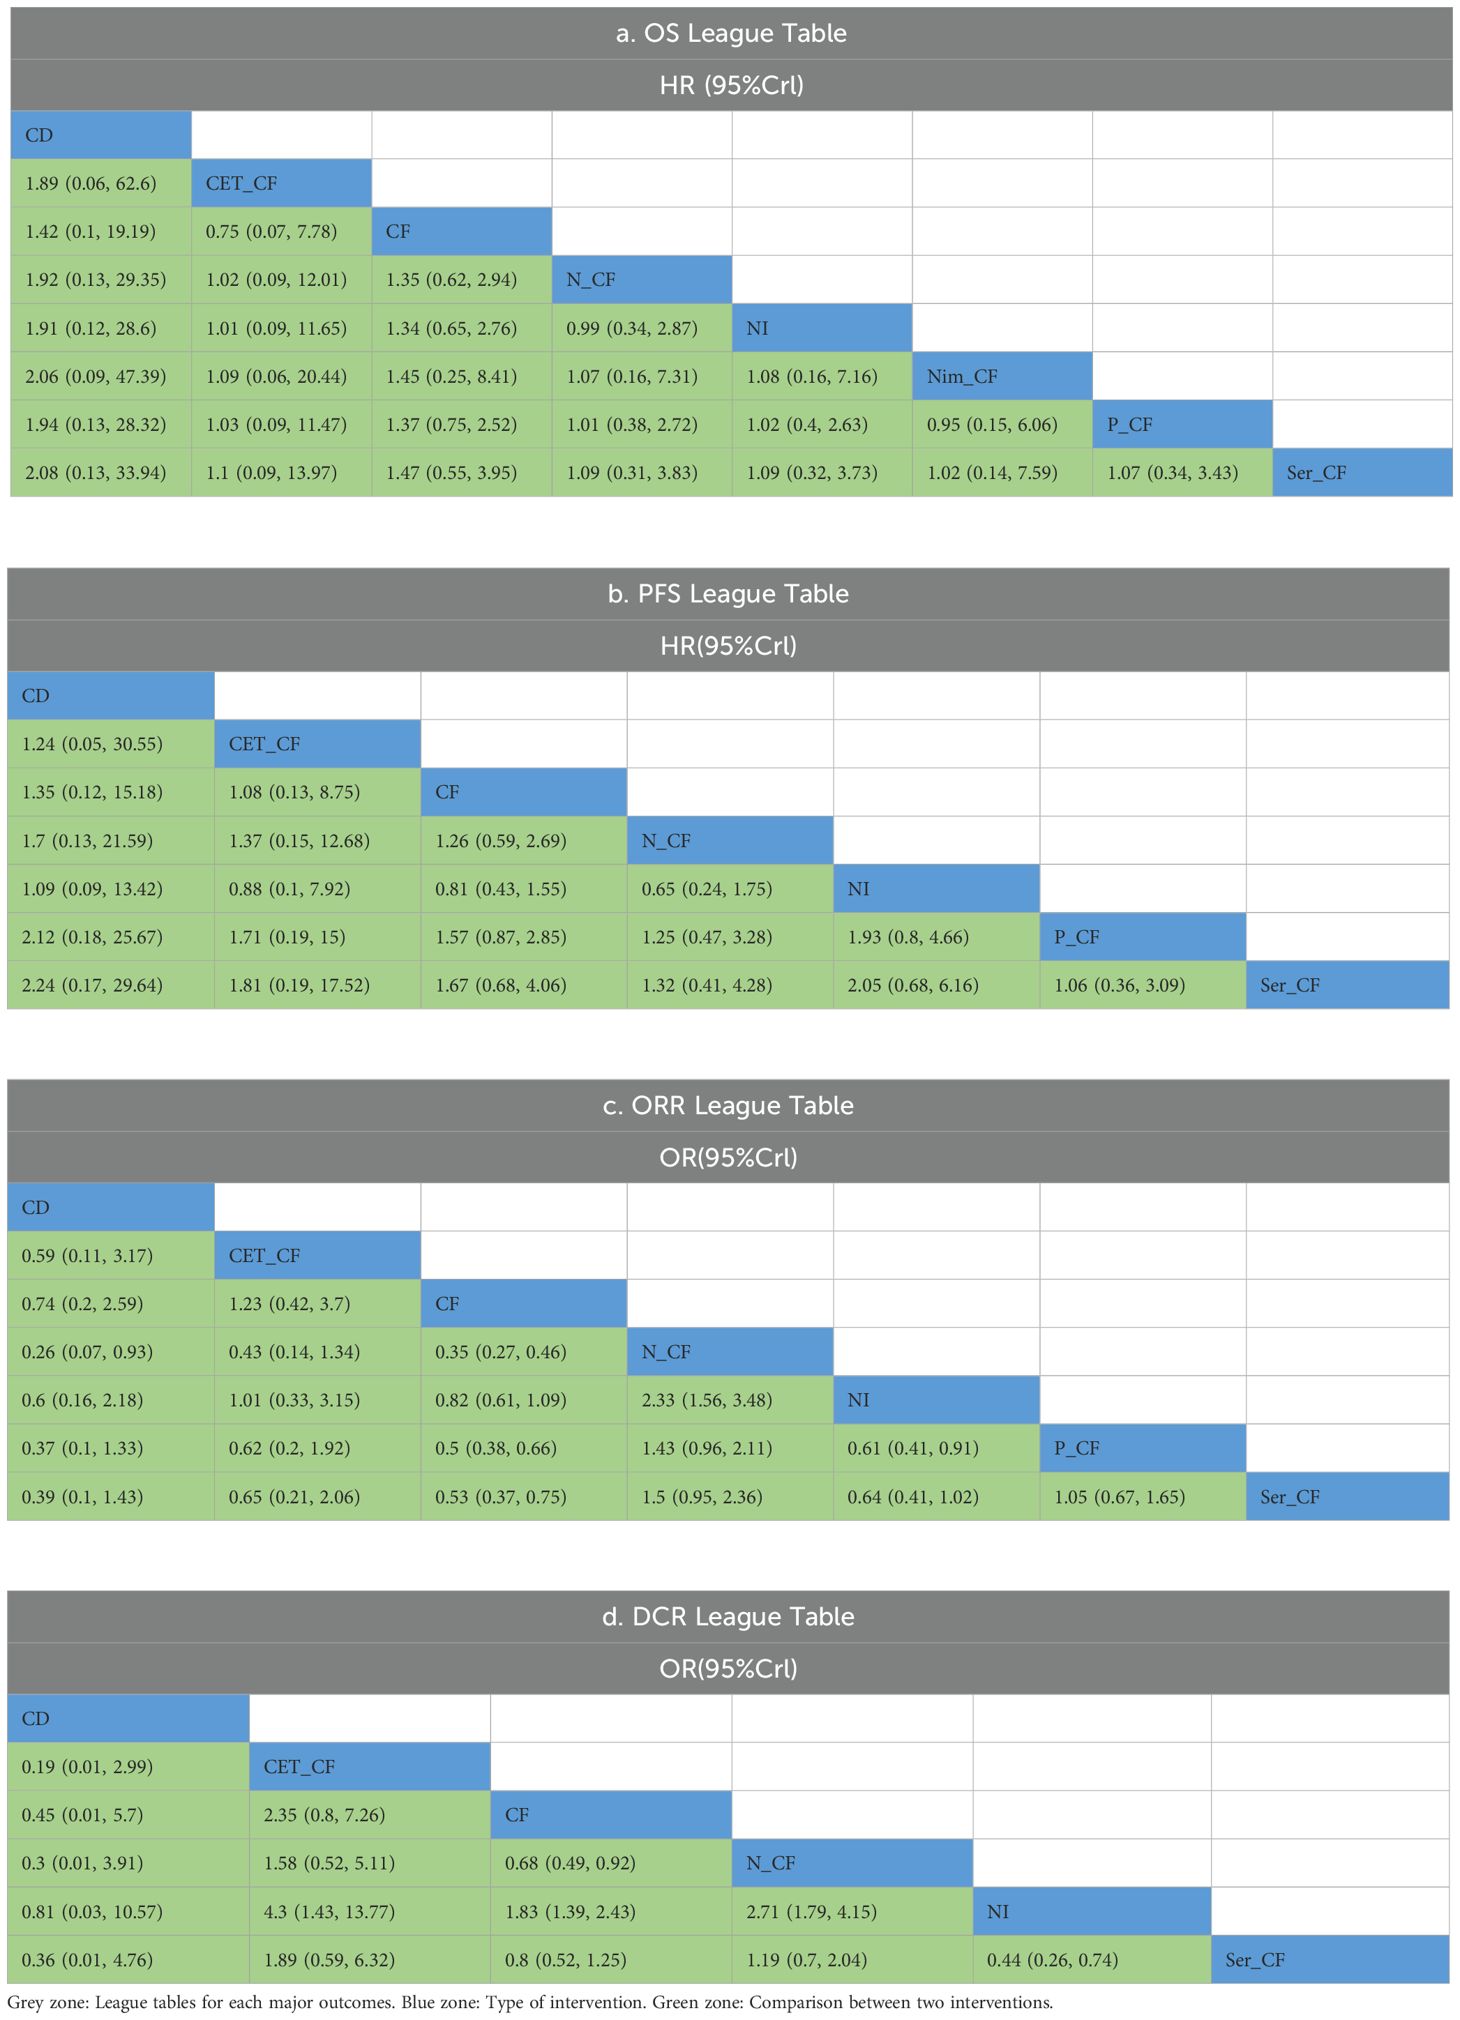
Table 2. League Table.
Notably, Ser-CF emerged as a potentially superior option, achieving the highest score on the area under the cumulative ranking curve (59.5%), followed by P-CF (57.1%), Nim-CF (56.1%), and CF (31.0%) as depicted in Figure 4B and Table 3.
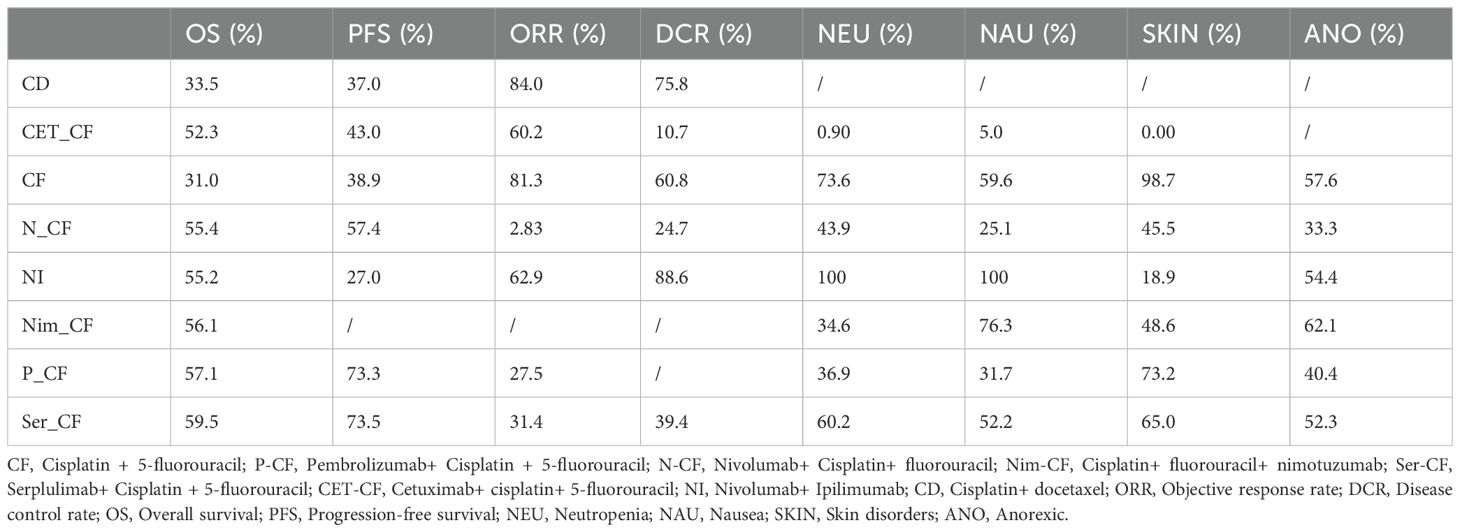
Table 3. SUCRA comprehensive ranking.
3.4 Progression-free survival
Seven studies (13, 14, 16–20) evaluated progression-free survival (PFS), as depicted in Figure 5. The network diagram (Figure 5A) illustrates direct comparisons among various treatment combinations: CF with NI, N-CF, P-CF, Ser-CF, CD, and CET-CF. When compared to CF, the hazard ratios (HRs) were as follows: for CD, HR = 1.35 with a 95% confidence interval (CI) of (0.12, 15.18); for CET-CF, HR = 1.08, 95% CI (0.13, 8.8); for N-CF, HR = 0.79, 95% CI (0.37, 1.7); for NI, HR = 1.2, 95% CI (0.64, 2.3); for P-CF, HR = 0.64, 95% CI (0.35, 1.2); and for Ser-CF, HR = 0.60, 95% CI (0.25, 1.5). These treatments showed marginal differences in enhancing PFS (Table 2B). Notably, Ser-CF achieved the highest area under the cumulative ranking curve at 73.5%, followed closely by P-CF at 73.3%, N-CF at 57.4%, and NI at 27.0% (Figure 5B; Table 3).
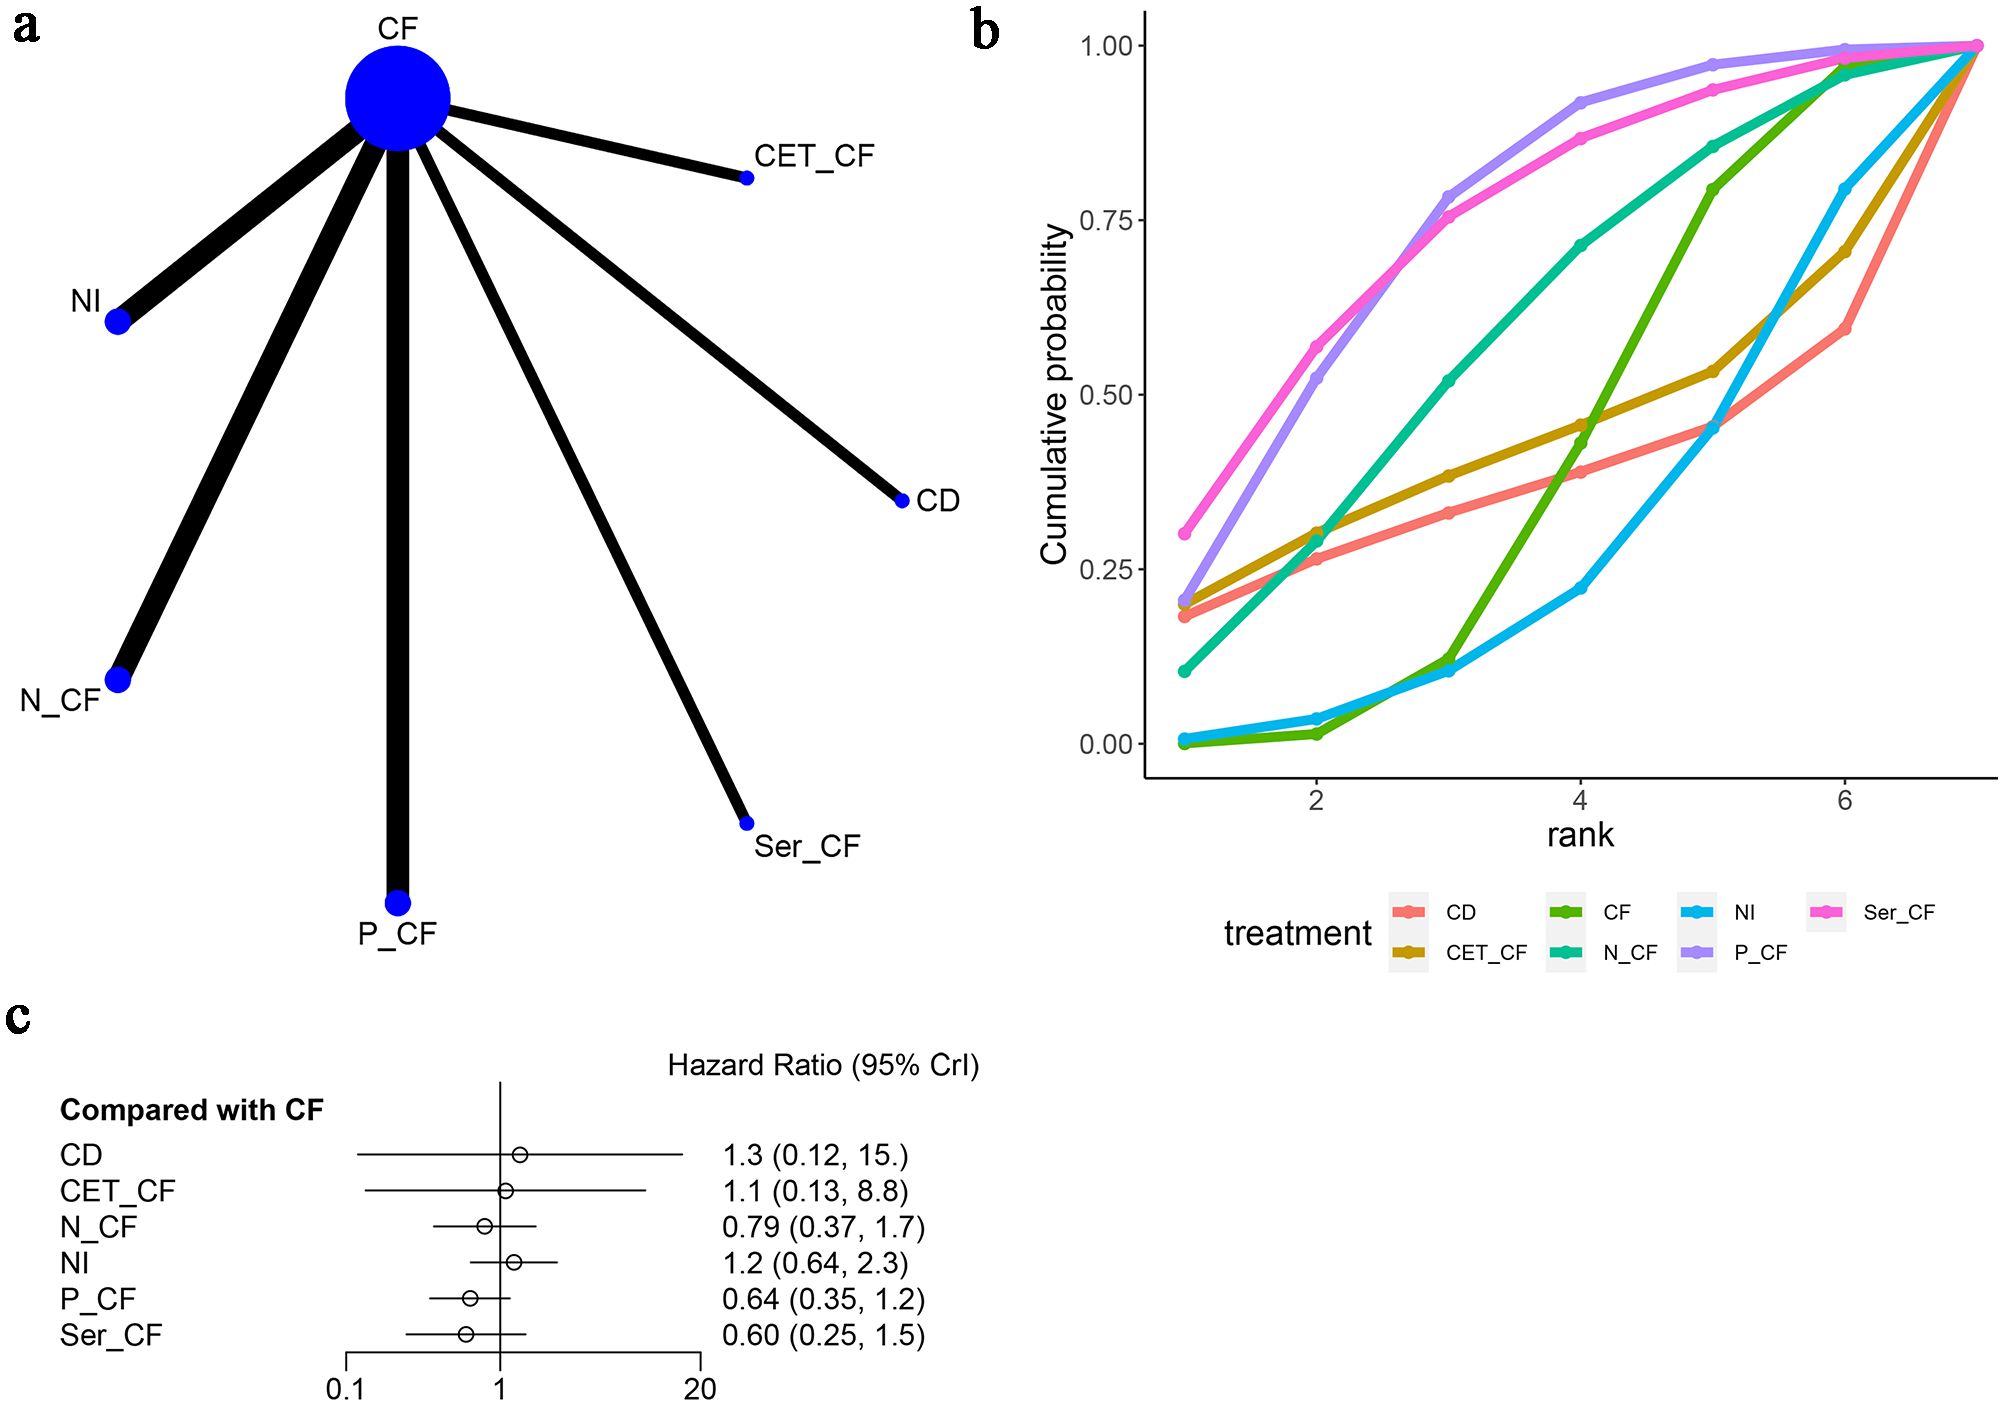
Figure 5. Meta-Analysis of Progression-Free Survival (PFS). (A) Network Plot(Each circle represents a different intervention, with the size of the circle proportional to the number of people in that intervention, and the line between the circles represents the existence of a direct comparison between the two interventions, with the thickness of the line representing the proportional number of studies), (B) Area under the Cumulative Probability Curve (Surface Under the Cumulative Ranking Curve of different intervention, CD, Cisplatin + Docetaxel; CF, Cisplatin + Fluorouracil; NI, Nivolumab + Ipilimumab,P-CF, Pembrolizumab + Cisplatin + Fluorouracil,CET-CF, Cetuximab + Cisplatin + Fluorouracil,N-CF, Nivolumab + Cisplatin + Fluorouracil,Ser-CF, Serplulimab + Cisplatin + Fluorouracil), (C) Forest Plot.
3.5 Objective response rate
In this analysis, seven studies (13, 14, 16–20) were examined to assess the objective response rate (ORR), as depicted in Figure 6. The network diagram (Figure 6A) delineated direct comparisons among various treatments: Cetuximab and Fluoropyrimidine (CF) versus Nitroglycerin Patch (NI), Non-Cetuximab and Fluoropyrimidine (N-CF), Preoperative Cetuximab and Fluoropyrimidine (P-CF), Serotonin and Cetuximab and Fluoropyrimidine (Ser-CF), Cetuximab and Docetaxel (CD), and Cetuximab monotherapy (CET-CF).
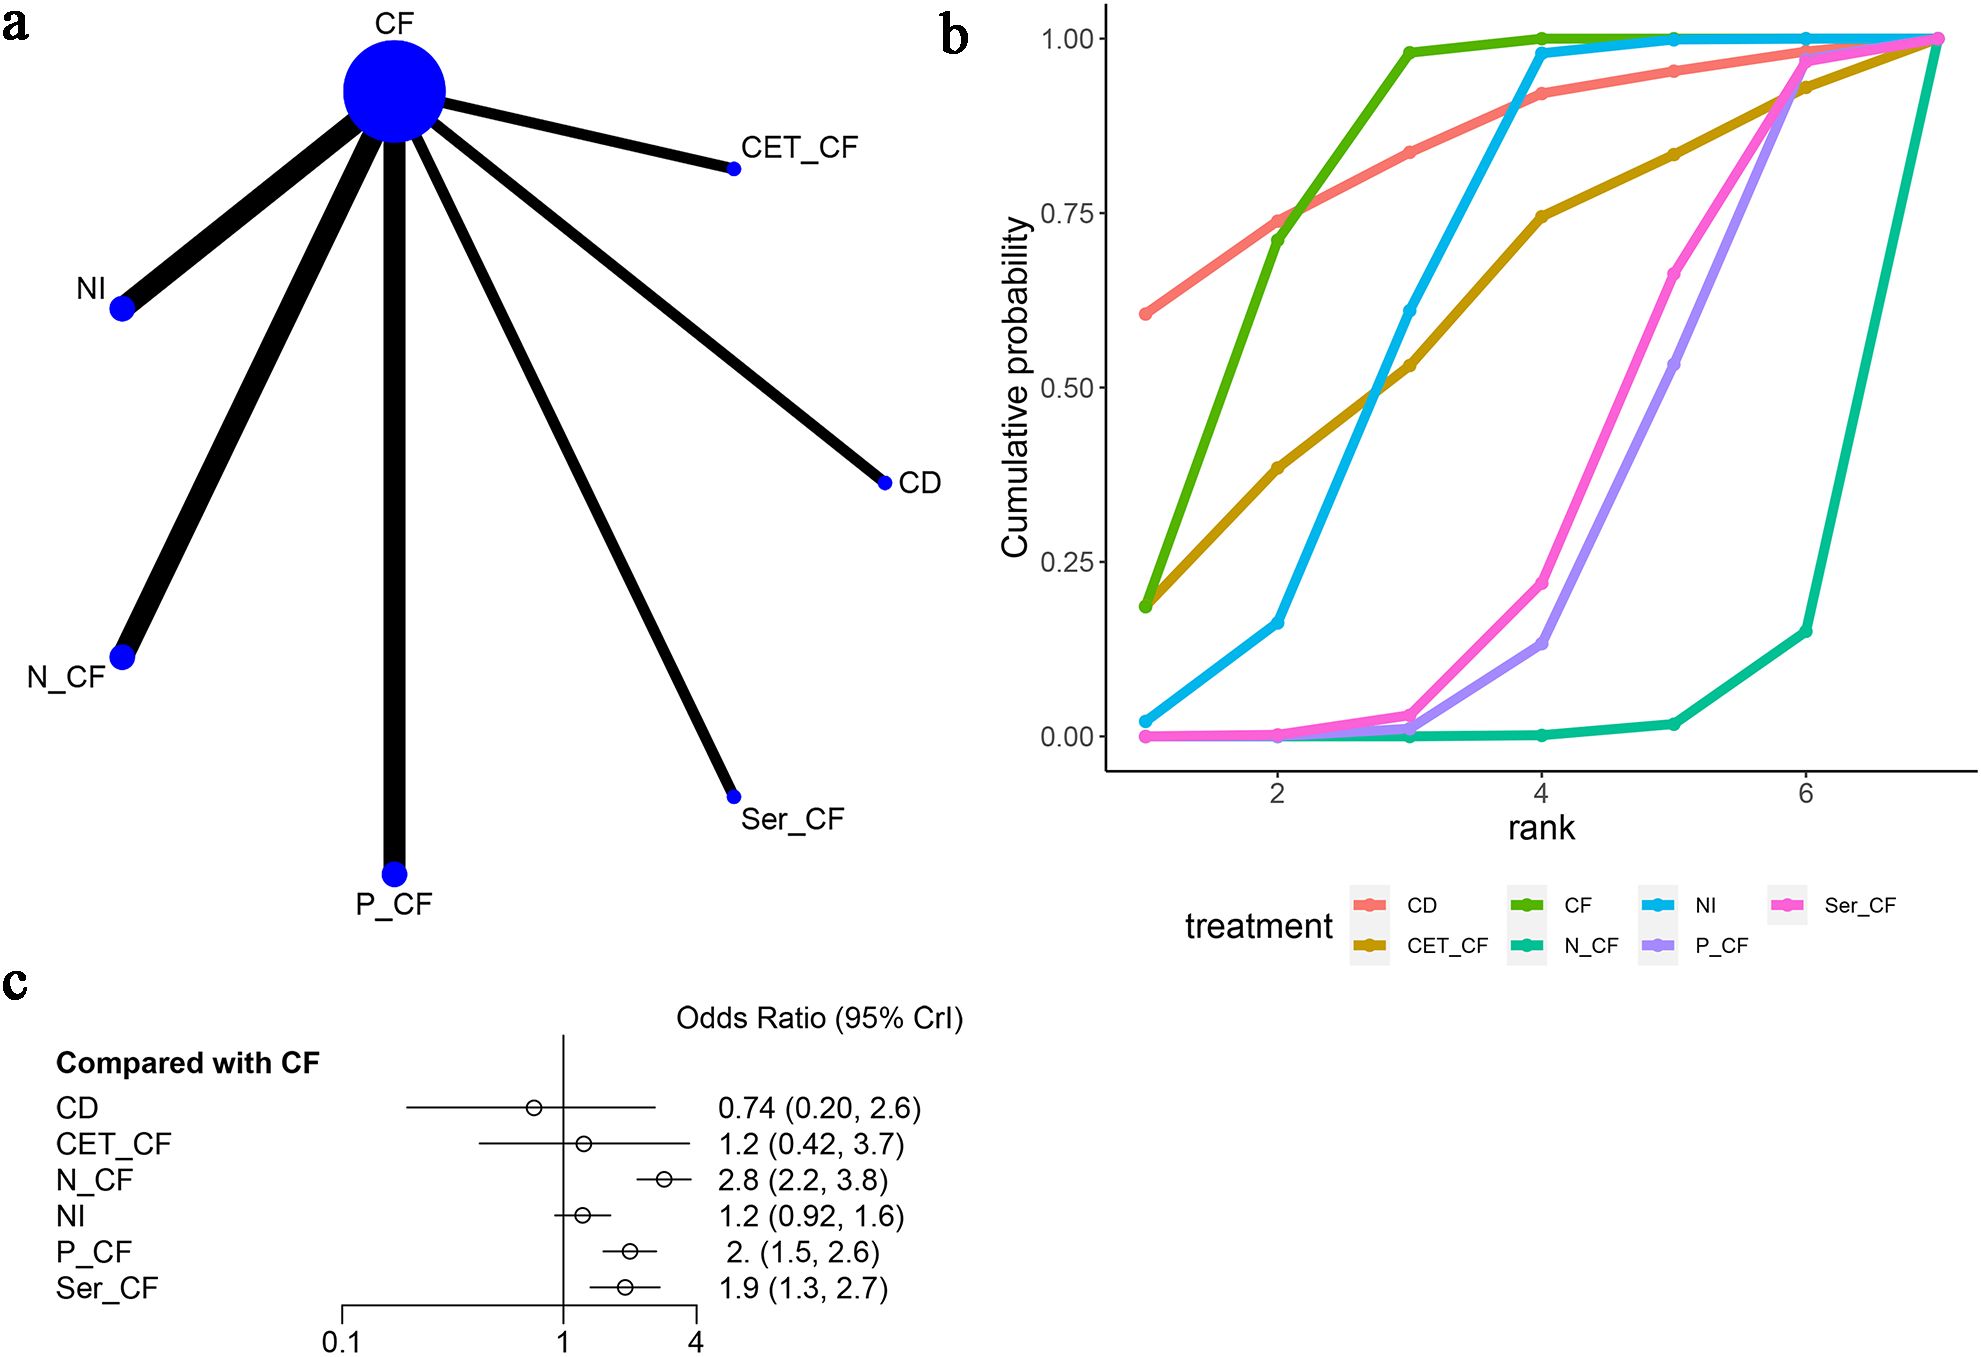
Figure 6. Meta-Analysis of Objective Response Rate (ORR). (A) Network Plot(Each circle represents a different intervention, with the size of the circle proportional to the number of people in that intervention, and the line between the circles represents the existence of a direct comparison between the two interventions, with the thickness of the line representing the proportional number of studies), (B) Area under the Cumulative Probability Curve (Surface Under the Cumulative Ranking Curve of different intervention, CD, Cisplatin + Docetaxel; CF, Cisplatin + Fluorouracil; NI, Nivolumab + Ipilimumab,P-CF, Pembrolizumab + Cisplatin + Fluorouracil,CET-CF, Cetuximab + Cisplatin + Fluorouracil,N-CF, Nivolumab + Cisplatin + Fluorouracil,Ser-CF, Serplulimab + Cisplatin + Fluorouracil), (C) Forest Plot.
The analysis of odds ratios (ORs) revealed varying effectiveness of treatments compared to CF. Specifically, CD exhibited an OR of 0.74 [95% CI (0.20, 2.6)], indicating less effectiveness, while CET-CF showed an OR of 1.2 [95% CI (0.42, 3.7)], suggesting a marginal improvement. Notably, N-CF [OR=2.8, 95% CI (2.2, 3.8)], NI [OR=1.2, 95% CI (0.92, 1.6)], P-CF [OR=2.0, 95% CI (1.5, 2.6)], and Ser-CF [OR=1.9, 95% CI (1.3, 2.7)] demonstrated more promising results, with N-CF, P-CF, and Ser-CF notably enhancing ORR, as highlighted in Figure 6C.
However, treatments such as CET-CF, NI, and CD did not significantly improve ORR, as detailed in Table 2C. Among the analyzed treatments, N-CF emerged as the most favorable in enhancing ORR. In terms of the cumulative ranking curve, CD achieved the highest area under the curve (AUC) of 84%, followed by CF (81.3%), NI (62.9%), and N-CF (2.83%), as shown in Figure 6B and Table 3. This comprehensive analysis underscores the varied efficacy of the treatments, with N-CF standing out for its potential in improving ORR.
3.5.1 DCR
In five articles (13, 14, 17, 19, 20), DCR was mentioned as depicted in Figure 7. The network diagram (Figure 7A) reveals direct comparisons between CF and NI, CF and N-CF, CF and Ser-CF, CF and CD, as well as CF and CET-CF. Compared to CF, CD [OR=0.45, 95% CI (0.01, 5.7)], CET-CF [OR=2.35, 95% CI (0.8, 7.3)], N-CF [OR=1.5, 95% CI (1.1, 2.0)], NI [OR=0.55, 95% CI (0.41, 0.72)], and Ser-CF [OR=1.2, 95% CI (0.80, 1.9)] were evaluated. In comparison to CF, it was found that CET-CF and N-CF could improve DCR, whereas Ser-CF, CD, and NI did not exhibit a significant improvement in DCR (Figure 7C) (Table 2D). The area under the cumulative ranking curve indicated that NI had the highest impact (88.6%), followed by CD (75.8%), CF (60.8%), and CET-CF (10.7%) (Figure 7B; Table 3).

Figure 7. Meta-Analysis of Disease Control Rate (DCR). (A) Network Plot(Each circle represents a different intervention, with the size of the circle proportional to the number of people in that intervention, and the line between the circles represents the existence of a direct comparison between the two interventions, with the thickness of the line representing the proportional number of studies), (B) Area under the Cumulative Probability Curve(Surface Under the Cumulative Ranking Curve of different intervention, CD, Cisplatin + Docetaxel; CF, Cisplatin + Fluorouracil; NI, Nivolumab + Ipilimumab; CET-CF, Cetuximab + Cisplatin + Fluorouracil,N-CF, Nivolumab + Cisplatin + Fluorouracil,Ser-CF, Serplulimab + Cisplatin + Fluorouracil), (C) Forest Plot.
3.6 Adverse events
Seven studies (13, 15–20) reported neutropenia as an adverse event, as illustrated in Figure 8. The network diagram (Figure 8A) displayed direct comparisons between CF and NI, CF and N-CF, CF and Nim-CF, CF and P-CF, CF and Ser-CF, and CF and CET-CF. Compared to CF, CET-CF [OR=5.6, 95% CI (1.9, 18.0)], N-CF [OR=1.3, 95% CI (0.92, 1.7)], NI [OR=0.014, 95% CI (0.002, 0.048)], Nim-CF [OR=1.6, 95% CI (0.63, 3.9)], P-CF [OR=1.3, 95% CI (1.0, 1.8)], and Ser-CF [OR=1.1, 95% CI (0.76, 1.6)] were analyzed. In comparison to CF, P-CF and CET-CF increased the probability of neutropenia, with CET-CF having the highest likelihood. However, Ser-CF, Nim-CF, NI, and N-CF had a lower probability of causing neutropenia (Figure 8C). The area under the cumulative ranking curve indicated that NI had the highest impact (100%), followed by CF (73.6%), Ser-CF (60.2%), and CET-CF (0.9%) (Figure 8B; Table 3).
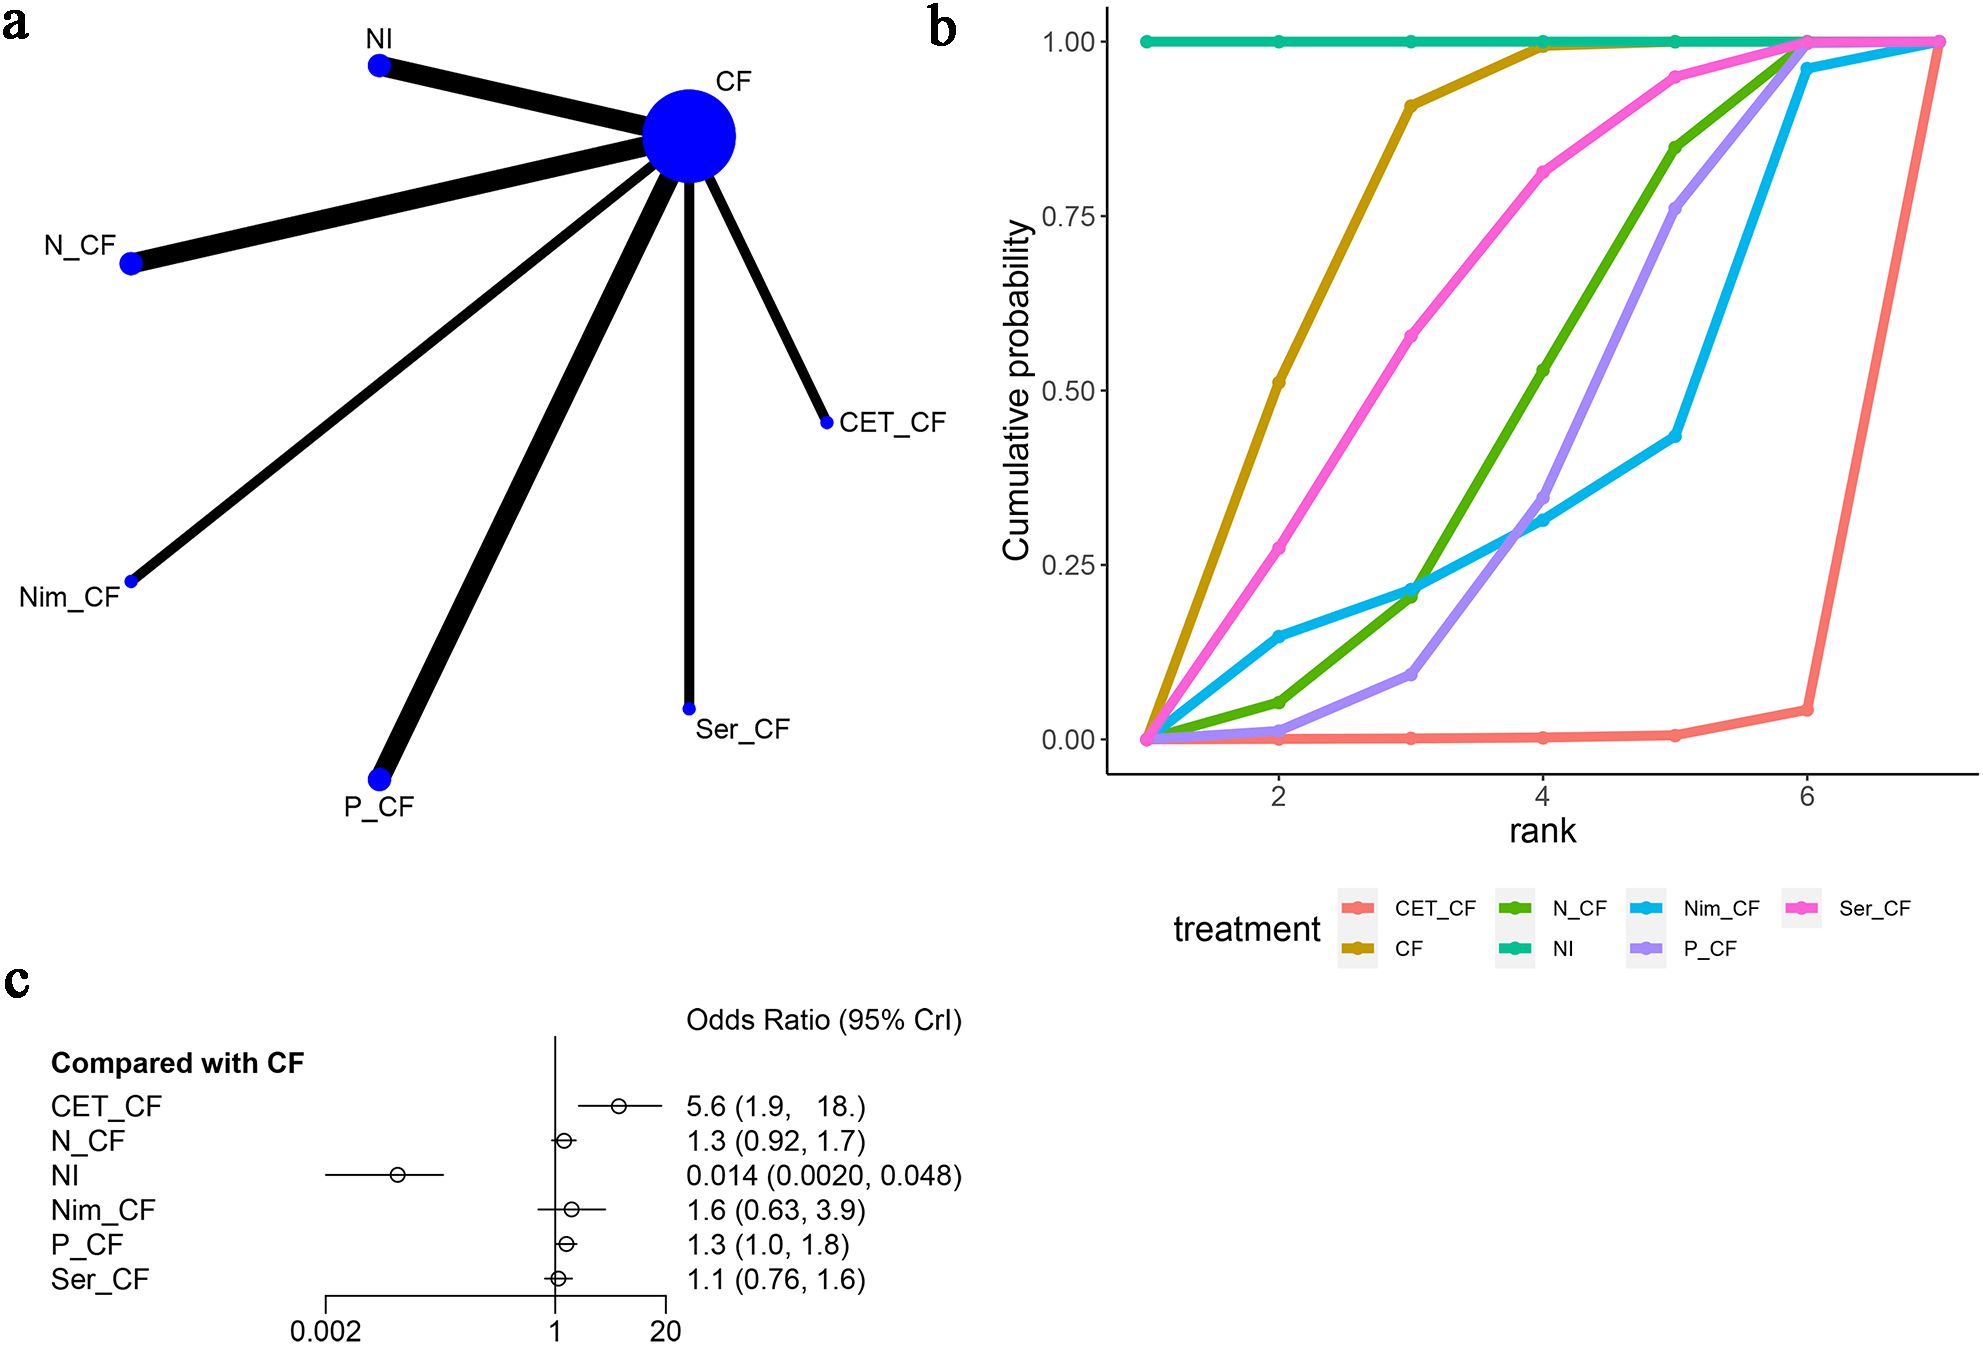
Figure 8. Meta-Analysis of Neutropenia. (A) Network Plot(Each circle represents a different intervention, with the size of the circle proportional to the number of people in that intervention, and the line between the circles represents the existence of a direct comparison between the two interventions, with the thickness of the line representing the proportional number of studies), (B) Area under the Cumulative Probability Curve (Surface Under the Cumulative Ranking Curve of different intervention, CF, Cisplatin + Fluorouracil; NI, Nivolumab + Ipilimumab,P-CF, Pembrolizumab + Cisplatin + Fluorouracil,CET-CF, Cetuximab + Cisplatin + Fluorouracil,N-CF, Nivolumab + Cisplatin + Fluorouracil,Nim-CF, Nimotuzumab + Cisplatin + Fluorouracil,Ser-CF, Serplulimab + Cisplatin + Fluorouracil), (C) Forest Plot.
Additionally, in these seven articles (13, 15–20), nausea as an adverse event was mentioned, as shown in Figure 9. The network diagram (Figure 9A) did not form a closed-loop structure between the various interventions. Compared to CF, CET-CF [OR=2.6, 95% CI (0.92, 7.6)], N-CF [OR=1.3, 95% CI (1.0, 1.7)], NI [OR=0.066, 95% CI (0.043, 0.099)], Nim-CF [OR=0.64, 95% CI (0.28, 1.4)], P-CF [OR=1.2, 95% CI (0.93, 1.6)], and Ser-CF [OR=1.0, 95% CI (0.71, 1.5)] were evaluated. Compared to CF, CET-CF and N-CF had an increased probability of causing nausea, with CET-CF having the highest likelihood. Conversely, NI, Nim-CF, P-CF, and Ser-CF had a lower probability of causing nausea, with NI having the lowest probability (Figure 9C). The area under the cumulative ranking curve indicated that NI had the highest impact (100%), followed by Nim-CF (76.3%), CF (59.6%), and CET-CF (5%) (Figure 9B; Table 3).
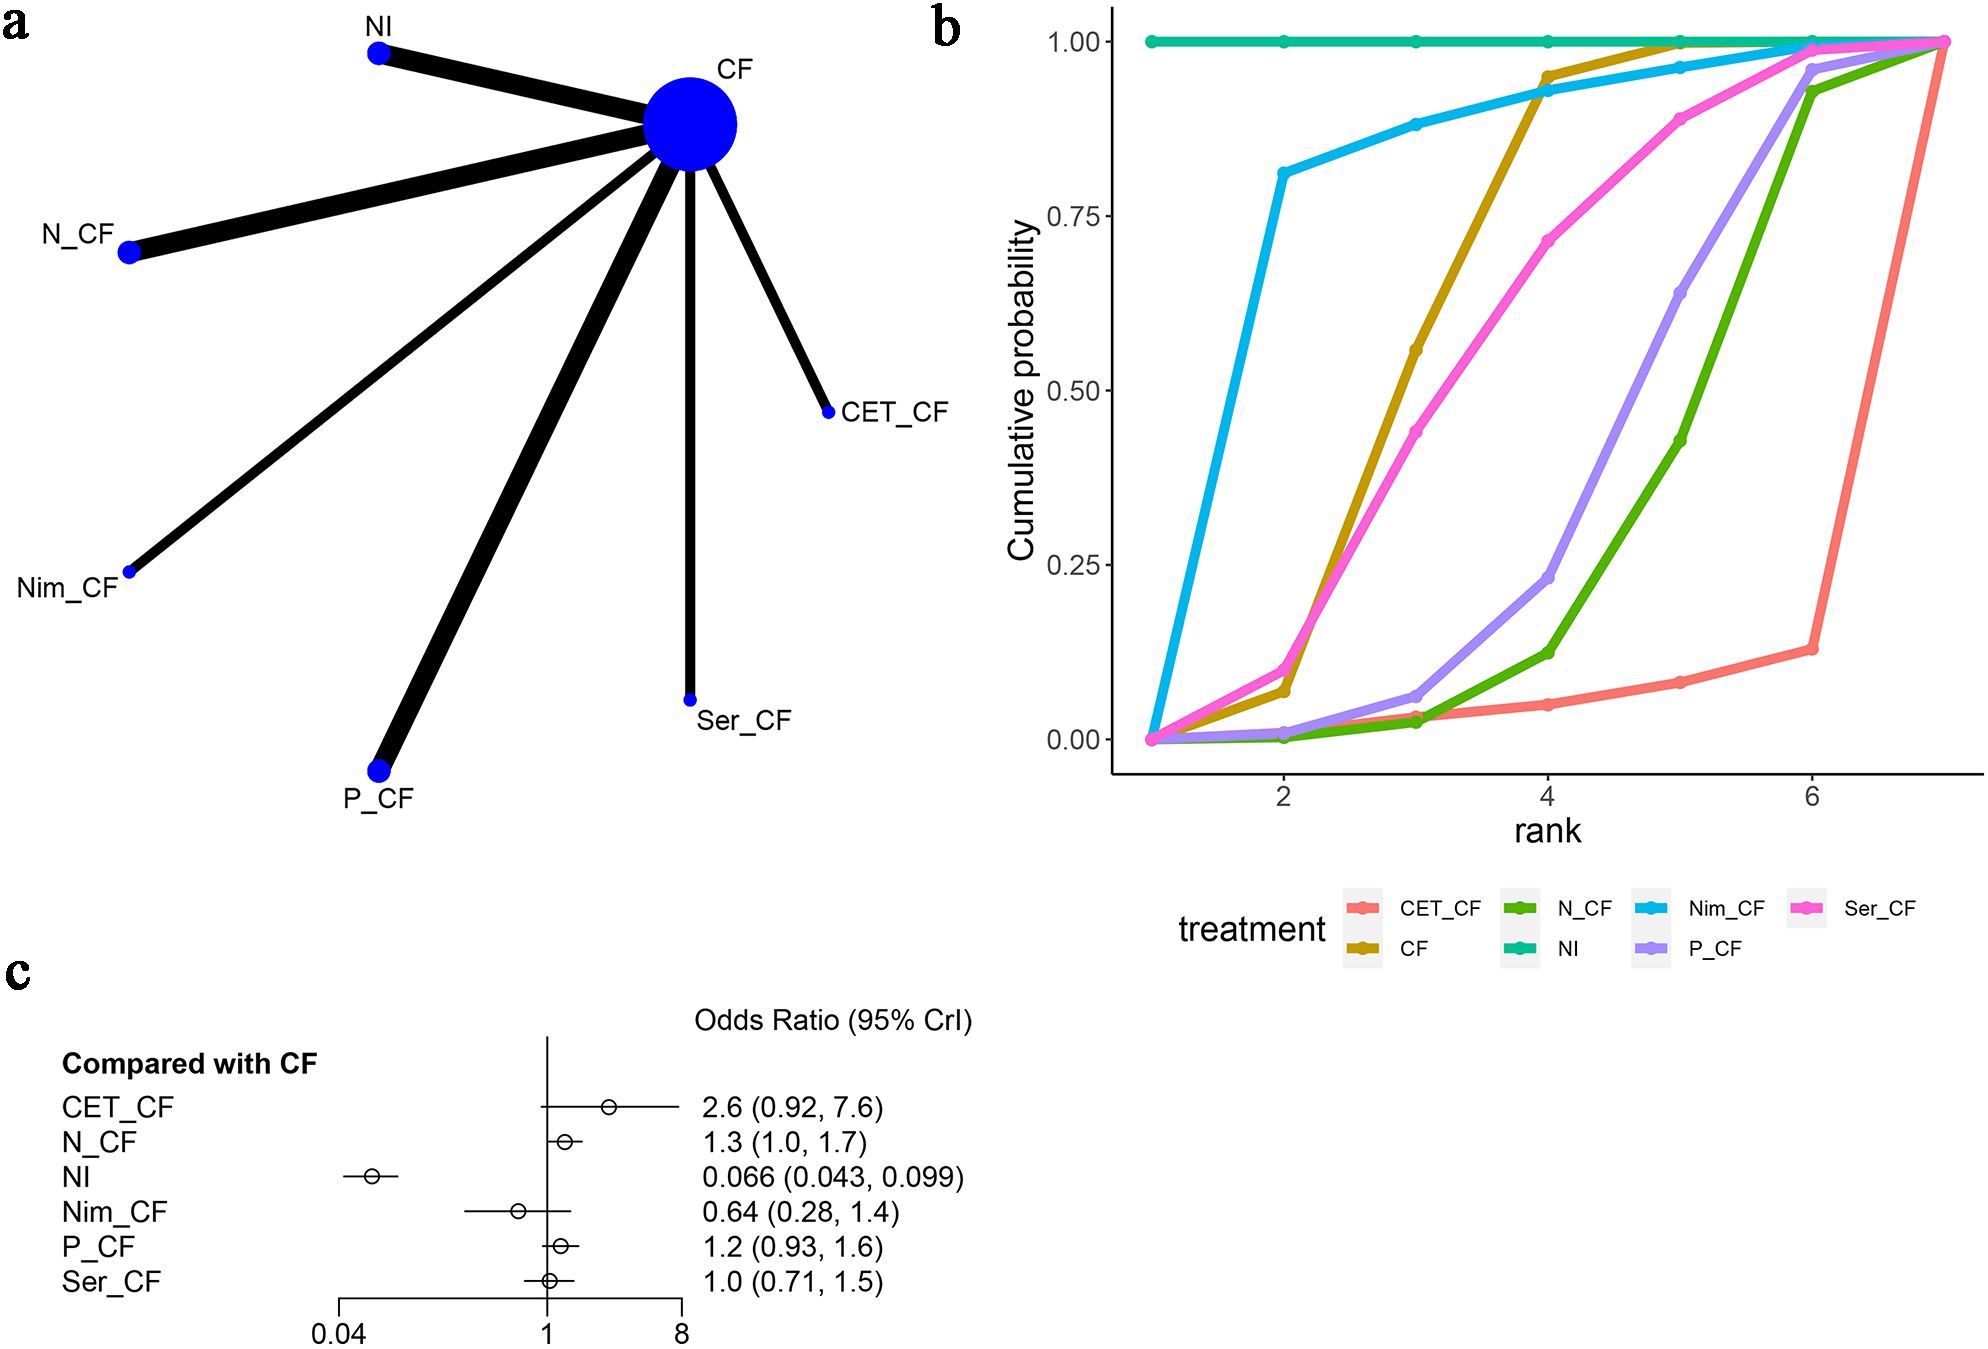
Figure 9. Meta-Analysis of Nausea. (A) Network Plot(Each circle represents a different intervention, with the size of the circle proportional to the number of people in that intervention, and the line between the circles represents the existence of a direct comparison between the two interventions, with the thickness of the line representing the proportional number of studies), (B) Area under the Cumulative Probability Curve(Surface Under the Cumulative Ranking Curve of different intervention, CF, Cisplatin + Fluorouracil; NI, Nivolumab + Ipilimumab,P-CF, Pembrolizumab + Cisplatin + Fluorouracil,CET-CF, Cetuximab + Cisplatin + Fluorouracil,N-CF, Nivolumab + Cisplatin + Fluorouracil,Nim-CF, Nimotuzumab + Cisplatin + Fluorouracil,Ser-CF, Serplulimab + Cisplatin + Fluorouracil), (C) Forest Plot.
Furthermore, skin disorders were mentioned in six articles (13, 15–20), as shown in Figure 10. The network diagram (Figure 10A) did not form a closed-loop structure between CF and the various interventions. Compared to CF, CET-CF [OR=5.58e+22, 95% CI (1.04e+03, 4.20e+71)], N-CF [OR=3.99, 95% CI (1.87, 9.55)], NI [OR=11.7, 95% CI (5.85, 27.2)], Nim-CF [OR=3.77, 95% CI (1.02, 18.4)], P-CF [OR=1.91, 95% CI (1.07, 3.51)], and Ser-CF [OR=2.30, 95% CI (0.921, 6.96)] were analyzed. It was observed that all interventions had a higher probability of causing skin adverse events compared to CF, with CET-CF having the highest probability and Ser-CF having the lowest probability. The area under the cumulative ranking curve indicated that CF had the highest impact (98.7%), followed by P-CF (73.2%), Ser-CF (65.0%), and CET-CF (0.00%) (Figure 10B; Table 3).
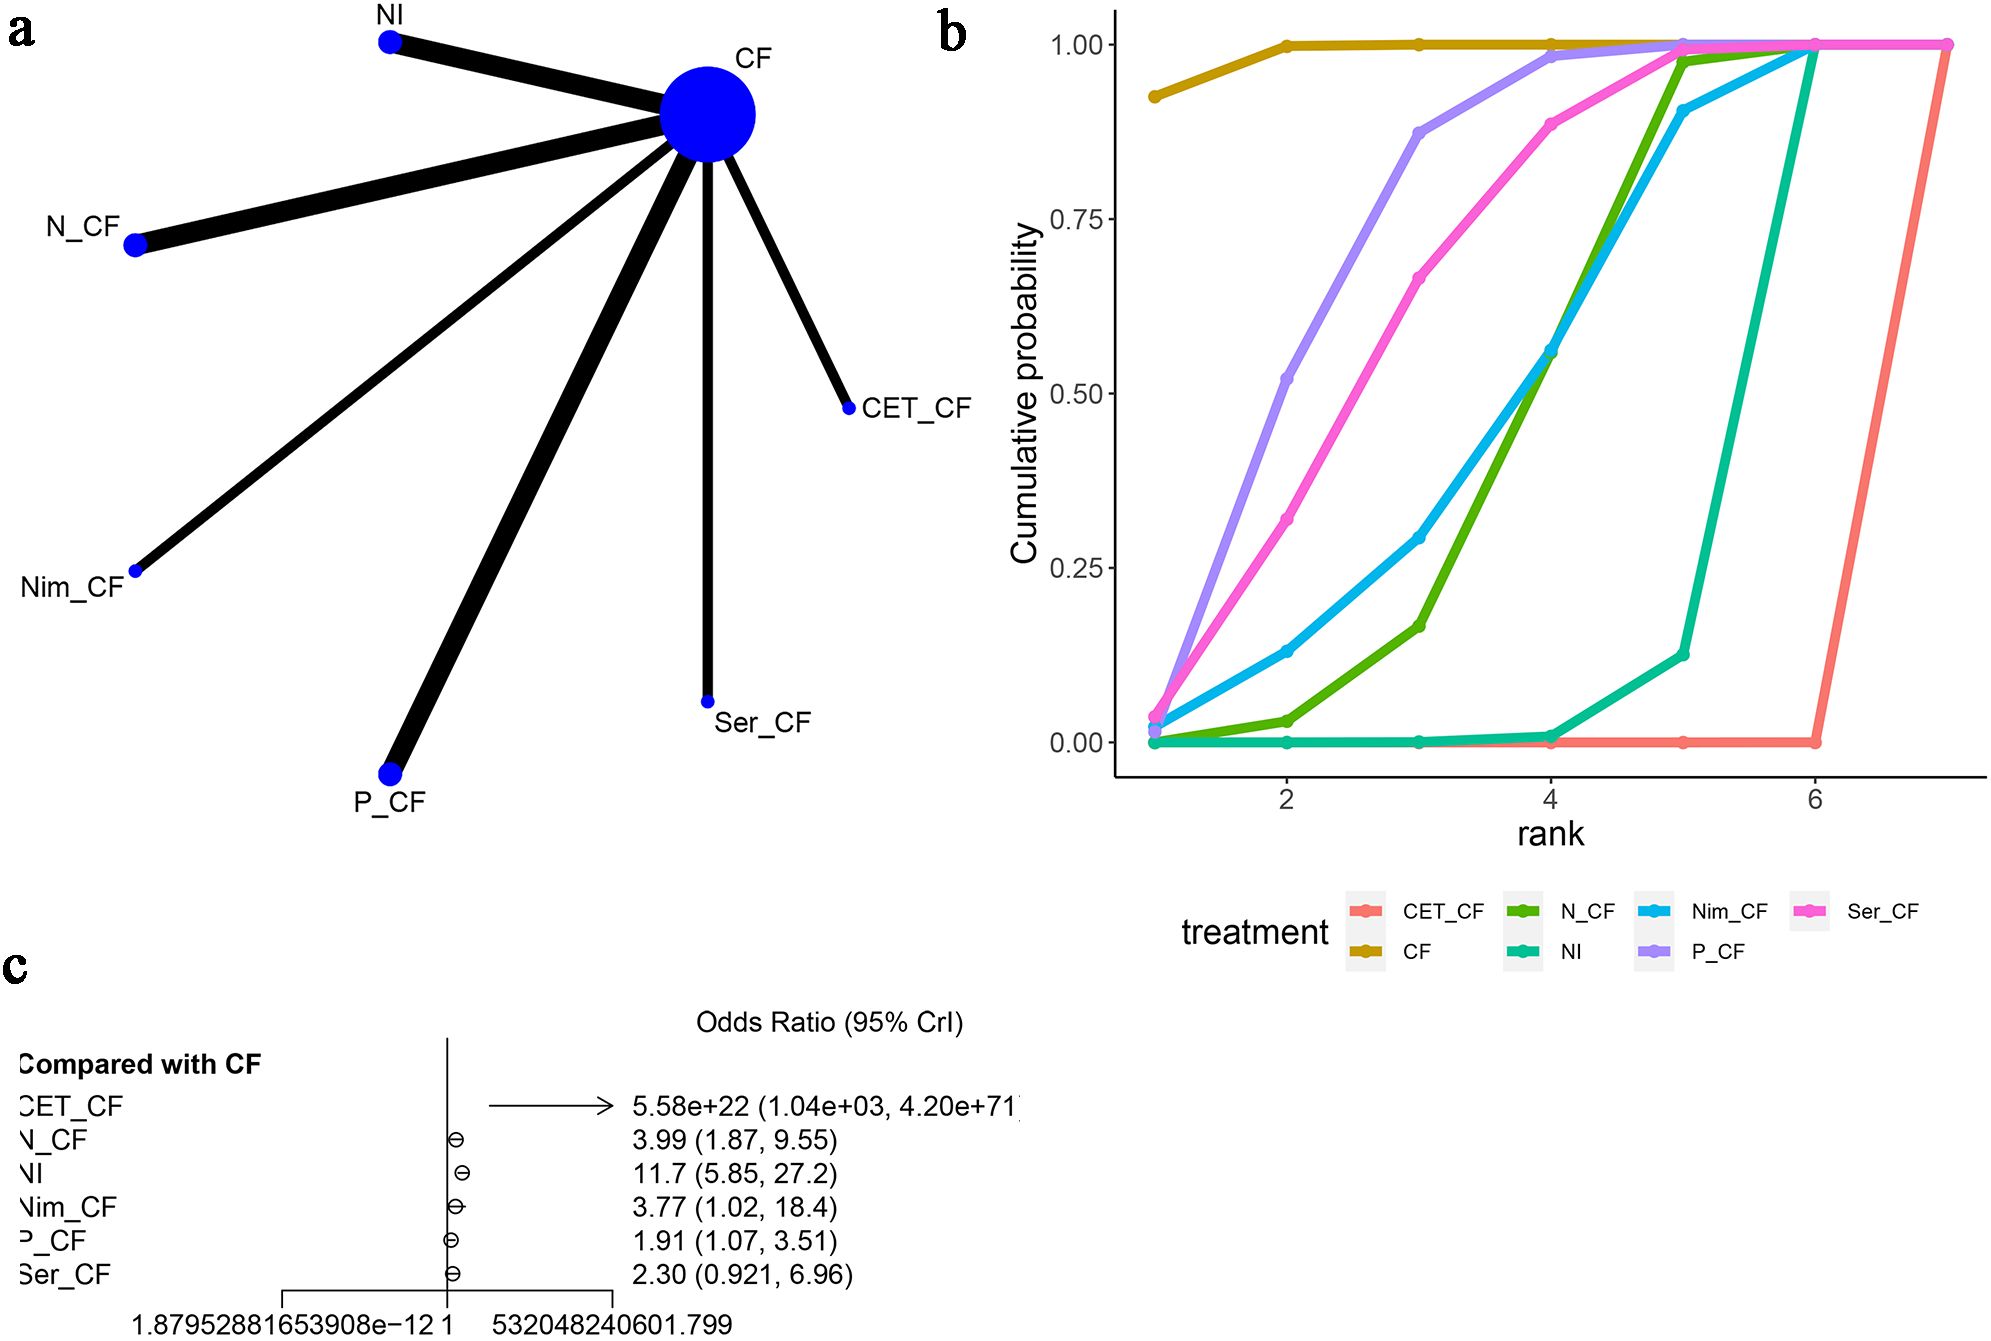
Figure 10. Meta-Analysis of SKIN. (A) Network Plot(Each circle represents a different intervention, with the size of the circle proportional to the number of people in that intervention, and the line between the circles represents the existence of a direct comparison between the two interventions, with the thickness of the line representing the proportional number of studies), (B) Area under the Cumulative Probability Curve(Surface Under the Cumulative Ranking Curve of different intervention, CF, Cisplatin + Fluorouracil; NI, Nivolumab + Ipilimumab,P-CF, Pembrolizumab + Cisplatin + Fluorouracil,CET-CF, Cetuximab + Cisplatin + Fluorouracil,N-CF, Nivolumab + Cisplatin + Fluorouracil,Nim-CF, Nimotuzumab + Cisplatin + Fluorouracil,Ser-CF, Serplulimab + Cisplatin + Fluorouracil), (C) Forest Plot.
Six articles (15–20) reported instances of anorexic adverse reactions, as depicted in Figure 11. The network diagram (Figure 11A) indicates that the various treatment regimens did not form a closed-loop structure. Direct comparisons exist between CF and NI, CF and N-CF, CF and Nim-CF, CF and P-CF, and CF and Ser-CF. Compared to CF, the odds ratios (OR) and 95% confidence intervals (CI) for anorexic reactions are as follows: N-CF [OR=2.6, 95%CI (0.14, 59.0)], NI [OR=1.0, 95%CI (0.057, 23.0)], Nim-CF [OR=0.68, 95%CI (0.011, 40.0)], P-CF [OR=1.9, 95%CI (0.11, 33.0)], and Ser-CF [OR=1.1, 95%CI (0.020, 64.0)]. From this, it can be inferred that the likelihood of experiencing anorexia is higher with N-CF and lower with Nim-CF (Figure 11C). The cumulative ranking probability curves indicate that Nim-CF had the highest area under the curve (62.1%), followed by CF (57.6%), NI (54.4%), and N-CF (33.3%) being the lowest (Figure 11B; Table 3). Based on these four adverse reactions, it can be concluded that CET-CF has a higher probability of presenting the aforementioned adverse events, while NI has a lower probability.
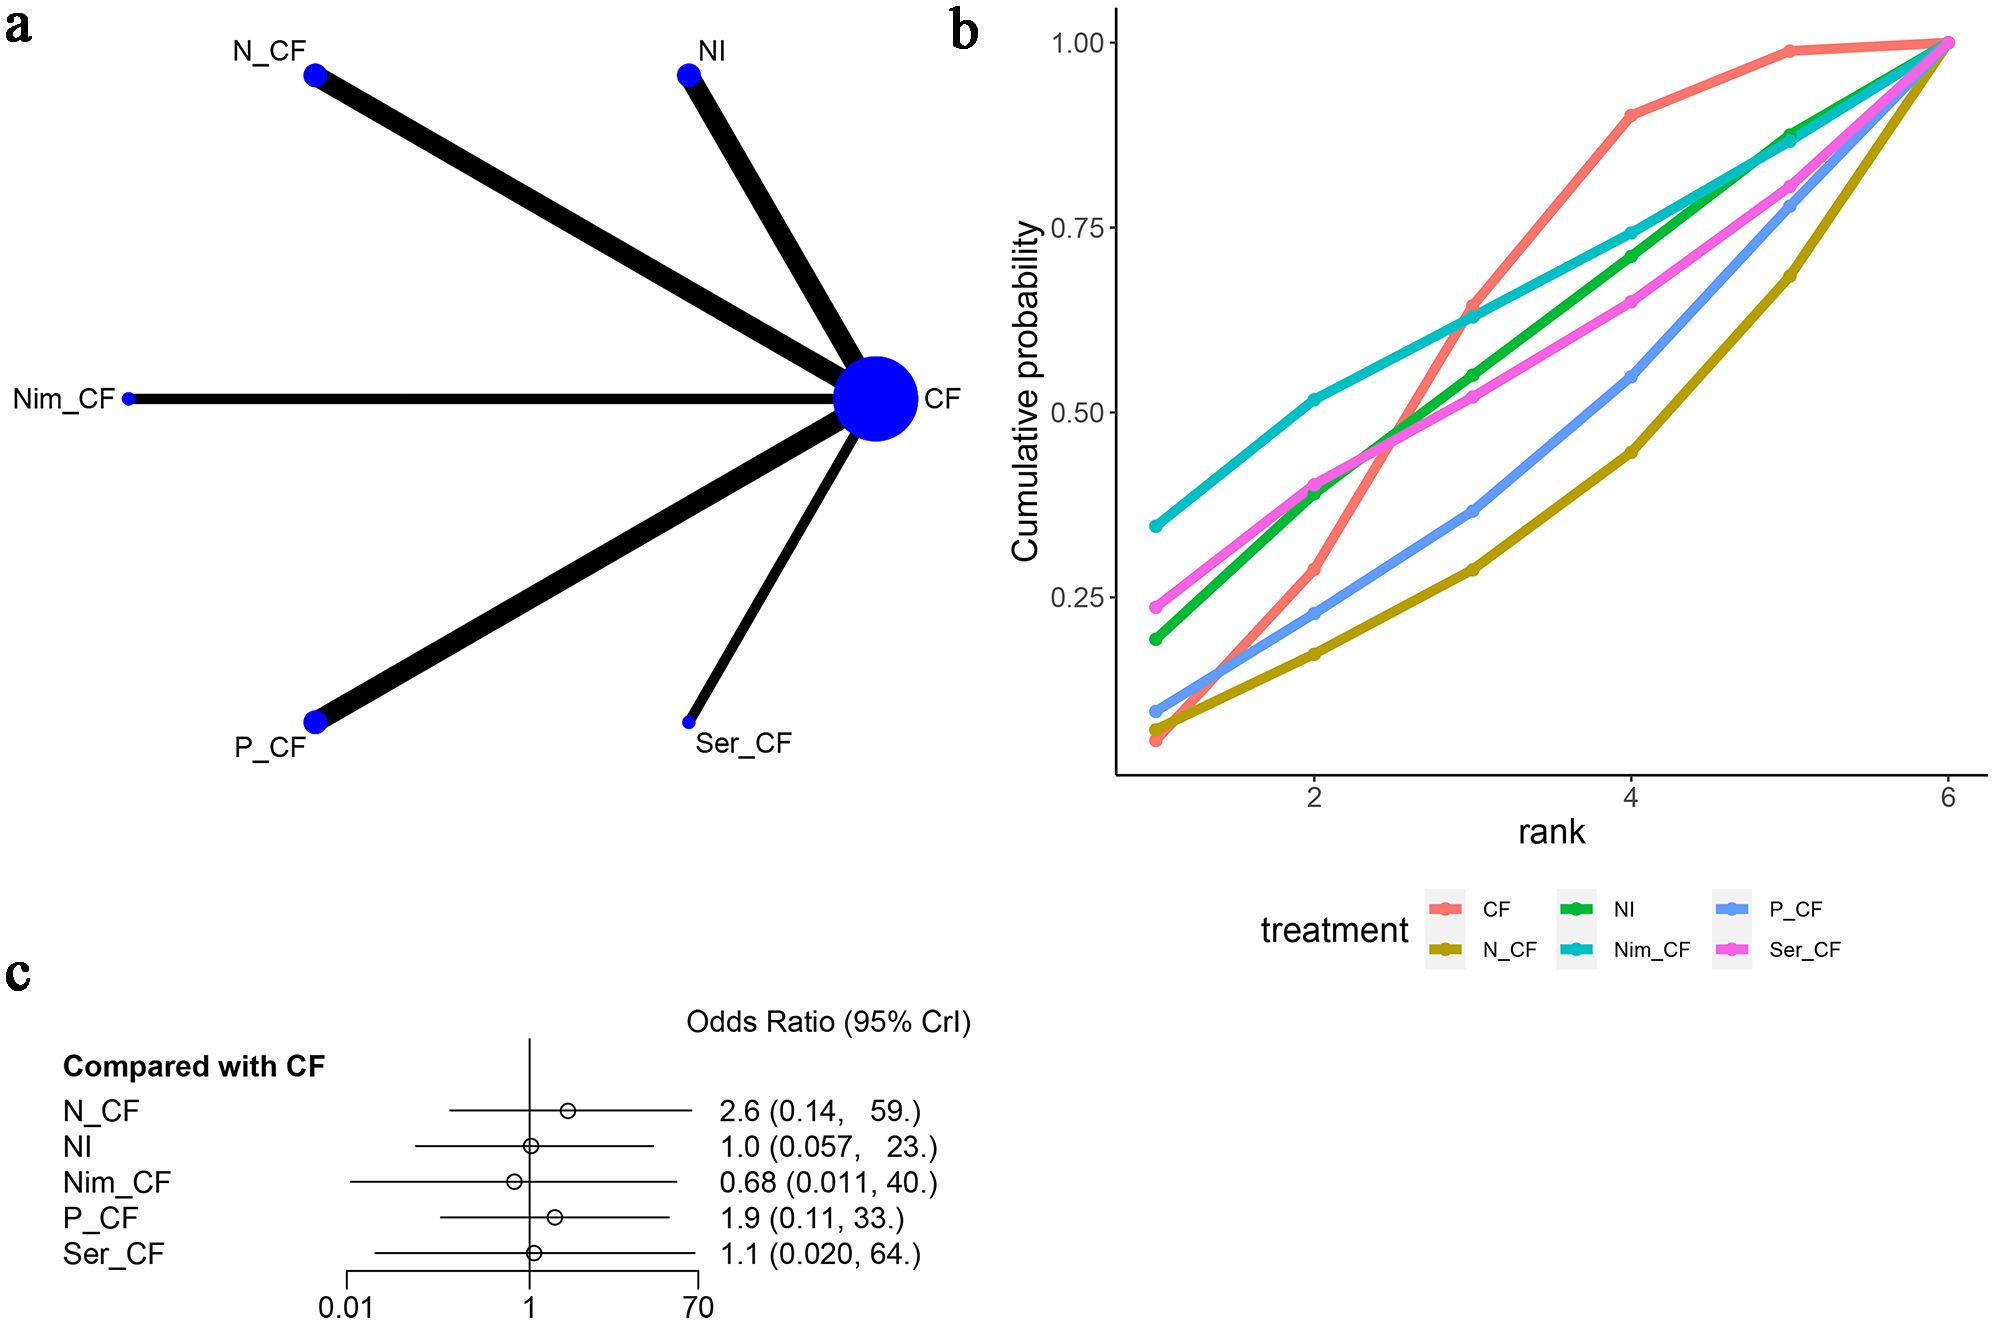
Figure 11. Meta-Analysis of Anorexia. (A) Network Plot(Each circle represents a different intervention, with the size of the circle proportional to the number of people in that intervention, and the line between the circles represents the existence of a direct comparison between the two interventions, with the thickness of the line representing the proportional number of studies), (B) Area under the Cumulative Probability Curve(Surface Under the Cumulative Ranking Curve of different intervention, CF, Cisplatin + Fluorouracil; NI, Nivolumab + Ipilimumab,P-CF, Pembrolizumab + Cisplatin + Fluorouracil,N-CF, Nivolumab + Cisplatin + Fluorouracil,Nim-CF, Nimotuzumab + Cisplatin + Fluorouracil,Ser-CF, Serplulimab + Cisplatin + Fluorouracil), (C) Forest Plot.
In summary, based on the four types of adverse reactions mentioned above, CET-CF had a higher probability of causing these adverse events, while NI had a lower probability.
3.7 Publication bias assessment
We used funnel plots to assess publication bias for ORR, DCR, and the four discussed adverse reactions in this article. The results indicated a significant likelihood of publication bias for ORR, DCR, and the four adverse reactions (Suplementary Table S2, Suplementary Figures S1-S6).
4 Discussion
We have observed that many articles primarily focus on comparing two treatment regimens or evaluating the efficacy and safety of neoadjuvant therapy regimens, with most of them comparing two different interventions (21, 22). This study, for the first time, evaluates the efficacy and safety of various first-line treatment approaches for esophageal cancer, marking the novelty of our research.
Our study did not find a significant improvement in overall survival (OS) and progression-free survival (PFS) when comparing different intervention measures with CF (Cisplatin + fluorouracil) as the reference. According to the SUCRA(Surface Under the Cumulative Ranking) ranking, it appeared that Ser-CF (Serplulimab + Cisplatin + fluorouracil) might have the most favorable effects on OS and PFS, followed by P-CF (Pembrolizumab + Cisplatin + fluorouracil). In terms of objective response rate (ORR), N-CF (Nivolumab + Cisplatin + fluorouracil) significantly improved ORR, while CET-CF (Cetuximab + cisplatin + fluorouracil) notably extended disease control rate (DCR). However, CET-CF was associated with a higher probability of adverse effects such as nausea, vomiting, neutropenia, and rash.
Some studies have demonstrated that cetuximab in combination with standard chemotherapy can significantly improve the PFS and OS of esophageal cancer patients (23). A possible explanation, based on literature review, could be that CET might have negative interactions with platinum-based drugs, possibly limiting their ability to induce oxidative damage (24). In line with most articles, cetuximab can enhance ORR and DCR in esophageal cancer patients (25), but it has been noted that its use is associated with a higher likelihood of rash (24). Nimotuzumab, when combined with CF treatment, has shown promising antitumor activity and good tolerability (4). Cetuximab and nimotuzumab are both EGFR antibodies that inhibit tumor cell growth, angiogenesis, and apoptosis. However, nimotuzumab’s unique property of requiring bivalent binding for stable attachment to cell surfaces potentially confers greater clinical benefit and is not associated with severe skin toxicity (4). Possible reasons for the lack of significant improvement in OS and PFS for the two targeted drugs mentioned in this article may include the influence of various molecular factors, such as EGFR gene copy number, KRAS mutations, AKT, ERK, and other biomarkers (26). Previous studies suggested that cetuximab may be ineffective in patients with low EGFR expression, and resistance to EGFR-targeted therapy can arise due to EGFR signaling-related gene mutations (27).
Comparing CF and CD (cisplatin + docetaxel) regimens, it has been reported that CD did not improve the OS and PFS of esophageal cancer patients in the final concurrent chemoradiotherapy (CCRT) (21). This suggests that CF remains the current standard chemotherapy regimen. One of the most significant advancements in the treatment of cancer was immunotherapy, particularly immune checkpoint inhibitors(ICIs).As mentioned above, Ser-CF (Serplulimab + Cisplatin + fluorouracil) might have the most favorable effects on OS and PFS. Some studies also have demonstrated that Serplulimab had the highest probability for better OS and PFS in other solid tumors (28). Serplulimab is a novel humanized anti-PD-1 monoclonal antibody and it has high receptor occupancy and strong target action level. Compared with other ICIs in the paper, Serplulimab had no antibody-dependent cell-mediated cytotoxicity(ADCC) and complement dependent cytotoxicity(CDC) effects and could avoid the elimination of T cells, so that it can fully kill tumor cells and play a better curative effect (29, 30). Evidence indicates that intrinsic factors of tumor cells, such as PD-L1 expression, tumor mutational burden, and microsatellite instability-high status, are associated with the efficacy of immune checkpoint inhibitors (31). In the KEYNOTE-180 trial, it was demonstrated that patients with high PD-L1 expression (CPS ≥ 10) had higher OS rates than those with low PD-L1 expression (31). Several articles have analyzed that for esophageal squamous cell carcinoma (ESCC) patients with low or negative PD-L1 expression, anti-PD-L1 treatment may not provide a survival advantage (32–34), and the incidence of treatment-related adverse events and ≥Grade 3 adverse events was lower in the immune checkpoint inhibitor (ICI) group (35).
In this article, differences among the top-ranked interventions combining immunotherapy and chemotherapy do not appear to be significant. This may be attributed to the lack of subgroup analysis based on PD-L1 expression levels in the network meta-analysis. Upon reviewing the included original articles, it was reasonable that a considerable portion of the total population had low PD-L1 expression. This aligns with the conclusion from related literature that adding ICI to esophageal cancer patients with low PD-L1 expression does not confer benefits. Therefore, it can be inferred that the lack of significant differences among these intervention measures is likely due to the inclusion of a substantial number of patients with low PD-L1 expression.
It is essential to acknowledge the limitations of this article. Firstly, we did not conduct a subgroup analysis of PD-L1 expression levels among the included studies but evaluated all patients as a whole, leading to limited variation in the results. Secondly, we did not perform subgroup analysis based on histological types of esophageal cancer.
5 Conclusion
Based on the current research, it can be concluded that all of the above measures contribute to the improvement of Overall Survival (OS) and Progression-Free Survival (PFS). Among these, the Ser-CF regimen appears to be the most effective in enhancing OS and PFS outcomes, while N-CF significantly extends Objective Response Rate (ORR), and CET-CF notably prolongs Disease Control Rate (DCR). It is important to note that CET-CF is associated with a higher probability of adverse events such as nausea, vomiting, neutropenia, and skin rash.
Author contributions
HS: Writing – review & editing, Conceptualization, Data curation, Formal analysis, Investigation, Methodology, Software, Writing – original draft. YT: Conceptualization, Investigation, Methodology, Software, Writing – original draft. CM: Project administration, Supervision, Validation, Writing – original draft. YW: Conceptualization, Data curation, Writing – original draft. FS: Data curation, Formal analysis, Project administration, Writing – original draft. JW: Project administration, Methodology, Writing – original draft. CX: Conceptualization, Funding acquisition, Resources, Writing – original draft. RL: Conceptualization, Funding acquisition, Resources, Data curation, Formal analysis, Methodology, Writing – review & editing.
Funding
The author(s) declare financial support was received for the research, authorship, and/or publication of this article. This research was supported by the National Natural Science Foundation of China (81402477), Natural Science Foundation of Jiangsu Province of China (BK20140295), Jiangsu Government Scholarship for Oversea Studies ((2018) No. 73), Clinical Research Project of Wu Jieping Medical Foundation (320.6750.2021-16-62), Suzhou Science and Technology Plan (SZM2021012, SKY2022092, SMZ2022009), Beijing Xisike Clinical Oncology Research Foundation (Y-HH202101-0059), Clinical Medicine peak project of Soochow Medical College, Soochow University (ML42900423),Suzhou Scientific Research Project (SKJY2021072).
Conflict of interest
The authors declare that the research was conducted in the absence of any commercial or financial relationships that could be construed as a potential conflict of interest.
Publisher’s note
All claims expressed in this article are solely those of the authors and do not necessarily represent those of their affiliated organizations, or those of the publisher, the editors and the reviewers. Any product that may be evaluated in this article, or claim that may be made by its manufacturer, is not guaranteed or endorsed by the publisher.
Supplementary material
The Supplementary Material for this article can be found online at: https://www.frontiersin.org/articles/10.3389/fonc.2024.1397960/full#supplementary-material
References
1. Jiang Z, Wang J, Shen Z, Zhang Z, Wang S. Characterization of esophageal microbiota in patients with esophagitis and esophageal squamous cell carcinoma. Front Cell Infection Microbiol. (2021) 11. doi: 10.3389/fcimb.2021.774330
2. Niu C, Liu Y, Wang J, Liu Y, Zhang S, Zhang Y, et al. Risk factors for esophageal squamous cell carcinoma and its histological precursor lesions in China: a multicenter cross-sectional study. BMC Cancer. (2021) 21:1034. doi: 10.1186/s12885-021-08764-x
3. Uhlenhopp DJ, Then EO, Sunkara T, Gaduputi V. Epidemiology of esophageal cancer: update in global trends, etiology and risk factors. Clin J Gastroenterol. (2020) 13:1010–21. doi: 10.1007/s12328-020-01237-x
4. Hirano H, Kato K. Systemic treatment of advanced esophageal squamous cell carcinoma: chemotherapy, molecular-targeting therapy and immunotherapy. Jpn J Clin Oncol. (2019) 49:412–20. doi: 10.1093/jjco/hyz034
5. Rogers JE, Yamashita K, Sewastjanow-Silva M, Rosa Vicentini E, Waters R, Ajani JA. Nivolumab combination therapy as first-line treatments for unresectable, advanced or metastatic esophageal squamous cell carcinoma. Expert Rev Anticancer Ther. (2023) 23:565–71. doi: 10.1080/14737140.2023.2207826
6. Hirose T, Yamamoto S, Kato K. Pembrolizumab for first-line treatment of advanced unresectable or metastatic esophageal or gastroesophageal junction cancer. Ther Adv Gastroenterol. (2023) 16:17562848221148250. doi: 10.1177/17562848221148250
7. Shitara K, Ajani JA, Moehler M, Garrido M, Gallardo C, Shen L, et al. Nivolumab plus chemotherapy or ipilimumab in gastro-esophageal cancer. Nature. (2022) 603:942–8. doi: 10.1038/s41586-022-04508-4
8. Nakamura H, Shionoya A, Arihara Y, Hayasaka N, Kubo T, Usami M, et al. Pemphigus vulgaris as an immune-related adverse event in recurrent metastatic esophageal squamous cell carcinoma treated with ipilimumab plus nivolumab: a case report and literature review. Front Immunol. (2023) 14:1259071. doi: 10.3389/fimmu.2023.1259071
9. Sterne JAC, Savović J, Page MJ, Elbers RG, Blencowe NS, Boutron I, et al. RoB 2: a revised tool for assessing risk of bias in randomized trials. BMJ. (2019) 366:l4898. doi: 10.1136/bmj.l4898
10. Chan BKC. Data analysis using R programming. Adv Exp Med Biol. (2018) 1082:47–122. doi: 10.1007/978-3-319-93791-5_2
11. Tavakoli AA. Introduction to programming for radiologists with the software R. Radiologe. (2021) 61:296–9. doi: 10.1007/s00117-021-00813-7
12. Jansen JP, Crawford B, Bergman G, Stam W. Bayesian meta-analysis of multiple treatment comparisons: an introduction to mixed treatment comparisons. Value Health. (2008) 11:956–64. doi: 10.1111/j.1524-4733.2008.00347.x
13. Lorenzen S, Schuster T, Porschen R, Al-Batran SE, Hofheinz R, Thuss-Patience P, et al. Cetuximab plus cisplatin-5-fluorouracil versus cisplatin-5-fluorouracil alone in first-line metastatic squamous cell carcinoma of the esophagus: a randomized phase II study of the Arbeitsgemeinschaft Internistische Onkologie. Ann Oncol: Off J Eur Soc Med Oncol. (2009) 20:1667–73. doi: 10.1093/annonc/mdp069
14. Zhu Y, Zhang W, Li Q, Li Q, Qiu B, Liu H, et al. A phase II randomized controlled trial: definitive concurrent chemoradiotherapy with docetaxel plus cisplatin versus 5-fluorouracil plus cisplatin in patients with esophageal squamous cell carcinoma. J Cancer. (2017) 8:3657–66. doi: 10.7150/jca.20053
15. de Castro Junior G, Segalla JG, de Azevedo SJ, Andrade CJ, Grabarz D, de Araújo Lima França B, et al. A randomized phase II study of chemoradiotherapy with or without nimotuzumab in locally advanced esophageal cancer: NICE trial. Eur J Cancer (Oxford England: 1990). (2018) 88:21–30. doi: 10.1016/j.ejca.2017.10.005
16. Sun JM, Shen L, Shah MA, Enzinger P, Adenis A, Doi T, et al. Pembrolizumab plus chemotherapy versus chemotherapy alone for first-line treatment of advanced esophageal cancer (KEYNOTE-590): a randomized, placebo-controlled, phase 3 study. Lancet. (2021) 398:759–71. doi: 10.1016/S0140-6736(21)01234-4
17. Doki Y, Ajani JA, Kato K, Xu J, Wyrwicz L, Motoyama S, et al. Nivolumab combination therapy in advanced esophageal squamous-cell carcinoma. N Engl J Med. (2022) 386:449–62. doi: 10.1056/NEJMoa2111380
18. Kojima T, Hara H, Tsuji A, Yasui H, Muro K, Satoh T, et al. First-line pembrolizumab + chemotherapy in Japanese patients with advanced/metastatic esophageal cancer from KEYNOTE-590. Esophagus. (2022) 19:683–92. doi: 10.1007/s10388-022-00920-x
19. Kato K, Doki Y, Ogata T, Motoyama S, Kawakami H, Ueno M, et al. First-line nivolumab plus ipilimumab or chemotherapy versus chemotherapy alone in advanced esophageal squamous cell carcinoma: a Japanese subgroup analysis of open-label, phase 3 trial (CheckMate 648/ONO-4538-50). Esophagus. (2023) 20:291–301. doi: 10.1007/s10388-022-00970-1
20. Song Y, Zhang B, Xin D, Kou X, Tan Z, Zhang S, et al. First-line serplulimab or placebo plus chemotherapy in PD-L1-positive esophageal squamous cell carcinoma: a randomized, double-blind phase 3 trial. Nat Med. (2023) 29:473–82. doi: 10.1038/s41591-022-02179-2
21. Jiang H, Makelike K, Chen B, Xi M, Li Q, Hu Y, et al. Definitive concurrent chemoradiotherapy with docetaxel plus cisplatin versus 5-fluorouracil plus cisplatin in patients with esophageal squamous cell carcinoma: long-term follow-up results of a phase II randomized controlled trial. Radiat Oncol. (2023) 18:150. doi: 10.1186/s13014-023-02339-9
22. Nishiwaki N, Noma K, Kunitomo T, Hashimoto M, Maeda N, Tanabe S, et al. Neoadjuvant chemotherapy for locally advanced esophageal cancer comparing cisplatin and 5-fluorouracil versus docetaxel plus cisplatin and 5-fluorouracil: a propensity score matching analysis. Esophagus. (2022) 19:626–38. doi: 10.1007/s10388-022-00934-5
23. Tian X, Zhou JG, Zeng Z, Shuai T, Yi LJ, Ma L, et al. Cetuximab in patients with esophageal cancer: a systematic review and meta-analysis of randomized controlled trials. Med Oncol. (2015) 32:127. doi: 10.1007/s12032-015-0521-2
24. Huang ZH, Ma XW, Zhang J, Li X, Lai NL, Zhang SX. Cetuximab for esophageal cancer: an updated meta-analysis of randomized controlled trials. BMC Cancer. (2018) 18:1170. doi: 10.1186/s12885-018-5040-z
25. Acharya R, Mahapatra A, Verma HK, Bhaskar L. Unveiling therapeutic targets for esophageal cancer: A comprehensive review. Curr Oncol. (2023) 30:9542–68. doi: 10.3390/curroncol30110691
26. Xu S, Ramos-Suzarte M, Bai X, Xu B. Treatment outcome of nimotuzumab plus chemotherapy in advanced cancer patients: a single institute experience. Oncotarget. (2016) 7:33391–407. doi: 10.18632/oncotarget.v7i22
27. Yang YM, Hong P, Xu WW, He QY, Li B. Advances in targeted therapy for esophageal cancer. Signal Transduct Target Ther. (2020) 5:229. doi: 10.1038/s41392-020-00323-3
28. Zhang T, Li W, Diwu D, Chen L, Chen X, Wang H. Efficacy and safety of first-line immunotherapy plus chemotherapy in treating patients with extensive-stage small cell lung cancer: a Bayesian network meta-analysis. Front Immunol. (2023) 14:1197044. doi: 10.3389/fimmu.2023.1197044
29. Qin S, Li J, Zhong H, Jin C, Chen L, Yuan X, et al. Serplulimab, a novel anti-PD-1 antibody, in patients with microsatellite instability-high solid tumors: an open-label, single-arm, multicenter, phase II trial. Br J Cancer. (2022) 127(12):2241–8. doi: 10.1038/s41416-022-02001-3
30. Lee A. Serplulimab: first approval. Drugs. (2022) 82(10):1137–41. doi: 10.1007/s40265-022-01740-0
31. Baba Y, Nomoto D, Okadome K, Ishimoto T, Iwatsuki M, Miyamoto Y, et al. Tumor immune microenvironment and immune checkpoint inhibitors in esophageal squamous cell carcinoma. Cancer Sci. (2020) 111:3132–41. doi: 10.1111/cas.14541
32. Yoon HH, Jin Z, Kour O, Kankeu Fonkoua LA, Shitara K, Gibson MK, et al. Association of PD-L1 expression and other variables with benefit from immune checkpoint inhibition in advanced gastroesophageal cancer: systematic review and meta-analysis of 17 phase 3 randomized clinical trials. JAMA Oncol. (2022) 8:1456–65. doi: 10.1001/jamaoncol.2022.3707
33. Zhao JJ, Yap DWT, Chan YH, Tan BKJ, Teo CB, Syn NL, et al. Low programmed death-ligand 1-expressing subgroup outcomes of first-line immune checkpoint inhibitors in gastric or esophageal adenocarcinoma. J Clin Oncol. (2022) 40:392–402. doi: 10.1200/JCO.21.01862
34. Yap DWT, Leone AG, Wong NZH, Zhao JJ, Tey JCS, Sundar R, et al. Effectiveness of immune checkpoint inhibitors in patients with advanced esophageal squamous cell carcinoma: A meta-analysis including low PD-L1 subgroups. JAMA Oncol. (2023) 9:215–24. doi: 10.1001/jamaoncol.2022.5816
Keywords: first-line systemic treatments for esophageal cancer first-line treatment, advanced esophageal squamous carcinoma, network meta-analysis, efficacy, safety
Citation: Shi H, Tan Y, Ma C, Wei Y, Shi F, Wang J, Xu C and Liang R (2024) Efficacy and safety evaluation of first-line systemic treatments for unresectable esophageal squamous cell carcinoma: a network meta-analysis. Front. Oncol. 14:1397960. doi: 10.3389/fonc.2024.1397960
Received: 08 March 2024; Accepted: 16 August 2024;
Published: 09 September 2024.
Edited by:
Liang Qiao, The University of Sydney, AustraliaReviewed by:
Debora Basile, San Giovanni Di Dio Hospital, ItalyMohamed Rahouma, NewYork-Presbyterian, United States
Copyright © 2024 Shi, Tan, Ma, Wei, Shi, Wang, Xu and Liang. This is an open-access article distributed under the terms of the Creative Commons Attribution License (CC BY). The use, distribution or reproduction in other forums is permitted, provided the original author(s) and the copyright owner(s) are credited and that the original publication in this journal is cited, in accordance with accepted academic practice. No use, distribution or reproduction is permitted which does not comply with these terms.
*Correspondence: Rongrui Liang, bGVuZ2JlbmdAc3VkYS5lZHUuY24=; Caihua Xu, Q2FpaHVheHVAc3VkYS5lZHUuY24=