 Jing Yang1†
 Kunhua Wu
94% of researchers rate our articles as excellent or good
Learn more about the work of our research integrity team to safeguard the quality of each article we publish.
Find out more
ORIGINAL RESEARCH article
Front. Oncol. , 13 June 2024
Sec. Cancer Imaging and Image-directed Interventions
Volume 14 - 2024 | https://doi.org/10.3389/fonc.2024.1392343
Purpose: To evaluate the effectiveness of MRI-based radiomics models in distinguishing between Warthin tumors (WT) and misdiagnosed or ambiguous pleomorphic adenoma (PA).
Methods: Data of patients with PA and WT from two centers were collected. MR images were used to extract radiomic features. The optimal radiomics model was found by running nine machine learning algorithms after feature reduction and selection. To create a clinical model, univariate logistic regression (LR) analysis and multivariate LR were used. The independent clinical predictors and radiomics were combined to create a nomogram. Two integrated models were constructed by the ensemble and stacking algorithms respectively based on the clinical model and the optimal radiomics model. The models’ performance was evaluated using the area under the curve (AUC).
Results: There were 149 patients included in all. Gender, age, and smoking of patients were independent clinical predictors. With the greatest average AUC (0.896) and accuracy (0.839) in validation groups, the LR model was the optimal radiomics model. In the average validation group, the radiomics model based on LR did not have a higher AUC (0.795) than the clinical model (AUC = 0.909). The nomogram (AUC = 0.953) outperformed the radiomics model in terms of discrimination performance. The nomogram in the average validation group had a highest AUC than the stacking model (0.914) or ensemble model (0.798).
Conclusion: Misdiagnosed or ambiguous PA and WT can be non-invasively distinguished using MRI-based radiomics models. The nomogram exhibited excellent and stable diagnostic performance. In daily work, it is necessary to combine with clinical parameters for distinguishing between PA and WT.
Up to 80% of parotid tumors are benign with the two most common types being pleomorphic adenoma (PA) and Warthin tumor (WT) (1, 2). Compared with WT, PA exhibits a higher potential for malignant transformation and recurrence, so the surgical approaches and prognosis are completely different (3, 4). Hence, for the purpose of precisely and individually treating patients with benign parotid tumors, it is crucial to accurately distinguish between PA and WT.
At present, the preoperative diagnosis of PA or WT relies on fine needle aspiration cytology (FNAC) and radiological images. However, FNAC is not always conclusive because of sampling difficulties and the experience of pathologist (5, 6). Furthermore, FNAC is invasive, which may lead to hemorrhage (7), inflammation (8), and dissemination of tumor cells along the needle route (9). Patients with similar clinical factors may have varying outcomes, and it is often difficult to definitively distinguish between WT and PA based solely on clinical factors. In comparison to CT and needle biopsy, MRI offers several advantages such as non-invasiveness, absence of radiation, and excellent soft tissue resolution (10). In the evaluation of parotid tumors, MRI can provide information about the size, location, shape, and characteristics of the tumor, which can help guide treatment decisions (11, 12). Nonetheless, conventional MRI differential diagnosis has not always been adequate because of the substantial overlap in morphological features between PA and WT. In addition, conventional MRI diagnosis may have a subjective component and depend on the expertise and experience of radiologist (13).
Radiomics can extract high throughput of quantitative features by converting images into amenable data, and the analyzing these data for decision support (14). Radiomics can provide much more comprehensive information from medical images than human eyes (15). In recent years, radiomics has been widely used for preoperative diagnosis of parotid tumors (16–18). Some previous studies have tried to discriminate benign and malignant parotid tumors using radiomics (19, 20), but only a few of them have analyzed the differentiation of PA from WT (21, 22). However, there is no research focused on differentiating misdiagnosed or ambiguous PA and WT using radiomics.
Therefore, we use a variety of machine learning methods to establish different MRI-based radiomics models and determine the optimal radiomics models for identifying misdiagnosed or ambiguous PA and WT. By integrating a variety of models combining radiomics and clinical parameters, we evaluate the effect of multimode combined application in differential diagnosis of the disease, so as to improve the accuracy of diagnosis of the disease.
The ethical approval of two clinical centers approved this retrospective study. The informed consent was waived. All the enrolled patients with PA or WT were from centers A and B between January 2015 and June 2022. The inclusion criteria were as follows: (1) patients with WT or PA confirmed by operation and pathology; (2) PA and WT were diagnosed as misdiagnosed or ambiguous on Picture Archiving and Communication Systems (PACS); (3) complete clinical data; patients with satisfactory image quality; (4) underwent MR examination no more than 7 days before surgery. The exclusion criteria were as follows: (1) underwent parotid puncture, surgery, or chemoradiotherapy before MR examination; (2) PA and WT were identified on the PACS; (3) image quality unsatisfactory due to motion artifacts or false teeth artifacts, etc.; (4) absence of enhanced images. A total of 126 patients (76 PA, 50 WT) were assigned to training group (88 patients) and internal verification group (38 patients) and center B (23 patients) as external verification group according to 4:1. A follow diagram of the study population is shown in Figure 1. The clinical characteristics included gender, age, smoking history, lesion mobility, and lesion hardness were collected.
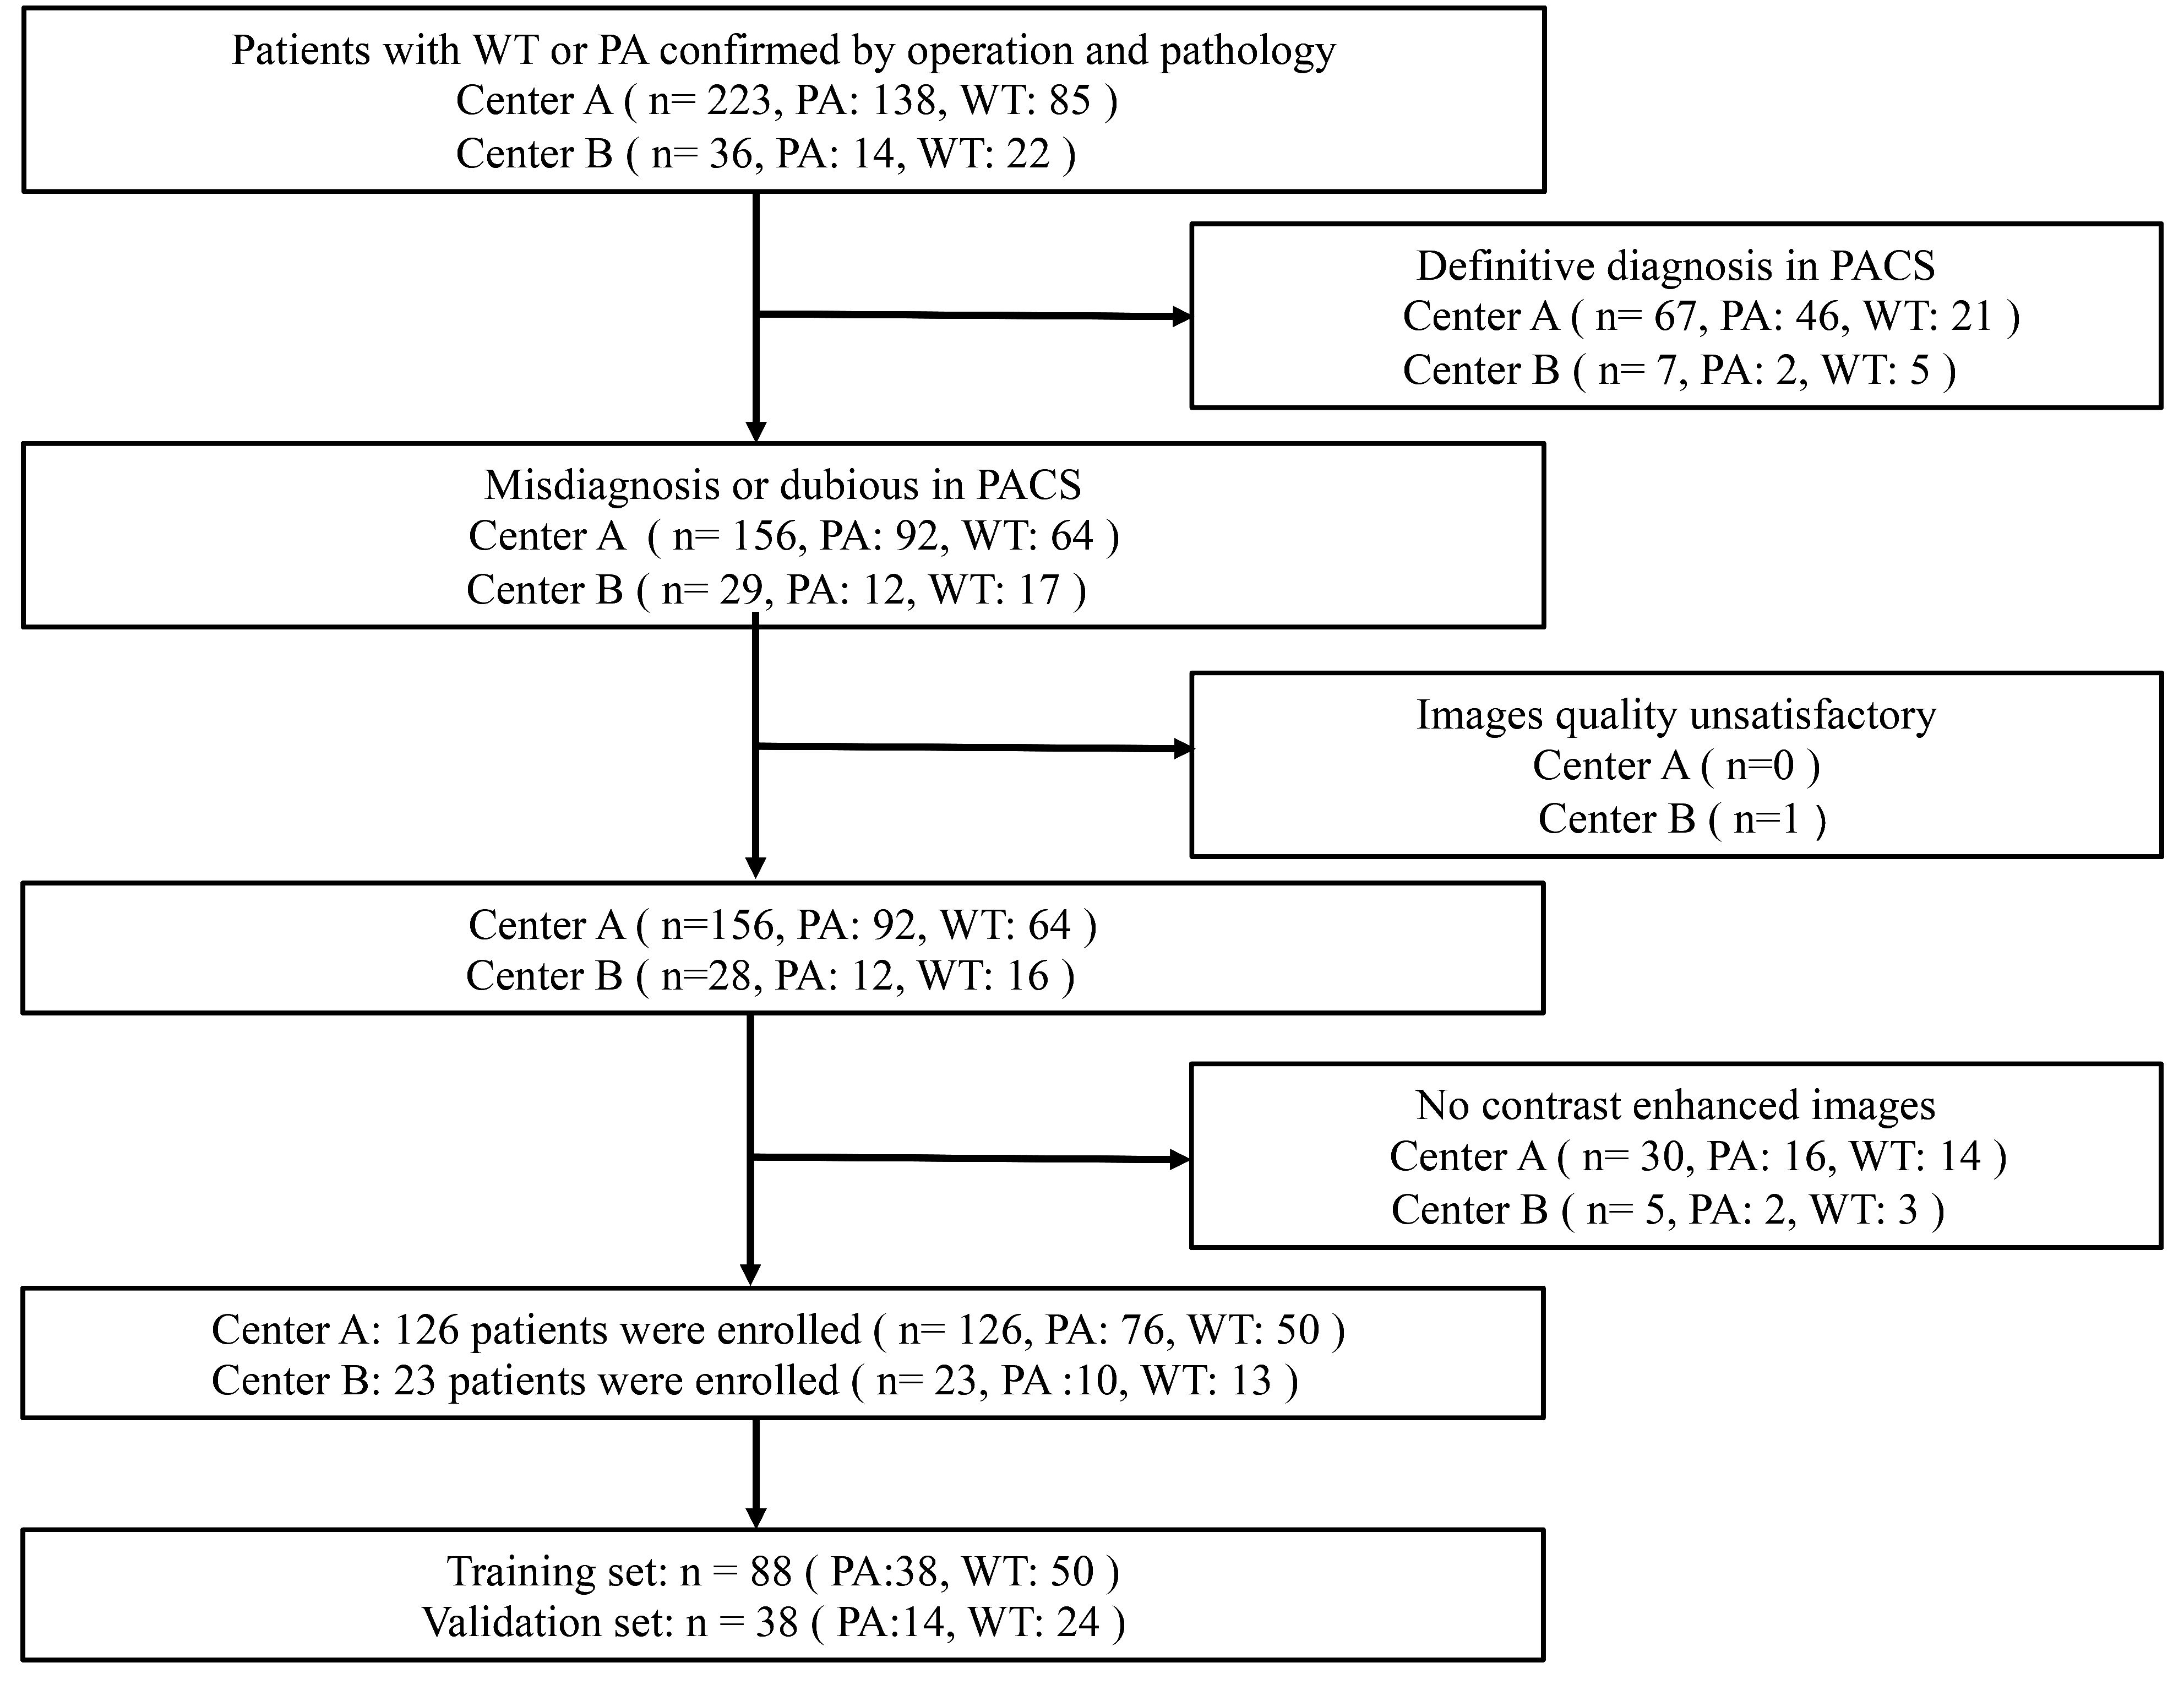
Figure 1 Flowchart for selecting the study population. PA, pleomorphic adenomas; WT, Warthin tumors.
All MR examinations were performed using 1.5/3.0-T scanners (Philips 1.5 T, Siemens Aera 1.5T, and Siemens Prisma 3.0T, GE Signa HDxt (3.0T). All patients underwent a preoperative MR examination using parotid scan protocol. Parameter details are shown in Table 1. The contrast-enhanced images were obtained after administered (0.1 mmol/kg) at a rate of 2.0 mL/s via the elbow vein.
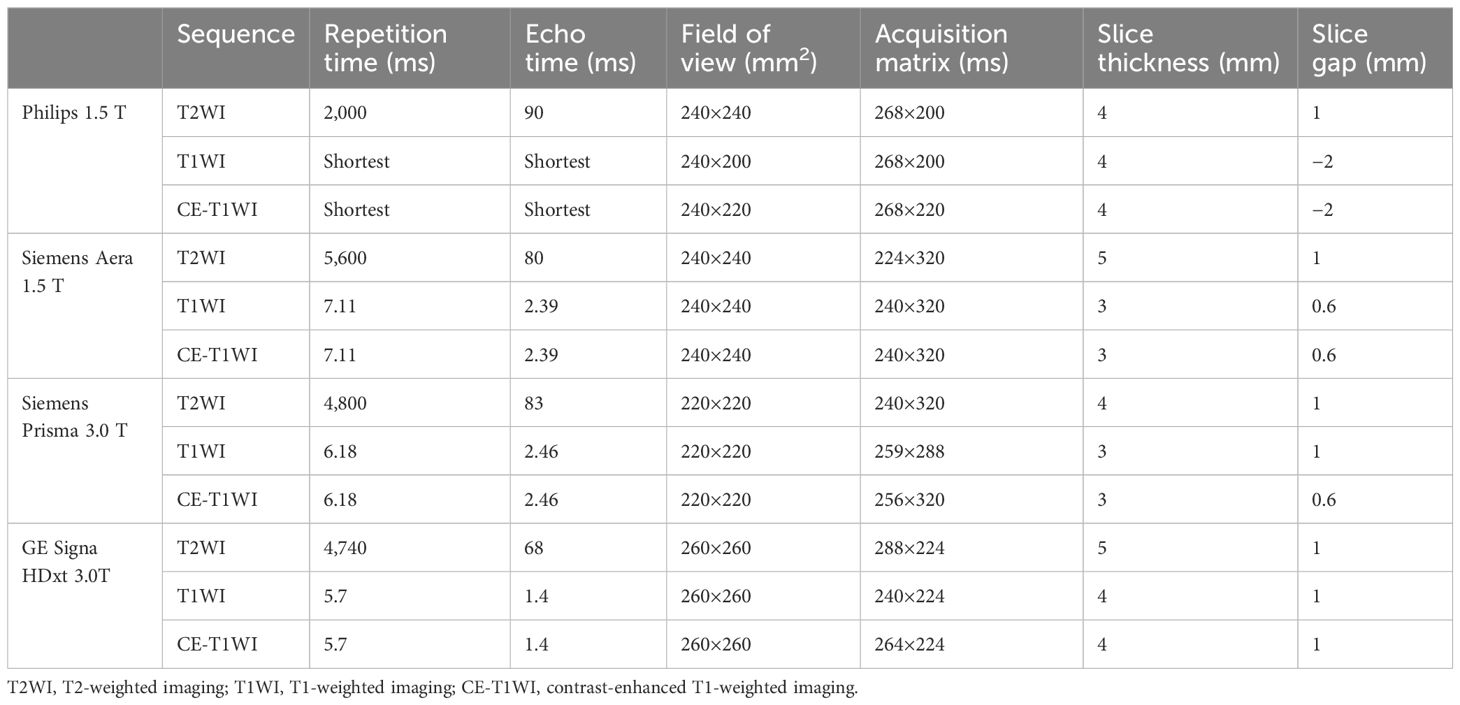
Table 1 The parameter details of primary sequences.
The MRI features were assessed by two radiologists (reader 1 with 8 years of experience in neck MRI and reader 2 with 6 years of experience in neck MRI). The radiologist was blinded to the clinical data and the histological results. The MRI features were as follows: (1) tumor location (left side or right side, superficial lobe or deep lobe of parotid); (2) tumor diameter (craniocaudal, transverse, and anteroposterior diameter); (3) lobulated appearance, cystic degeneration and capsule (absent or present) (13), (4) tumor margin (clear or unclear) (23); (5) “hamming sign,” which means tumor margin thin band or petal high signal on T2-weighted imaging (T2WI), more than 1/4 of the circumference of the same layer (24); (6) tumor homogeneity on T1-weighted imaging (T1WI), T2WI, and contrast-enhanced T1-weighted imaging (CE-T1WI) (24, 25).
MRI images of axial T2WI, T1WI, and CE-T1WI were stored in Digital Imaging and Communications in Medicine (DICOM) format and uploaded into 3D Slicer 4.11.0 software (https://www.slicer.org/). The segmentation of the tumors was performed by two radiologists (reader 1 and reader 2), who were blinded to the clinical information and histopathological results. The region of interest (ROI) of the lesion was manually delineated layer by layer to cover the whole tumor as largely as possible (including cystic and necrotic areas) but avoiding normal tissue to form a three-dimensional (3D) volume of interest (VOI). Reader 1 draws the ROI. Two months later, two readers (reader 1 and reader 2) had a brief review in the same case.
Pyradiomics (https://pypi.org/project/pyradiomics/) is an open-source Python software that was used for image preprocessing and feature extraction. The voxel size of 1 × 1 × 1 mm3 was resampled in order to improve the comparability of the MRI gray-level values (26). To standardize image intensity, the gray-level values in the photographs were spread across the range of 0–600. There were 5,343 radiomics features obtained for every patient out of the total 1,781 features that were extracted from each MRI sequence. Z score was used to standardize all of the aforementioned features.
The training group’s patient datasets for WT and PA were balanced by the application of the synthetic minority oversampling technique. For every feature, the intraclass correlation coefficient (ICC) was computed. Selection was made of features with ICC values ≥0.75 for both observers within and between. In order to determine whether features were redundant, Pearson correlation coefficients were obtained. When two features had a correlation coefficient of less than 0.9, the feature with the highest mean absolute correlation was eliminated. To find the most representative features, we employed a least absolute shrinkage and selection operator (LASSO) regression model and 10-fold cross-validation (27).
The differences in clinical parameters and conventional MRI features between PA and WT in the training group were compared using univariate analysis, and the clinical factors and MRI features with significant difference were determined. The univariate logistic regression (LR) analysis and multivariate LR were used to construct clinical model and find out clinical predictors.
In this study, nine mainstream machine learning algorithms were used to build radiomics models for distinguishing PA and WT, which included logistic regression (LR), K-nearest neighbor (KNN), support vector machine (SVM), random forest (RF), stochastic gradient descent (SGD), extremely randomized trees (ET), decision tree (DT), eXtreme Gradient Boosting (XGBoost), and Light Gradient Boosting Machine (LightGBM). In both the internal and external validation groups, the nine machine models’ diagnostic performances were assessed based on sensitivity, specificity, accuracy, and the area under the curve (AUC) of the receiver operating characteristic curve (ROC). The radiomics model with the highest average AUC was chosen as the optimal model. A radiomics score (radscore) was calculated for each patient.
A nomogram integrating independent clinical parameters and the radscore was constructed using multivariate LR analysis.
Using a meta-regression model to integrate many models, the stacking model, which is an ensemble learning technology that increases the accuracy of result prediction, was employed. A two-tier stacking model was used to calculate. The first tier used the predicted results of the clinical model and the optimal radiomics model, and the second tier used the results of the first tier as the input of the multivariate LR. These input properties were integrated using the meta-regressor to achieve model fusion (28).
Utilizing super learner, an integrated technique, the ensemble algorithm is developed (29). By employing the weighted average approach to derive the anticipated values from both the clinical model and the optimal radiomics model, the new output was ultimately utilized as the outcome.
The Python (https://www.python.org/getit/) was used to perform the above model building, and Figure 2 illustrates the detailed process of model structure. To evaluate the effectiveness and goodness of fit of each model, metrics such as sensitivity, specificity, accuracy, and the area under the curve (AUC) of the calibration curve and receiver operating characteristic curve (ROC) were employed.
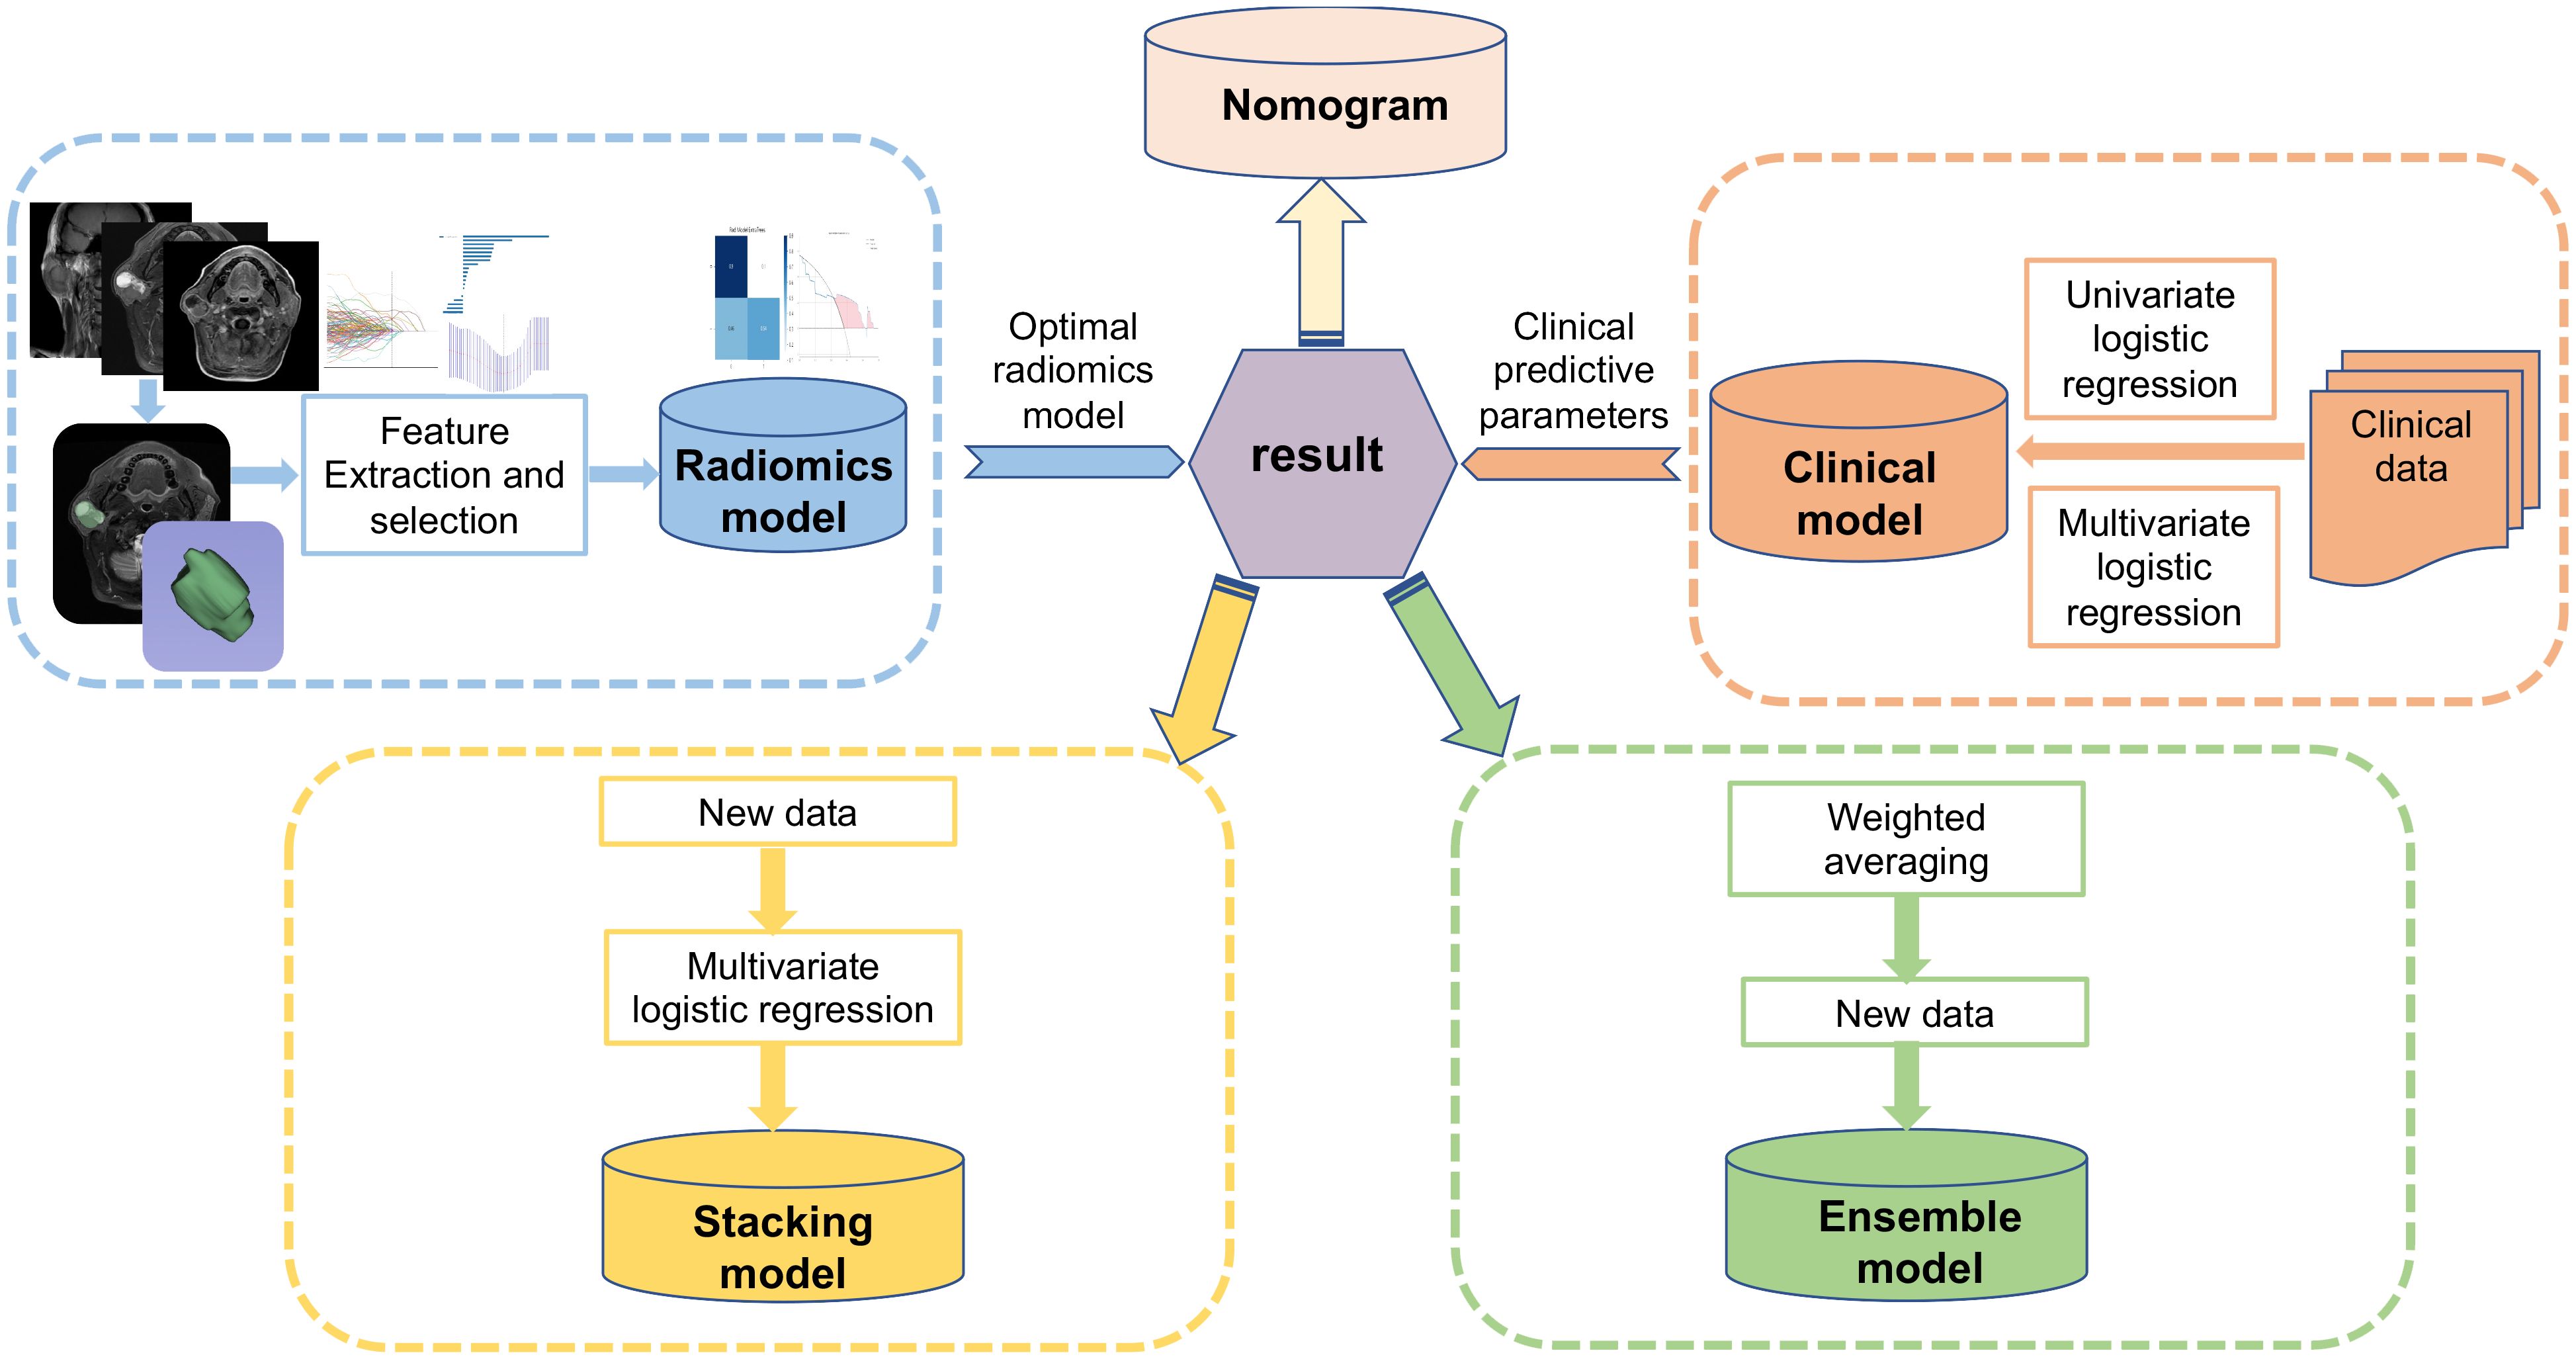
Figure 2 Workflow of this study.
To diagnose PA and WT in the training and validation groups, one radiologist solely reviewed the MR images while being blind to the histological results and clinical information. The radiologist’s AUC, accuracy, specificity, and sensitivity were calculated. The clinical usefulness and net benefit of the radiologist and various models were estimated using the net reclassification index (NRI), integrated discrimination index (IDI), and clinical decisive curve (CDC).
Statistical analysis was conducted with SPSS 26.0 (IBM, New York, USA), R software 4.1.2 (https://www.r-project.org/), and Python 3.9.7 (https://www.python.org/). The mean value ± standard deviation and counts were used to express categorical variables and continuous data, respectively.
The continuous data distribution was examined for normalcy using the Kolmogorov–Smirnov test. One-way ANOVA or the Kruskal–Wallis test was used to evaluate continuous variables, whereas the Chi-square test or Fisher’s exact test was used to investigate categorical variables. Both univariate and multivariate LR analyses were employed in the model building and clinical predictor filtering processes. At p < 0.05, statistical significance was established. Pearson correlation analysis was used to evaluate the correlations between continuous variables, whereas Spearman correlation analyses were used to investigate the relationships between continuous variables and ranking data. It is considered to be correlations between the variables if p < 0.05. DeLong test was used to compare the prediction performance of different models. At p < 0.05, statistical significance was established.
The MRI characteristics and basic demographic information of the patients are given in Table 2. Age, gender, and smoking may be utilized to predict WT and PA, according to univariate logistic regression analysis. Multivariate LR analysis showed that gender, age, and smoking remained as independent predictors in the clinical factor model.
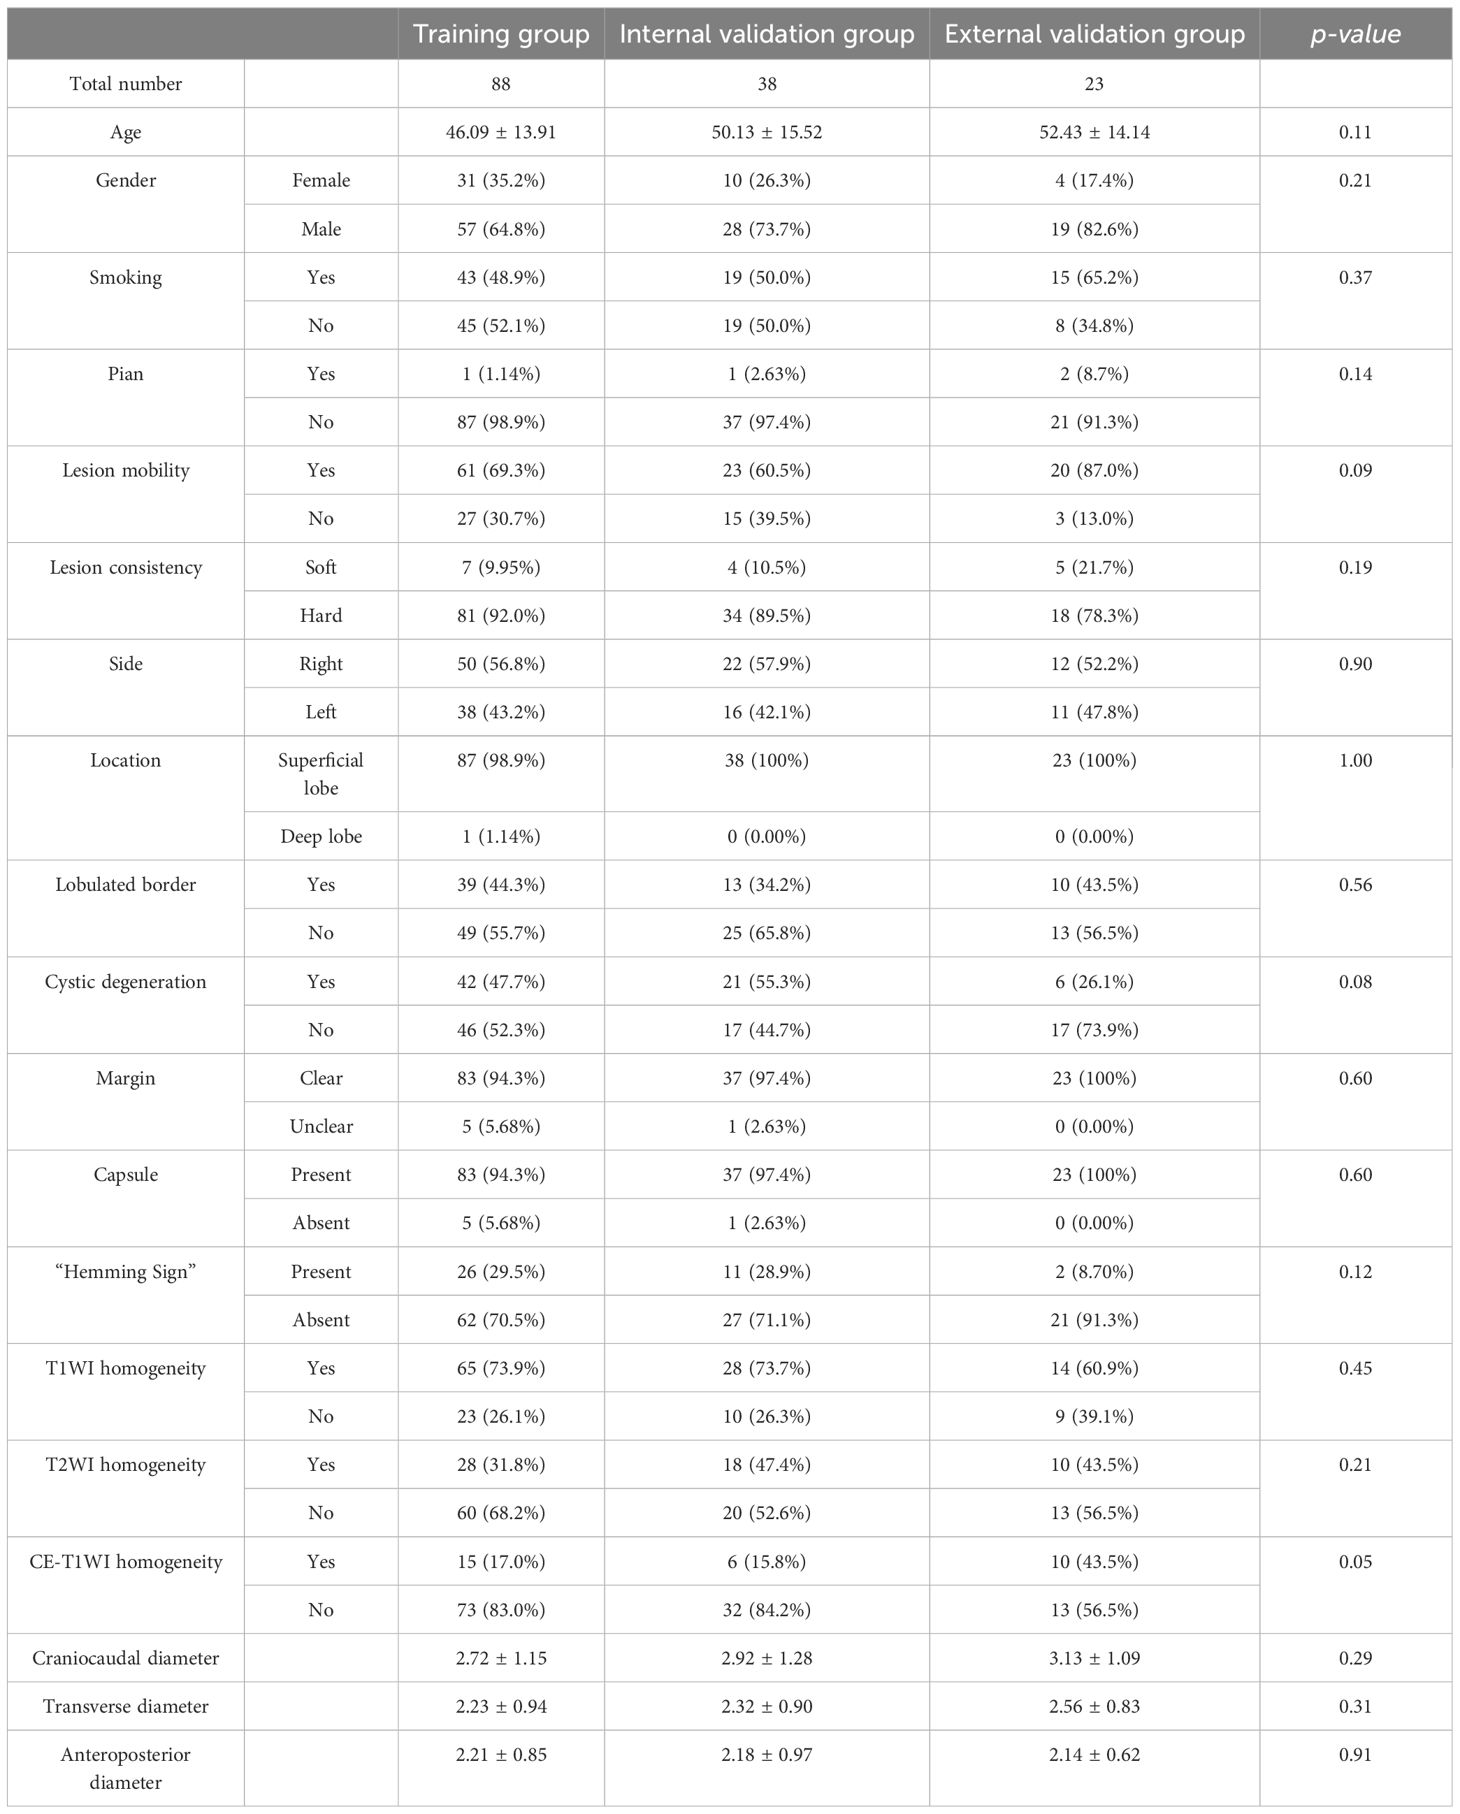
Table 2 Clinical and conventional imaging characteristics for patients.
Out of all the extracted features, 3,836 features were excluded due to the ICC values less than 0.75 either between or within observers. Following the completion of the Pearson correlation analysis, 605 features were retained. There were then 20 features identified by the LASSO classifier (Supplementary Material 1). Table 3 displays the AUC, accuracy, sensitivity, and specificity of radiomics models building by nine machine learning algorithms. Figures 3A–C show broken line graphs of AUC for various algorithms in the training, internal validation, and external validation groups. With an AUC of 0.896, and an accuracy of 0.839 in the average validation groups, the LR algorithm was the best radiomic model. Consequently, it was thought that the LR algorithm was the best option for building radiomics models.
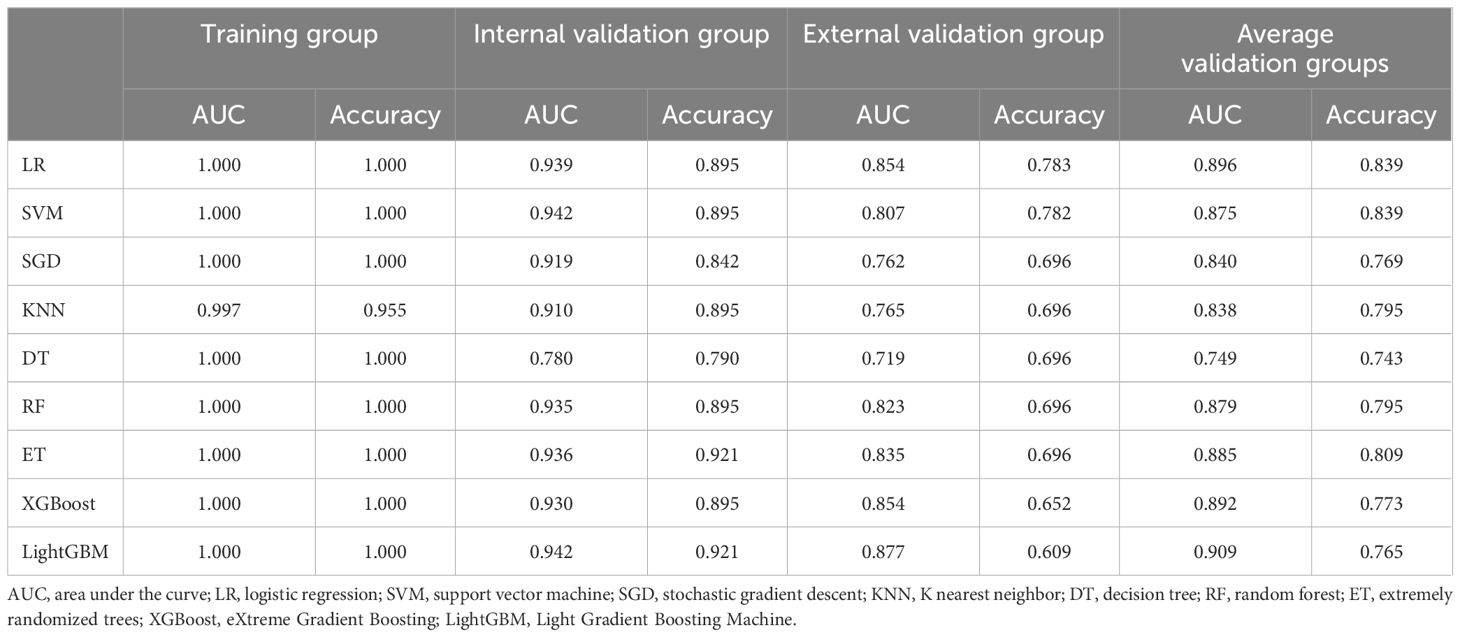
Table 3 The performance of various machine learning algorithms.
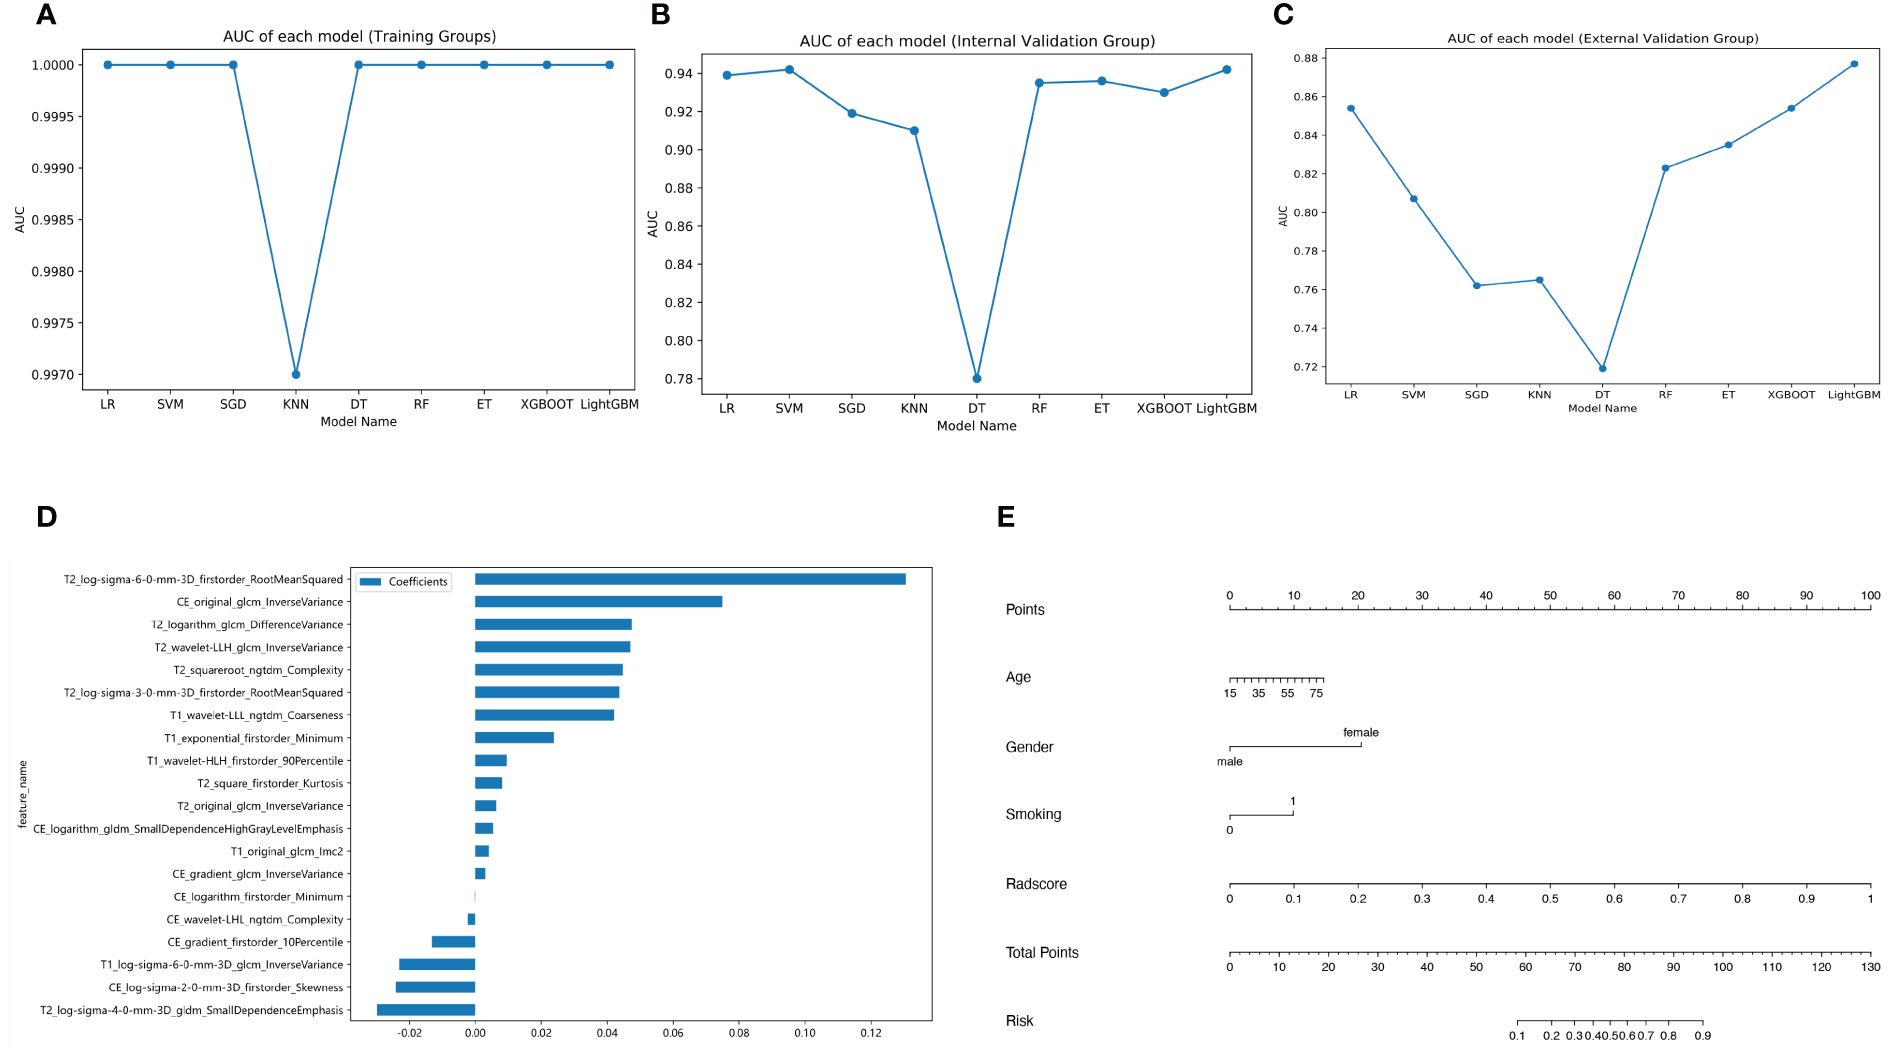
Figure 3 Different model building. Broken line graphs of the area under the curve (AUC) for different machine learning algorithms in the training group (A), the internal validation group (B), and the external validation group (C). Bar chart of feature weight for the logistic regression model (D). Nomogram of the training group (E).
The coefficients and intercepts derived from the LR model were used to calculate the radscore. Figure 3D displays the selected features and weights.
The radscore and the clinical predictive characteristics (smoking, age, and gender) were used to construct a nomogram (Figure 3E). The diagnostic performance of each model is presented in Table 4. ROC curves and calibration curves of different models are shown in Figures 4A–F. In the training group, the clinical, radiomics, nomogram, stacking, and ensemble models’ AUCs were 0.940, 1.00, 0.990, 1.00, and 1.00. They were, in order, 0.942, 0.939, 0.971, 0.936, and 0.936 in the internal validation group. They were, in order, 0.862, 0.854, 0.915, 0.885, and 0.885 in the external validation group. They were, in the average validation group, 0.909, 0.795, 0.953, 0.914, and 0.798, in that order. The AUC of the nomogram was the highest in the average validation group. To perform the Delong test in the average validation group, we merged the data from the external and internal validation group. The DeLong test showed that the prediction performance of the nomogram was significantly better. There was a statistical difference between nomogram and ensemble model, and between nomogram and radiomics model (P < 0.05). There was no statistical difference between nomogram and stacking model (P = 0.075), as well as nomogram and clinical model (P = 0.163) (Supplementary Material 2).
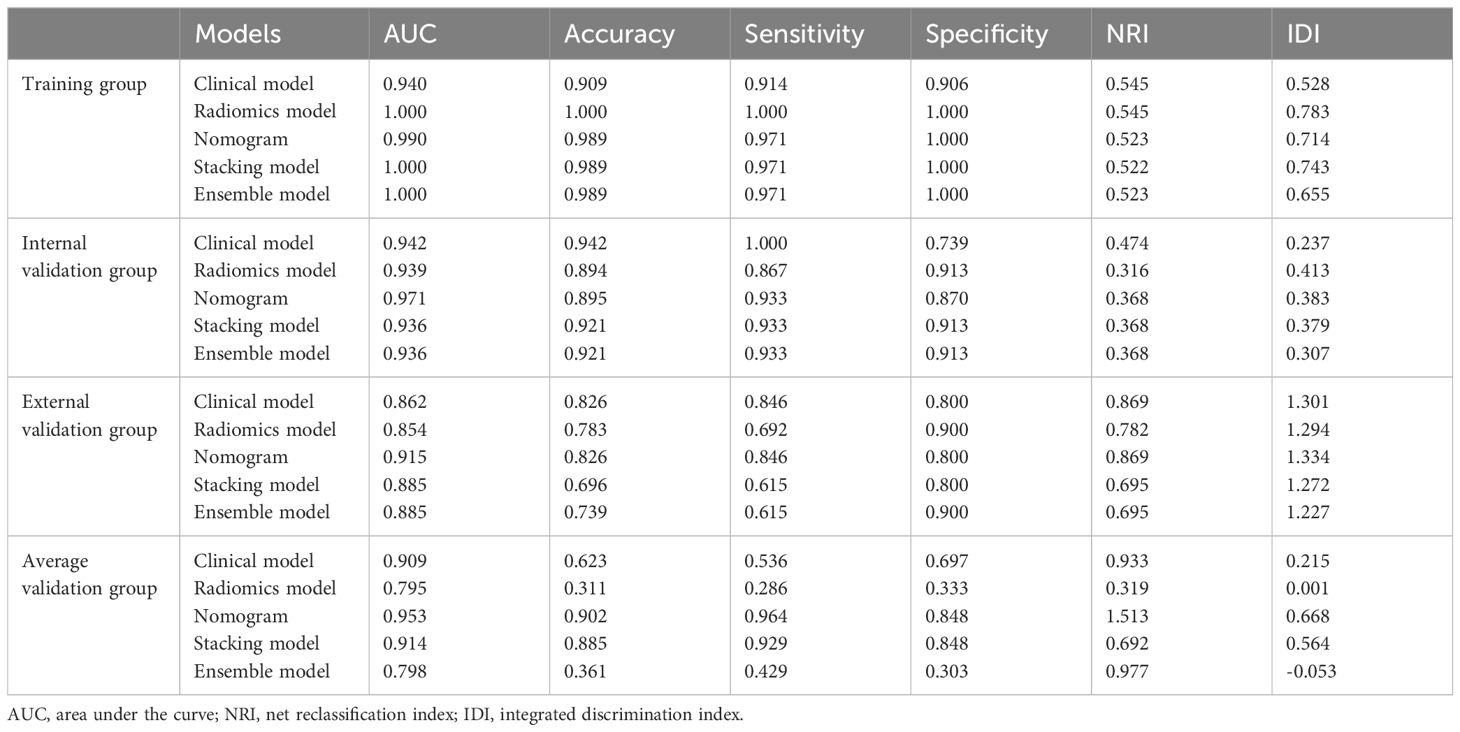
Table 4 Diagnostic efficiency and clinical benefit of different models.
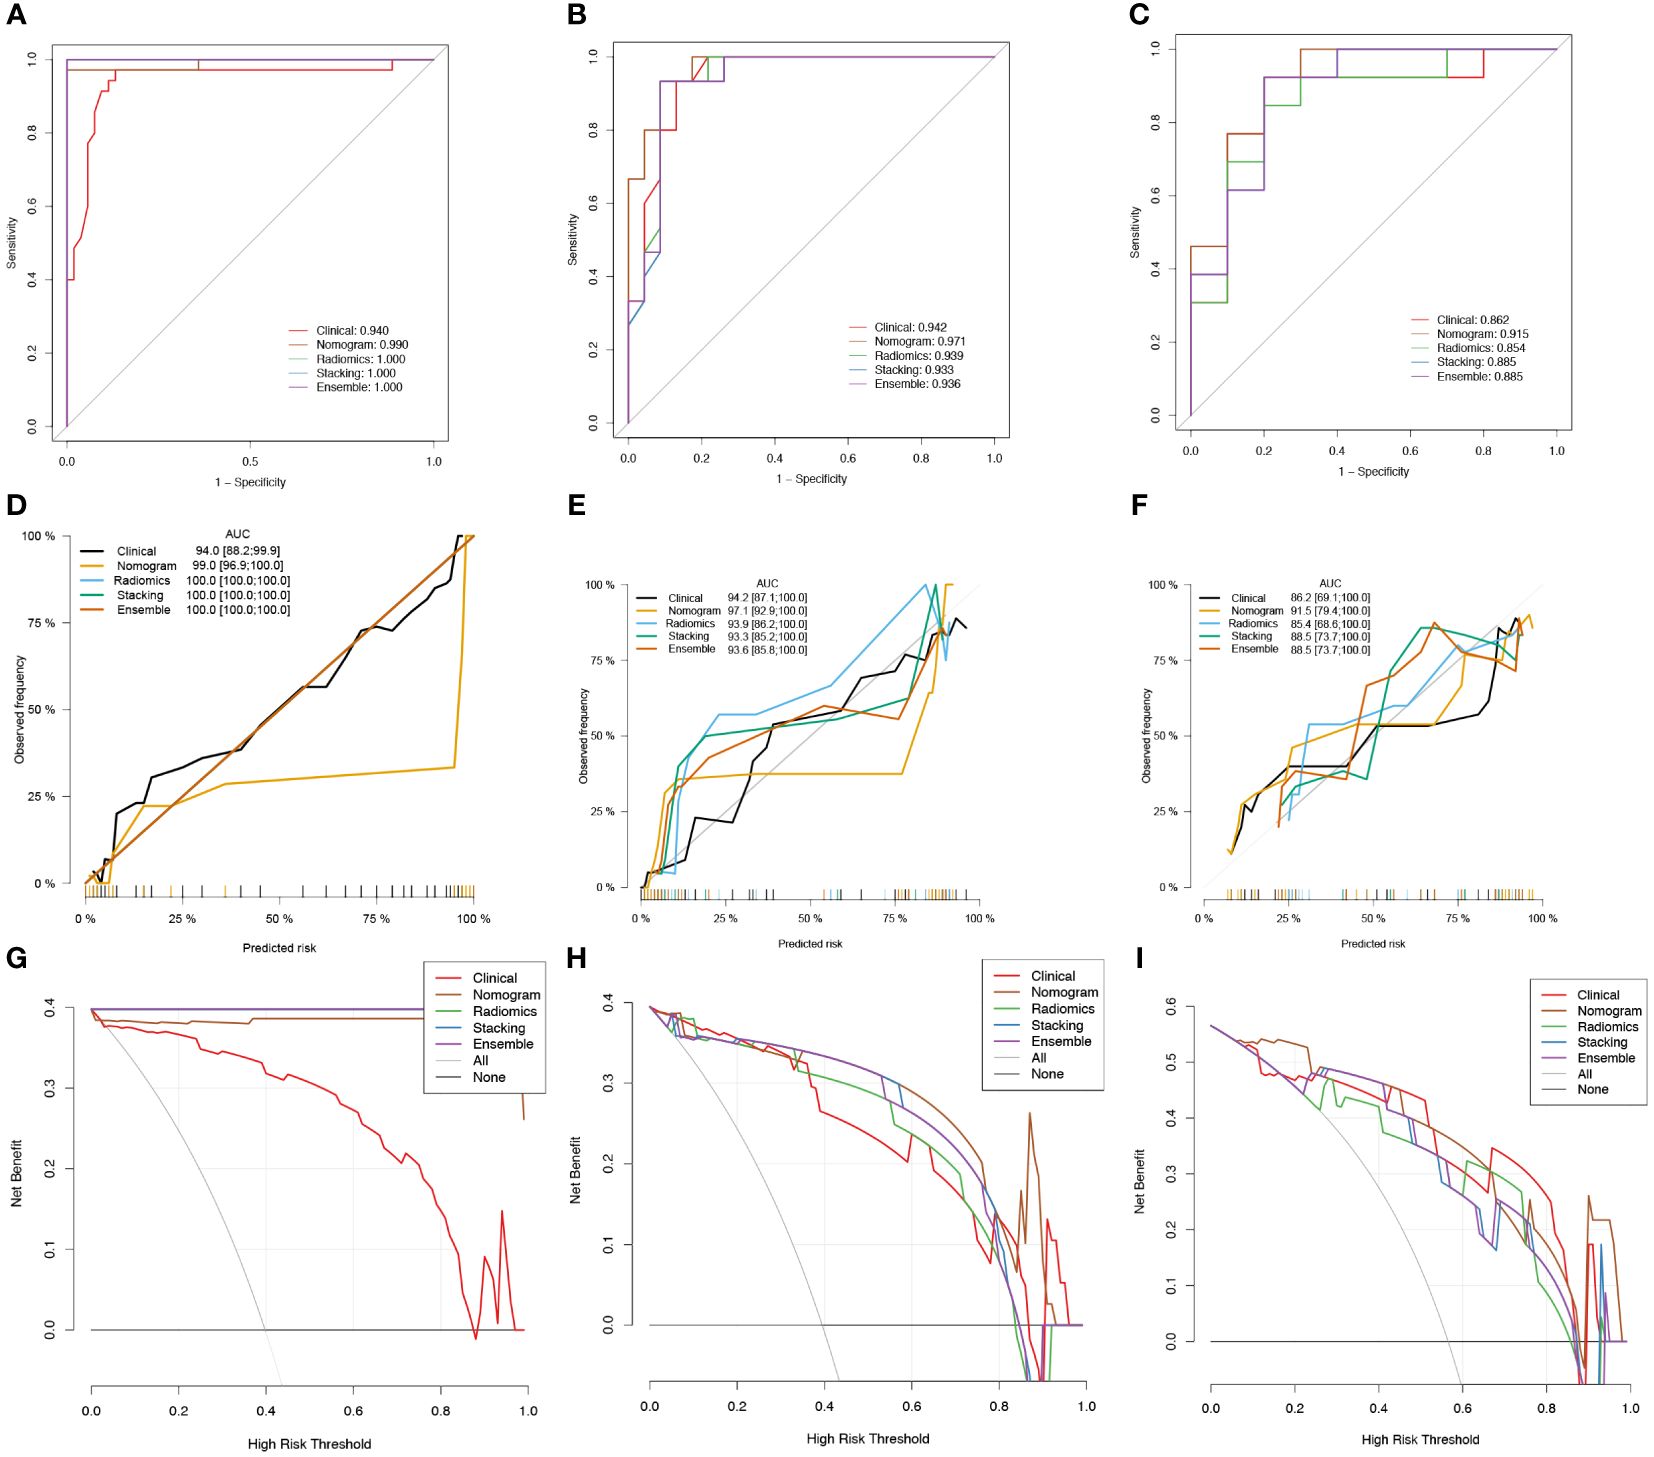
Figure 4 Receiver operator characteristic (ROC) curves (A-C), calibration curves (D-F), and clinical decision curves (CDCs) of different models in the training group (A, D, G), the internal validation group (B, E, H), and the external validation group (C, F, I).
Figures 4G–I displays the CDCs for each model, whereas Table 4 presents the NRI and IDI. The nomogram model had a highest NRI (1.513) and IDI (0.668) than other models in the average validation group. It shows that nomogram had good ability for the differentiation of PA and WT than the other models.
We found that gender, age, and smoking were clinical independent predictors for the differential diagnosis of PA and WT. The LR algorithm model, which was based on nine popular machine learning algorithms, was the best radiomics model with the highest accuracy and AUC. The fusion models—nomogram, stacking, and ensemble—also demonstrated superior diagnostic performance and produced a good net clinical benefit when compared with the clinical model. In comparison with the best radiomics model, the nomogram showed a better AUC. It also outperformed stacking and ensemble models in terms of superior generalization ability and more consistent discrimination efficiency.
Previous studies have reported that gender, age, and smoking history of patients had significance in the identification of PA and WT (30, 31). Our results were similar to those studies. Some studies suggested that duration of smoking was a strong risk factor (32). Because male smokers were more prevalent, WT was more common in men. The pathogenesis may relate to the fact that tobacco contains chemical irritants such as benzopyrene, arsenic, and N-nitrosoguanidine (31).. These irritants leading to secondary tumor change was a lengthy phenomenon, so WT occurred in middle or old age. Some studies suggested that the comparatively significantly greater incidence of WT in men might indicate a hormone dependence, and progesterone receptors have been found in WT (33). The evidence of progesterone receptor in WT implicated a potential role of endocrine factors in the development of this tumor, which might explain the predominance of the male sex regarding this disease (34).
PAs are also known as mixed tumors due to histological heterogeneity, which also suggests that it is represented by various imaging findings (23). When PA has fewer cellular components of mucoid tissue, high signal intensity on T2WI images decreases, which reduces the rate depending on the proportion of cellular components (35).The tumor signal expression of WT depends mainly on the cystic component of the tumor, and as the size of the cystic component increases, the internal structure looks bright at T2WI images that may simulate PA (36). When PA and WT showed similar imaging manifestations, it was difficult to distinguish PA from WT based on conventional MR imaging (Figure 5). The radiologists only paid attention to the imaging manifestations of the tumor while ignoring the clinical characteristics, which was more likely to be misdiagnosed.
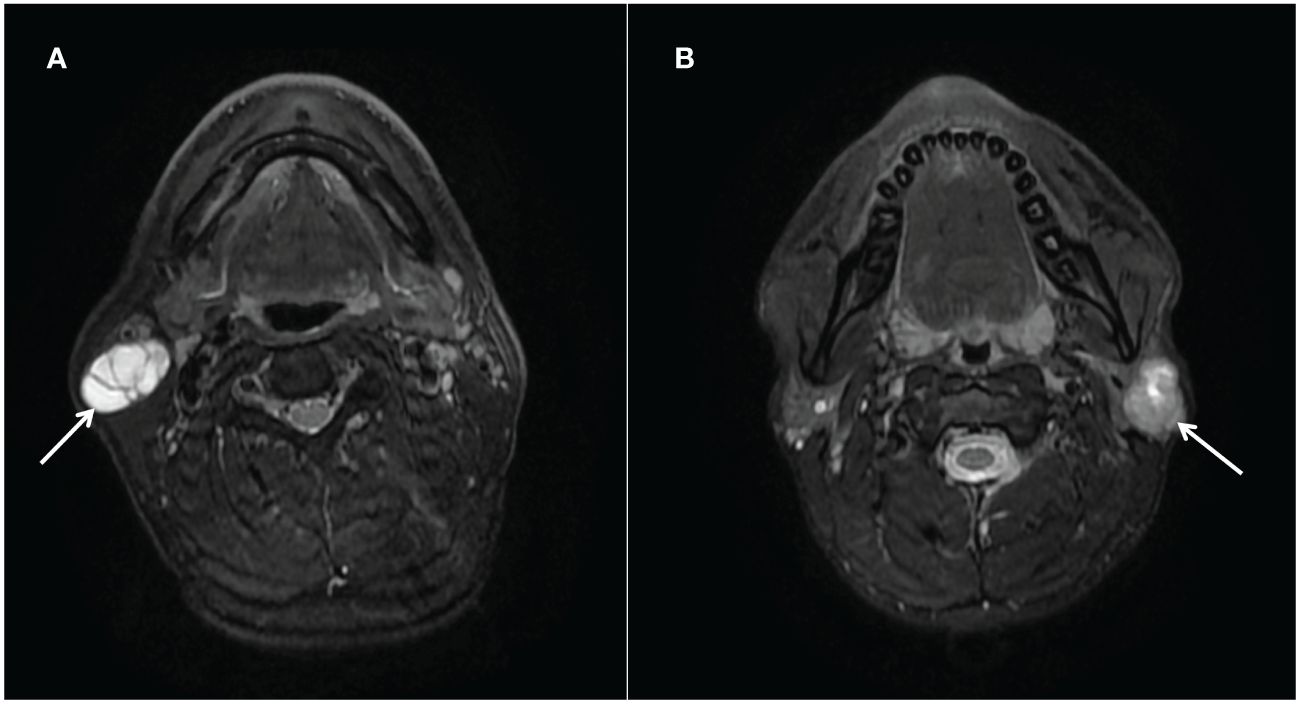
Figure 5 (A) Warthin tumors (arrows) in the right parotid gland of a 52-year-old man. T2-weighted image (axial plane) shows a markedly high-intensity tumor; a partition is visible within it. (B) Pleomorphic adenoma (arrows) in the left parotid gland of a 26-year-old man. T2-weighted image (axial plane) shows a slightly hypointense tumor. There are irregular areas of high intensity in the upper part of the tumor.
Radiomics is a non-invasive technique that builds models from digitized medical images and uses clever computation to convert them into high-dimensional, quantitative data that can be used to improve medical decision-making and provide useful diagnoses (14). Liu et al. (37) reported that there were no appreciable variations between MRI and CT in radiomics characteristics for diagnosing parotid malignancies. In this study, the diagnostic efficacy of the radiomics model was not as good as that of the clinical model. Potential explanations for these results included the subjective impact of individual clinical experience as well as a single imaging index. T2WI provided the vital features for the optimal radiomics model. PA contains mucoid tissue and usually shows a high signal on T2WI (38). In comparison, WT are epithelial tissues with lymphoid hyperplasia that contain cystic components of approximately 30% protein liquids or viscous colloids, and they usually show a hypointense/with hyperintensity signal on T2WI (36). Additionally, this study found that GLCM features could help discriminate between PA and WT, similar to the results of Gabelloni (39). The coarseness of the texture was represented by the zone percentage of GLCM features, which may more accurately capture the heterogeneity of various tumor types.
Recognizing the best machine learning techniques for radiomics models is essential (40). Thus, we employed nine common classification algorithms in model construction. LR outperformed other classifiers, which were consistent with the results of Lu et al. (41). More training samples may have been needed for sophisticated models, which could be the cause (42). The optimal radiomics model based on LR did not have a higher AUC than the clinical model. This result also illustrates that when there is a problem with the observation of traditional imaging, radiologists should combine clinical data. Evidence-based clinical decision support systems can be produced with accuracy and dependability by combining radiomics features with clinical parameters and other pertinent data (43). In this study, the clinical or radiomics model did not perform as well in terms of diagnostic performance and clinical net benefits as the nomogram, stacking model, and ensemble model, which are instances of fusion models constructed utilizing clinical parameters and radiomics features. Additionally, the nomogram exhibited a highest AUC when compared with the other models. Zheng et al. (44) constructed a radiomics nomogram based on MRI that had good prediction efficiency in distinguishing PA from WT, obtaining a similar conclusion as this research. The ensemble strategy has the advantage of being able to reduce the variance and bias of the model while also enhancing its robustness and generalization in classification and prediction, by using a strong majority voting or group average method (45). A recent report had proposed that the stacking ensemble model obtained excellent diagnostic performance and showed good stability of the calibration plot (46). While AUCs for the ensemble and stacking models were less than those of the nomogram in the current study, their diagnostic performance in the average validation groups was comparable with and superior to that of the radiomics models. As a result, the nomogram demonstrated better and more consistent differential diagnosis efficiency with superior reproducibility and reliability when compared with stacking and ensemble models.
This study’s limitations were the fact that it only included participants from two centers, and the sample of external test data was relatively small. Additional patients from more centers must be included to expand the universality in clinical applications, in the future. Second, this was a retrospective study, which might cause potential selection bias. In the future, prospective validation will be performed. Third, there were variations in the MRI scanner and parameters, which could have an impact on the models’ output. We performed the N4 bias field correction. Fourth, we only studied conventional MRI sequences, with limited interpretability. Other quantitative functional MRI sequences, such as DWI and DCE-MRI, still need to be further explored.
The MRI-based radiomics models can be accomplished to preoperatively differentiate misdiagnosed or ambiguous PA and WT, and the LR algorithm-established model is the optimal radiomics model. The nomogram is an effective tool for preoperative and non-invasive distinguishing PA and WT, which can be challenging for radiologists and surgeons to ascertain prior to surgery. In daily work, it is necessary to combine with clinical parameters such as gender, age, and smoking when radiologists are difficult to distinguish PA from WT.
The raw data supporting the conclusions of this article will be made available by the authors, without undue reservation.
The studies involving humans were approved by the First People’s Hospital of Yunnan Province. The studies were conducted in accordance with the local legislation and institutional requirements. The ethics committee/institutional review board waived the requirement of written informed consent for participation from the participants or the participants’ legal guardians/next of kin because this is a retrospective study, so informed consent was waived by the ethics committee.
JY: Methodology, Writing – original draft. QB: Conceptualization, Methodology, Writing – review & editing. YJ: Validation, Writing – review & editing. YY: Data curation, Writing – review & editing. JD: Data curation, Writing – review & editing. HZ: Writing – review & editing. KW: Writing – review & editing.
The author(s) declare that no financial support was received for the research, authorship, and/or publication of this article.
The authors declare the research was conducted in the absence of any commercial or financial relationships that could be construed as a potential conflict of interest.
All claims expressed in this article are solely those of the authors and do not necessarily represent those of their affiliated organizations, or those of the publisher, the editors and the reviewers. Any product that may be evaluated in this article, or claim that may be made by its manufacturer, is not guaranteed or endorsed by the publisher.
The Supplementary Material for this article can be found online at: https://www.frontiersin.org/articles/10.3389/fonc.2024.1392343/full#supplementary-material
Supplemental material 1 | Feature selection using the least absolute shrinkage and selection operator (LASSO) regression model. The cross-validation plot (A) and the coefficient profile plot (B).
Supplemental material 2 | Feature training group, internal validation group, external validation group and average validation group of Delong test (A–D).
1. Speight PM, Barrett AW. Salivary gland tumours. Oral Dis. (2002) 8:229–40. doi: 10.1034/j.1601-0825.2002.02870.x
2. Luers JC, Guntinas-Lichius O, Klussmann JP, Küsgen C, Beutner D, Grosheva M. The incidence of Warthin tumours and pleomorphic adenomas in the parotid gland over a 25-year period. Clin Otolaryngol All. (2016) 41:793–7. doi: 10.1111/coa.12694
3. Dulguerov P, Todic J, Pusztaszeri M, Alotaibi NH. Why do parotid pleomorphic adenomas recur? A systematic review of pathological and surgical variables. Front Surg. (2017) 4:26. doi: 10.3389/fsurg.2017.00026
4. Rooker SA, Van Abel KM, Yin LX, Nagelschneider AA, Price DL, Olsen KD, et al. Risk factors for subsequent recurrence after surgical treatment of recurrent pleomorphic adenoma of the parotid gland. Head Neck-j Sci Spec. (2021) 43:1088–96. doi: 10.1002/hed.26570
5. Maleki Z, Allison DB, Butcher M, Kawamoto S, Eisele DW, Pantanowitz L. Application of the Milan System for Reporting Salivary Gland Cytopathology to cystic salivary gland lesions. Cancer Cytopathol. (2021) 129:214–25. doi: 10.1002/cncy.22363
6. Jo HJ, Ahn HJ, Jung S, Yoon HK. Diagnostic difficulties in fine needle aspiration of benign salivary glandular lesions. Korean J Pathol. (2012) 46:569–75. doi: 10.4132/KoreanJPathol.2012.46.6.569
7. Lukas J, Duskova J. Fine-needle aspiration biopsy in the diagnostic of the tumors and non-neoplastic lesions of salivary glands. Bratisl Med J. (2006) 107:12–5.
8. Espinoza S, Felter A, Malinvaud D, Badoual C, Chatellier G, Siauve N, et al. Warthin’s tumor of parotid gland: Surgery or follow-up? Diagnostic value of a decisional algorithm with functional MRI. Diagn Interv Imaging. (2016) 97:37–43. doi: 10.1016/j.diii.2014.11.024
9. Supriya M, Denholm S, Palmer T. Seeding of tumor cells after fine needle aspiration cytology in benign parotid tumor: a case report and literature review. Laryngoscope. (2008) 118:263–5. doi: 10.1097/MLG.0b013e318158f718
10. Abdel Razek AAK, Mukherji SK. State-of-the-art imaging of salivary gland tumors. Neuroimag Clin Am. (2018) 28:303–17. doi: 10.1016/j.nic.2018.01.009
11. Tartaglione T, Botto A, Sciandra M, Gaudino S, Danieli L, Parrilla C, et al. Differential diagnosis of parotid gland tumours: which magnetic resonance findings should be taken in account? Acta Otorhinolaryngo. (2015) 35:314–20. doi: 10.14639/0392-100X-693
12. Coudert H, Mirafzal S, Dissard A, Boyer L, Montoriol PF. Multiparametric magnetic resonance imaging of parotid tumors: A systematic review. Diagn Interv Imaging. (2021) 102:121–30. doi: 10.1016/j.diii.2020.08.002
13. Maraghelli D, Pietragalla M, Cordopatri C, Nardi C, Peired AJ, Maggiore G, et al. Magnetic resonance imaging of salivary gland tumours: Key findings for imaging characterisation. Eur J Radiol. (2021) 139:109716. doi: 10.1016/j.ejrad.2021.109716
14. Gillies RJ, Kinahan PE, Hricak H. Radiomics: images are more than pictures, they are data. Radiology. (2016) 278:563–77. doi: 10.1148/radiol.2015151169
15. Scapicchio C, Gabelloni M, Barucci A, Cioni D, Saba L, Neri E. A deep look into radiomics. Radiol Med. (2021) 126:1296–311. doi: 10.1007/s11547-021-01389-x
16. Piludu F, Marzi S, Ravanelli M, Pellini R, Covello R, Terrenato I, et al. MRI-based radiomics to differentiate between benign and Malignant parotid tumors with external validation. Front Oncol. (2021) 11:656918. doi: 10.3389/fonc.2021.656918
17. Zheng YM, Li J, Liu S, Cui JF, Zhan JF, Pang J, et al. MRI-Based radiomics nomogram for differentiation of benign and Malignant lesions of the parotid gland. Eur Radiol. (2021) 31:4042–52. doi: 10.1007/s00330-020-07483-4
18. Qi J, Gao A, Ma X, Song Y, Zhao G, Bai J, et al. Differentiation of benign from Malignant parotid gland tumors using conventional MRI based on radiomics nomogram. Front Oncol. (2022) 12:937050. doi: 10.3389/fonc.2022.937050
19. Shao S, Zheng N, Mao N, Xue X, Cui J, Gao P, et al. A triple-classification radiomics model for the differentiation of pleomorphic adenoma, Warthin tumour, and Malignant salivary gland tumours on the basis of diffusion-weighted imaging. Clin Radiol. (2021) 76:472.e11–472.e18. doi: 10.1016/j.crad.2020.10.019
20. Vernuccio F, Arnone F, Cannella R, Verro B, Comelli A, Agnello F, et al. Diagnostic performance of qualitative and radiomics approach to parotid gland tumors: which is the added benefit of texture analysis? Brit J Radiol. (2021) 94:20210340. doi: 10.1259/bjr.20210340
21. Song LL, Chen SJ, Chen W, Shi Z, Wang XD, Song LN, et al. Radiomic model for differentiating parotid pleomorphic adenoma from parotid adenolymphoma based on MRI images. BMC Med Imaging. (2021) 21:54. doi: 10.1186/s12880-021-00581-9
22. Faggioni L, Gabelloni M, De Vietro F, Frey J, Mendola V, Cavallero D, et al. Usefulness of MRI-based radiomic features for distinguishing Warthin tumor from pleomorphic adenoma: performance assessment using T2-weighted and post-contrast T1-weighted MR images. Eur J Radiol Open. (2022) 9:100429. doi: 10.1016/j.ejro.2022.100429
23. Lee Y, Wong K, King A, Ahuja A. Imaging of salivary gland tumours. Eur J Radiol. (2008) 66:419–36. doi: 10.1016/j.ejrad.2008.01.027
24. Kato H, Kawaguchi M, Ando T, Mizuta K, Aoki M, Matsuo M. Pleomorphic adenoma of salivary glands: common and uncommon CT and MR imaging features. Jpn J Radiol. (2018) 36:463–71. doi: 10.1007/s11604-018-0747-y
25. Wang C, Yu Q, Li S, Sun J, Zhu L, Wang P. Carcinoma ex pleomorphic adenoma of major salivary glands: CT and MR imaging findings. Dentomaxillofac Rad. (2021) 50:20200485. doi: 10.1259/dmfr.20200485
26. Depeursinge A, Foncubierta-Rodriguez A, Van De Ville D, Müller H. Three-dimensional solid texture analysis in biomedical imaging: review and opportunities. Med Image Anal. (2014) 18:176–96. doi: 10.1016/j.media.2013.10.005
27. Sauerbrei W, Royston P, Binder H. Selection of important variables and determination of functional form for continuous predictors in multivariable model building. Stat Med. (2007) 26:5512–28. doi: 10.1002/sim.3148
28. Dai H, Wang Y, Fu R, Ye S, He X, Luo S, et al. Radiomics and stacking regression model for measuring bone mineral density using abdominal computed tomography. Acta Radiol. (2023) 64:228–36. doi: 10.1177/02841851211068149
29. Schuler MS, Rose S. Targeted maximum likelihood estimation for causal inference in observational studies. Am J Epidemiol. (2017) 185:65–73. doi: 10.1093/aje/kww165
30. Wang CW, Chu YH, Chiu DY, Shin N, Hsu HH, Lee JC, et al. JOURNAL CLUB: the warthin tumor score: A simple and reliable method to distinguish warthin tumors from pleomorphic adenomas and carcinomas. Am J Roentgenol. (2018) 210:1330–7. doi: 10.2214/AJR.17.18492
31. Yu GY, Liu XB, Li ZL, Peng X. Smoking and the development of Warthin’s tumour of the parotid gland. Brit J Oral Max Surg. (1998) 36:183–5. doi: 10.1016/S0266-4356(98)90494-6
32. Freedman LS, Oberman B, Sadetzki S. Using time-dependent covariate analysis to elucidate the relation of smoking history to Warthin’s tumor risk. Am J Epidemiol. (2009) 170:1178–85. doi: 10.1093/aje/kwp244
33. Teymoortash A, Lippert BM, Werner JA. Steroid hormone receptors in parotid gland cystadenolymphoma (Warthin’s tumour). Clin Otolaryngol Allied Sci. (2001) 26:411–6. doi: 10.1046/j.1365-2273.2001.00494.x
34. Teymoortash A, Krasnewicz Y, Werner JA. Clinical features of cystadenolymphoma (Warthin’s tumor) of the parotid gland: a retrospective comparative study of 96 cases. Oral Oncol. (2006) 42:569–73. doi: 10.1016/j.oraloncology.2005.10.017
35. Motoori K, Yamamoto S, Ueda T, Nakano K, Muto T, Nagai Y, et al. Inter- and intratumoral variability in magnetic resonance imaging of pleomorphic adenoma: an attempt to interpret the variable magnetic resonance findings. J Comput Assist Tomo. (2004) 28:233–46. doi: 10.1097/00004728-200403000-00014
36. Karaman CZ, Tanyeri A, Özgür R, Öztürk VS. Parotid gland tumors: comparison of conventional and diffusion-weighted MRI findings with histopathological results. Dentomaxillofac Rad. (2021) 50:20200391. doi: 10.1259/dmfr.20200391
37. Liu Y, Zheng J, Lu X, Wang Y, Meng F, Zhao J, et al. Radiomics-based comparison of MRI and CT for differentiating pleomorphic adenomas and Warthin tumors of the parotid gland: a retrospective study. Surg Med. (2021) 131:591–9. doi: 10.1016/j.oooo.2021.01.014
38. Tsushima Y, Matsumoto M, Endo K, Aihara T, Nakajima T. Characteristic bright signal of parotid pleomorphic adenomas on T2-weighted MR images with pathological correlation. Clin Radiol. (1994) 49:485–9. doi: 10.1016/S0009-9260(05)81748-9
39. Gabelloni M, Faggioni L, Attanasio S, Vani V, Goddi A, Colantonio S, et al. Can magnetic resonance radiomics analysis discriminate parotid gland tumors? A pilot study. Diagnostics (Basel). (2020) 10(11):900. doi: 10.3390/diagnostics10110900
40. Parmar C, Grossmann P, Bussink J, Lambin P, Aerts H. Machine learning methods for quantitative radiomic biomarkers. Sci Rep. (2015) 5:13087. doi: 10.3389/fonc.2015.00272
41. Lu Y, Liu H, Liu Q, Wang S, Zhu Z, Qiu J, et al. CT-based radiomics with various classifiers for histological differentiation of parotid gland tumors. Front Oncol. (2023) 13:1118351. doi: 10.3389/fonc.2023.1118351
42. Mao B, Ma J, Duan S, Xia Y, Tao Y, Zhang L. Preoperative classification of primary and metastatic liver cancer via machine learning-based ultrasound radiomics. Eur Radiol. (2021) 31:4576–86. doi: 10.1007/s00330-020-07562-6
43. Lambin P, Leijenaar RTH, Deist TM, Peerlings J, de Jong EEC, van Timmeren J, et al. Radiomics: the bridge between medical imaging and personalized medicine. Nat Rev Clin Oncol. (2017) 14:749–62. doi: 10.1038/nrclinonc.2017.141
44. Zheng YM, Chen J, Xu Q, Zhao WH, Wang XF, Yuan MG, et al. Development and validation of an MRI-based radiomics nomogram for distinguishing Warthin’s tumour from pleomorphic adenomas of the parotid gland. Dentomaxillofac Rad. (2021) 50:20210023. doi: 10.1259/dmfr.20210023
45. Rui W, Qiao N, Wu Y, Zhang Y, Aili A, Zhang Z, et al. Radiomics analysis allows for precise prediction of silent corticotroph adenoma among non-functioning pituitary adenomas. Eur Radiol. (2022) 32:1570–8. doi: 10.1007/s00330-021-08361-3
Keywords: parotid gland, MRI, radiomics, nomogram, pleomorphic adenoma, Warthin tumor
Citation: Yang J, Bi Q, Jin Y, Yang Y, Du J, Zhang H and Wu K (2024) Different MRI-based radiomics models for differentiating misdiagnosed or ambiguous pleomorphic adenoma and Warthin tumor of the parotid gland: a multicenter study. Front. Oncol. 14:1392343. doi: 10.3389/fonc.2024.1392343
Received: 05 March 2024; Accepted: 28 May 2024;
Published: 13 June 2024.
Edited by:
Chuanming Li, Chongqing University Central Hospital, ChinaReviewed by:
Murat Beyhan, Tokat Gaziosmanpaşa University, TürkiyeCopyright © 2024 Yang, Bi, Jin, Yang, Du, Zhang and Wu. This is an open-access article distributed under the terms of the Creative Commons Attribution License (CC BY). The use, distribution or reproduction in other forums is permitted, provided the original author(s) and the copyright owner(s) are credited and that the original publication in this journal is cited, in accordance with accepted academic practice. No use, distribution or reproduction is permitted which does not comply with these terms.
*Correspondence: Kunhua Wu, a2hjZ3pAc2luYS5jb20=; Hongjiang Zhang, emhqMjAwNjE0MDAxQDE2My5jb20=
†These authors have contributed equally to this work and share first authorship
‡These authors have contributed equally to this work
Disclaimer: All claims expressed in this article are solely those of the authors and do not necessarily represent those of their affiliated organizations, or those of the publisher, the editors and the reviewers. Any product that may be evaluated in this article or claim that may be made by its manufacturer is not guaranteed or endorsed by the publisher.
Research integrity at Frontiers
Learn more about the work of our research integrity team to safeguard the quality of each article we publish.