
95% of researchers rate our articles as excellent or good
Learn more about the work of our research integrity team to safeguard the quality of each article we publish.
Find out more
ORIGINAL RESEARCH article
Front. Oncol. , 22 April 2024
Sec. Gynecological Oncology
Volume 14 - 2024 | https://doi.org/10.3389/fonc.2024.1389472
This article is part of the Research Topic DNA Damage, Repair and Mutagenesis: Targeting Cancer’s Achilles Heel View all 6 articles
 Sarah J. Taylor1,2*
 Robert L. Hollis2
 Charlie Gourley2
 C. Simon Herrington1,2
 Simon P. Langdon1
 Mark J. Arends1*
Background: DNA damage repair is frequently dysregulated in high grade serous ovarian cancer (HGSOC), which can lead to changes in chemosensitivity and other phenotypic differences in tumours. RFWD3, a key component of multiple DNA repair and maintenance pathways, was investigated to characterise its impact in HGSOC.
Methods: RFWD3 expression and association with clinical features was assessed using in silico analysis in the TCGA HGSOC dataset, and in a further cohort of HGSOC tumours stained for RFWD3 using immunohistochemistry. RFWD3 expression was modulated in cell lines using siRNA and CRISPR/cas9 gene editing, and cells were characterised using cytotoxicity and proliferation assays, flow cytometry, and live cell microscopy.
Results: Expression of RFWD3 RNA and protein varied in HGSOCs. In cell lines, reduction of RFWD3 expression led to increased sensitivity to interstrand crosslinking (ICL) inducing agents mitomycin C and carboplatin. RFWD3 also demonstrated further functionality outside its role in DNA damage repair, with RFWD3 deficient cells displaying cell cycle dysregulation, reduced cellular proliferation and reduced migration. In tumours, low RFWD3 expression was associated with increased tumour mutational burden, and complete response to platinum chemotherapy.
Conclusion: RFWD3 expression varies in HGSOCs, which can lead to functional effects at both the cellular and tumour levels.
Ovarian cancer is the eighth most common cancer in women, with over 300, 000 new diagnoses each year (1). Of these, high grade serous ovarian cancer (HGSOC) is the most prevalent subtype, accounting for approximately 70% of cases (2). HGSOC is frequently diagnosed at advanced stages with extensive local and distant metastases, and carries a poor prognosis, with five-year survival rates of just 40% (3). One of the major challenges in the management of HGSOC, and a contributor to the high mortality rates, is the development of resistance to standard of care platinum-based chemotherapy despite initial chemosensitivity (4).
HGSOC is characterized by a lack of frequent mutations, except in TP53, which occur in 97% of cases, and the BRCA1/2 genes which are collectively mutated in 22% of cases (5). Aside from these, HGSOCs are largely driven by copy number alterations and exhibit high levels of genomic instability (5). The BRCA1/2 proteins function in the homologous recombination (HR) mediated repair of DNA double-strand breaks (DSBs), and are a key component of the Fanconi anaemia (FA) pathway which repairs DNA interstrand crosslinks (ICLs) induced by platinum treatment (6). The impact of BRCA1/2 mutation in HGSOCs has been extensively studied, with BRCA1/2 deficient tumours associated with a highly platinum sensitive phenotype and favourable patient prognosis (7–9). Homozygous (or compound heterozygous) mutation of any of the essential FA genes involved in the FA pathway causes Fanconi anaemia, a developmental disorder underpinned by genomic instability and the inability to repair ICLs (10). However, non-BRCA members of the FA pathway remain less well studied both in HGSOC and other cancer types (11).
RING finger and WD repeat domain-containing protein 3 (RFWD3) (aka FANCW) is an E3 ligase which was first identified as a regulator of cell cycle checkpoint control (12). More recent work has shown that, like BRCA1/2, RFWD3 is essential for repair of ICLs via the FA pathway (13), functioning both in HR repair of DSBs and gap filling translesion synthesis (TLS) across DNA lesions (14, 15). RFWD3 exhibits promiscuous ubiquitin ligase activity, targeting multiple substrates involved in the DNA damage response and maintenance of genomic stability, including cell cycle checkpoint maintenance, replication fork stability, and DNA replication (16–18).
Studies of RFWD3 in HGSOC have not been reported in the literature, and investigation in other cancer types has been limited. It has however, been reported as a potential tumour promoter in gastric, colorectal, pancreatic, and non-small cell lung cancers (19–22).
In this study, we therefore aimed to investigate the role of RFWD3 in HGSOC, by evaluating links between RFWD3 expression and clinical characteristics in HGSOC patient samples, and defining the function of RFWD3 in HGSOC cell line models.
In silico analyses of RFWD3 expression were carried out using The Cancer Genome Atlas (TCGA) dataset of 489 HGSOC cases (TCGA-OV) described in (5). Median follow up was 30 months (range 0-179 months). In this cohort, overall survival was defined as the interval from initial surgical resection to the last known contact or death. Disease free survival was defined as the interval from initial surgical resection to disease progression, date of recurrence, or date of last known contact if the patient was alive and had not recurred. Analysis was performed using the cBioportal online tool (www.cbioportal.org) (23) and Graphpad Prism v9.4.1.
Human HGSOC cell lines ES2, 59M, COV318 and PEO1 were obtained from in-house liquid nitrogen frozen stocks. Cell lines were authenticated by short tandem repeat profiling, and regularly mycoplasma tested. Cells were grown in RPMI-1640 (Thermo Fisher, Loughborough, UK) supplemented with 10% fetal bovine serum (Thermo Fisher), 1% penicillin streptomycin (Thermo Fisher), and 2mM L-glutamine (Thermo Fisher).
Cultured cells were treated with lysis buffer on ice, centrifuged at 15,000g, and supernatant collected. Protein content was quantified using the bicinchoninic acid assay. Lysates were loaded on 7.5% acrylamide gels, and subjected to SDS-PAGE to separate proteins. Proteins were transferred to PVDF membrane, incubated with blocking buffer (LI-COR, Cambridge, UK) for 1h, and incubated overnight with primary antibody diluted in blocking buffer. Primary antibodies targeting RFWD3 (Abcam, Cambridge, UK; ab138030; 1:500 dilution), tubulin (Abcam; ab7291; 1:5000 dilution), PARP (Cell Signaling Technology, Danvers, MA, USA; 9542; 1:1000 dilution) and FANCD2 (Abcam; ab108928; 1:1000 dilution) were used. Membranes were incubated with anti-mouse IRDye 680LT (LI-COR 926-68020) and anti-rabbit IRDye 800CW (LI-COR 926-68023), and imaged using the Odyssey Infrared Imaging System (LI-COR Biosciences). Quantification of band intensity was performed using ImageJ v1.53 (24).
Cytotoxicity and proliferation were measured using the SRB assay. 250-3000 cells were plated per well in 96-well plates, treated with 1:4 or 1:2 dilution series of carboplatin (Sigma-Aldrich, Gillingham, UK), mitomycin C (Selleckchem, Houston, TX, USA) paclitaxel (Selleckchem), or olaparib (Selleckchem) and incubated for 5 days at 37°C. These were fixed using 25% trichloroacetic acid (Sigma-Aldrich), and stained with 0.4% w/v sulforhodamine B dye (Sigma-Aldrich). Dye was dissolved by addition of Tris pH 10.5, and optical density at 540nM was measured using a BP800 Microplate Reader (Biohit). Absolute IC50 values were interpolated from concentration-response curves using Graphpad Prism v9.4.1.
Transfection of cell lines with siRNA was performed using Lipofectamine 3000 (Thermo Fisher) according to manufacturer’s instructions. RFWD3 targeting siRNA CCAUUUGAGGUGAACCGUAtt or negative control siRNA (1027281, Qiagen, Manchester, UK) was used. Transfection was performed twice, with cells allowed to recover for 24h between transfections.
sgRNA sequences targeting two distinct sequences in the RFWD3 gene (CACCGCTCTCAGGGTTCGGGCATAA and CACCGGGCTCTCAGCATTACGCTGT; Integrated DNA technologies (IDT), Ilkeston, UK) were cloned into pSpCas9(BB)-2A-Puro (PX459) V2.0 plasmid backbones (25). Cells were transfected with the resulting plasmids using Lipofectamine 3000 (Thermofisher) according to manufacturer’s instructions. Selection of transfected cells was carried out for 48h using 2.5µg/mL puromycin, and individual cells were subcloned to generate monoclonal cell lines. Monoclonal cell lines were evaluated for gene editing via Western blot and Sanger sequencing. CRISPR/cas9 mediated editing was carried out using the same methodologies as described for RFWD3, and sgRNA sequences targeting two positions in the FANCD2 gene (CACCGCATCCTCAATGTAAGACTCC and CACCGGATAGGAAGGGTGTCTCCTC; IDT).
DNA extractions were carried out using an Allprep DNA/RNA kit (Qiagen) following manufacturer’s instructions. DNA was amplified for sequencing via PCR using AmpliTaq Gold 360 PCR Master Mix (Thermo Fisher) and following manufacturers’ protocols. PCR cycling conditions were as follows; 95˚C for 5 minutes, followed by 40 cycles (95˚C for 30 seconds, 55˚C for 30 seconds, and 72˚C for 30 seconds), and 72˚C for 5 minutes. Forward primer sequence GTTCTGTAGCCCTTTTGATTGTATCAT, reverse primer sequence TTTCTGTATGGAGAACTGCTGTGG (IDT). PCR product was analysed for heterozygosity by gel electrophoresis and Sanger sequenced.
Cells were seeded in 10cm dishes, and treated with 10µM bromodeoxyuridine (BrdU; Abcam) for 30min at 37°C. 2x10⁶ cells were fixed in 70% (v/v) ethanol. These were digested to nuclei using 1mg/mL pepsin (Sigma-Aldrich), treated with 2M hydrochloric acid, and blocked using 0.5% BSA (Sigma-Aldrich) solution. Staining was with 1:100 anti-BrdU antibody (Invitrogen; 14-5071-82), followed by anti-mouse AF488 secondary antibody (A11029, Invitrogen). Nuclei were then treated with RNase A (Thermofisher) and 50µg/mL propidium iodide (PI; Thermofisher), and analysed using the LSRFortessa (Becton Dickinson, Franklin Lakes, USA). Cell cycle phase was assigned based on PI and BrdU staining gates in FlowJo v10.8.1.
A total of 3000 cells were seeded per well, and were fixed and stained as described above using the SRB assay. Plates were fixed at D0, 6h, 24h, 48h, and 72h time points. 6 wells were seeded per condition, and the mean absorbance was used to plot growth curves. Doubling times were calculated from growth curves plotted in Graphpad Prism v9.4.1.
Cell migration was analysed using the Incucyte S3 live imaging system (Essen, Royston, UK). 96 well Imagelock plates (Essen) were coated with 50µg/mL collagen I (prepared in-house according to (26)) or 10µg/mL laminin (Thermo Fisher). 1000 cells were seeded per well, and imaged every 15 min. Image sequences were analysed using the mTrackJ plugin on ImageJ v1.53. Individual cells were tracked for 10h, and mean migration velocity per track was calculated using mTrackJ (27). 45 cells were tracked per biological replicate.
Microarrays of HGSOC patient tumours are described in (28). Briefly, from ovarian cancer cases treated at the Edinburgh Cancer Centre prior to 2007, 365 high grade serous ovarian cancer cases were identified by expert pathological review. All were treated with first line platinum containing chemotherapy after primary debulking surgery. Samples of treatment naïve tumour were taken at primary surgery, fixed in formalin and embedded in paraffin. Sections were cut for immunohistochemistry (IHC) staining. Median follow up was 13.5 years (range 0.2-22.7 years). Overall survival (OS) in this cohort was defined as the interval from pathologically confirmed diagnosis to patient death. Progression free survival (PFS) was defined as the interval from pathologically confirmed diagnosis to disease progression or recurrence, respectively. Ethical approval was obtained from South East Scotland Human Annotated Bioresource (Lothian NRS Bioresource Ethics Committee reference 20/ES/0061-SR705 and SR1518). This study was carried out in accordance with the principles of the Declaration of Helsinki.
Slides were dewaxed and rehydrated using the Leica Autostainer XL (Leica, Newcastle, UK), and treated with 3% hydrogen peroxide solution (Sigma-Aldrich). Antigen retrieval was performed by heating slides in a pressure cooker containing Tris-EDTA buffer for 12 min. Slides were permeabilised using 0.5% Triton-X100. Blocking was with 5% goat serum for 1h. Antibody staining was with anti-RFWD3 antibody (Proteintech, Manchester, UK) (19893-1-AP) diluted 1:400 overnight at 4°C. Slides were then incubated with peroxidase conjugated secondary antibody (A0545 Sigma-Aldrich) and 3, 3’-diaminobenzidine (DAB) solution (Agilent, Wokingham, UK) for 10 min. Slides were then dehydrated and counterstained with haematoxylin on the Leica Autostainer XL before mounting. Slides were imaged in the brightfield channel using the Nanozoomer XR (Hammamatsu, Welwyn Garden City, UK).
IHC staining of the tumour microarray (TMA) was analysed using QuPath software version 0.3.2 (https://qupath.github.io/) (29). Cells were automatically detected, and tumour areas annotated. Thresholds for nuclear DAB staining were set at optical density (OD) 0.1, 0.3 and 0.5 to determine negative, weak, moderate and strong staining in individual cells. Histoscores for each tumour core were generated based on the proportion of cells classified within each of these categories automatically within QuPath. Evaluable tumour cores were available for 231/365 cases. Where available, triplicate (54/231) and duplicate (84/231) cores for each case were analysed, and mean values were used for statistical analysis. Duplicate and triplicate cores demonstrated good concordance between histoscores (median coefficient of variation 12.9%).
All graphs were plotted using Graphpad Prism v9.4.1. The Cox proportional hazards test for performing multivariate analysis of survival data, and testing of proportionality of the variables, was performed using the survival package in R v4.2.2. All other statistics were performed in Graphpad Prism v9.4.1. Tests used are described in individual figure legends.
The TCGA-OV dataset is a large and well characterised publicly available dataset consisting of 489 cases of HGSOC, with associated mRNA expression and clinical data (5). A subset of 316 cases also have coding exon sequences. This dataset was interrogated to determine whether alterations in RFWD3 sequence or expression occur in HGSOC. Summary clinicopathological information for this cohort is given in Supplementary Tables S1 and S2.
No instances of mutations in the RFWD3 gene were observed in the dataset. However, low mRNA expression, defined as a Z-score of <-2 compared to tumours in the dataset with diploid RFWD3, occurred in 9% of cases (28/489). While two of these coincided with copy number deletions, the reason for low expression in the others is unknown. In contrast, high expression, defined as a Z-score of >2, occurred in just 1.4% (7/489) of cases. Low expression of RFWD3 therefore occurs in a proportion of HGSOCs (Supplementary Figure S1).
The subset of low RFWD3 expressing cases were further investigated to determine whether they were associated with differences in clinical outcomes and tumour phenotype. These, and cases with mutations in other bona fide FA genes (FANCA, FANCB, FANCC, FANCD2, FANCE, FANCF, FANCG, FANCL, FANCM, FANCI, UBE2T, SLX4, ERCC4, MAD2L2, BRIP1, BRCA2, PALB2, RAD51C, RAD51, BRCA1, XRCC2), were compared with a control group of cases with neither an FA mutation nor low expression of RFWD3. There were no differences in stage or residual disease between the groups. While there was an apparent difference in patient age between the groups, no significant differences compared to the control group were observed after adjusting for multiple testing (Bonferonni corrected p=0.076) (Supplementary Table S1). Both the cases with low RFWD3 expression and those with mutations in other FA genes were found to have significantly higher non-synonymous tumour mutational burden (control VS RFWD3 low expression p=0.025; control VS FA mutated p<0.0001) compared with the control group (Figure 1). This suggests that low RFWD3 expression can influence tumour genotype in a similar way to mutation of FA genes including BRCA1 and BRCA2.
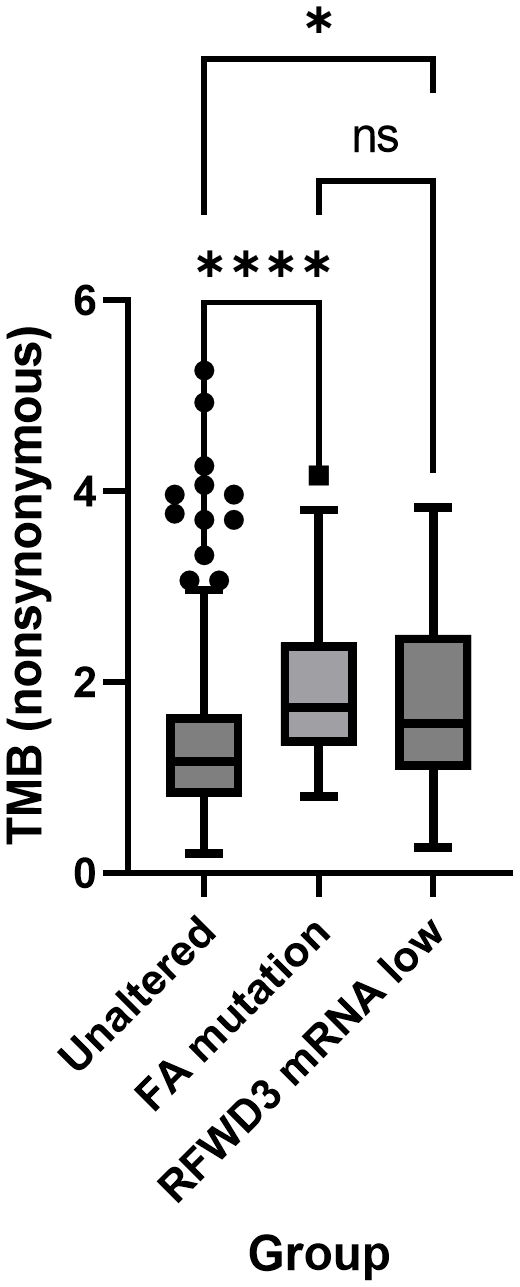
Figure 1 Low expression of RFWD3 is associated with increased mutation frequency in HGSOCs. Tukey’s box plot showing nonsynonymous tumour mutational burden (TMB) of tumours with low RFWD3 expression or FA gene mutations compared with other HGSOC tumours. * p<0.05, **** p<0.0001, ns, not significant, by Kruskal-Wallis test with Dunn’s multiple comparisons test. Total n=312. Control group n=207, FA mutation group n=81, RFWD3 low expression group n=24. 4 cases with both an FA mutation and low RFWD3 expression were excluded from analysis.
Differences in overall survival (OS) and disease-free survival (DFS) were also assessed. While both DFS and OS were significantly improved for the FA mutated cases compared to the control group (median OS 58 VS 43 months, Bonferonni-adjusted p=0.009; median DFS 19 VS 15 months, Bonferonni-adjusted p=0.0006), there was no difference in DFS (Bonferonni-adjusted p>0.999) or OS (Bonferonni-adjusted p>0.999) between the control and RFWD3 low-expressing groups (Supplementary Figure S2).
RFWD3 expression was investigated across three HGSOC cell lines with varying carboplatin sensitivities, 59M, ES2 and COV318 (mean IC50 values 10.2 µM, 5.4µM, 2.6µM respectively) (Figures 2A-C). Although multiple bands were observed in Western blot analysis, these were all reduced in intensity by siRNA knockdown (Supplementary Figure S3), and likely represent different isoforms or posttranslational modifications of RFWD3. While similar RFWD3 expression was observed in two of the cell lines, the COV318 cells showed minimal expression levels (Figure 2B). This was significantly reduced compared with the other cell lines (p=0.0001, p=0.002 for 59M and ES2 respectively) (Figure 2C). Interestingly, reduced expression occurred in the most chemosensitive cell line of the three (Figure 2A).
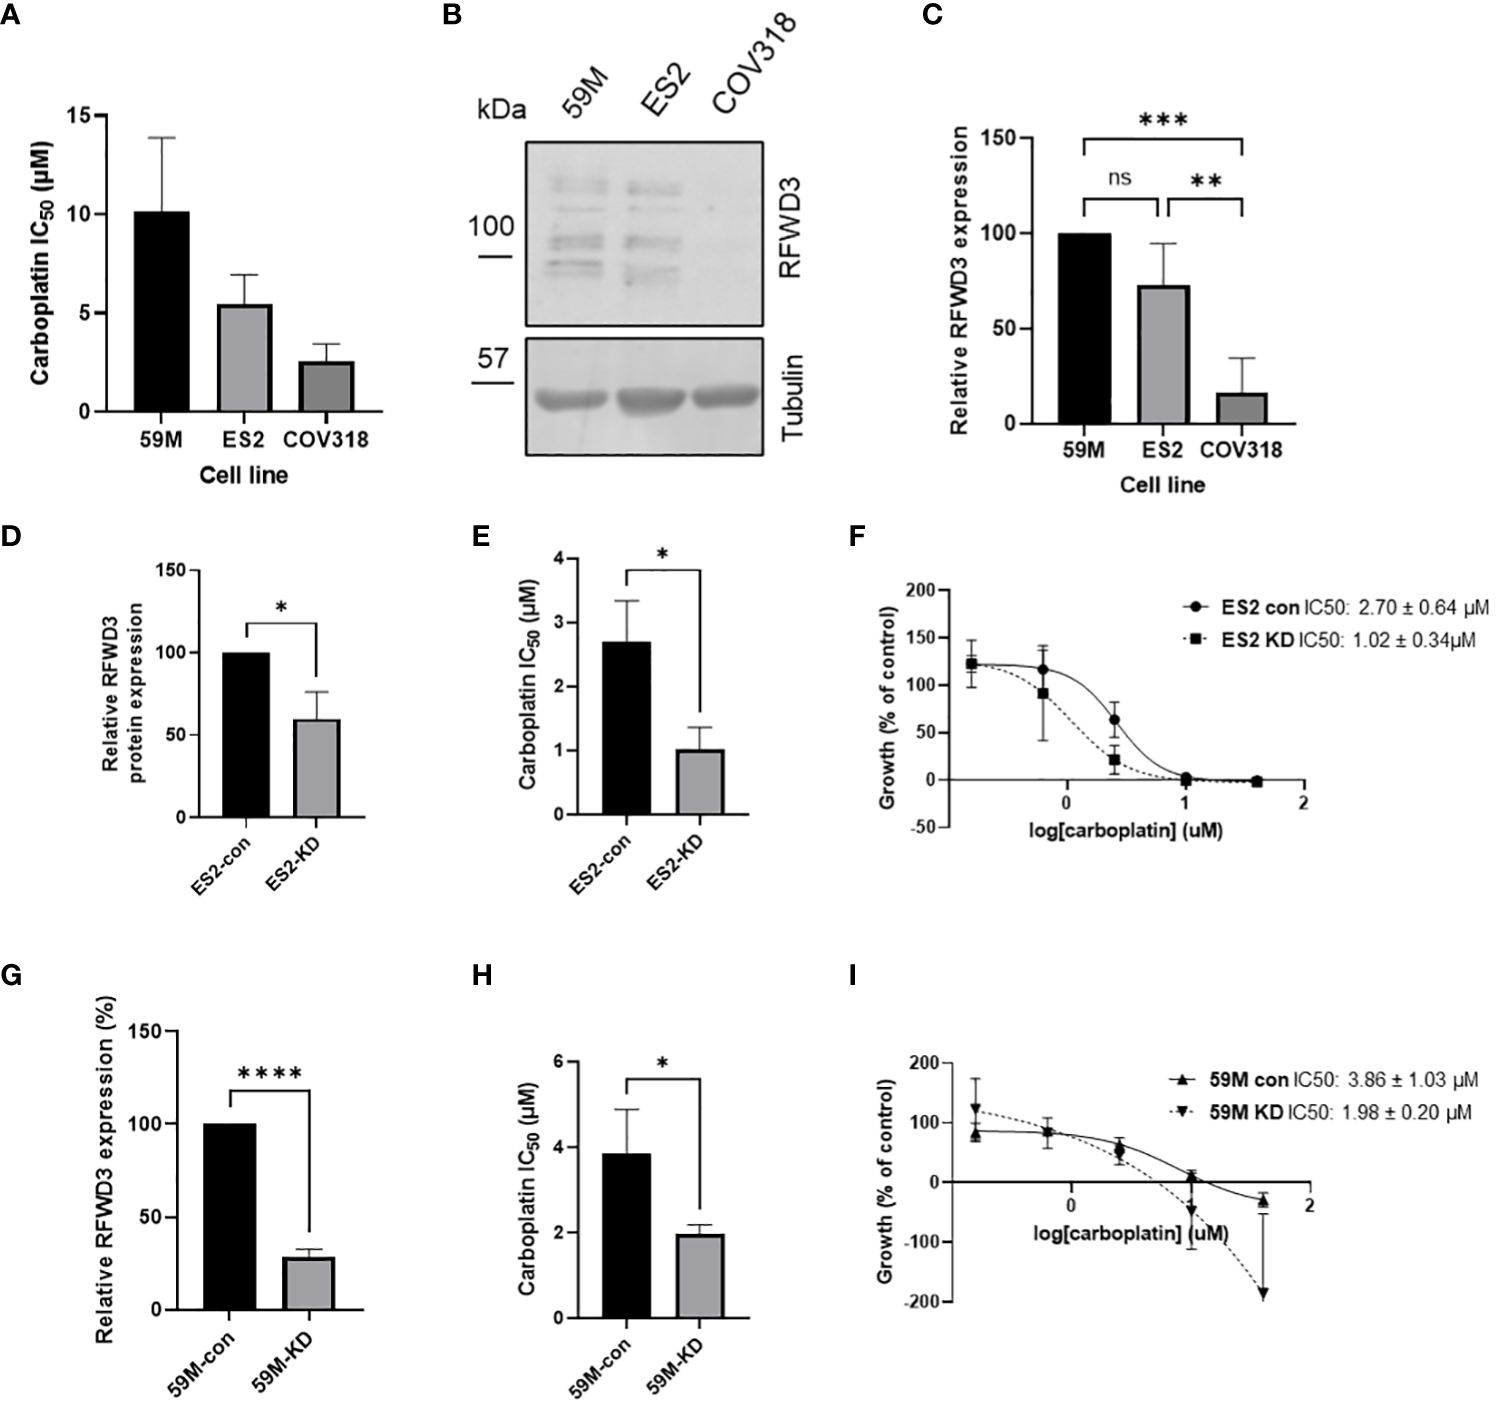
Figure 2 RFWD3 expression mediates carboplatin resistance in HGSOC cell lines. (A) IC50 values for carboplatin for 59M, ES2 and COV318 cell lines. Mean values of 3 biological replicates plotted. Error bars show SD. (B) Western blot showing RFWD3 expression in HGSOC cell lines 59M, ES2 and COV318. Full length blot shown in Supplementary Figure S15. (C) Quantification of Western blots showing expression of RFWD3 protein in 59M, ES2 and COV318 cell lines. Mean values of four biological replicates plotted. Error bars show SD. (D) Quantification of relative RFWD3 expression from Western blot of ES2 cells transfected with control or RFWD3 targeting siRNA, normalised to tubulin loading control and described as a percentage of control transfected cells. Error bars show SD. Mean values of 3 biological replicates plotted. (E) Carboplatin IC50 values for ES2 cell line transfected with control or RFWD3 targeting siRNA. Error bars show SD. Mean values of 3 biological replicates plotted. (F) Concentration response curves for ES2 cell line transfected with control or RFWD3 targeting siRNA and treated with 40 - 0.078µM carboplatin. Error bars show SD. Mean values of 3 biological replicates plotted. (G) Quantification of relative RFWD3 expression from Western blot of 59M cells transfected with control or RFWD3 targeting siRNA, normalised to tubulin loading control and described as a percentage of control transfected cells. Error bars show SD. Mean values of 3 biological replicates plotted. (H) Carboplatin IC50 values for 59M cell line transfected with control or RFWD3 targeting siRNA. Error bars show SD. Mean values of 3 biological replicates plotted. (I) Concentration response curves for 59M cell line transfected with control or RFWD3 targeting siRNA and treated with 40 - 0.078µM carboplatin. Error bars show SD. Mean values of 3 biological replicates plotted. **** p<0.0001, *** p<0.001, ** p<0.01, *p<0.05, ns, not significant. Statistics performed via ANOVA with Tukey’s multiple comparisons test (C) or unpaired t-test (D, E, G, H).
Therefore, a potential link between RFWD3 expression and chemosensitivity was investigated. As the COV318, ES2 and 59M cell lines have different genetic backgrounds, and therefore a combination of multiple factors is likely responsible for differences in chemosensitivity, isogenic cell lines were used to determine whether modulation of RFWD3 could contribute to chemosensitivity. Transient knockdown of RFWD3 was performed in the 59M and ES2 cell lines using siRNA (Supplementary Figure S3). Endogenous expression levels of RFWD3 in the COV318 cell line were too low to obtain a measurable expression difference upon siRNA knockdown. Reduced RFWD3 expression decreased the IC50 of carboplatin by approximately 2-fold in both 59M (mean IC50 3.9µM VS 2.0µM, p=0.036) and ES2 (mean IC50 2.7µM VS 1.0µM, p=0.016) cell lines (Figures 2D-I). Therefore, low RFWD3 expression appeared to be associated with increased carboplatin sensitivity.
To study the effects of differential RFWD3 expression in a stable model, CRISPR/cas9 mediated gene editing was used to disrupt the RFWD3 gene in the ES2 cell line. Two sgRNAs were designed and used to delete a DNA section of 197bp across exons 5 and 6 of the RFWD3 gene. Clones with homozygous edits were obtained (Supplementary Figure S4), and the edits were confirmed by sequencing (Supplementary Figures S5-S7). However, edited clones still retained expression of RFWD3 protein (Supplementary Figure S8), although this was reduced by approximately 50% compared with empty vector transfected controls. It was therefore reasoned that the mutations may be hypomorphic, resulting in reduced protein expression. These cell lines are hereafter referred to as RFWD3Δ/Δ cells. Interestingly, we were able to produce knockout cell lines using the PEO1 ovarian cancer cell line, for another FA pathway protein, FANCD2 (Supplementary Figure S9) using the same methodology. While multiple other groups have attempted to generate knockout models of RFWD3, these have also been unsuccessful and have resulted in similarly reduced protein levels (15, 18, 30). Therefore, RFWD3 is speculated to be an essential gene for cell survival.
As the siRNA data showed that changes in RFWD3 expression can modify response to platinum, the response of RFWD3Δ/Δ cells to a range of chemotherapeutic drugs was assessed, in order to identify potential strategies to best treat tumours with differing expression of RFWD3. Consistent with our previous results, the RFWD3Δ/Δ cells were hypersensitive to carboplatin, demonstrating an approximately 10-fold increase in sensitivity compared with controls (mean IC50 2.9µM control VS 0.3µM RFWD3 Δ/Δ clone 3, p=0.0004; mean IC50 2.9µM control VS 0.8µM RFWD3 Δ/Δ clone 44, p=0.003) (Figures 3A, B). RFWD3Δ/Δ cells showed similarly enhanced sensitivity to mitomycin C (mean IC50 25.9nM control VS 1.9nM RFWD3 Δ/Δ clone 3, p<0.0001; mean IC50 25.9nM control VS 5.2nM RFWD3 Δ/Δ clone 44, p=0.0003) (Figures 3C, D); both of these drugs introduce ICLs to DNA. This validated the ability of the RFWD3Δ/Δ cells to show phenotypic changes consistent with FA deficiency.
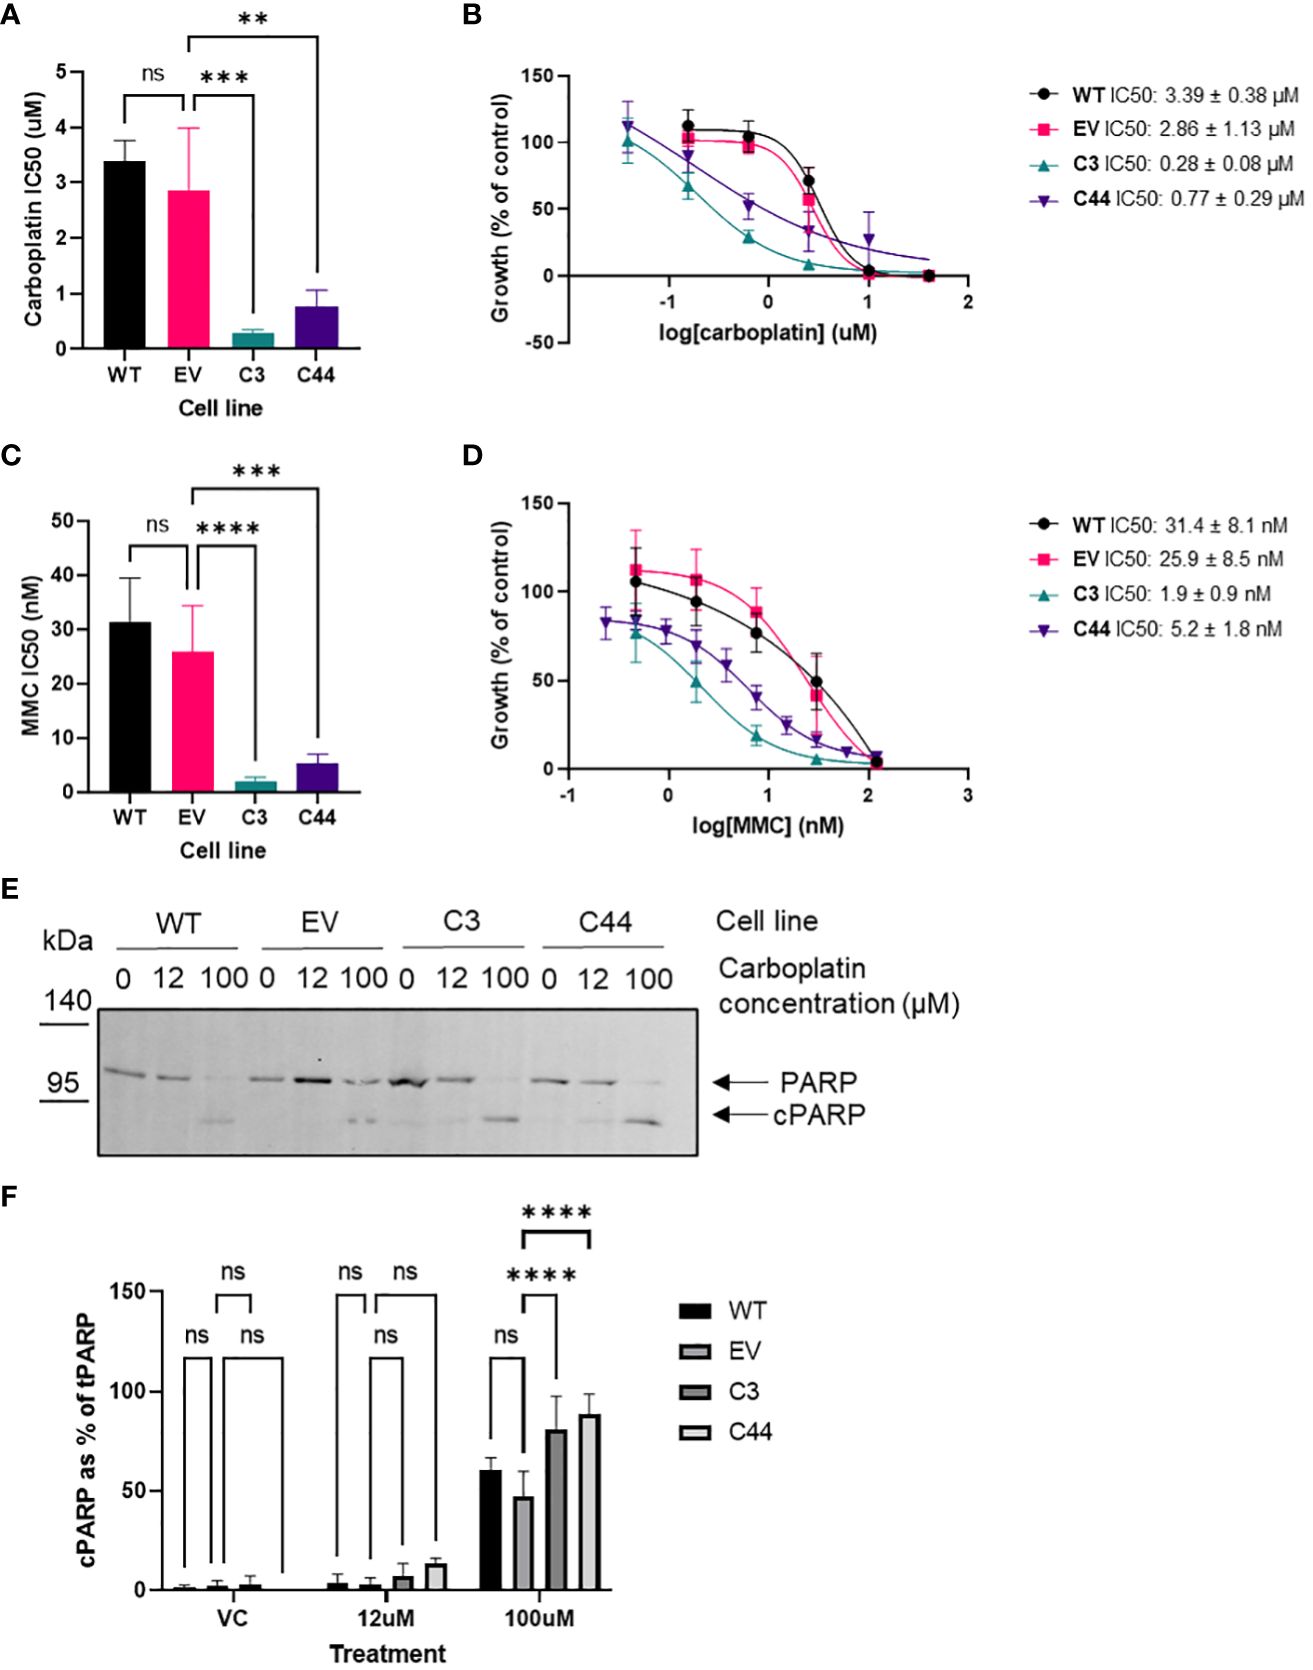
Figure 3 RFWD3 mediates response to ICL inducing chemotherapies. (A) IC50 values for carboplatin treated ES2 wild type, empty vector control, and RFWD3Δ/Δ clones 3 and 44. Error bars show SD. Mean values of 4 biological replicates plotted. Statistical significance calculated via one way ANOVA with Dunnett’s multiple comparisons test. (B) Concentration response curves for ES2 wild type, empty vector control, and RFWD3Δ/Δ clones 3 and 44 treated with 40 - 0.078µM carboplatin. Error bars show SD. Mean values of 4 biological replicates plotted. (C) IC50 values for mitomycin C (MMC) treated ES2 wild type, empty vector control, and RFWD3Δ/Δ clones 3 and 44. Error bars show SD. Mean values of 4 biological replicates plotted. Statistical significance calculated via one way ANOVA with Dunnett’s multiple comparisons test. (D) Concentration response curves for ES2 wild type, empty vector control, and RFWD3Δ/Δ clones 3 and 44 treated with 120 - 0.23nM mitomycin C (MMC). Error bars show SD. Mean values of 4 biological replicates plotted. (E) Representative Western blots of ES2 wild type, empty vector control and RFWD3Δ/Δ clones 3 and 44 treated with vehicle control, 12µM or 100µM carboplatin. Upper band indicated in red represents full length PARP, lower band indicated in blue represents cPARP. Molecular weights in kDa. Full length blot shown in Supplementary Figure S16. (F) Bar chart showing cPARP normalised to total PARP for ES2 wild type, empty vector control and RFWD3Δ/Δ clones 3 and 44 treated with vehicle control, 12µM or 100µM carboplatin. 4 biological replicates. Error bars show SD. Statistical significance calculated via two way ANOVA with Dunnett’s multiple comparisons test. **p<0.01, ***p<0.001, ****p<0.0001, ns, not significant.
Apoptosis in response to carboplatin treatment was assessed via Western blot analysis of caspase-cleaved PARP (cPARP). The proportion of cPARP expression increased for all cell lines upon treatment with carboplatin (Figures 3E, F). At 100µM carboplatin treatment, there was a significant increase in the proportion of cPARP in the RFWD3Δ/Δ cell lines compared with controls (mean percentage of cPARP 47% control VS 81% RFWD3 Δ/Δ clone 3, p<0.0001; mean percentage of cPARP 47% control VS 89% RFWD3 Δ/Δ clone 44, p<0.0001) (Figure 3F). This indicates that RFWD3 deficiency can lead to increased apoptosis upon carboplatin treatment.
Cell response to treatment with paclitaxel, another commonly utilized chemotherapeutic in HGSOC treatment, was also assessed. No consistent differences in paclitaxel sensitivity of control and RFWD3Δ/Δ cells were observed (Supplementary Figure S10). Therefore, ICL inducing agents appear to be the most effective treatment for tumour cells with low expression of RFWD3. To assess whether there was a differential response to PARP inhibitors, the response of the RFWD3 Δ/Δ clone 3 was compared with the control clones, however only a non-significant small change was observed (Supplementary Figure S11).
RFWD3 has been previously reported to participate in non-canonical signalling pathways distinct from its role in ICL repair in other cancer types (21, 22). Therefore, the effect of RFWD3 deficiency on cancer relevant phenotypes was assessed using the RFWD3Δ/Δ cell lines.
Proportions of cells in different phases of the cell cycle were assessed using flow cytometry (Supplementary Figure S12). There was no difference in the proportions of cells in G0/G1 or S-phase of the cell cycle (Figures 4A, B). However, both RFWD3Δ/Δ clones showed an accumulation of cells in G2/M phase compared with controls (mean percentage of cells 10.7% control VS 15.3% RFWD3 Δ/Δ clone 3, p=0.013; mean percentage of cells 10.7% control VS 18.6% RFWD3 Δ/Δ clone 44, p=0.0001) (Figure 4C). This indicates that RFWD3 can modify cell cycle progression, either directly or indirectly through accumulation of DNA breaks due to ICL repair loss, and deficiency of RFWD3 results in G2/M checkpoint arrest.
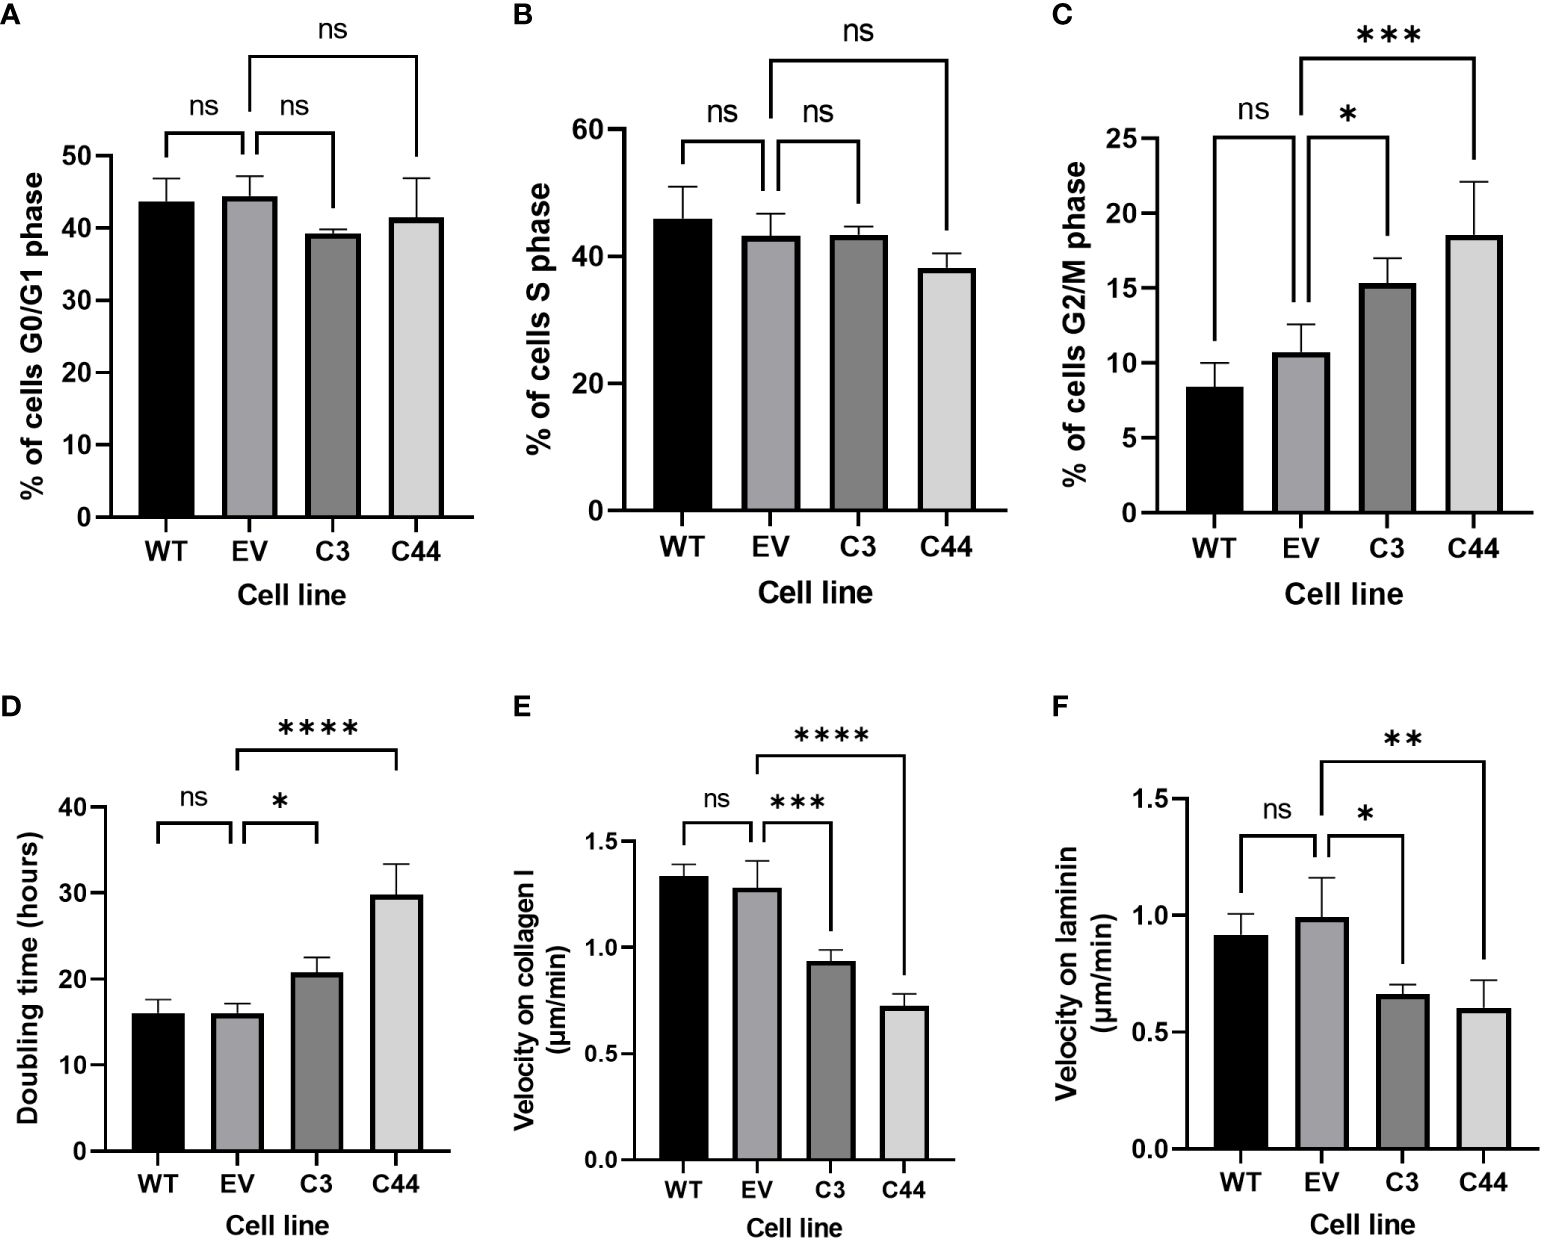
Figure 4 Non-canonical roles of RFWD3 in HGSOC cells. (A-C) Percentage of cells in (A) G0/G1, (B) S, and (C) G2/M phase of the cell cycles for ES2 wild type (WT), empty vector (EV) control, and RFWD3Δ/Δ clones 3 and 44 C3 and C44). 4 biological replicates. (D) Doubling times for ES2 wild type, empty vector control, and RFWD3Δ/Δ clones 3 and 44 in culture. 4 biological replicates. (E, F) Mean 2D migration velocity of for ES2 wild type, empty vector control, and RFWD3Δ/Δ clones 3 and 44 on (E) collagen I and (F) laminin. 3 biological replicates. Error bars show SD. Statistics calculated via ANOVA with Dunnett’s multiple comparisons test. *p<0.05, **p<0.01, ***p<0.001, ****p<0.0001, ns, not significant.
Cell growth was measured over 72h (Supplementary Figure S13). Doubling times of RFWD3Δ/Δ cells were significantly increased compared with controls (mean doubling time 16.1h control VS 20.8h RFWD3 Δ/Δ clone 3, p=0.028; mean doubling time 16.1h control VS 29.8h RFWD3 Δ/Δ clone 44, p<0.0001) (Figure 4D), demonstrating that deficiency of RFWD3 results in impairment of tumour cell proliferation. This again may be either a direct effect of RFWD3 loss, or an indirect effect resulting from accumulation of DNA damage.
Motility of cells in 2D was measured on collagen I and laminin substrates (Supplementary Figure S14), as these are major components of the ovarian extracellular matrix. Wild type and empty vector control ES2 cells were capable of migration on both substrates. In comparison, RFWD3Δ/Δ cells showed significantly impaired migration velocities both on collagen I (mean velocity 1.28µm/min control VS 0.94µm/min RFWD3 Δ/Δ clone 3, p=0.001; mean velocity 1.28µm/min control VS 0.72µm/min RFWD3 Δ/Δ clone 44, p<0.0001) and laminin (mean velocity 0.99µm/min control VS 0.66µm/min RFWD3 Δ/Δ clone 3, p=0.014; mean velocity 0.99µm/min control VS 0.60µm/min RFWD3 Δ/Δ clone 44, p=0.005) (Figures 4E, F), indicating that RFWD3 can influence cell migration.
To explore potential relationships between RFWD3 expression patterns at the protein level and outcomes in HGSOC, tumour microarrays were immunostained for RFWD3. Microarrays were generated consisting of 231 evaluable tumour cores sampled from a cohort of chemonaïve HGSOC patients at primary surgery. Summary clinicopathological information for this cohort is given in Supplementary Tables S3 and S4.
RFWD3 staining predominantly occurred in cell nuclei, and intensity was highly varied across the cohort (Figures 5A-C). Histoscores, describing the overall proportion of strong, moderate, weak and negative staining, were generated for each core based on the nuclear staining intensity in tumour cells. These were normally distributed (Figure 5D), therefore the cases were split into “high” “mid” and “low” expression groups based on quartiles, with histoscores greater than Q3 assigned as “high” expression, less than Q1 assigned as “low” expression, and remaining cases assigned as “mid” level expression. Differences in clinical characteristics for the RFWD3 expression groups were assessed. No significant associations were found between RFWD3 expression and patient age, tumour stage, residual disease, or BRCA1/2 mutation status (Supplementary Table S3).
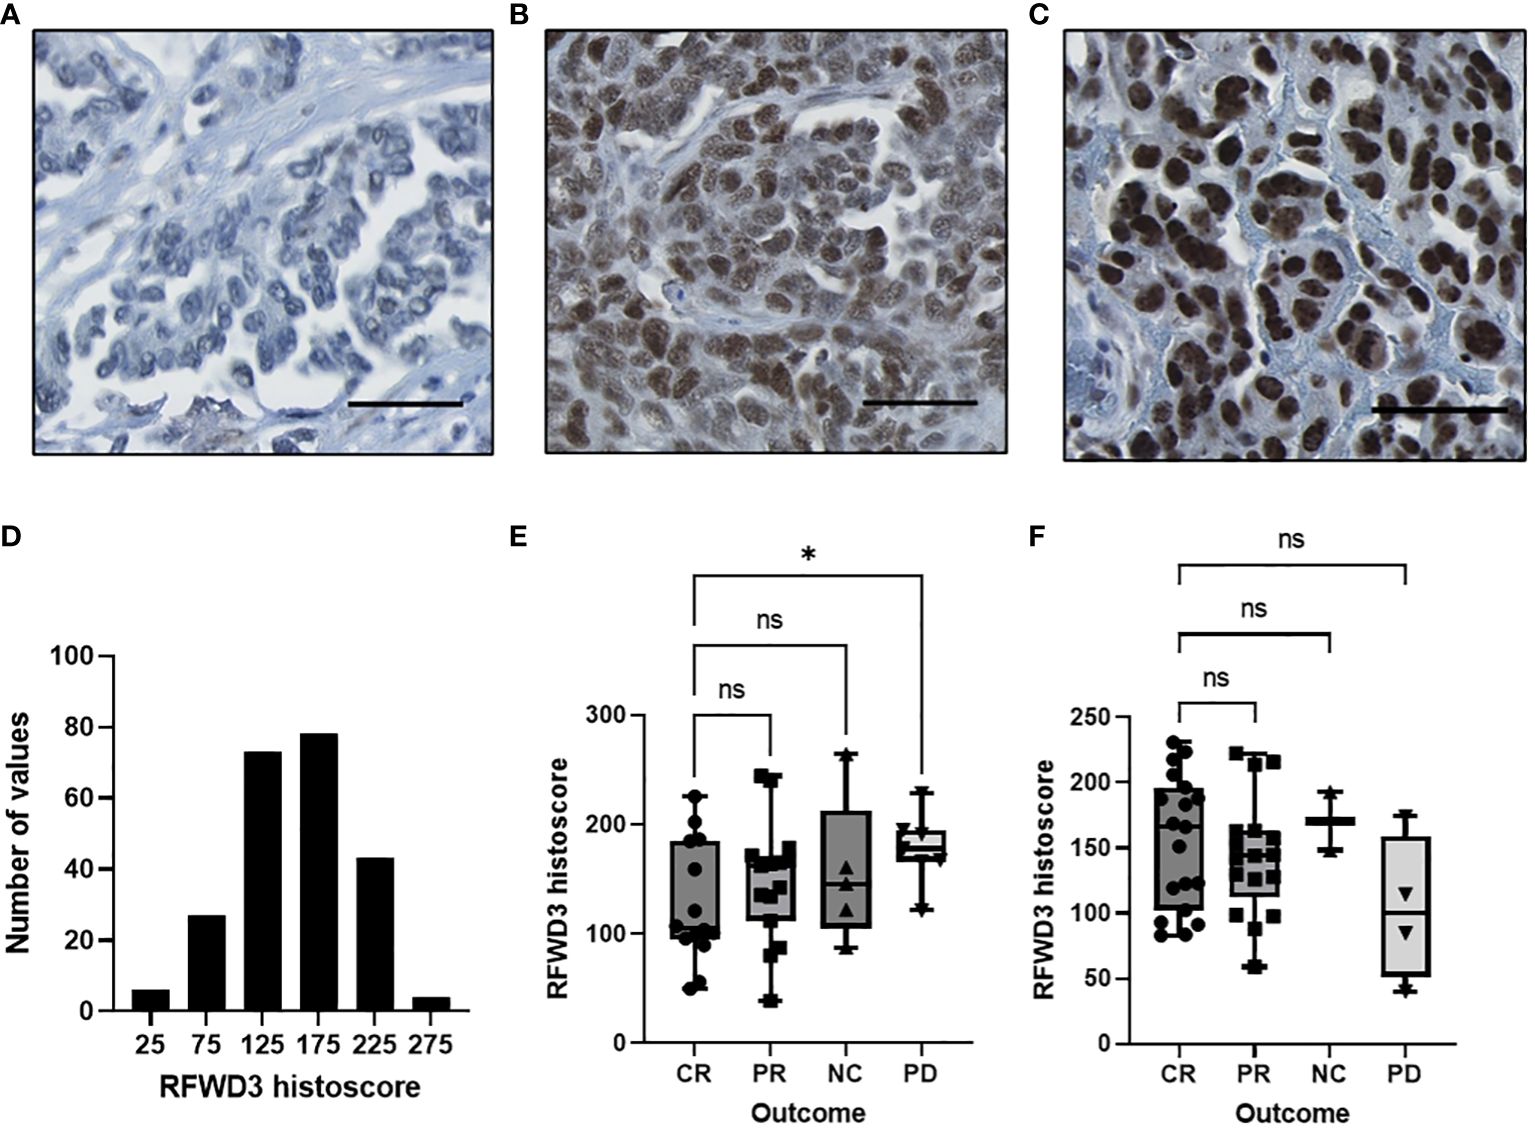
Figure 5 Expression of RFWD3 protein varies in a HGSOC cohort and is associated with response to platinum. (A-C) Representative images of RFWD3 staining in HGSOC tumour cores showing range of staining intensities in tumour nuclei. Brown staining shows RFWD3 expression, blue staining shows counterstain. Scale bars 100µm. (D) Histogram showing RFWD3 histoscores for tumour cores across the cohort. Bin size 50. (E, F) Box plots showing RFWD3 expression for tumours separated by response to chemotherapy. (E) cases treated with platinum based chemotherapy without taxanes and (F) cases treated with platinum and taxane based chemotherapy. CR, complete response; PR, partial response; NC, no change; PD, progressive disease by RECIST criteria. * p<0.05, ns, not significant via Welch’s ANOVA with Dunnett’s T3 multiple comparisons test. Box plots show 25th, 50th and 75th quartiles, whiskers extend to maximum and minimum points. Individual points shown.
Response to first line therapy was assessed for the tumours. Radiological response data was available for 83 of the tumours analysed for RFWD3 expression. A total of 42 of these were treated with platinum and taxanes, while 41 were treated with platinum without taxanes. As the number of cases with radiological response data available was low, quartile group data could not be analysed due to insufficient group numbers to give meaningful results. Therefore, response was assessed by comparing RFWD3 histoscores for each outcome for the different treatment types.
Significantly lower RFWD3 expression was observed for those patients with a complete response (CR) compared to those who showed progressive disease (PD) for the patients treated with platinum only (median histoscores 105 CR VS 178 PD, p=0.046) (Figure 5E). This supports a role for RFWD3 expression in tumour platinum response. In contrast, for those patients treated with platinum and taxane based therapy, there was no significant difference between those with a complete response to chemotherapy and those with progressive disease (Figure 5F).
The survival data was also analysed for this patient cohort, to determine whether the differences in therapeutic outcomes observed would translate into survival differences for patients with altered RFWD3 expression. Multivariate analyses of OS and PFS were carried out using the Cox proportional hazards model (Table 1). Age and residual disease were accounted for in the models, and the models were stratified by stage as this did not fit the proportional hazards assumption. Counter to expectations, the RFWD3 high-expression group had an improved PFS compared to the mid-expression group (hazard ratio 0.46-0.99, p=0.045). There was no significant difference in survival for the low-expression group. This finding however did not translate to a change in OS, as there were no significant changes for any of the RFWD3 expression groups.
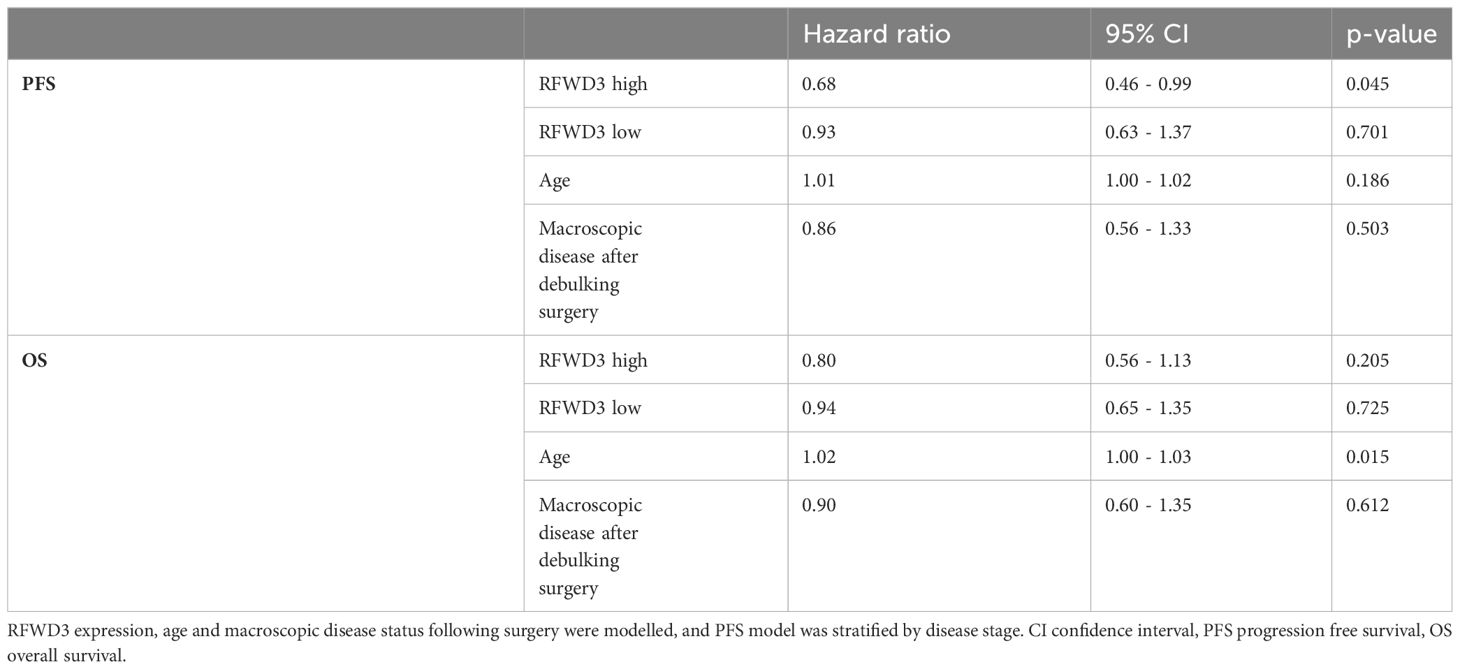
Table 1 Cox proportional hazards analyses of PFS and OS for a HGSOC patient cohort.
Previous work has established that while mutations are uncommon to rare in HGSOC, excluding those which occur in TP53 and BRCA1/2, HGSOC has a diverse genetic and molecular landscape (5, 28). We have found that despite the lack of mutations, RFWD3 expression is varied in HGSOC, and a subset of cases with low expression of RFWD3 were identified in the TCGA-OV dataset. Analyses of tissue samples and cell lines provided further evidence of this, with a wide range of RFWD3 protein staining observed in TMA samples, and limited RFWD3 expression observed in a HGSOC cell line. Reduced expression of other components of the FA pathway has been demonstrated to impair DNA damage repair capacity, conferring platinum sensitivity upon ovarian tumour cells and leading to favourable patient prognosis (31–33). We therefore investigated further the phenotypic and molecular impact of alterations in RFWD3 expression.
In the TCGA-OV dataset, cases with low RFWD3 expression were associated with increased tumour mutational burden and mutation count. This shows that changes in RFWD3 expression are sufficient to drive phenotypic changes in HGSOCs. In unstressed cells, RFWD3 has been proposed to maintain genomic stability by stabilizing DNA replication forks during normal replication processes (18). In the context of cancer cells in particular, which undergo rapid proliferation and are often subject to genotoxic stresses such as chemotherapy, the role of RFWD3 in the FA and HR pathways of DNA repair is also crucial for the maintenance of genomic stability (13, 30). Consistent with our work, accumulation of mutations has previously been observed in RFWD3 mutated fibroblasts, and can be corrected by addition of wild type RFWD3 (13). We build on this by providing evidence of a more definitive link between decreased RFWD3 expression and the acquisition of a genomic instability phenotype in tumours.
CRISPR-mediated gene editing was used to generate stable cell models of reduced RFWD3 expression. However, while hypomorphic mutations were introduced, we were unable to completely eliminate expression of RFWD3 from cells. This is consistent with the results of other groups, who have attempted to produce knockouts of RFWD3 using a wide variety of cell types and edit sites (15, 18, 30). Therefore, it may be the case that RFWD3 is an essential gene for cell survival. Our group has successfully produced knockouts of another FA pathway gene using CRISPR-mediated gene editing (Supplementary Figure S9), and examples exist in the literature of the successful knockout of other FA pathway genes (34). Therefore, the essential nature of RFWD3 is likely unrelated to its role in FA mediated DNA repair, and may be a result of an alternative role of RFWD3, such as that which it plays in DNA replication (18).
RFWD3 depletion in HGSOC cell lines resulted in enhanced carboplatin sensitivity, both in transient and stable knockdown models. Previous studies have identified RFWD3 as a top hit for induction of cisplatin sensitivity in a genome wide siRNA screen (35), and shown that deficiency and mutation of RFWD3 are linked to cisplatin sensitivity (13, 15). Due to the shared mechanism of action of cisplatin and carboplatin (36), it is not unexpected that reduced RFWD3 expression also resulted in carboplatin sensitivity in the models that we used. Cisplatin has been shown to cause cell death via apoptosis in ovarian cancer cells (37, 38) which correlates with chemosensitivity in patient samples (39). This indicates that p53 and FAS ligand dependent apoptosis as a consequence of unrepaired ICLs (40) may be greatly enhanced by RFWD3 deficiency. Knockdown of RFWD3 may therefore restrict the ability of the cell to carry out ICL repair, leaving cells lacking RFWD3 vulnerable to platinum therapies. This could be exploited in cancers expressing lower levels of RFWD3.
Cells with reduced expression of RFWD3 also showed increased sensitivity to mitomycin C which, similar to platinum, induces ICLs in DNA (13). This confirmed that accumulation of ICLs is likely the cause of the enhanced sensitivity of RFWD3 deficient cells to carboplatin. While mitomycin C is not used routinely in the treatment of HGSOC, it reportedly may have clinical utility in BRCA1 mutated ovarian cancers, particularly in heavily pre-treated and recurrent cancers with poor prognosis (41, 42). Mitomycin C also exhibits differing toxicity profiles to carboplatin (42), so could be used in combination with standard platinum chemotherapies, in cases with low expression of RFWD3. A preliminary study has demonstrated that this may be an effective approach in BRCA1 mutated ovarian cancer (43).
In contrast to the enhanced sensitivity to platinum, no consistent change in paclitaxel sensitivity was observed in cell lines with reduced expression of RFWD3. This further demonstrates the value of using ICL inducing therapies over other options in the treatment of tumours with low RFWD3 expression.
The enhanced sensitivity of RFWD3 deficient cells to these DNA damaging agents is likely due to the key roles it fulfils in DNA damage repair, in particular ICL repair. RFWD3 is known to mediate ubiquitination of RPA at stalled replication forks to promote HR repair (17) and RAD51 to trigger unloading from DNA damage sites, and thus enable loading of late-stage HR factors and successful completion of HR (15). In the FA pathway it also functions to promote TLS by ubiquitination of single stranded DNA bound proteins, ultimately leading to stimulation of gap-filling DNA synthesis (14). As cell death in response to both mitomycin C and platinum-containing compounds is thought to be due to induction of ICLs (13, 36), this is likely the main cause of RFWD3 mediated sensitivity to these agents. Due to these multiple roles that RFWD3 plays in ICL repair, enhanced sensitivity to these agents may be a consequence of bulky adducts from unresolved ICLs blocking transcription and DNA replication, or accumulation of unresolved DSBs resulting from incomplete ICL repair or replication fork collapse (14, 15, 17). It is noted that the STRING database (https://string-db.org/) (44) also lists interactions of RFWD3 with PRIMPOL, MLKL and MDM2. PRIMPOL is involved in response to replication stress and stalled fork restart, and MDM2 is involved in the p53 mediated response to DNA damage response. Therefore, multiple roles of RFWD3 may also contribute to the observed platinum sensitivity (16, 45). Further investigation of DNA damage repair in RFWD3 deficient cells may help to elucidate a precise mechanism for the observed platinum and mitomycin C sensitivity.
The role of RFWD3 in platinum resistance was further demonstrated in an analysis of HGSOC patient tumour samples. A complete response to platinum-based chemotherapy was associated with lower expression of RFWD3 compared with progressive disease. However, this was not the case for those patients treated with platinum plus taxane combination therapy. This heightened sensitivity to platinum is consistent with the previous finding that RFWD3 deficient cells were hypersensitive to platinum therapy. It is unknown why those patients treated with both platinum and taxane failed to demonstrate the same low RFWD3 expression in complete responders as the group treated with platinum but not taxanes. A systematic review of the literature on platinum and taxane resistance suggests an inverse relationship between platinum and taxane resistance, i.e. cells that are resistant to carboplatin are more sensitive to taxanes (46). However, this is disputed, with some trials showing a survival benefit of platinum and taxane therapy compared to platinum alone in platinum sensitive ovarian cancer (47). Our data suggests that RFWD3 may have some utility as a biomarker of platinum sensitivity, and that patients with low RFWD3 expression may benefit more from treatment with platinum-based and ICL inducing chemotherapy, but not taxane-based therapies.
Another way in which RFWD3 may contribute to cellular phenotype is via its role in the cell cycle. We have shown here that in HGSOC cells, RFWD3 deficiency can lead to an accumulation of cells in G2/M phase, indicating a potential checkpoint block. This has also been previously reported in gastric cancer cells (21). A third group have reported a trend towards increased proportion of cells in G2/M phase in the U20S osteosarcoma cell line (18), however this only achieved statistical significance with one siRNA tested. However, they did observe an increased proportion of cells in S-phase (18). A possible explanation for this is the difference in genetic background between the cell lines. The ES2 cell line carries a TP53 mutation, characteristic of HGSOC (5), which may result in dysregulation of the S-phase checkpoint regardless of RFWD3 expression status (48), whereas the U2OS cell line is TP53 wild type. As platinum containing drugs also cause arrest in G2/M phase followed by apoptosis (49), cell cycle dysregulation may be an important contributor to the enhanced platinum sensitivity of cells with reduced RFWD3 expression.
We have also demonstrated further non-canonical roles of RFWD3 in HGSOC cells for the first time, including effects on cell proliferation and migration. A link between reduced RFWD3 expression and impaired cell proliferation has been previously shown in lung, colorectal and gastric cancers (20–22). This may be a result of the dysregulated cell cycle we observed in this cell line, with accumulation in G2/M phase leading to inhibition of cell growth. In gastric and colorectal cancer, RFWD3 was also associated with a cell migratory phenotype (21, 22). Interestingly, these factors are thought to be linked to a signalling role of RFWD3 separate from the roles it plays in DNA damage repair. Downregulation of RFWD3 has been associated with decreased activation of ERK, AKT and P38, and decreased expression of slug and N-cadherin, all of which are implicated in tumourigenesis (21). Direct interaction between RFWD3 and the E2F1 transcription factor has been shown to increase expression of BIRC5 and thus increase cell proliferation and migration (22). Consistent with this, targeting of BIRC5 in ovarian cancer has previously been found to reduce migration and invasion in vitro, and metastasis in vivo (50). In spite of this, similar to our findings for RFWD3, overexpression of BIRC5 has been associated with survival benefits in HGSOC (51). This indicates that the survival results that we observed may be related to the non-canonical signalling functions of RFWD3, and are not entirely unexpected.
Despite the evidence that low RFWD3 may convey a favourable cellular phenotype in terms of proliferation, migration, and chemosensitivity, no differences were observed in survival between the RFWD3 low-expressing tumours and RFWD3 mid-expressing tumours during analysis of a HGSOC patient cohort. Indeed, those tumours which expressed the highest levels of RFWD3 demonstrated the best survival outcomes. This may be reflective of the conflicting roles which RFWD3 plays in the tumour setting. One of the underlying characteristics of Fanconi anaemia is a predisposition to cancer due to increased levels of genomic instability (52), and BRCA1 and BRCA2 mutations are known to predispose individuals to breast and ovarian cancers (53, 54). We have demonstrated that low expression of RFWD3 also leads to increased frequency of mutations in HGSOC tumours. Conversely, high expression of RFWD3 may lead to a tumour with greater genomic stability, which may therefore accumulate fewer mutations, resulting in a lower degree of intratumour heterogeneity. The relationship between genomic instability, intratumour heterogeneity and prognosis is not straightforward, with pan-cancer and ovarian cancer studies suggesting that while some level of instability is favourable for cancer cell survival, beyond a certain point it may in fact be disadvantageous (55, 56). High intratumour heterogeneity has been associated with reduced progression-free survival in HGSOC, despite the fact that greater loss of heterozygosity is associated with good prognosis (57). While loss of FA pathway proteins BRCA1 and BRCA2 is associated with good prognosis (7), the multiple roles distinct from the FA pathway demonstrated for RFWD3 in our study and others highlight the fact that the larger picture of protein functionality should be considered, making survival interpretation more complex.
In conclusion, multiple roles have been identified for RFWD3 in HGSOC, as a result of both its function in ICL repair and its further non-canonical signalling roles. RFWD3 has been shown to mediate a wide range of tumour relevant functions, including genomic stability, response to ICL inducing chemotherapies, regulation of the cell cycle, proliferation and migration. However, the interplay between these roles is complex, and should be further studied. In future, RFWD3 may have utility as a biomarker of platinum sensitivity, or as a drug target for sensitizing tumours to platinum.
The original contributions presented in the study are included in the article/Supplementary Material. Further inquiries can be directed to the corresponding authors.
The studies involving humans were approved by Lothian NRS Bioresource Ethics Committee. The studies were conducted in accordance with the local legislation and institutional requirements. The ethics committee/institutional review board waived the requirement of written informed consent for participation from the participants or the participants’ legal guardians/next of kin because the retrospective nature of the study.
ST: Conceptualization, Formal analysis, Investigation, Methodology, Visualization, Writing – original draft, Writing – review & editing. RH: Methodology, Resources, Writing – review & editing. CG: Methodology, Resources, Writing – review & editing. CH: Methodology, Resources, Writing – review & editing. SL: Conceptualization, Funding acquisition, Supervision, Writing – review & editing. MA: Conceptualization, Funding acquisition, Supervision, Writing – review & editing.
The author(s) declare that financial support was received for the research, authorship, and/or publication of this article. ST was funded by a PhD studentship from the Melville Trust for the Care and Cure of Cancer. RH was supported by an IGC Langmuir Talent Fellowship. The funders had no role in study design, data collection and analysis, decision to publish, or preparation of the manuscript.
We extend our thanks to The Nicola Murray Foundation for their generous support of The Nicola Murray Centre for Ovarian Cancer Research. We are grateful to the NHS Lothian Department of Pathology, Edinburgh Experimental Cancer Medicine Centre, the Edinburgh Ovarian Cancer Database and the NRS Lothian Human Annotated Bioresource for their ongoing support.
RH reports consultancy fees from GSK and DeciBio. CG reports research funding from AstraZeneca, MSD, Novartis, Aprea, Nucana, GSK, BerGen Bio, Medannexin, Artios; honoraria/consultancy fees from AstraZeneca, MSD, GSK, Clovis, Chugai, Cor2Ed, Takeda, Eisai, Peer Voice; named on issued/pending patents related to predicting treatment response in ovarian cancer outside the scope of the work described here.
The remaining authors declare that the research was conducted in the absence of any commercial or financial relationships that could be constructed as a potential conflict of interest.
All claims expressed in this article are solely those of the authors and do not necessarily represent those of their affiliated organizations, or those of the publisher, the editors and the reviewers. Any product that may be evaluated in this article, or claim that may be made by its manufacturer, is not guaranteed or endorsed by the publisher.
The Supplementary Material for this article can be found online at: https://www.frontiersin.org/articles/10.3389/fonc.2024.1389472/full#supplementary-material
1. Torre LA, Trabert B, DeSantis CE, Miller KD, Samimi G, Runowicz CD, et al. Ovarian cancer statistics, 2018. Ca-a Cancer J Clin. (2018) 68:284–96. doi: 10.3322/caac.21456
2. Hollis RL. Molecular characteristics and clinical behaviour of epithelial ovarian cancers. Cancer Lett. (2023) 555. doi: 10.1016/j.canlet.2023.216057
3. Berns E, Bowtell DD. The changing view of high-grade serous ovarian cancer. Cancer Res. (2012) 72:2701–4. doi: 10.1158/0008-5472.CAN-11-3911
4. Bowtell DD, Bohm S, Ahmed AA, Aspuria PJ, Bast RC, Beral V, et al. Rethinking ovarian cancer II: reducing mortality from high-grade serous ovarian cancer. Nat Rev Cancer. (2015) 15:668–79. doi: 10.1038/nrc4019
5. Bell D, Berchuck A, Birrer M, Chien J, Cramer DW, Dao F, et al. Integrated genomic analyses of ovarian carcinoma. Nature. (2011) 474:609–15. doi: 10.1038/nature10166
6. D'Andrea AD, Grompe M. The Fanconi anaemia BRCA pathway. Nat Rev Cancer. (2003) 3:23–34. doi: 10.1038/nrc970
7. Tan DSP, Rothermundt C, Thomas K, Bancroft E, Eeles R, Shanley S, et al. "BRCAness" Syndrome in ovarian cancer: A case-control study describing the clinical features and outcome of patients with epithelial ovarian cancer associated with BRCA1 and BRCA2 mutations. J Clin Oncol. (2008) 26:5530–6. doi: 10.1200/JCO.2008.16.1703
8. Bolton KL, Chenevix-Trench G, Goh C, Sadetzki S, Ramus SJ, Karlan BY, et al. Association between BRCA1 and BRCA2 mutations and survival in women with invasive epithelial ovarian cancer. Jama-Journal Am Med Assoc. (2012) 307:382–90. doi: 10.1001/jama.2012.20
9. Hollis RL, Churchman M, Gourley C. Distinct implications of different BRCA mutations: efficacy of cytotoxic chemotherapy, PARP inhibition and clinical outcome in ovarian cancer. Oncotargets Ther. (2017) 10:2539–51. doi: 10.2147/OTT
10. Joenje H, Patel KJ. The emerging genetic and molecular basis of Fanconi anaemia. Nat Rev Genet. (2001) 2:446–57. doi: 10.1038/35076590
11. Taylor SJ, Arends MJ, Langdon SP. Inhibitors of the Fanconi anaemia pathway as potential antitumour agents for ovarian cancer. Explor Targeted Antitumor Ther. (2020) 1:26–52. doi: 10.37349/etat
12. Mu JJ, Wang Y, Luo H, Leng M, Zhang JL, Yang T, et al. A proteomic analysis of ataxia telangiectasia-mutated (ATM)/ATM-Rad3-related (ATR) substrates identifies the ubiquitin-proteasome system as a regulator for DNA damage checkpoints. J Biol Chem. (2007) 282:17330–4. doi: 10.1074/jbc.C700079200
13. Knies K, Inano S, Ramirez MJ, Ishiai M, Surralles J, Takata M, et al. Biallelic mutations in the ubiquitin ligase RFWD3 cause Fanconi anemia. J Clin Invest. (2017) 127:3013–27. doi: 10.1172/JCI92069
14. Gallina I, Hendriks IA, Hoffmann S, Larsen NB, Johansen J, Colding-Christensen CS, et al. The ubiquitin ligase RFWD3 is required for translesion DNA synthesis. Mol Cell. (2021) 81:442–+. doi: 10.1016/j.molcel.2020.11.029
15. Inano S, Sato K, Katsuki Y, Kobayashi W, Tanaka H, Nakajima K, et al. RFWD3-mediated ubiquitination promotes timely removal of both RPA and RAD51 from DNA damage sites to facilitate homologous recombination. Mol Cell. (2017) 66:622–+. doi: 10.1016/j.molcel.2017.04.022
16. Fu XY, Yucer N, Liu SF, Li MY, Yi P, Mu JJ, et al. RFWD3-Mdm2 ubiquitin ligase complex positively regulates p53 stability in response to DNA damage. Proc Natl Acad Sci U S A. (2010) 107:4579–84. doi: 10.1073/pnas.0912094107
17. Elia AEH, Wang DC, Willis NA, Boardman AP, Hajdu I, Adeyemi RO, et al. RFWD3-dependent ubiquitination of RPA regulates repair at stalled replication forks. Mol Cell. (2015) 60:280–93. doi: 10.1016/j.molcel.2015.09.011
18. Lin YC, Wang YT, Hsu R, Giri S, Wopat S, Arif MK, et al. PCNA-mediated stabilization of E3 ligase RFWD3 at the replication fork is essential for DNA replication. Proc Natl Acad Sci U S A. (2018) 115:13282–7. doi: 10.1073/pnas.1814521115
19. Zhu Y, Peng XT, Wang XY, Ying PT, Wang HX, Li B, et al. Systematic analysis on expression quantitative trait loci identifies a novel regulatory variant in ring finger and WD repeat domain 3 associated with prognosis of pancreatic cancer. Chin Med J. (2022) 135:1348–57. doi: 10.1097/CM9.0000000000002180
20. Zhang YF, Zhao XC, Zhou YC, Wang M, Zhou GB. Identification of an E3 ligase-encoding gene RFWD3 in non-small cell lung cancer. Front Med. (2020) 14:318–26. doi: 10.1007/s11684-019-0708-6
21. Jia J, Yang YG, Yan TT, Chen T, Lu GX. Down-regulation of RFWD3 inhibits cancer cells proliferation and migration in gastric carcinoma. Gen Physiol Biophysics. (2020) 39:363–71. doi: 10.4149/gpb_2020009
22. Xu FH, Xiao ZF, Fan LQ, Ruan GC, Cheng Y, Tian YT, et al. RFWD3 participates in the occurrence and development of colorectal cancer via E2F1 transcriptional regulation of BIRC5. Front Cell Dev Biol. (2021) 9. doi: 10.3389/fcell.2021.675356
23. Cerami E, Gao JJ, Dogrusoz U, Gross BE, Sumer SO, Aksoy BA, et al. The cBio cancer genomics portal: an open platform for exploring multidimensional cancer genomics data. Cancer Discov. (2012) 2:401–4. doi: 10.1158/2159-8290.CD-12-0095
24. Schindelin J, Arganda-Carreras I, Frise E, Kaynig V, Longair M, Pietzsch T, et al. Fiji: an open-source platform for biological-image analysis. Nat Methods. (2012) 9:676–82. doi: 10.1038/nmeth.2019
25. Ran FA, Hsu PD, Wright J, Agarwala V, Scott DA, Zhang F. Genome engineering using the CRISPR-Cas9 system. Nat Protoc. (2013) 8:2281–308. doi: 10.1038/nprot.2013.143
26. Timpson P, McGhee EJ, Erami Z, Nobis M, Quinn JA, Edward M, et al. Organotypic collagen I assay: A malleable platform to assess cell behaviour in a 3-dimensional context. Jove-Journal Visualized Experiments. (2011) 56. doi: 10.3791/3089-v
27. Meijering E, Dzyubachyk O, Smal I. Methods for cell and particle tracking. Imaging Spectroscopic Anal Living Cells: Optical Spectroscopic Techniques. (2012) 504:183–200. doi: 10.1016/B978-0-12-391857-4.00009-4
28. Hollis RL, Meynert AM, Michie CO, Rye T, Churchman M, Hallas-Potts A, et al. Multiomic characterization of high-grade serous ovarian carcinoma enables high-resolution patient stratification. Clin Cancer Res. (2022) 28:3546–56. doi: 10.1158/1078-0432.CCR-22-0368
29. Bankhead P, Loughrey MB, Fernandez JA, Dombrowski Y, McArt DG, Dunne PD, et al. QuPath: Open source software for digital pathology image analysis. Sci Rep. (2017) 7:1–7. doi: 10.1038/s41598-017-17204-5
30. Feeney L, Munoz IM, Lachaud C, Toth R, Appleton PL, Schindler D, et al. RPA-mediated recruitment of the E3 ligase RFWD3 is vital for interstrand crosslink repair and human health. Mol Cell. (2017) 66:610–+. doi: 10.1016/j.molcel.2017.04.021
31. Tsibulak I, Wieser V, Degasper C, Shivalingaiah G, Wenzel S, Sprung S, et al. BRCA1 and BRCA2 mRNA-expression prove to be of clinical impact in ovarian cancer. Br J Cancer. (2018) 119:683–92. doi: 10.1038/s41416-018-0217-4
32. Taniguchi T, Tischkowitz M, Ameziane N, Hodgson SV, Mathew CG, Joenje H, et al. Disruption of the Fanconi anemia-BRCA pathway in cisplatin-sensitive ovarian tumors. Nat Med. (2003) 9:568–74. doi: 10.1038/nm852
33. Quinn JE, James CR, Stewart GE, Mulligan JM, White P, Chang GKF, et al. BRCA1 mRNA expression levels predict for overall survival in ovarian cancer after chemotherapy. Clin Cancer Res. (2007) 13:7413–20. doi: 10.1158/1078-0432.CCR-07-1083
34. Ramanagoudr-Bhojappa R, Carrington B, Ramaswami M, Bishop K, Robbins GM, Jones M, et al. Multiplexed CRISPR/Cas9-mediated knockout of 19 Fanconi anemia pathway genes in zebrafish revealed their roles in growth, sexual development and fertility. PloS Genet. (2018) 14. doi: 10.1371/journal.pgen.1007821
35. Bartz SR, Zhang Z, Burchard J, Imakura M, Martin M, Palmieri A, et al. Small interfering RNA screens reveal enhanced cisplatin cytotoxicity in tumor cells having both BRCA network and TP53 disruptions. Mol Cell Biol. (2006) 26:9377–86. doi: 10.1128/MCB.01229-06
36. Knox RJ, Friedlos F, Lydall DA, Roberts JJ. Mechanism of cytotoxicity of anticancer platinum drugs - evidence that cis-diamminedichloroplatinum(II) and cis-diammine-(1, 1, -cyclobutanedicarboxylato)platinum(II) differ only in the kinetics of their interaction with DNA. Cancer Res. (1986) 46:1972–9.
37. Henkels KM, Turchi JJ. Induction of apoptosis in cisplatin-sensitive and -resistant human ovarian cancer cell lines. Cancer Res. (1997) 57:4488–92.
38. Gibb RK, Taylor DD, Wan T, Oconnor DM, Doering DL, GercelTaylor C. Apoptosis as a measure of chemosensitivity to cisplatin and taxol therapy in ovarian cancer cell lines. Gynecologic Oncol. (1997) 65:13–22. doi: 10.1006/gyno.1997.4637
39. Flick MB, O'Malley D, Rutherford T, Rodov S, Kamsteeg M, Hao XY, et al. Apoptosis-based evaluation of chemosensitivity in ovarian cancer patients. J Soc Gynecologic Invest. (2004) 11:252–9. doi: 10.1016/j.jsgi.2003.11.003
40. Deans AJ, West SC. DNA interstrand crosslink repair and cancer. Nat Rev Cancer. (2011) 11:467–80. doi: 10.1038/nrc3088
41. Gorodnova TV, Kotiv KB, Ivantsov AO, Mikheyeva ON, Mikhailiuk GI, Lisyanskaya AS, et al. Efficacy of neoadjuvant therapy with cisplatin plus mitomycin C in BRCA1-mutated ovarian cancer. Int J Gynecological Cancer. (2018) 28:1498–506. doi: 10.1097/IGC.0000000000001352
42. Moiseyenko VM, Chubenko VA, Moiseyenko FV, Zhabina AS, Gorodnova TV, Komarov YI, et al. Evidence for clinical efficacy of mitomycin C in heavily pretreated ovarian cancer patients carrying germ-line BRCA1 mutation. Med Oncol. (2014) 31:1–6. doi: 10.1007/s12032-014-0199-x
43. Gorodnova TV, Sokolenko AP, Kondratiev SV, Kotiv KB, Belyaev AM, Berlev IV, et al. Mitomycin C plus cisplatin for systemic treatment of recurrent BRCA1-associated ovarian cancer. Investigational New Drugs. (2020) 38:1872–8. doi: 10.1007/s10637-020-00965-8
44. Szklarczyk D, Franceschini A, Wyder S, Forslund K, Heller D, Huerta-Cepas J, et al. STRING v10: protein-protein interaction networks, integrated over the tree of life. Nucleic Acids Res. (2015) 43:D447–D52. doi: 10.1093/nar/gku1003
45. Wan L, Lou JM, Xia YS, Su B, Liu T, Cui JM, et al. hPrimpol1/CCDC111 is a human DNA primase-polymerase required for the maintenance of genome integrity. EMBO Rep. (2013) 14:1104–12. doi: 10.1038/embor.2013.159
46. Stordal B, Pavlakis N, Davey R. A systematic review of platinum and taxane resistance from bench to clinic: An inverse relationship. Cancer Treat Rev. (2007) 33:688–703. doi: 10.1016/j.ctrv.2007.07.013
47. Parmar MKB, Ledermann JA, Colombo N, du Bois A, Delaloye JF, Kristensen GB, et al. Paclitaxel plus platinum-based chemotherapy versus conventional platinum-based chemotherapy in women with relapsed ovarian cancer: the ICON4/AGO-OVAR-2.2 trial. Lancet. (2003) 361:2099–106. doi: 10.1016/S0140-6736(03)13718-X
48. Agarwal ML, Agarwal A, Taylor WR, Chernova O, Sharma Y, Stark GR. A p53-dependent S-phase checkpoint helps to protect cells from DNA damage in response to starvation for pyrimidine nucleotides. Proc Natl Acad Sci U S A. (1998) 95:14775–80. doi: 10.1073/pnas.95.25.14775
49. He GG, Kuang J, Khokhar AR, Siddik ZH. The impact of S- and G2-checkpoint response on the fidelity of G1-arrest by cisplatin and its comparison to a non-cross-resistant platinum(IV) analog. Gynecologic Oncol. (2011) 122:402–9. doi: 10.1016/j.ygyno.2011.04.034
50. Wang BJ, Li X, Zhao GN, Yan H, Dong PX, Watari H, et al. miR-203 inhibits ovarian tumor metastasis by targeting BIRC5 and attenuating the TGF beta pathway. J Exp Clin Cancer Res. (2018) 37:1–9. doi: 10.1186/s13046-018-0906-0
51. Beding AF, Larsson P, Helou K, Einbeigi Z, Parris TZ. Pan-cancer analysis identifies BIRC5 as a prognostic biomarker. BMC Cancer. (2022) 22:322. doi: 10.1186/s12885-022-09371-0
52. Nalepa G, Clapp DW. Fanconi anaemia and cancer: an intricate relationship. Nat Rev Cancer. (2018) 18:168–85. doi: 10.1038/nrc.2017.116
53. Thompson D, Easton DF, Breast Canc Linkage C. Cancer incidence in BRCA1 mutation carriers. Jnci-Journal Natl Cancer Institute. (2002) 94:1358–65. doi: 10.1093/jnci/94.18.1358
54. Ford D, Easton DF, Stratton M, Narod S, Goldgar D, Devilee P, et al. Genetic heterogeneity and penetrance analysis of the BRCA1 and BRCA2 genes in breast cancer families. Am J Hum Genet. (1998) 62:676–89. doi: 10.1086/301749
55. Birkbak NJ, Eklund AC, Li QY, McClelland SE, Endesfelder D, Tan P, et al. Paradoxical relationship between chromosomal instability and survival outcome in cancer. Cancer Res. (2011) 71:3447–52. doi: 10.1158/0008-5472.CAN-10-3667
56. Andor N, Graham TA, Jansen M, Xia LC, Aktipis CA, Petritsch C, et al. Pan-cancer analysis of the extent and consequences of intratumor heterogeneity. Nat Med. (2016) 22:105–+. doi: 10.1038/nm.3984
57. Takaya H, Nakai H, Sakai K, Nishio K, Murakami K, Mandai M, et al. Intratumor heterogeneity and homologous recombination deficiency of high-grade serous ovarian cancer are associated with prognosis and molecular subtype and change in treatment course. Gynecologic Oncol. (2020) 156:415–22. doi: 10.1016/j.ygyno.2019.11.013
Keywords: ovarian cancer, RFWD3, DNA repair, proliferation, migration
Citation: Taylor SJ, Hollis RL, Gourley C, Herrington CS, Langdon SP and Arends MJ (2024) RFWD3 modulates response to platinum chemotherapy and promotes cancer associated phenotypes in high grade serous ovarian cancer. Front. Oncol. 14:1389472. doi: 10.3389/fonc.2024.1389472
Received: 21 February 2024; Accepted: 10 April 2024;
Published: 22 April 2024.
Edited by:
Sumeet Nayak, KSQ Therapeutics, United StatesReviewed by:
Petar Ozretić, Rudjer Boskovic Institute, CroatiaCopyright © 2024 Taylor, Hollis, Gourley, Herrington, Langdon and Arends. This is an open-access article distributed under the terms of the Creative Commons Attribution License (CC BY). The use, distribution or reproduction in other forums is permitted, provided the original author(s) and the copyright owner(s) are credited and that the original publication in this journal is cited, in accordance with accepted academic practice. No use, distribution or reproduction is permitted which does not comply with these terms.
*Correspondence: Sarah J. Taylor, c2FyYWgudGF5bG9yLTJAZWQuYWMudWs=; Mark J. Arends, bS5hcmVuZHNAZWQuYWMudWs=
Disclaimer: All claims expressed in this article are solely those of the authors and do not necessarily represent those of their affiliated organizations, or those of the publisher, the editors and the reviewers. Any product that may be evaluated in this article or claim that may be made by its manufacturer is not guaranteed or endorsed by the publisher.
Research integrity at Frontiers
Learn more about the work of our research integrity team to safeguard the quality of each article we publish.