
95% of researchers rate our articles as excellent or good
Learn more about the work of our research integrity team to safeguard the quality of each article we publish.
Find out more
ORIGINAL RESEARCH article
Front. Oncol. , 20 September 2024
Sec. Cancer Metabolism
Volume 14 - 2024 | https://doi.org/10.3389/fonc.2024.1380679
This article is part of the Research Topic The Impact of Alkalizing the Acidic Tumor Microenvironment to Improve Efficacy of Cancer Treatment - Volume II View all 6 articles
 Yasumasa Kato*
 Kotori Mawatari
Background: The extracellular pH (pHe) is known to be acidic. We investigated the effect of mild (pHe 6.8) and severe (pHe 5.9) acidosis on gene expression in mouse B16-BL6 melanoma cells using cDNA microarray analysis and compared them with the acidic pHe dependence of human tumors.
Methods: B16-BL6 cells were treated with pHe 7.4 (control), pHe 6.8, and pHe 5.9. The mRNA expression was analyzed by using the cDNA microarray. Heat map, volcano plot, and gene ontology enrichment analysis were performed. The data were compared with the gene signatures of published data GSE52031 and GSE8401 and compared with the pathological staging by GEPIA2, and the prognostic signature of proteins was searched by the Human Protein Atlas database. If the acidic pHe-induced and -reduced genes were correlated with shortened and prolonged survival times, respectively, and also correlated with pathological staging, we defined it as “hit” and counted the sum of hit points of eight types of tumors such as breast, colorectal, prostate, gastric, liver, prostate, lung, and head and neck and melanoma.
Results: Gene expression was differentially and commonly regulated by both pHes. The number of genes upregulated fourfold or more at pHe 6.8 and 5.9 only for 25 and 131 genes, respectively, and 85 genes were common. The number of genes downregulated fourfold or less at pHe 6.8 and 5.9 only for 63 and 82 genes, respectively, and 118 genes were common. Compared with human mRNA expression data (GSE8401), there is no correlation with the overall pattern of the signature. In seven types of cancer (breast, colorectal, gastric, liver, prostate, lung, and head and neck) and melanoma, the relationship between acidic pHe-modulated gene expression and overall survival was evaluated. As a result, acidic pHe dependency contributing to prognosis was higher in colorectal, lung, and head and neck cancers and lower in prostate cancer.
Conclusion: Tumor classification based on response to extracellular acidic pHe will provide new insights into chemotherapy strategy for patients with tumors.
It is well known that the extracellular pH (pHe) in tumor tissue is acidic. Although the Warburg effect (aerobic glycolysis) is undoubtedly the major contributor to tumor extracellular acidity, CO2 from the pentose phosphate pathway (PPP) and carbonic anhydrases (CAs), especially CAIX, are also important causes (1). The buffering effect of tumor tissue fluid is weaker than that of normal tissue (2, 3). The acidity of the tumor tissue may contribute to this. Thus, the acidic pHe acts as a microenvironmental factor on the tumor cells in an autocrine/paracrine manner. In contrast to hypoxia, hypoxia-specific transcription factors such as hypoxia-inducible factor (HIF), the specific transcription factors, have not been identified, and some transcription factors that are common in cytokine signaling, e.g., nuclear factor-κB (NF-κB), have been reported (4–7). In addition, recent studies have shown that acidic pHe induces signal transducer and activator of transcription 1 (STAT1) (8), and peroxisome proliferator–activated receptor α (PPARα) (9).
Acidic pHe affects many cellular phenotypes such as epithelial–mesenchymal transition (EMT), angiogenesis, exosome secretion, invasion, and metastasis (10, 11). It has been suggested that acidic pHe broadly affects the expression of many genes directing more malignant phenotypes such as invasion and metastasis whose activity was well relevant to clinical cases (10–13). The chronic effect of acidosis has also been studied. Acidic pHe-adapted squamous cell carcinoma became a fibroblastic phenotype (EMT) and increased metastasis in vivo in the experimental metastasis model by injection into the tail vein of the mouse, even after several passages at pHe 7.4 (13). Adaptation to acidic pHe also altered fatty acid metabolism through sensitivity to PPARα (9).
Imaging technology has shown that the degree of the acidic pHe in tumors is not uniform throughout the tissue (14). The tumor cells face the different pH degree and respond differently for the degree such as mild (~pHe 6.8) and severe acidosis (<pHe 6.5). The study considered in this regard has been limited (11, 15, 16).
In this study, we performed cDNA microarray analysis of mouse B16-BL6 melanoma, which is resistant for the wide range of pHe degrees (4, 15, 17); the expression pattern of the genes induced/reduced by acidic pHe did not match the human metastatic melanoma signature, and more broad genes were affected. Through bioinformatics analysis, we found that the acidic pHe dependency of the tumors can be evaluated based on the correlation between acidic pHe-modulated gene expression of mouse B16-BL6 cells and patient prognosis. Details are given in the text.
Mouse B16-BL6 cells were kindly gifted from Dr. Kaoru Miyazaki (Yokohama City University, Japan) (17). Human cell lines consisting of melanoma (A2058 and A375C5), head and neck squamous cell carcinoma (HSC3, HSC4, and SAS), and lung cancer (A549, H1299, and HT1080) were obtained from the Japanese Collection of Research Bioresources Cell Bank (Osaka, Japan). They were cultured in a 1-to-1 mixture of Dulbecco’s modified Eagle’s medium (DMEM) (Life Technologies, Grand Island, NY, USA) and Ham’s F12 medium (Life Technologies) supplemented with 15 mM 4-(2-hydroxyethyl)-1- piperazine-ethanesulfonic acid (HEPES, pHe 7.4), 4 mM H3PO4 1.8 g/L NaHCO3, 100 units/mL penicillin G (Meiji, Tokyo, Japan), 0.1 mg/mL streptomycin sulfate (Meiji, Tokyo, Japan), and 10% fetal bovine serum (HyClone, South Logan, UT, USA) in a humidified atmosphere in a 5% CO2 incubator. The pHe of the medium was adjusted to pHe 7.4 and 6.8 with NaOH and to pHe 5.9 with HCl for B16-BL6 cells (17). For human cell lines, pHe 7.4, 6.8, 6.5, and 6.2 media were used. Cell viability at each pHe was determined using the cell counting kit-8 (CCK-8, Dojindo Laboratories, Kumamoto, Japan) according to the manufacturer’s protocol.
The data sets of GSE52031 (18) and GSE8401 (19) were downloaded from the Gene Expression Omnibus (GEO) database (https://www.ncbi.nlm.nih.gov/geo/). The volcano plots were analyzed using the web-based tool VolcaNoseR (https://huygens.science.uva.nl/VolcaNoseR2/) (20). Gene Ontology (GO) enrichment analysis was performed using the web-based online software the Gene Ontology Resource Powered by PANTHER (https://geneontology.org/) (21). Gene expression in each pathological stage was determined using web-based software GEPIA2 (http://gepia2.cancer-pku.cn/#index) (22), and the prognostic signature of proteins was searched using the Human Protein Atlas database (http://www.proteinatlas.org).
Confluent B16-BL6 cells were washed with Ca2+- and Mg2+-free phosphate-buffered saline (PBS(-)) and preincubated with serum-free DMEM/F12 (pHe 7.4) for overnight. They were treated with serum-free DMEM/F12 at pHe 7.4 as a control, pHe 6.8 and pHe 5.9 for B16-BL6 cells for 24 h (17). Total RNA from quadruplicate cultures was extracted with Isogen (Nippon gene, Tokyo, Japan) and subjected to the cDNA microarray analysis (4). A whole mouse genome microarray 4 × 44K (Agilent Technologies Inc., Santa Clara, CA, USA) was used, and cDNA microarray analysis using the two-color method (pHe 7.4 sample as the control was labeled with Cy3 (cyanine 3) and acidic pHe (6.8 or 5.9)-treated samples were labeled with Cy5) was performed by DNA Chip Research Inc. (Tokyo, Japan). The acidic pHe-modulated genes were selected by a fold change difference of 2 or more when up- or downregulated against pHe 7.4.
Human tumor cell lines that reached confluence were pretreated as described above, further treating cells with pHe 7.4 as a control, pHe 6.8, pHe 6.5, and pHe 6.2 for 24 h. Total RNA from triplicate cultures was extracted with Isogen and subjected to the reverse transcription-quantitative polymerase chain reaction (RT-qPCR), as described below.
Total RNA was extracted with Isogen and reverse-transcribed to cDNA using a High-Capacity cDNA Reverse Transcription Kit (Thermo Fisher Scientific, Waltham, MA, USA). Target genes were amplified by GoTaq® qPCR and RT-qPCR Systems (Promega, Madison, WI, USA) using the specific primers listed in Supplementary Table S1. The level of expression of each target gene was normalized relative to the level of ACTB mRNA in the same samples.
We focused on the top 100 genes induced or reduced at acidic pHe (pHe 6.8 and pHe 5.9), respectively. If the acidic pHe-induced and -inhibited genes were correlated with shortened and prolonged survival time, respectively, we defined it as “hit” and counted the sum of hits of eight types of tumors, including the reversal case within 20%. The expression status of genes with a hit rate of 50% or more was also determined for correlation with staging.
Simple comparison of the mRNA expression between two groups [pHe 7.4 versus acid pHe (6.8 or 5.9)] in the cDNA microarray analysis was determined by Student’s t-test. Further statistical significance of the web-based analysis was provided by the output. Significance of multiple comparisons was determined by Student’s t-test with Bonferroni’s multiple significance test correction and further confirmed by one-way analysis of variance (ANOVA) with post hoc Tukey’s honestly significant difference (HSD) test (https://astatsa.com/OneWay_Anova_with_TukeyHSD/). A 2 × 2 contingency was determined by chi-squared test. A p-value less than 0.05 was considered statistically significant. A p-value of less than 0.05 was considered statistically significant.
As shown previously, mouse B16 cells are extremely resistant to acidic pHe (Supplementary Figure S1) (4, 15, 17). We focused on the gene expression signature of acidic pHe-treated B16-BL6 cells at two different pHe levels, such as pHe 6.8 as mild acidosis and pHe 5.9 (optimal pH for matrix metalloproteinase 9 (type IV collagenase, gelatinase B, MMP9) induction (15) contributing to tumor metastasis) as severe acidosis. The heat map visualized that the gene expression affected many genes, that some genes have the same signature between pHe 6.8 and 5.9, and that some other genes are independently regulated (Figure 1A). The number of genes upregulated fourfold or more only at pHe 6.8 and 5.9 only for 25 and 131 genes, respectively, and the number of induced genes in both pHes together was 85 genes (Figure 1B). The number of genes downregulated fourfold or less at pHe 6.8 and 5.9 alone for 63 and 82 genes, respectively, and the number of genes downregulated in both pHes together was 118 genes (Figure 1C). When the numbers were counted in the case of twofold or higher, there were 430 and 480 genes at pHe 6.8 and 5.9 alone, respectively, and 842 genes common in both (Figure 1D); for twofold or less, there were 408 and 404 genes at pHe 6.8 and 5.9 alone, respectively, and 786 genes were common to both (Figure 1E). The representative top five genes are as follows: ≥4 at pHe 6.8 only, Tlcd1, S100a4, Tbc1d4, Aqp4, Cnnm1; ≥4 at both pHes: Txnip, Otor, Myom1, Hrc, Chst13; ≥4 at pHe 5.9 only: Mmp9, Lincr, Ache, Jsrp1, Angpt2; ≤4 at pHe 6.8 only: Atf4, Slc6a9, Atf5, Slc18a1, Il17rc; ≤4 at both pHes: Prkg2, Tfrc, Fgf21, Zeb1, Hs3st1; ≤4 at pHe 5.9 only: Cspp1, F11r, Trim27, Masp1, Armet (Figure 1F). The volcano plot showed that two degrees of acidic pHe significantly affected mRNA expression and the difference of acidic pHe degree independently affected some gene expressions (Figure 2).
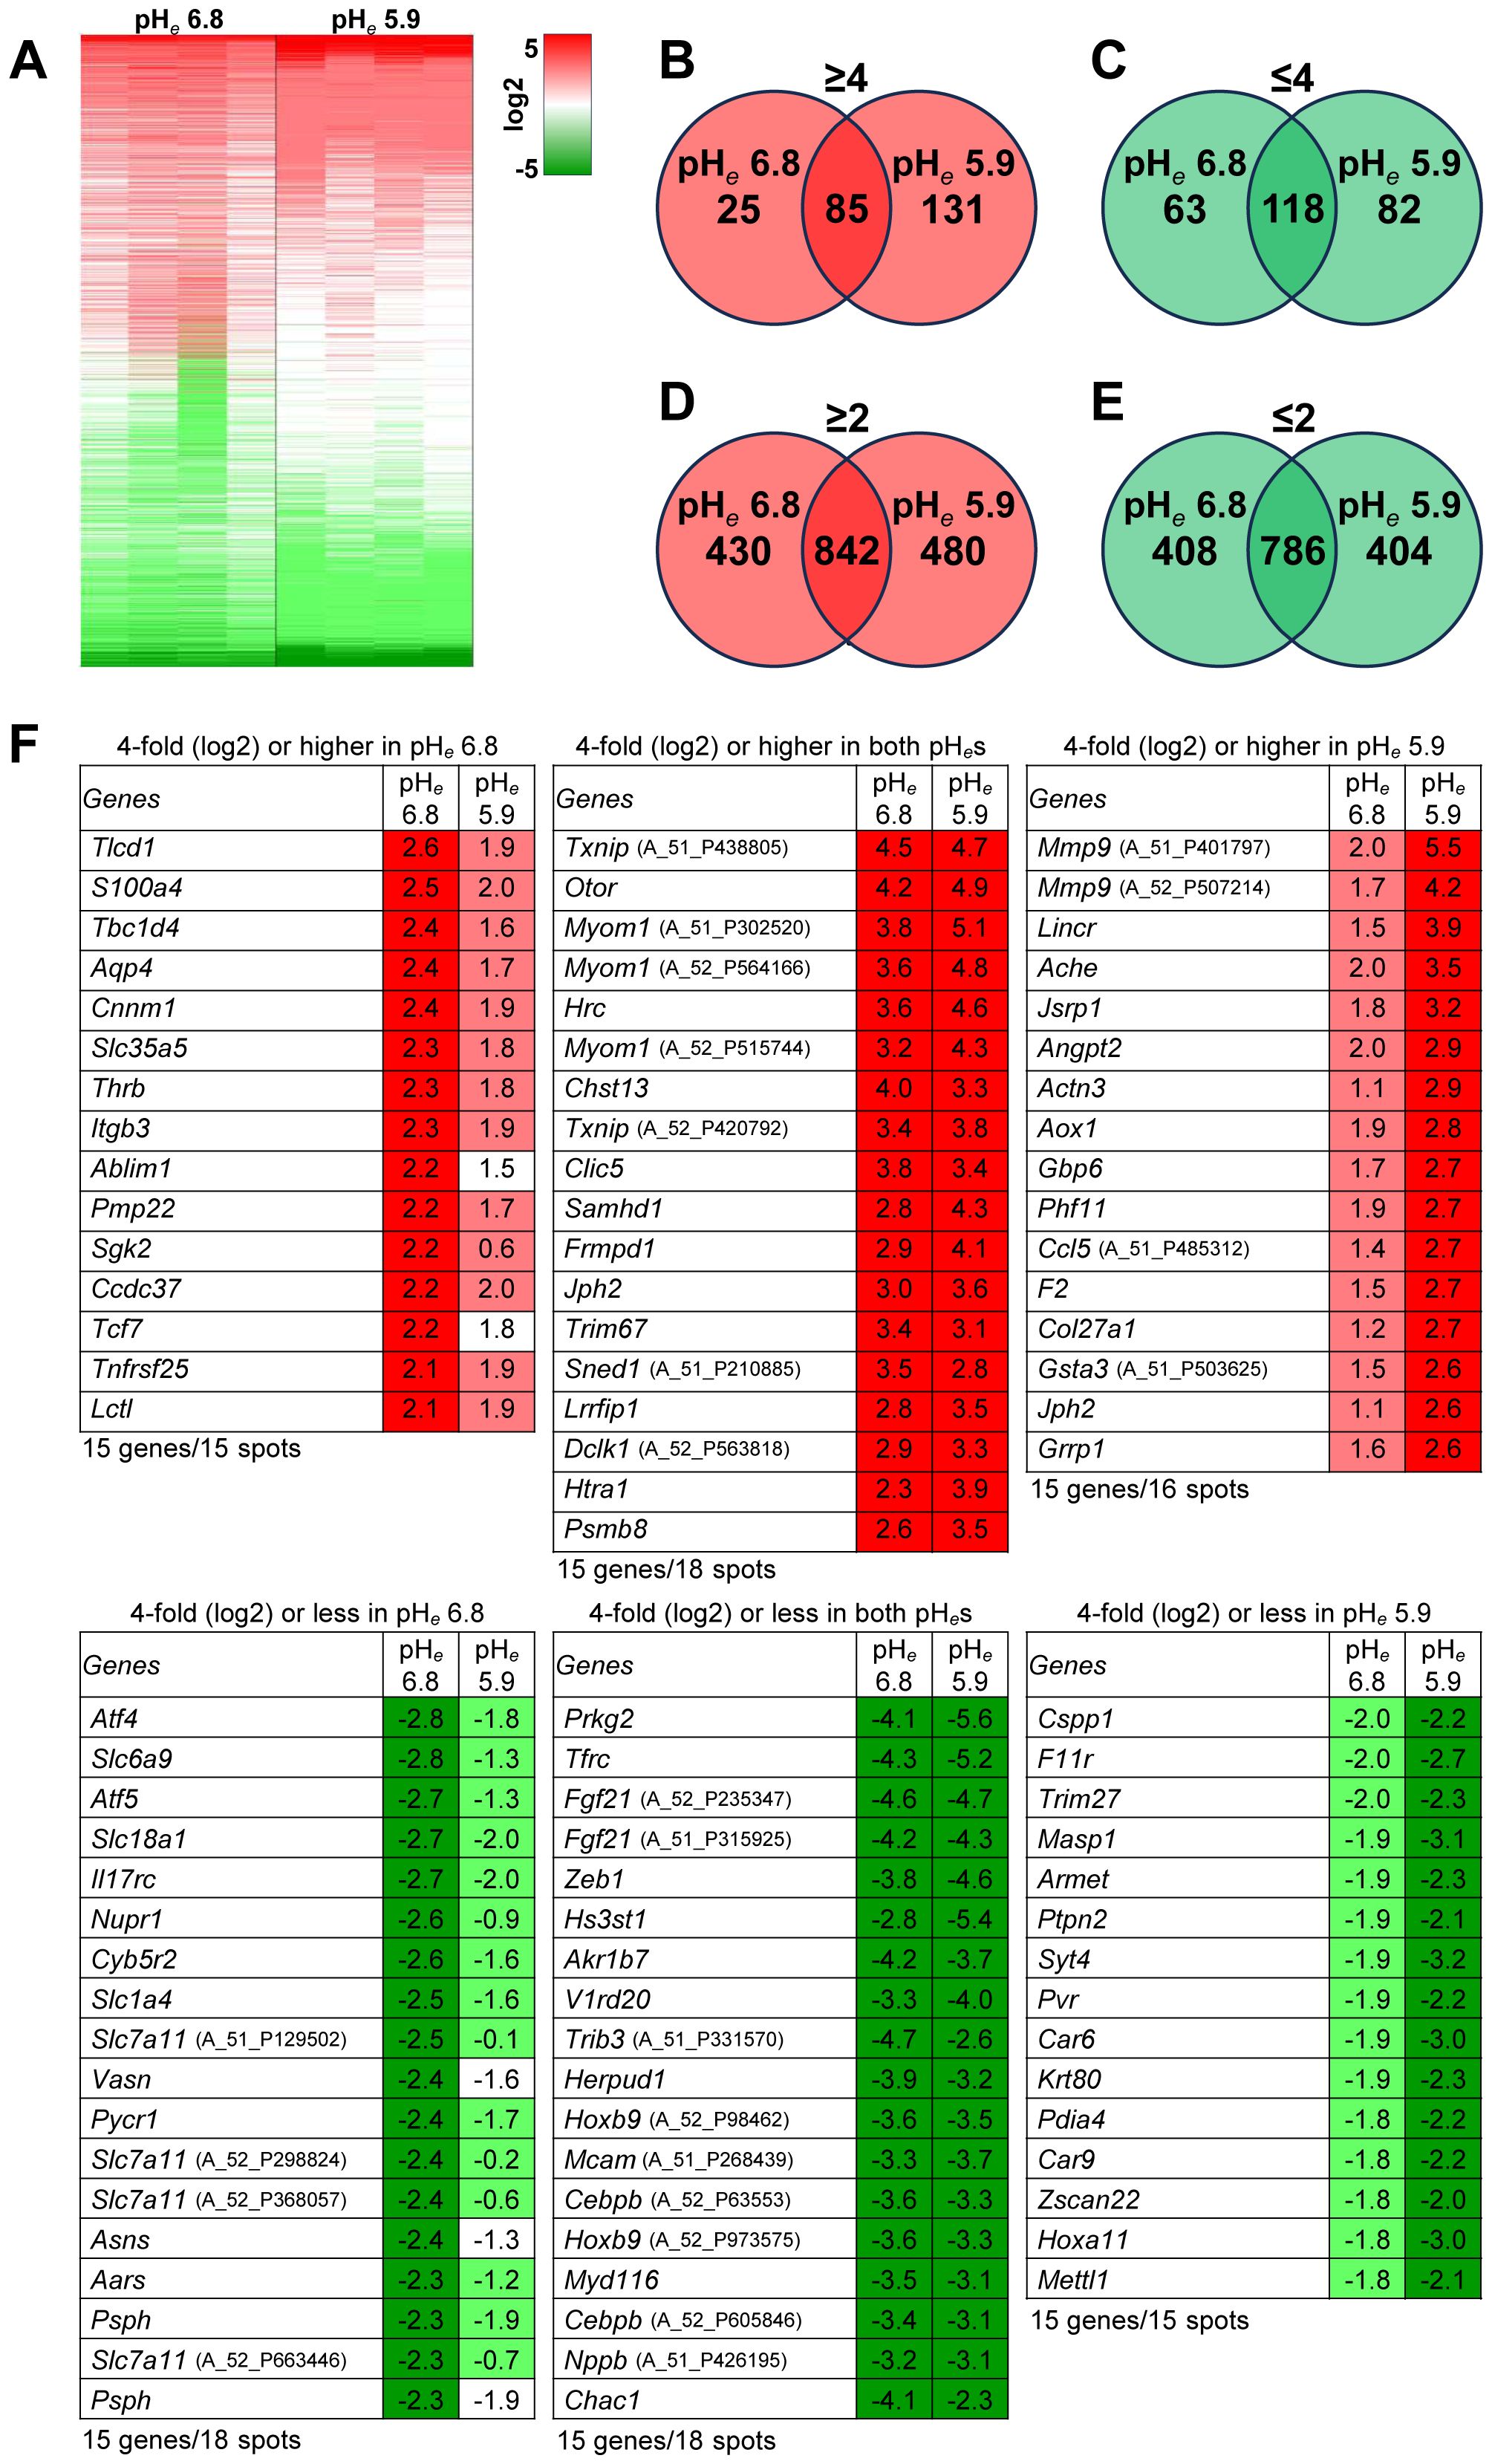
Figure 1. Acidic pHe modulates gene expression. (A) Heat map; number of genes expressed: ≥4-fold (B), ≤4-fold (C), ≥2-fold (D), or ≤2-fold (E) (n=4). (F) The top 15 genes from each panel (B, C) were listed. The cDNA microarray data (GSE276124) is available on September 9, 2024.
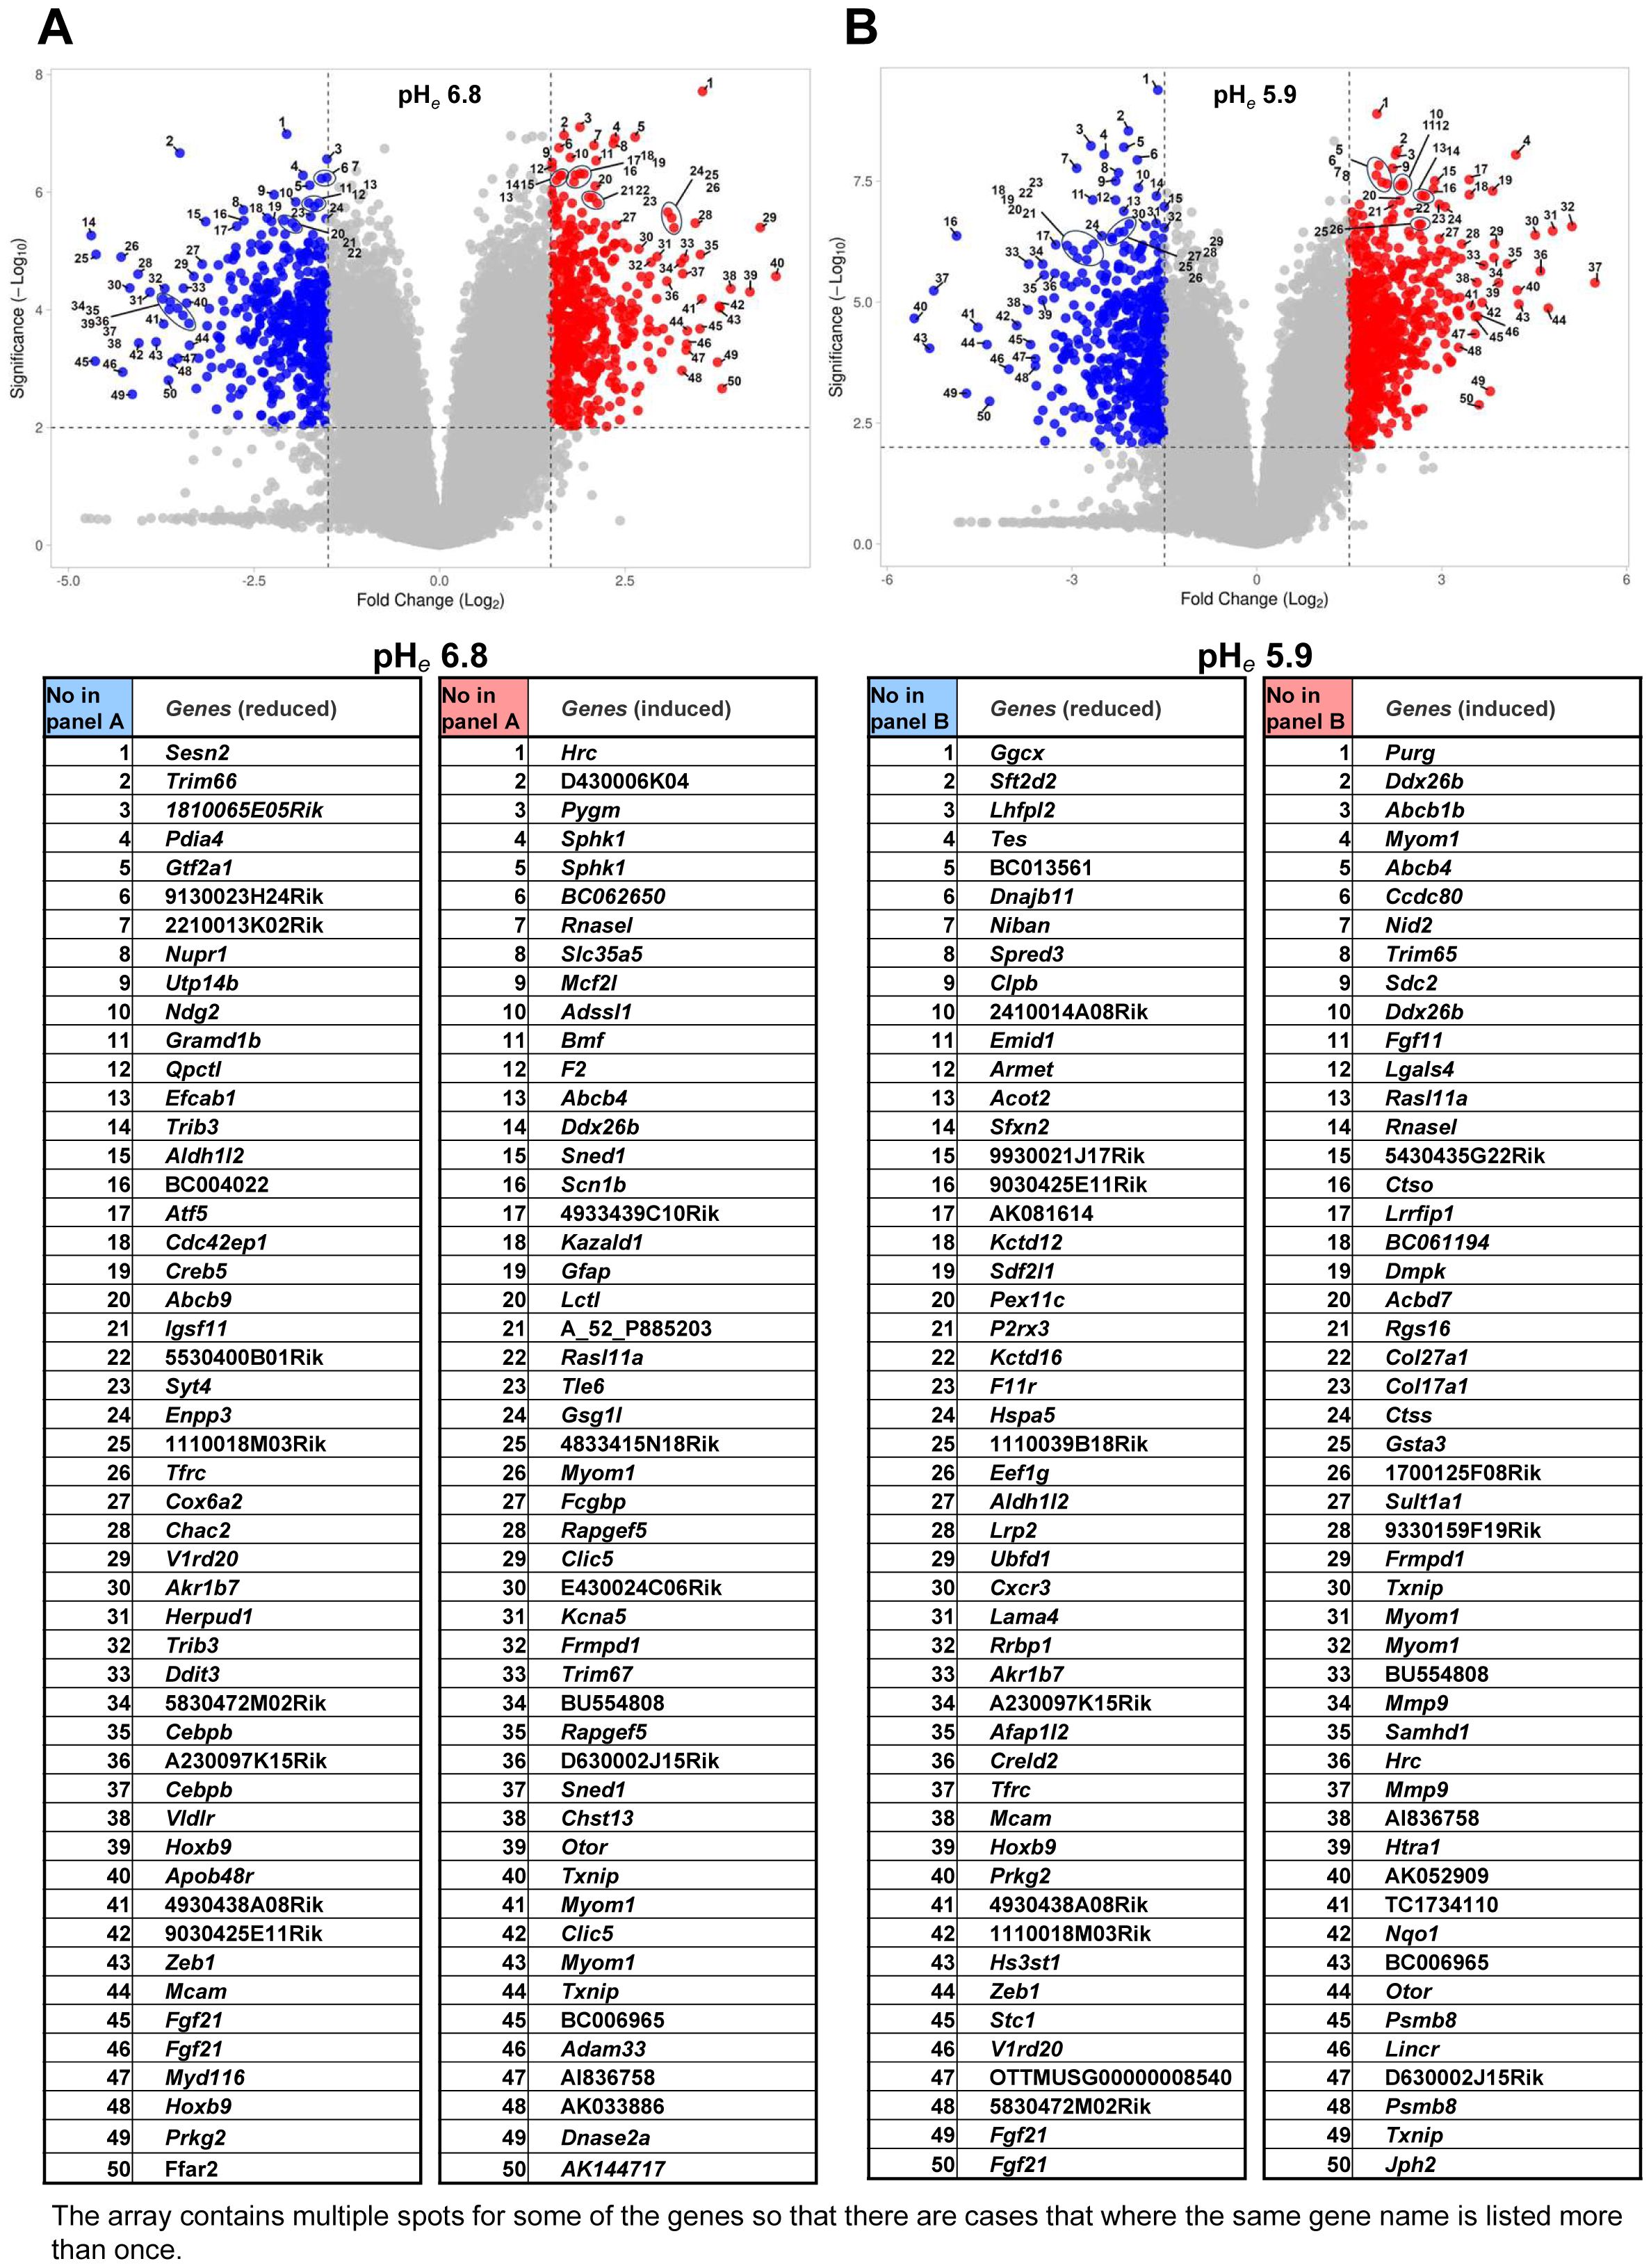
Figure 2. Volcano plots of acidic pHe-modulated gene expression. The 50 genes were numbered in the volcano plots are compatible with the following lists. (A) pHe 6.8 versus pHe 7.4; (B) pHe 5.9 versus pHe 7.4.
Gene ontology analysis revealed the effect of mild and severe acidosis, which independently and jointly affected the cells (Figure 3, Supplementary Tables S2, S3). In the GO biological process, the genes induced by pHe 5.9 were mainly enriched in GO:2000367 (regulation of acrosomal vesicle exocytosis) and GO:0018916 (nitrobenzene metabolic process), followed by GO:0070458 (cellular detoxification of nitrogen compound) and GO:0051410 (detoxification of nitrogen compound) (Figure 3A). In the latter two categories, the genes induced by pHe 6.8 were also commonly enriched. The enrichment in GO:0046929 (negative regulation of neurotransmitter secretion) was only observed at pHe 6.8. On the contrary, the genes reduced at pHe 6.8 were enriched in GO:0006564 (L-serine biosynthetic process), GO:0048200 (Golgi transport vesicle coating), GO:0048205 (COPI (a coatomer, a protein complex) coating of Golgi vesicle), followed by GO:0009820 (alkaloid metabolic process) and GO:1990440 (positive regulation of transcription from the RNA polymerase II promoter in response to endoplasmic reticulum stress). Enrichment of the latter two categories was also observed at pHe 5.9. In the GO cellular component section, the genes induced by pHe 5.9 were only frequently enriched in GO:0008305 (integrin complex) and GO:0016529 (sarcoplasmic reticulum) and commonly enriched with pHe 6.8 in GO:0005604 (basement membrane) and GO:0030018 (Z disc) (Figure 3B). Integrin activity plays an important role in the metastatic process. Therefore, it is reasonable to understand that acidic pH affects metastatic behavior. The genes reduced by both pHes were commonly enriched in GO:0034663 (endoplasmic reticulum chaperone complex) and GO:0005790 (smooth endoplasmic reticulum). In the GO molecular function section, the genes induced by pHe 6.8 and pHe 5.9 were independently enriched in GO:0043295 (glutathione binding) and GO:0005231 (excitatory extracellular ligand-gated monoatomic ion channel activity) respectively (Figure 3C). The genes that were reduced at pHe 5.9 were only enriched in GO:0015036 (disulfide oxidoreductase activity). Interestingly, the genes reduced by pHe 6.8 were broadly enriched: e.g., GO:0003756 (protein disulfide isomerase activity) and GO:0016864 (intramolecular oxidoreductase activity, transposing S-S bonds). Overall, the induced genes were enriched at pHe 5.9 and the reduced genes were enriched at pHe 6.8.
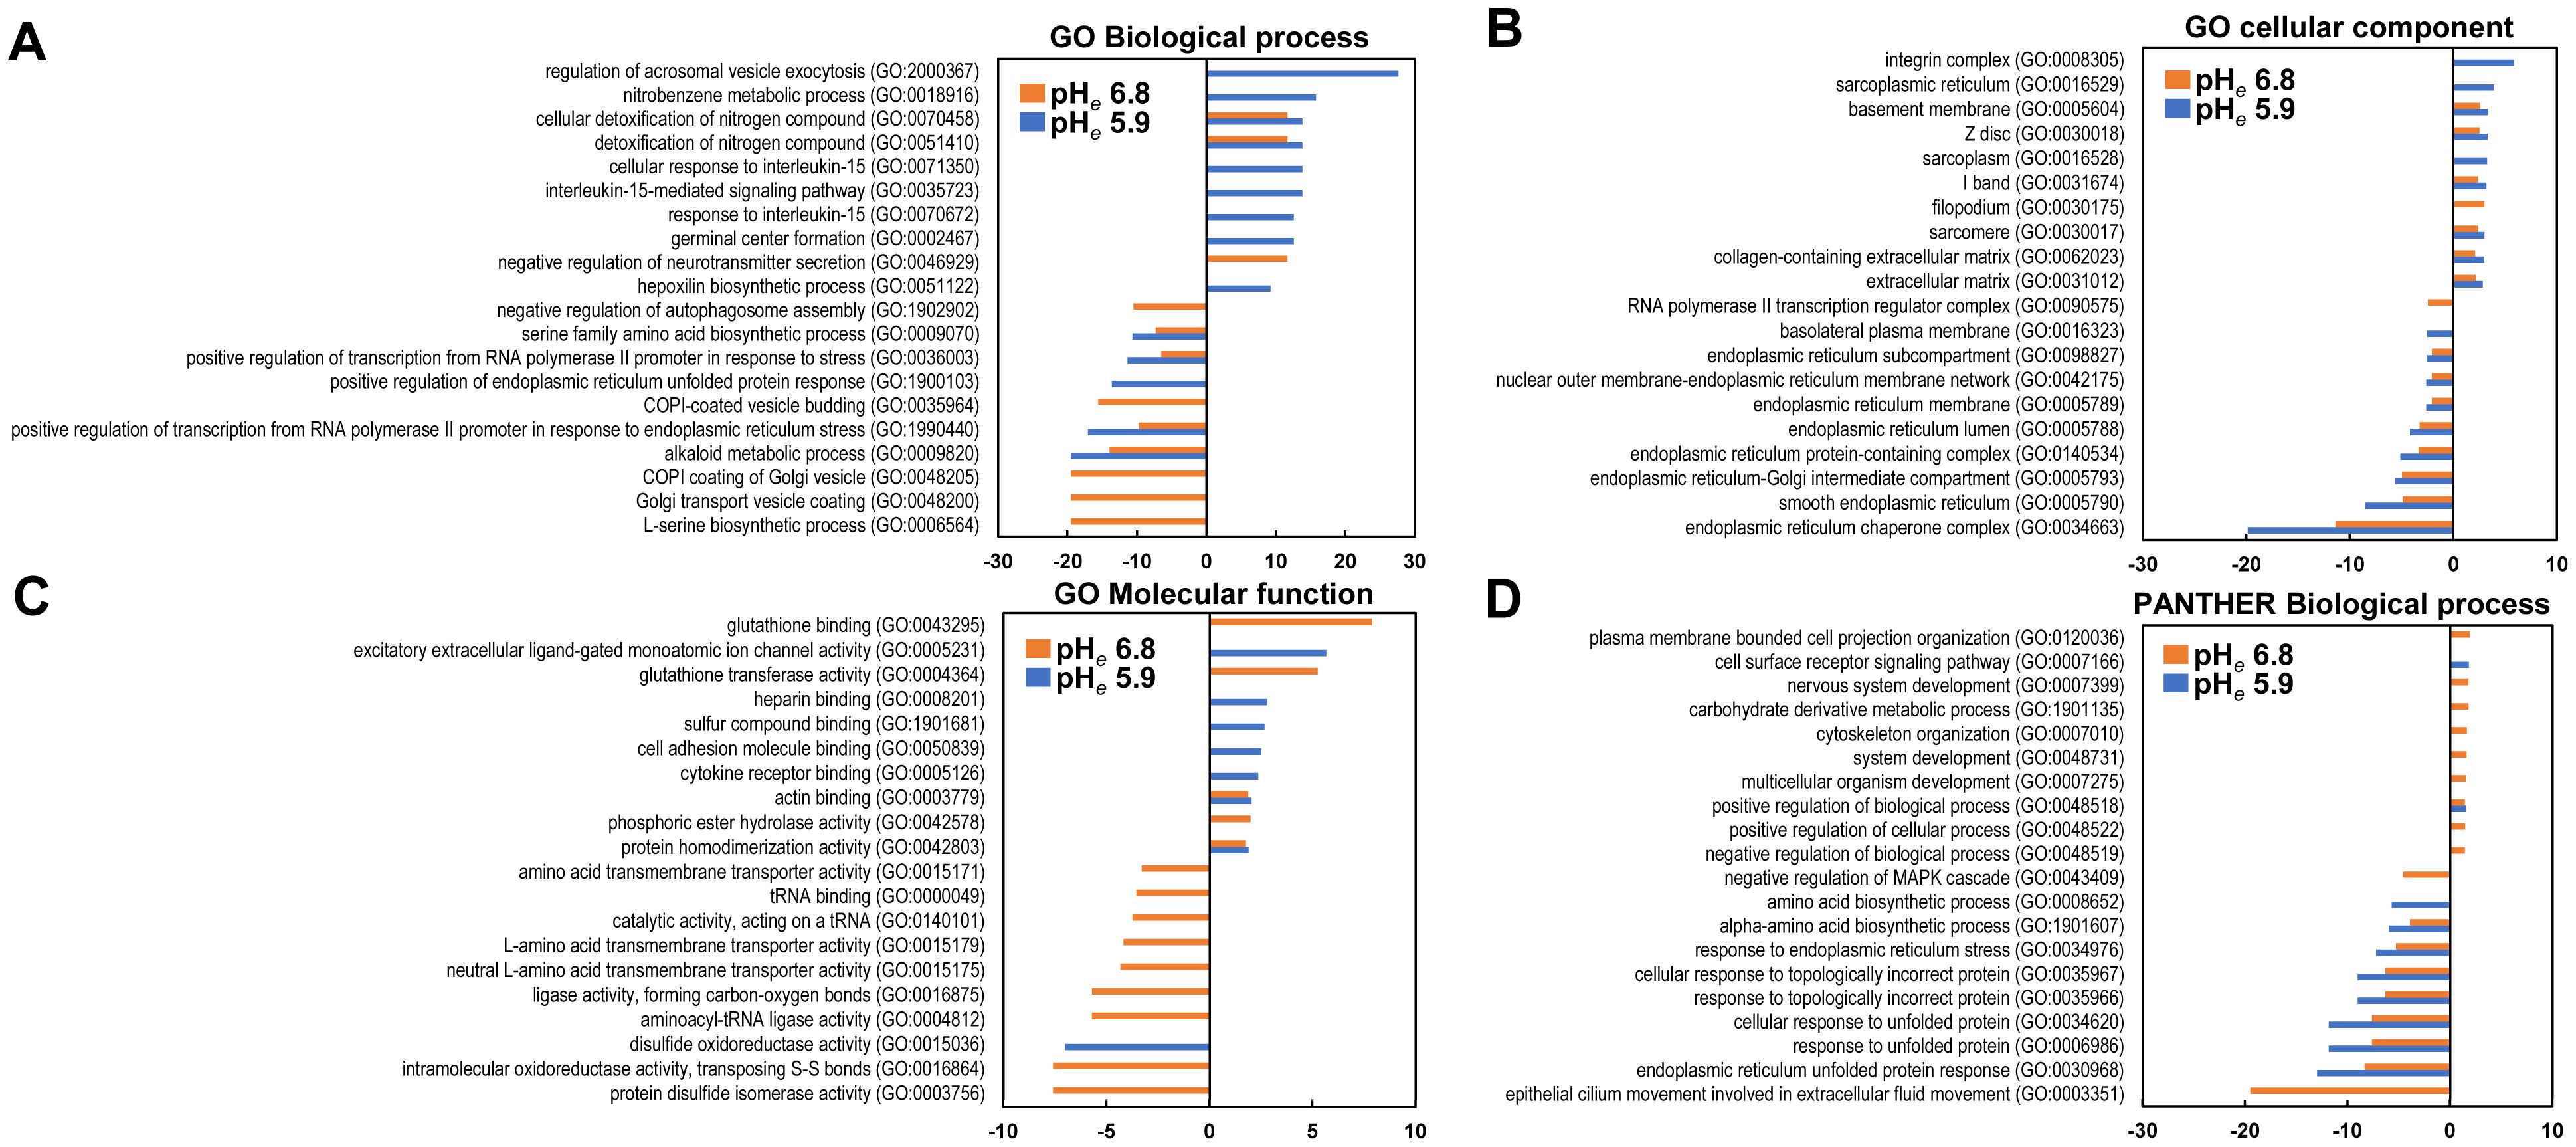
Figure 3. Gene ontology analysis. The top items are listed in each category as up- or downregulated genes. (A) GO Biological Process; (B) Cellular Components; (C) GO Molecular Function; (D) PANTHER Molecular Function. The enrichment of induced and reduced genes is shown on the plus and minus axis, respectively.
In the PANTHER ontology, there was no enrichment of more than two enrichment values in the induced gene in one or both conditions in the biological process analysis (Figure 3D). The enrichment score was low but broad in the other ontology category (Supplementary Tables S2, S3). Thus, acidic pHe also affects gene expression and contributes to a wide range of cellular functions.
We then compared with the modulation of gene expression by acidic pHe with the genes in the spontaneous mouse melanoma established by a tamoxifen-driven B-RAF/PTEN (18). High-expression genes in metastatic tumor cells (Mets) were induced by either pHe 6.8 or pHe 7.4, but low-expression genes in Mets were not often modulated by acidic pHes. In the circulating tumor cells (CTC), the majority of both acidic pHe-induced genes were distributed in low-expression genes in CTC versus primary, that is, inversely correlated; these similarly tended to be with the reduced genes in CTC less than Mets (Table 1).

Table 1. Acidic pHe-modulated genes compared with the spontaneous mouse melanoma established by a tamoxifen-driven B-RAF/PTEN (18).
We compared with the distribution of gene expression modulated in Mets. Unexpectedly, the distribution of gene expression at both acidic pHes was not correlated with melanomas in spontaneous mouse models (Figures 4A–C) and human clinical samples (Figures 4D–F). Because the modulation of gene expression was seen throughout, we speculated that acidic pHe-modulated genes that appeared in this study are common throughout the tumor origin.
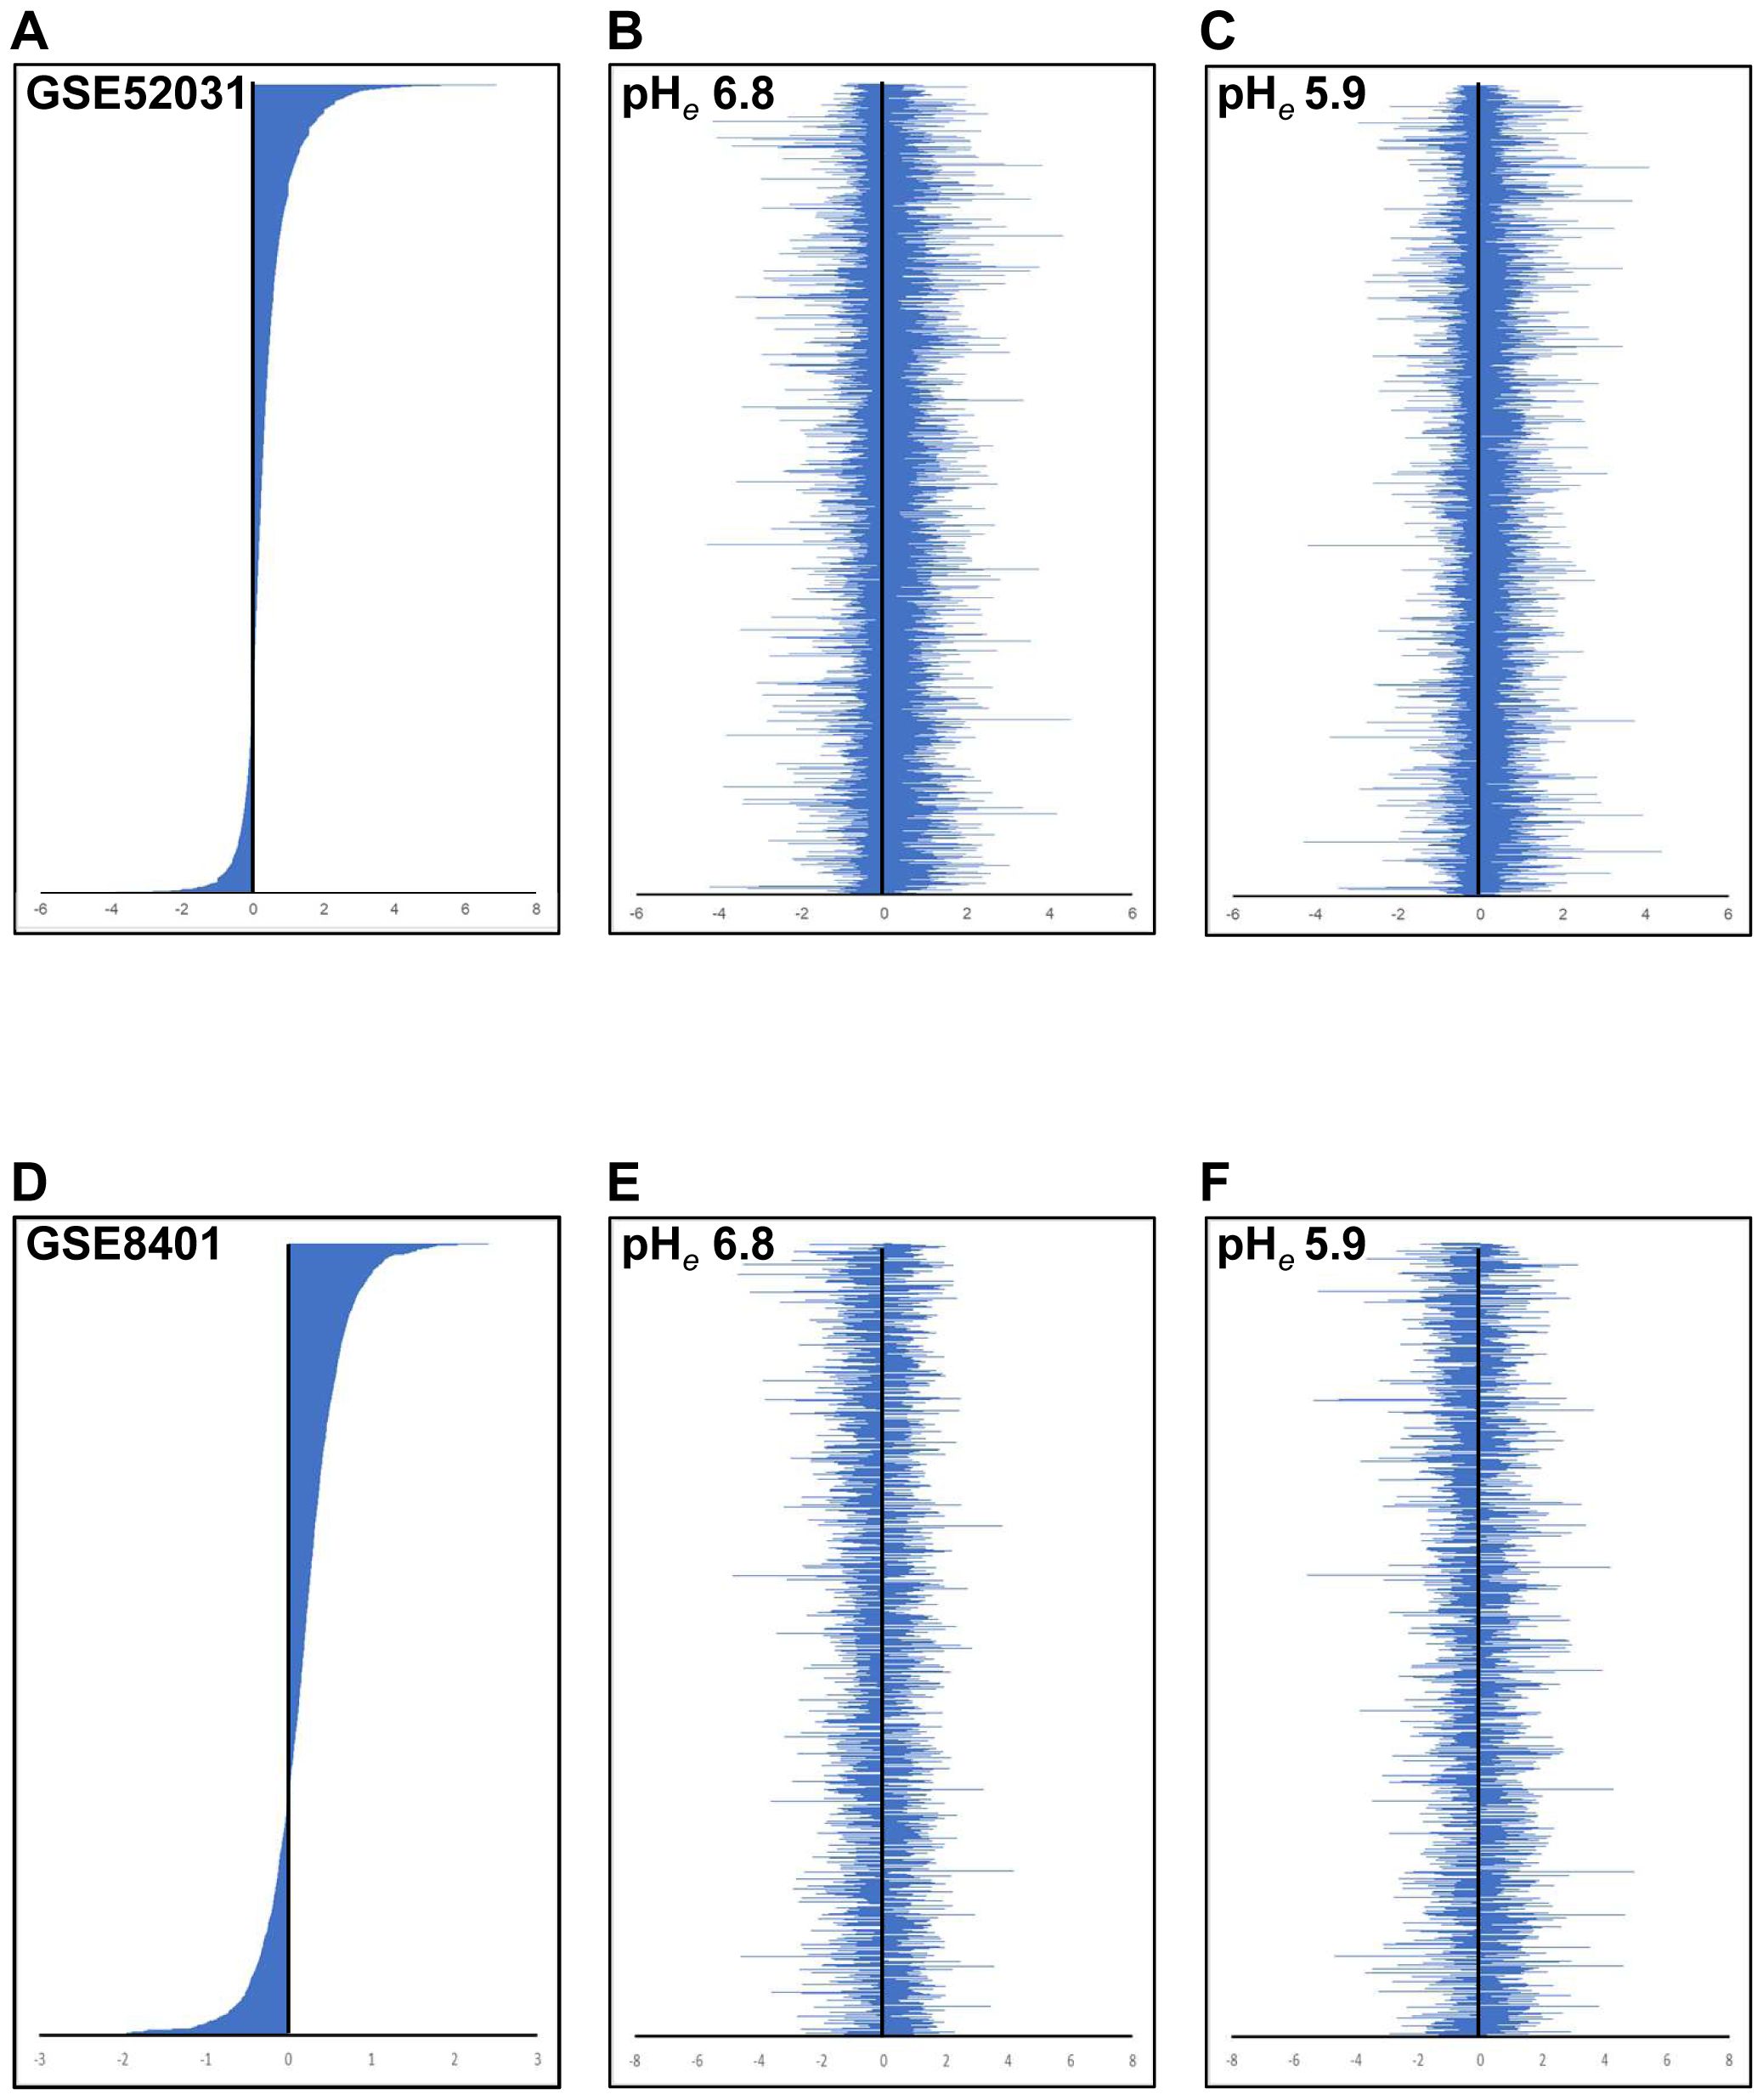
Figure 4. Comparison of expression signature between public data and acidic pHe-altered gene expression. The gene expression signature of GSE52031 (A) and GSE8401 (B) is shown in descending order. The acidic pHe-modulated gene expression signature was shown [(B, E) for pHe 6.8; (C, F) for pHe 5.9]. The order of genes in (B, C) was listed as the same as (A), and in (E, F) as the same as (D).
To confirm the role of acidic pHe-induced genes in the tumor progression, we evaluated whether the acidic pHe-induced genes were correlated with pathological staging. Figure 5 shows that PRRX2 gene expression was high in the late stage of 4/7 tumors followed by MMD and GADD45B (2/7 tumors). Thus, the correlation of the acidic pHe-induced gene expression with pathological stages in seven tumors is limited, and overall, the majority of the acidic pHe-induced gene expression was not correlated with the pathological staging of the patients.
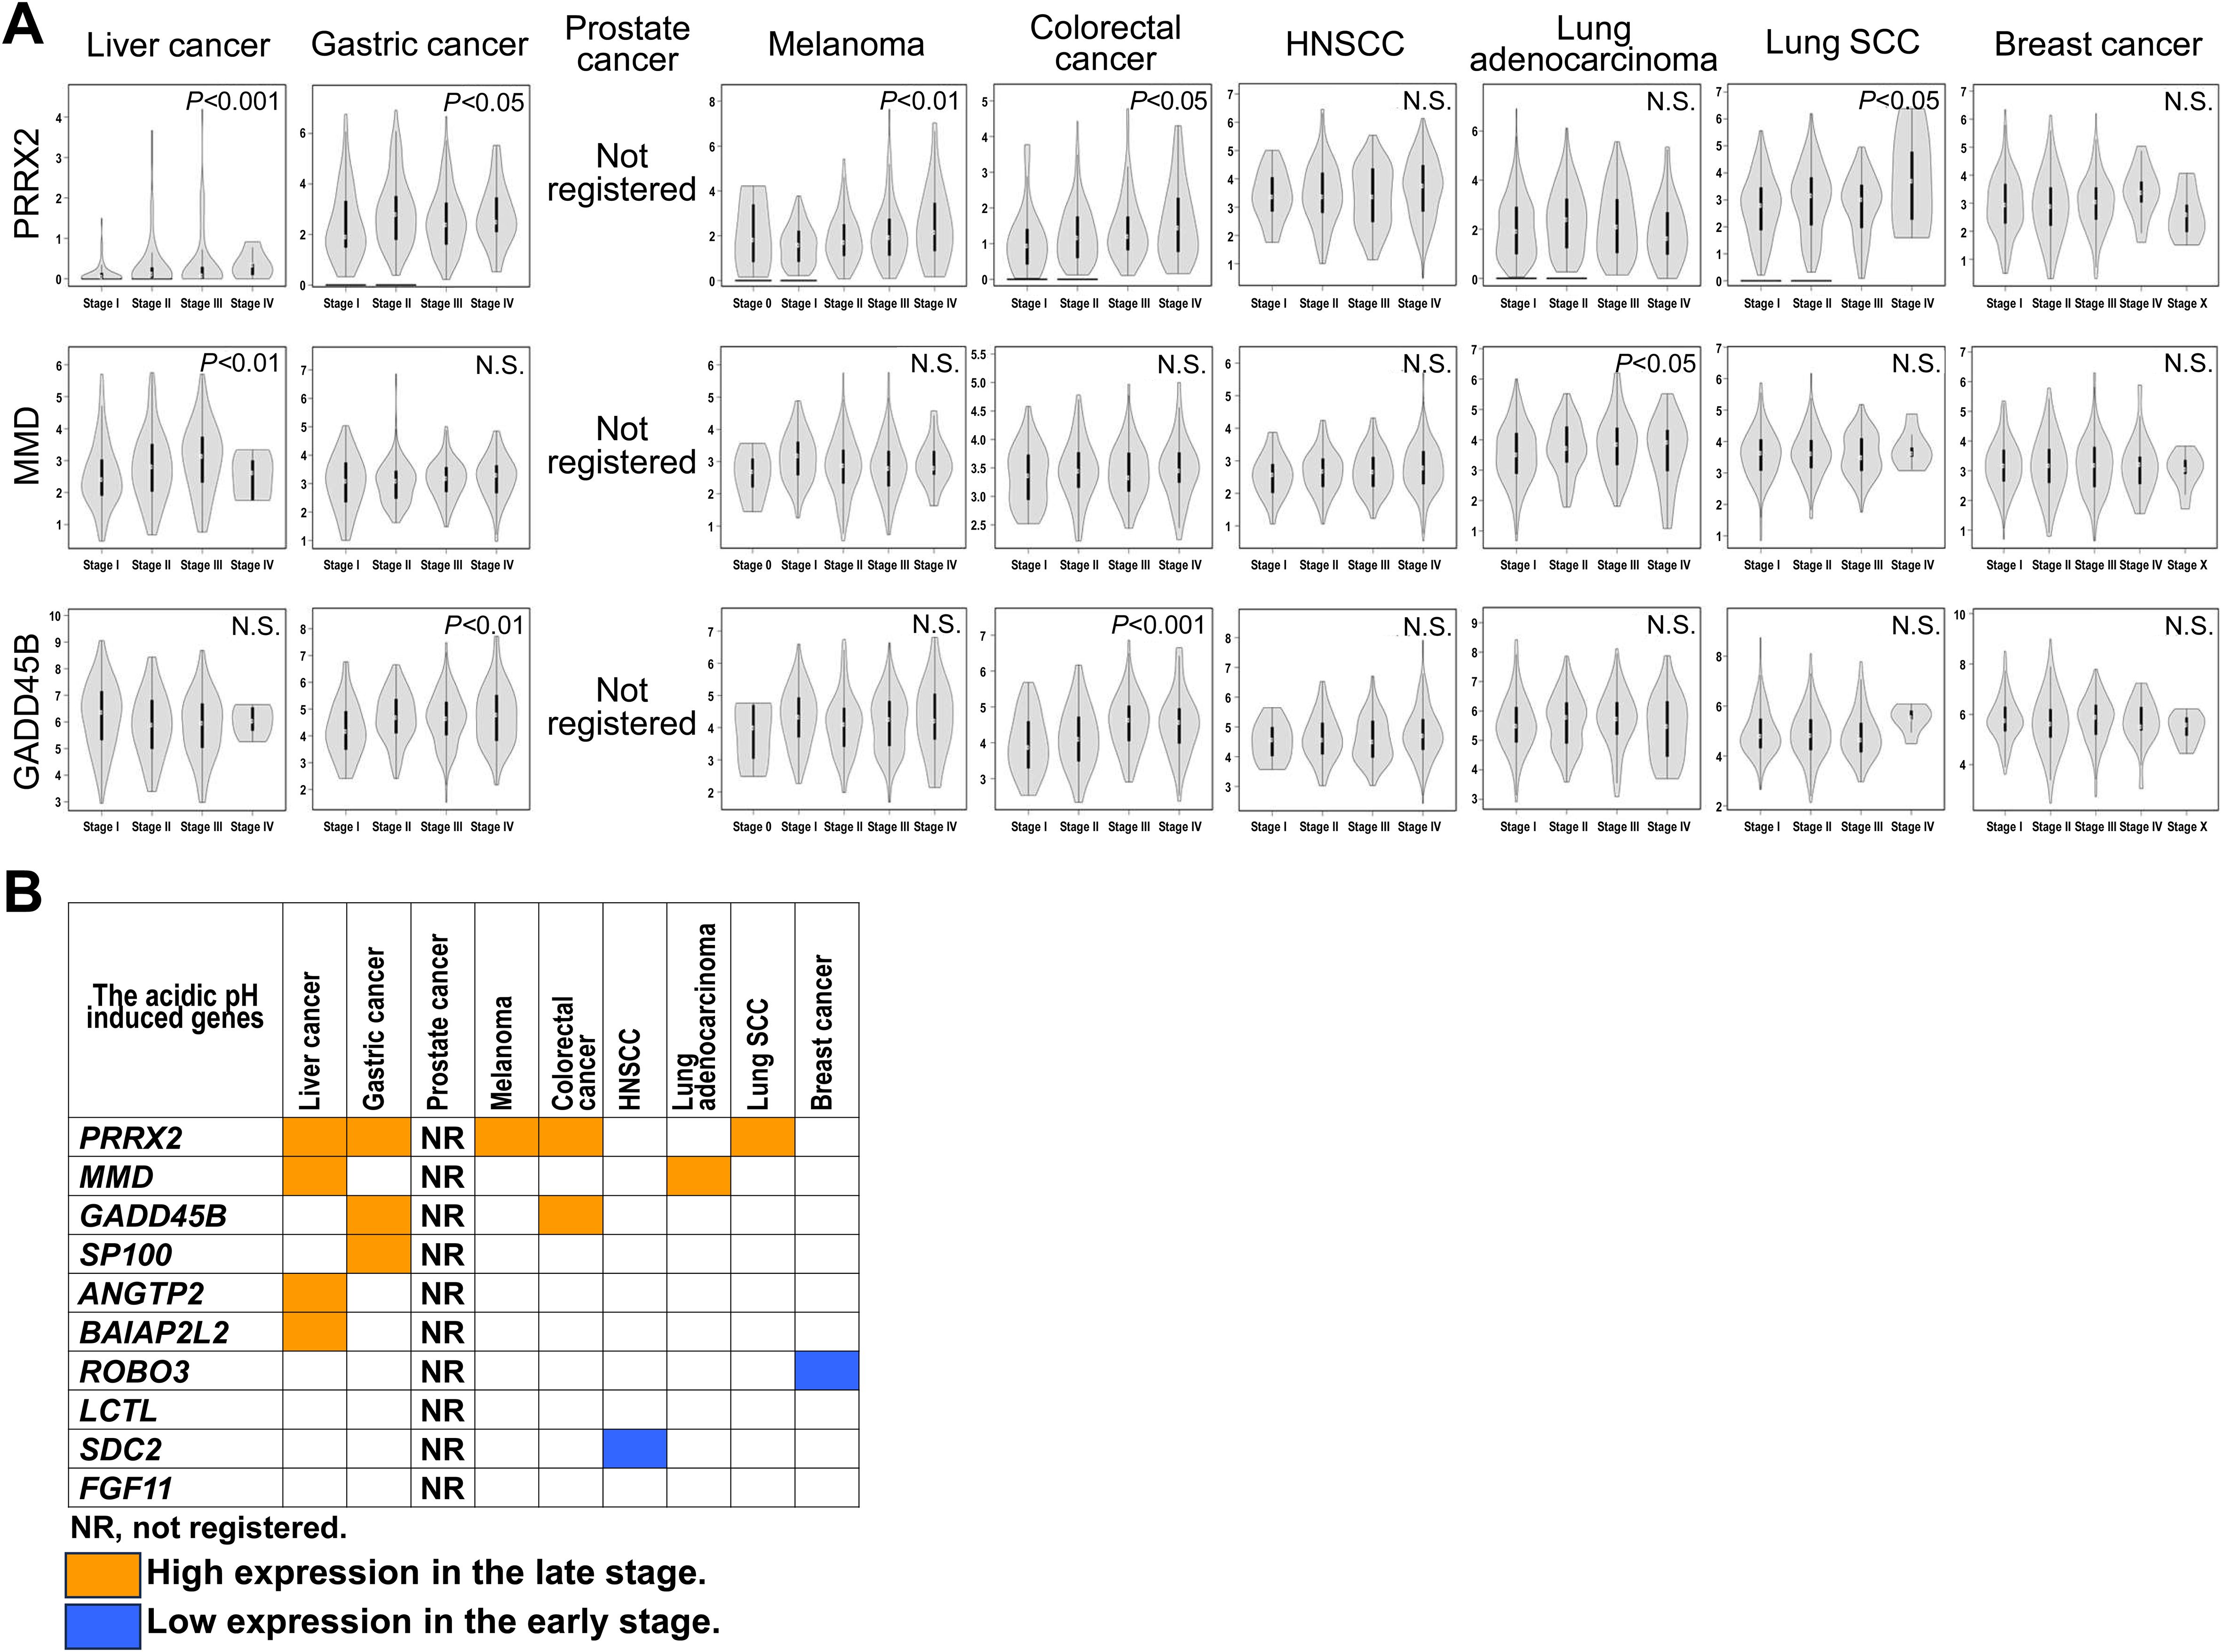
Figure 5. Correlation of acidic pHe modulating genes with pathological stage of the patients. (A) The violin graph of pathological stages in the three representative genes. (B) Summary of the correlation.
Next, we focused on 100 genes that were modulated by acidic pHe to correlate with the patent survival using the Protein Atlas database. Figure 6 shows the five representative genes each in the induced (A) and reduced (B) by the acidic pHe in eight kinds of human tumors including melanoma. In Figures 6C, D, the summarized data represent the acidic pHe-induced genes showing shorter survival and the acidic pHe-reduced showing longer survival, which were defined as the “hit”. Interestingly, among eight neoplasms, the hit number of melanoma did not have the highest frequency. The hit numbers were lowest in prostate cancer and highest in colorectal cancer, lung cancer, and HNSCC. The acidic pHe-induced genes are dominant in gastric and liver cancers, and the acidic pHe-reduced genes are rather dominant in the breast cancer. Thus, both gastric and liver cancers could be categorized as the acidic pHe-induced type and breast cancer as the acidic pHe-reduced type. Finally, we validated that the acidic pH-responsive signature of B16-BL6 is suitable for evaluating the tumor acidic pH dependency for prognosis; several tumor cell lines are tested for the acidic pH response (Supplementary Figure S2). All cell lines respond to acidic pH, but the positive or negative responses are different. At least in the present study, the acidic pHe-modulated gene list of B16-BL6 cells was suggested to be useful for evaluating the acidic pHe dependency. This is the first report that provides new insights into the assessment of acidic pH dependency of tumors.
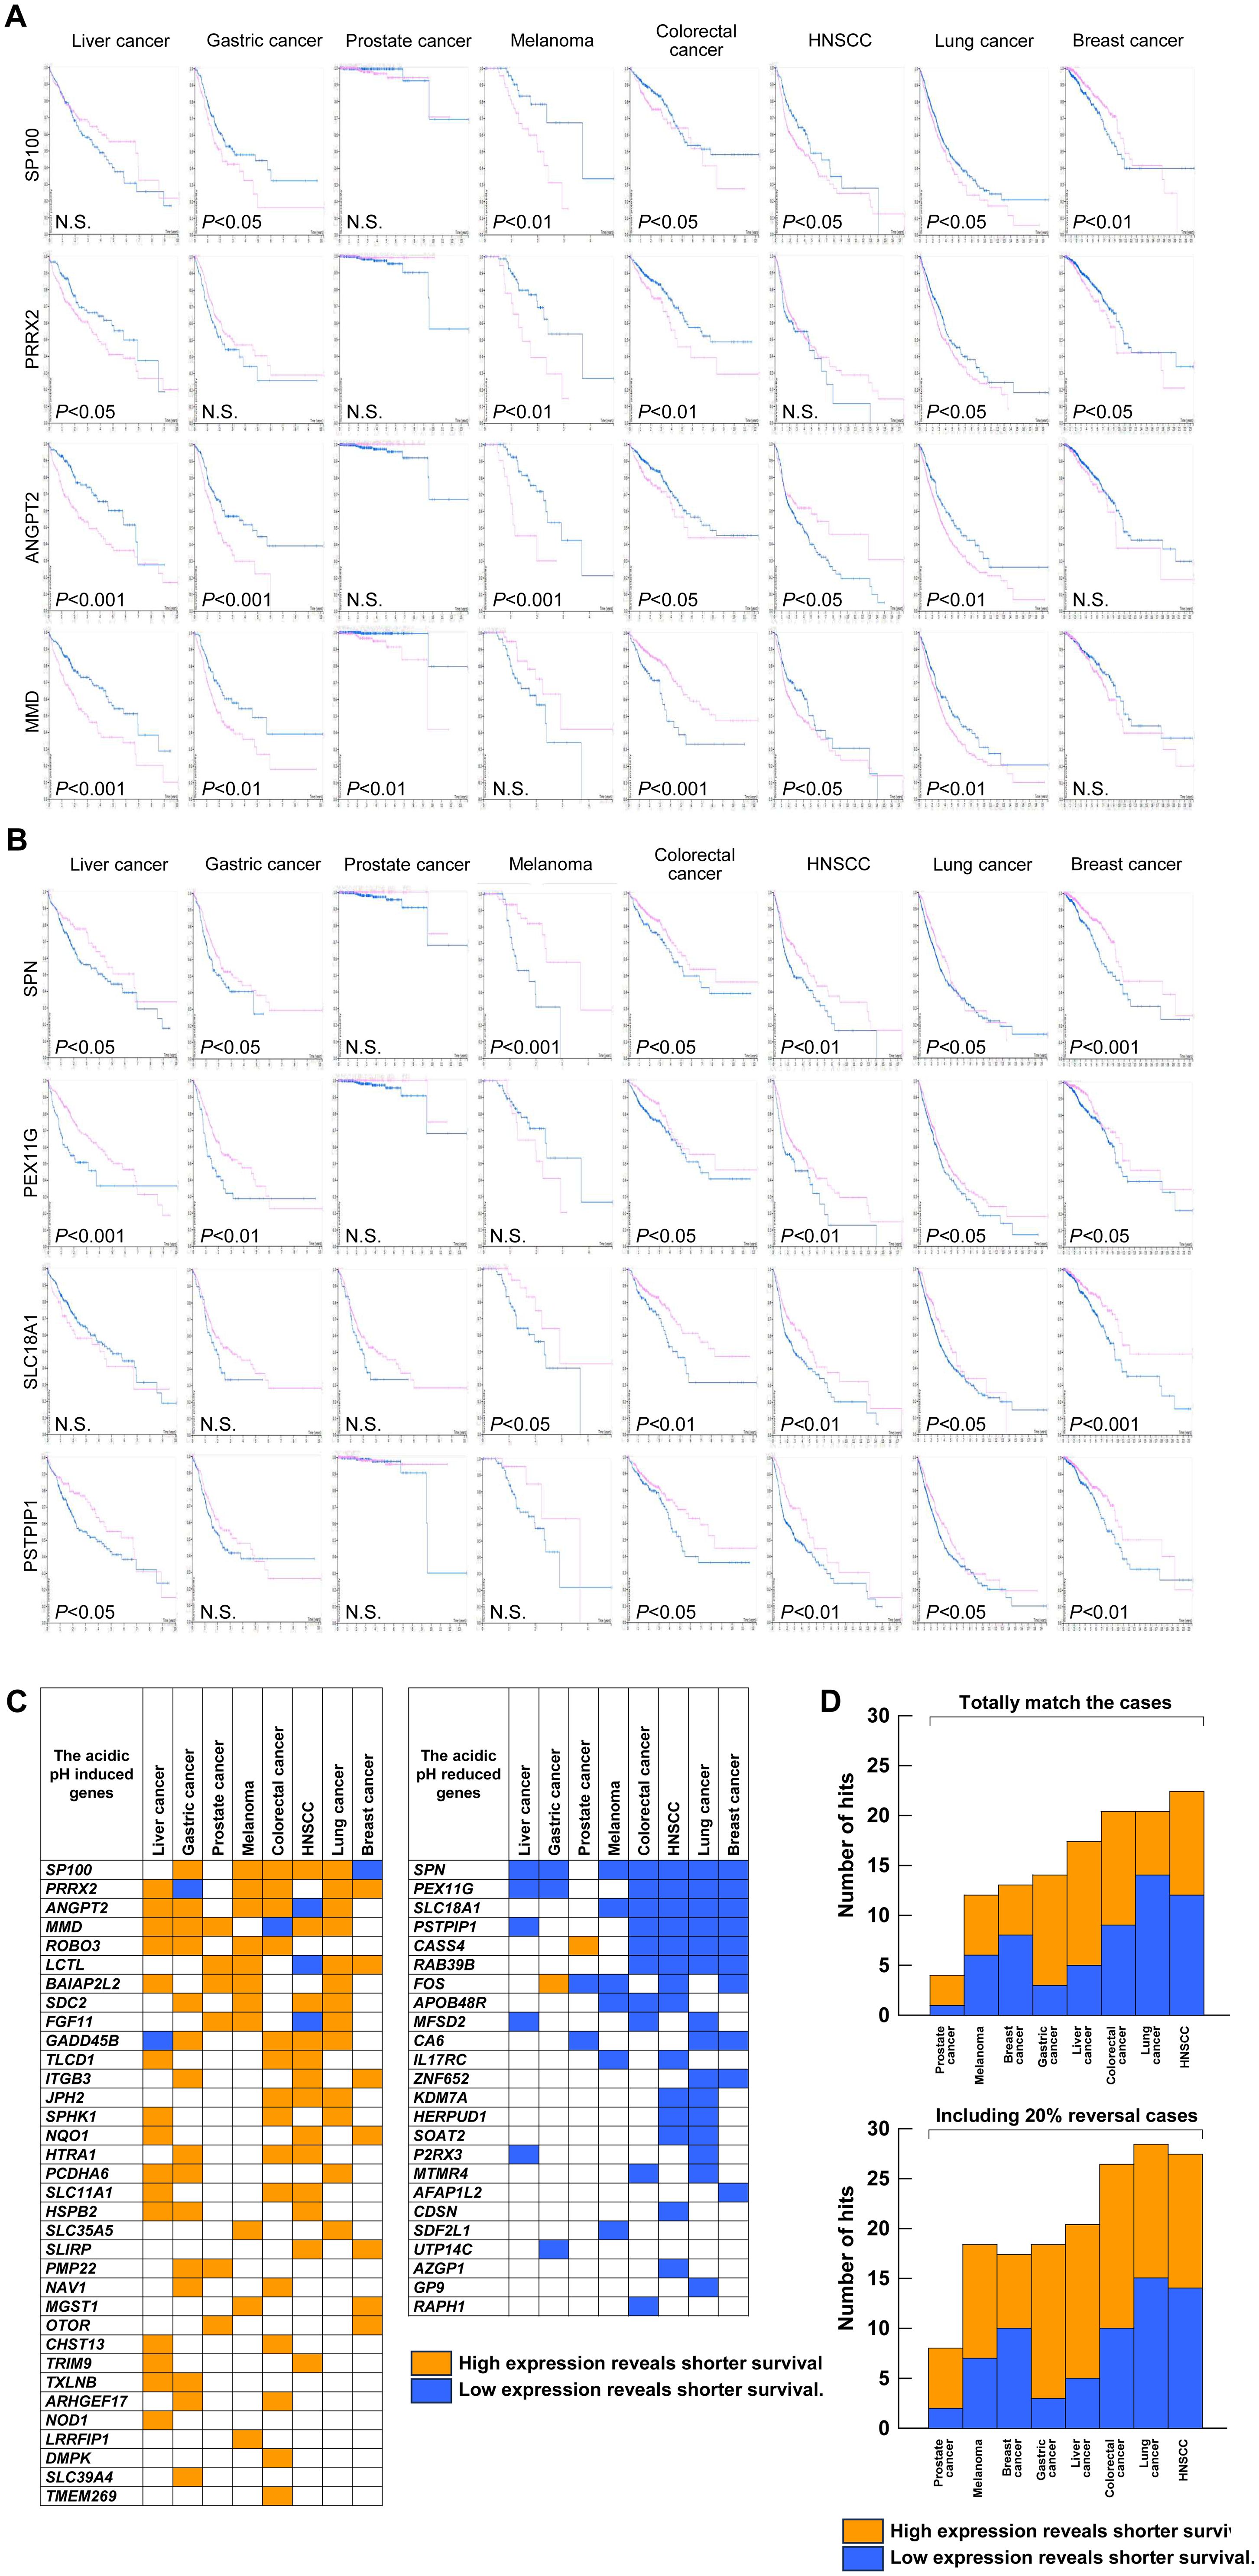
Figure 6. Prognostic significance of the acidic pHe-modulated genes. The Kaplan–Meier plot of four representative genes: (A) acidic pHe-induced genes; (B) acidic pHe-reduced genes. (C) Distribution list of “hit” genes. (D) Summary of the total number of hits excluding (upper) and including an inversion case of up to 20% (lower) from (C).
Acidic pHe is known to promote malignant tumor phenotype such as EMT, invasion, and metastasis (12, 13, 23, 24). The acidic pHe sensing system of the cells such as proton sensing GPCRs such as GPR4, TDAG8, and OGR1 is a good strategy for tumor therapy (25). Majority of their functions are tumor suppressors (26) so their inhibition can cause good prognosis. We have identified transient receptor M5 (TRPM5) involved in acidic pHe sensing, and the pharmacological treatment of the implanted B16-BL6 cells in the mouse with the inhibitor reduced lung metastasis in the B16-BL6 model (17). Further studies are needed for clinical trials.
Another established strategy is alkalinization therapy. Administration of NaHCO3 resulted in a more alkaline pHe in the tumor tissues than normal tissues due to decreasing buffering effect (2, 3). In a mouse xenograft model with the metastatic breast cancer cell line MDA-MB-231, oral administration of NaHCO3 inhibited metastasis and survival of the mice (27). Acidic pHe increased a level of the immune checkpoint molecule programmed cell death protein 1 (PD-L1), and administration of NaHCO3 in allogeneic transplanted mice reduced tumor growth, suggesting escape from the immune recognition (28). Thus, the mouse model has reported readiness leading to the clinical use of NaHCO3 for tumor therapy. In fact, the phase 1 clinical trials (NCT01350583, NCT01198821, and NCT01846429) were registered in the USA (http://www.clinicaltrials.gov) and reported as follows: among them, the study (NCT01846429) showed that administration of NaHCO3 reduced the perceived pain level by approximately 30% within the first 3 weeks, and the reduction was maintained when therapy was continued for more than 6 weeks (29). As an alternative to buffer therapy, the use of free base lysine has been reported by Bailey et al. (30). They also investigated a potential mechanism underlying the efficacy of buffer therapy (31). Specifically, when using free base lysine, buffer therapy shows efficacy in reducing the metastatic ability of acid-producing cells whose metastatic phenotype is supported by the formation of an acidic microenvironment. However, this therapy is not effective for cells that constitutively produce proteinases, such as matrix metalloproteinases, that contribute to metastasis.
Alkalinization affects efficacy of the chemotherapeutic agents. For example, the efficacy of the weak base drugs was decreased by acidic pHe and they are expected to be increased by alkalization. Raghunand et al. (32) demonstrated that alkalization therapy with NaHCO3 increased the efficacy of weak base drugs such as doxorubicin in a mouse model. Hamaguchi et al. (33) successfully demonstrated that the combination regimen consisting of oxaliplatin, irinotecan, fluorouracil, and leucovorin (FOLFIRINOX) with administration of an alkaline diet and NaHCO3 successfully increased in the pHe, which were monitored in the urine, and prolonged the survival of the patients with pancreatic cancer as compared to FOLFIRINOX alone.
In this study, we investigated how acidic pHe affects cellular functions that are independently and commonly regulated by the different degrees of acidosis. Since pHe in tumor tissue is not uniform (14), it was necessary to determine which of the cells and which of the molecules to target for therapeutic strategy. Furthermore, acidic pHe dependency of tumors was shown for the first time using the Human Protein Atlas based on the microarray analysis in this study. Acidic pHe effect does not enhance cell type-specific gene regulation; more generally, however, acidic pHe supports metastatic phenotypes observed in a previous report (17). Although we expected a good correlation of acidic pHe-modulated gene signature with that of human melanoma, colorectal and lung cancer and HNSCC were more relevant than melanoma, suggesting that alkalinization therapy is highly recommended concomitantly with conventional chemotherapy. On the other hand, the number of hits is lowest in prostate cancer, suggesting that prostate cancer is difficult to optimize for alkalinization therapy compared to the other tumor types.
The acidic pHe-induced genes are mainly hit for gastric and liver cancer, but the opposite is true for breast cancer. For the clinical therapeutic strategy, overexpression by gene transfer, except DNA vaccine (34), can hardly be developed at present, but alkalization therapy combination with the conventional molecular specific inhibitor or antibody medicine is highly applicable. Especially for gastric and liver cancer, the combination of alkalinization therapy with drugs is expected to tend to the gene-inducible type due to the acidic pHe dependency. SP100, PRRX2, and ANGPT2 are commonly correlated with poor prognosis among five out of eight tumors. Since the reduction of SP100 was reported to be induced by radioresistance of colorectal cancer (35), the combination of alkalinization therapy with radiation may provide a good prognosis. Also, upregulation of SP100 was found by ursodeoxycholic acid combined with prednisolone and immunosuppressive triple therapy (36), suggesting that it can be combined with alkalinization therapy. CircRNA is also a promising tool for future cancer therapy (37). For example, circLRFN5 is expected to be combined with alkalinization therapy because Prrx2 expression was highly induced by acidic pHe in this study and PRRX2 had inhibitory activity of ferroptosis in glioblastoma (38).
In conclusion, the acidic pHe signature of B16-BL6 is not limited to melanoma but can be adapted to many tumors. Our results showed that acidic pHe contributes to poor survival of patients with a wide range of tumor types, and also that tumors can be classified by their response to acidic pHe. The tumor classification based on the response to acidic pHe will provide new insight into the strategy of chemotherapy and gene therapy for patients with tumors.
The cDNA microarray data have been deposited at NCBI (GSE276124, https://www.ncbi.nlm.nih.gov/geo/query/acc.cgi?acc=GSE276124), which is available on Sept 9, 2024. Further inquiries can be directed to the corresponding author.
Ethical approval was not required for the study involving humans in accordance with the local legislation and institutional requirements. Written informed consent to participate in this study was not required from the participants or the participants’ legal guardians/next of kin in accordance with the national legislation and the institutional requirements.
YK: Conceptualization, Data curation, Funding acquisition, Investigation, Validation, Writing – original draft, Writing – review & editing. KM: Data curation, Formal analysis, Investigation, Visualization, Writing – original draft.
The author(s) declare financial support was received for the research, authorship, and/or publication of this article. This work was supported by Grant-in-Aid for Scientific Research (C) (19K10074 and 22K09929).
The authors declare that the research was conducted in the absence of any commercial or financial relationships that could be construed as a potential conflict of interest.
All claims expressed in this article are solely those of the authors and do not necessarily represent those of their affiliated organizations, or those of the publisher, the editors and the reviewers. Any product that may be evaluated in this article, or claim that may be made by its manufacturer, is not guaranteed or endorsed by the publisher.
The Supplementary Material for this article can be found online at: https://www.frontiersin.org/articles/10.3389/fonc.2024.1380679/full#supplementary-material
Supplementary Figure 1 | Viability of B16-BL6 cells in serum-free medium with different pHe. Cells (1 × 10⁴ cells/well) were seeded into the 96-well culture plate. After confirming that the cells adhered and spread on the vessels (3 h after inoculation), the cells were incubated in a serum-free medium with different pHes. At the end of the incubation, cells were treated with CCK-8 dye for 1.5 h. Absorbance was measured at 450 nm and plotted after subtracting the background absorbance without the cells at each pHe. **P<0.01.
Supplementary Figure 2 | RT-qPCR for human tumor cell lines. Each human tumor cell line was grown to confluence in 10% FBS containing medium in two six-well plates. They were then preincubated overnight in serum-free medium at pHe 7.4 and stimulated at different acidic pHes (6.8, 6.5, and 6.2) for 24 h. The pHe 7.4 medium was used as a control, and experiments were performed in triplicate. After incubation, total RNA was extracted, reverse transcribed, and subjected to qPCR analysis using specific primer sets. *P<0.05; **P<0.01.
1. Kato Y, Ozawa S, Miyamoto C, Maehata Y, Suzuki A, Maeda T, et al. Acidic extracellular microenvironment and cancer. Cancer Cell Int. (2013) 13:89. doi: 10.1186/1475-2867-13-89
2. Raghunand N, Mahoney B, van Sluis R, Baggett B, Gillies RJ. Acute metabolic alkalosis enhances response of C3H mouse mammary tumors to the weak base mitoxantrone. Neoplasia. (2001) 3:227–35. doi: 10.1038/sj.neo.7900151
3. Raghunand N, He X, van Sluis R, Mahoney B, Baggett B, Taylor CW, et al. Enhancement of chemotherapy by manipulation of tumour pH. Br J Cancer. (1999) 80:1005–11. doi: 10.1038/sj.bjc.6690455
4. Kato Y, Lambert CA, Colige AC, Mineur P, Noel A, Frankenne F, et al. Acidic extracellular pH induces matrix metalloproteinase-9 expression in mouse metastatic melanoma cells through the phospholipase D-mitogen-activated protein kinase signaling. J Biol Chem. (2005) 280:10938–44. doi: 10.1074/jbc.M411313200
5. Gupta SC, Singh R, Pochampally R, Watabe K, Mo YY. Acidosis promotes invasiveness of breast cancer cells through ROS-AKT-NF-κB pathway. Oncotarget. (2014) 5:12070–82. doi: 10.18632/oncotarget.2514
6. Nakanishi M, Korechika A, Yamakawa H, Kawabe N, Nakai K, Muragaki Y. Acidic microenvironment induction of interleukin-8 expression and matrix metalloproteinase-2/-9 activation via acid-sensing ion channel 1 promotes breast cancer cell progression. Oncol Rep. (2021) 45:1284–94. doi: 10.3892/or.2020.7907
7. Liu X, Zhao M, Sun X, Meng Z, Bai X, Gong Y, et al. Autophagic flux unleashes GATA4-NF-κB axis to promote antioxidant defense-dependent survival of colorectal cancer cells under chronic acidosis. Oxid Med Cell Longev. (2021) 2021:8189485. doi: 10.1155/2021/8189485
8. Knopf P, Stowbur D, Hoffmann SHL, Hermann N, Maurer A, Bucher V, et al. Acidosis-mediated increase in IFN-gamma-induced PD-L1 expression on cancer cells as an immune escape mechanism in solid tumors. Mol Cancer. (2023) 22:207. doi: 10.1186/s12943-023-01900-0
9. Rolver MG, Holland LKK, Ponniah M, Prasad NS, Yao J, Schnipper J, et al. Chronic acidosis rewires cancer cell metabolism through PPARα signaling. Int J Cancer. (2023) 152:1668–84. doi: 10.1002/ijc.34404
10. Boussadia Z, Lamberti J, Mattei F, Pizzi E, Puglisi R, Zanetti C, et al. Acidic microenvironment plays a key role in human melanoma progression through a sustained exosome mediated transfer of clinically relevant metastatic molecules. J Exp Clin Cancer Res. (2018) 37:245. doi: 10.1186/s13046-018-0915-z
11. Lee JY, Alexeyev M, Kozhukhar N, Pastukh V, White R, Stevens T. Carbonic anhydrase IX is a critical determinant of pulmonary microvascular endothelial cell pH regulation and angiogenesis during acidosis. Am J Physiol Lung Cell Mol Physiol. (2018) 315:L41–51. doi: 10.1152/ajplung.00446.2017
12. Suzuki A, Maeda T, Baba Y, Shimamura K, Kato Y. Acidic extracellular pH promotes epithelial mesenchymal transition in Lewis lung carcinoma model. Cancer Cell Int. (2014) 14:129. doi: 10.1186/s12935-014-0129-1
13. Sutoo S, Maeda T, Suzuki A, Kato Y. Adaptation to chronic acidic extracellular pH elicits a sustained increase in lung cancer cell invasion and metastasis. Clin Exp Metastasis. (2020) 37:133–44. doi: 10.1007/s10585-019-09990-1
14. Anemone A, Consolino L, Arena F, Capozza M, Longo DL. Imaging tumor acidosis: a survey of the available techniques for mapping in vivo tumor pH. Cancer Metastasis Rev. (2019) 38:25–49. doi: 10.1007/s10555-019-09782-9
15. Kato Y, Nakayama Y, Umeda M, Miyazaki K. Induction of 103-kDa gelatinase/type IV collagenase by acidic culture conditions in mouse metastatic melanoma cell lines. J Biol Chem. (1992) 267:11424–30. doi: 10.1016/S0021-9258(19)49927-4
16. Harhaji L, Popadic D, Miljkovic D, Cvetkovic I, Isakovic A, Trajkovic V. Acidosis affects tumor cell survival through modulation of nitric oxide release. Free Radic Biol Med. (2006) 40:226–35. doi: 10.1016/j.freeradbiomed.2005.08.027
17. Maeda T, Suzuki A, Koga K, Miyamoto C, Maehata Y, Ozawa S, et al. TRPM5 mediates acidic extracellular pH signaling and TRPM5 inhibition reduces spontaneous metastasis in mouse B16-BL6 melanoma cells. Oncotarget. (2017) 8:78312–26. doi: 10.18632/oncotarget.20826
18. Luo X, Mitra D, Sullivan RJ, Wittner BS, Kimura AM, Pan S, et al. Isolation and molecular characterization of circulating melanoma cells. Cell Rep. (2014) 7:645–53. doi: 10.1016/j.celrep.2014.03.039
19. Xu L, Shen SS, Hoshida Y, Subramanian A, Ross K, Brunet JP, et al. Gene expression changes in an animal melanoma model correlate with aggressiveness of human melanoma metastases. Mol Cancer Res. (2008) 6:760–9. doi: 10.1158/1541-7786.MCR-07-0344
20. Goedhart J, Luijsterburg MS. VolcaNoseR is a web app for creating, exploring, labeling and sharing volcano plots. Sci Rep. (2020) 10:20560. doi: 10.1038/s41598-020-76603-3
21. Thomas PD, Ebert D, Muruganujan A, Mushayahama T, Albou LP, Mi H. PANTHER: Making genome-scale phylogenetics accessible to all. Protein Sci. (2022) 31:8–22. doi: 10.1002/pro.4218
22. Tang Z, Kang B, Li C, Chen T, Zhang Z. GEPIA2: an enhanced web server for large-scale expression profiling and interactive analysis. Nucleic Acids Res. (2019) 47:W556–W60. doi: 10.1093/nar/gkz430
23. Riemann A, Rauschner M, Giesselmann M, Reime S, Thews O. The acidic tumor microenvironment affects epithelial-mesenchymal transition markers as well as adhesion of NCI-H358 lung cancer cells. Adv Exp Med Biol. (2021) 1269:179–83. doi: 10.1007/978-3-030-48238-1_28
24. Kong X, Peng H, Liu P, Fu X, Wang N, Zhang D. Programmed death ligand 1 regulates epithelial-mesenchymal transition and cancer stem cell phenotypes in hepatocellular carcinoma through the serum and glucocorticoid kinase 2/β-catenin signaling pathway. Cancer Sci. (2023) 114:2265–76. doi: 10.1111/cas.15753
25. Damaghi M, Wojtkowiak JW, Gillies RJ. pH sensing and regulation in cancer. Front Physiol. (2013) 4:370. doi: 10.3389/fphys.2013.00370
26. Justus CR, Dong L, Yang LV. Acidic tumor microenvironment and pH-sensing G protein-coupled receptors. Front Physiol. (2013) 4:354. doi: 10.3389/fphys.2013.00354
27. Robey IF, Baggett BK, Kirkpatrick ND, Roe DJ, Dosescu J, Sloane BF, et al. Bicarbonate increases tumor pH and inhibits spontaneous metastases. Cancer Res. (2009) 69:2260–8. doi: 10.1158/0008-5472.CAN-07-5575
28. Mori D, Tsujikawa T, Sugiyama Y, Kotani SI, Fuse S, Ohmura G, et al. Extracellular acidity in tumor tissue upregulates programmed cell death protein 1 expression on tumor cells via proton-sensing G protein-coupled receptors. Int J Cancer. (2021) 149:2116–24. doi: 10.1002/ijc.33786
29. Gillies RJ, Ibrahim-Hashim A, Ordway B, Gatenby RA. Back to basic: Trials and tribulations of alkalizing agents in cancer. Front Oncol. (2022) 12:981718. doi: 10.3389/fonc.2022.981718
30. Ibrahim-Hashim A, Wojtkowiak JW, de Lourdes Coelho Ribeiro M, Estrella V, Bailey KM, Cornnell HH, et al. Free base lysine increases survival and reduces metastasis in prostate cancer model. J Cancer Sci Ther Suppl. (2011) S1. doi: 10.4172/1948-5956
31. Bailey KM, Wojtkowiak JW, Cornnell HH, Ribeiro MC, Balagurunathan Y, Hashim AI, et al. Mechanisms of buffer therapy resistance. Neoplasia. (2014) 16:354–64 e1-3. doi: 10.1016/j.neo.2014.04.005
32. Raghunand N, Gillies RJ. pH and chemotherapy. Novartis Found Symp. (2001) 240:199–211. doi: 10.1002/0470868716.ch14
33. Hamaguchi R, Narui R, Wada H. Effects of alkalization therapy on chemotherapy outcomes in metastatic or recurrent pancreatic cancer. Anticancer Res. (2020) 40:873–80. doi: 10.21873/anticanres.14020
34. Kozak M, Hu J. DNA Vaccines: their formulations, engineering and delivery. Vaccines (Basel). (2024) 12. doi: 10.3390/vaccines12010071
35. Zhou Y, Shao Y, Hu W, Zhang J, Shi Y, Kong X, et al. A novel long noncoding RNA SP100-AS1 induces radioresistance of colorectal cancer via sponging miR-622 and stabilizing ATG3. Cell Death Differ. (2023) 30:111–24. doi: 10.1038/s41418-022-01049-1
36. Yao TT, Qian JD, Wang GQ. Efficacy of ursodeoxycholic acid combined with prednisolone and immunosuppressant triple therapy in the treatment of refractory primary biliary cholangitis. Med Clin (Barc). (2020) 155:165–70. doi: 10.1016/j.medcli.2020.03.013
37. van Zonneveld AJ, Kolling M, Bijkerk R, Lorenzen JM. Circular RNAs in kidney disease and cancer. Nat Rev Nephrol. (2021) 17:814–26. doi: 10.1038/s41581-021-00465-9
Keywords: acidic extracellular pH, prognosis, acidosis dependency, pathological staging, cDNA microarray
Citation: Kato Y and Mawatari K (2024) Clinical significance of acidic extracellular microenvironment modulated genes. Front. Oncol. 14:1380679. doi: 10.3389/fonc.2024.1380679
Received: 02 February 2024; Accepted: 21 August 2024;
Published: 20 September 2024.
Edited by:
Reo Hamaguchi, Juntendo University, JapanReviewed by:
Arig Ibrahim-Hashim, Moffitt Cancer Center, United StatesCopyright © 2024 Kato and Mawatari. This is an open-access article distributed under the terms of the Creative Commons Attribution License (CC BY). The use, distribution or reproduction in other forums is permitted, provided the original author(s) and the copyright owner(s) are credited and that the original publication in this journal is cited, in accordance with accepted academic practice. No use, distribution or reproduction is permitted which does not comply with these terms.
*Correspondence: Yasumasa Kato, eWFzdW1hc2Ffa2F0b0BsaXZlLmpw; eS1rYXRvdUBkZW4ub2h1LXUuYWMuanA=
Disclaimer: All claims expressed in this article are solely those of the authors and do not necessarily represent those of their affiliated organizations, or those of the publisher, the editors and the reviewers. Any product that may be evaluated in this article or claim that may be made by its manufacturer is not guaranteed or endorsed by the publisher.
Research integrity at Frontiers

Learn more about the work of our research integrity team to safeguard the quality of each article we publish.