 Jennifer B. Permuth1,2*
 Margaret A. Park2,3
 Dung-Tsa Chen3
 Toni Basinski2
 Benjamin D. Powers2,4
 Clement K. Gwede5Kaleena B. Dezsi1
 Maria Gomez1,2Shraddha L. Vyas1,6Tiago Biachi2Elena M. Cortizas7
 Sylvia Crowder5
 Maria Genilo-Delgado2B.Lee Green5
 Anna Greene3Christopher Gregg8Sarah E. Hoffe2Kun Jiang9
 Bora Kim2Vanitha Vasudevan10Jeronimo Garcialopez De Llano10
 Anjana A. Menon2Qianxing Mo3Lina M. MorenoUrazan2Shaffer Mok2
 Nathan Parker5
 Sahana Rajasekhara11
 Ghulam Rasool12
 Andrew Sinnamon5
 Lauren Sparks13
 Paul A. Stewart3Kenneth Tardif14
 Alexandra F. Tassielli2
 Jamie K. Teer3Dan Viet Tran7Kea L. Turner5Susan T. Vadaparampil5,15
 Christopher J. Whelan16Wade G. Douglas17Vic Velanovich18Andreas Karachristos18Adrian Legaspi10Kenneth Meredith19Manual A. Molina-Vega20Kevin L. Huguet14Juan P. Arnoletti21Mark Bloomston22
 Jose Trevino23,24Nipun B. Merchant25
 Jose M. Pimiento2
 Pamela J. Hodul2
 Mokenge Malafa2
 Jason Fleming2Sarah M. Judge26Daniel K. Jeong11
 Andrew Judge26
- 1Department of Cancer Epidemiology, Moffitt Cancer Center, Tampa, FL, United States
- 2Department of Gastrointestinal Oncology, Moffitt Cancer Center, Tampa, FL, United States
- 3Department of Biostatistics and Bioinformatics, Moffitt Cancer Center, Tampa, FL, United States
- 4Department of Surgery, School of Medicine, University of Maryland, Baltimore, MD, United States
- 5Department of Health Outcomes and Behavior, Moffitt Cancer Center, Tampa, FL, United States
- 6Research Analytics and Development Cores, Baylor Scott & White Research Institute (BSWRI), Dallas, TX, United States
- 7Leonard M. Miller School of Medicine, University of Miami, Miami, FL, United States
- 8Department of Neurobiology, School of Medicine, University of Utah Health, Salt Lake City, UT, United States
- 9Department of Pathology, Moffitt Cancer Center, Tampa, FL, United States
- 10Center for Advanced Surgical Oncology, Palmetto General Hospital, Hialeah, FL, United States
- 11Supportive Care Medicine, Moffitt Cancer Center, Tampa, FL, United States
- 12Department of Machine Learning, Moffitt Cancer Center, Tampa, FL, United States
- 13Translational Research Institute, AdventHealth, Orlando, FL, United States
- 14Department of Surgery, St. Anthony’s Hospital, St. Petersburg, FL, United States
- 15Community Outreach, Engagement & Equity, Moffitt Cancer Center, Tampa, FL, United States
- 16Department of Metabolism and Cancer Physiology, Moffitt Cancer Center, Tampa, FL, United States
- 17Department of Clinical Sciences, College of Medicine, Florida State University, Tallahassee, FL, United States
- 18Tampa General Hospital, Tampa, FL, United States
- 19Department of Gastrointestinal Surgical Oncology, Sarasota Memorial Hospital, Sarasota, FL, United States
- 20Department of Surgical Oncology, Lakeland Regional Hospital, Lakeland, FL, United States
- 21Department of Surgical Oncology, Orlando Regional Medical Center, Orlando, FL, United States
- 22Department of Surgical Oncology, Lee Health Regional Cancer Center, Fort Myers, FL, United States
- 23Department of Surgery, College of Medicine, University of Florida, Gainesville, FL, United States
- 24Massey Cancer Center, Virginia Commonwealth University, Richmond, VA, United States
- 25Division of Surgical Oncology, DeWitt Daughtry Family Department of Surgery, Leonard M. Miller School of Medicine, University of Miami, Miami, FL, United States
- 26Department of Physical Therapy, College of Public Health and Health Professions, University of Florida, Gainesville, FL, United States
Introduction: Cancer-associated cachexia (CC) is a progressive syndrome characterized by unintentional weight loss, muscle atrophy, fatigue, and poor outcomes that affects most patients with pancreatic ductal adenocarcinoma (PDAC). The ability to identify and classify CC stage along its continuum early in the disease process is challenging but critical for management.
Objectives: The main objective of this study was to determine the prevalence of CC stage overall and by sex and race and ethnicity among treatment-naïve PDAC cases using clinical, nutritional, and functional criteria. Secondary objectives included identifying the prevalence and predictors of higher symptom burden, supportive care needs, and quality of life (QoL), and examining their influence on overall survival (OS).
Materials and methods: A population-based multi-institutional prospective cohort study of patients with PDAC was conducted between 2018 and 2021 by the Florida Pancreas Collaborative. Leveraging patient-reported data and laboratory values, participants were classified at baseline into four stages [non-cachexia (NCa), pre-cachexia (PCa), cachexia (Ca), and refractory cachexia (RCa)]. Multivariate regression, Kaplan Meier analyses, and Cox regression were conducted to evaluate associations.
Results: CC stage was estimated for 309 PDAC cases (156 females, 153 males). The overall prevalence of NCa, PCa, Ca, and RCa was 12.9%, 24.6%, 54.1%, and 8.4%, respectively. CC prevalence across all CC stages was highest for males and racial and ethnic minorities. Criteria differentiated NCa cases from other groups, but did not distinguish PCa from Ca. The most frequently reported symptoms included weight loss, fatigue, pain, anxiety, and depression, with pain significantly worsening over time. The greatest supportive care needs included emotional and physical domains. Males, Black people, and those with RCa had the worst OS.
Conclusions: Using clinical, nutritional, and functional criteria, nearly one-quarter of the PDAC cases in our diverse, multi-institutional cohort had PCa and 62.5% had Ca or RCa at the time of diagnosis. The PCa estimate is higher than that reported in prior studies. We recommend these criteria be used to aid in CC classification, monitoring, and management of all incident PDAC cases. Findings also highlight the recommendation for continued emotional support, assistance in alleviating pain, and supportive care needs throughout the PDAC treatment journey.
Introduction
Cancer-associated cachexia (CC) is a condition characterized by unintentional weight loss, loss of skeletal muscle mass (with or without fat loss), decreased appetite, fatigue, and other metabolic changes that limit therapeutic response, reduce quality of life (QoL), and decrease survival in 28–57% of cancer patients (1, 2). The prevalence of CC is highest in gastrointestinal malignancies and pancreatic ductal adenocarcinoma (PDAC) in particular, with up to 80% of PDAC patients affected during their disease (3), independent of resectability status (4–6). Proper early identification and treatment of CC has potential to improve QoL for patients newly-diagnosed with PDAC, but due to CC’s complex and heterogeneous pathophysiological and clinical characteristics, consensus is needed regarding its definition, the number of stages in its continuum, and classification criteria (7–22).
Historically, unintended weight loss greater than 5% was the only factor considered for CC classification, however recent literature suggests many factors be used (13). Based on landmark studies (12, 13, 17), Vigano and colleagues (18) developed a CC classification system using seven criteria to distinguish four CC stages [non-cachexia (NCa), pre-cachexia (PCa), cachexia (Ca), and refractory cachexia (RCa)]. In a subsequent study of patients with advanced cancer (59% with gastrointestinal cancers) (15), the Vigano classification (18) was modified to only include criteria readily accessible to clinicians encompassing four domains: 1) biochemistry (high C-reactive protein (CRP) or leukocytes, hypoalbuminemia, or anemia); 2) food intake (decreased); 3) weight loss over the past 6 months [moderate (≤5%) or significant (>5%)]; and 4) performance status (Eastern Cooperative Oncology Group (ECOG) Performance Status ≥ 3). A recent study conducted in Brazil (23) compared CC classification criteria from Vigano (15) with other groups (10, 16); among 1384 patients with advanced cancer (32% with gastrointestinal cancers), criteria by Vigano (15) were most effective in distinguishing between CC stages and predicting risk of 90-day mortality, though work is needed to better discriminate PCa from Ca and validate predictors of overall survival (OS) (15, 23).
Of studies that evaluated CC exclusively among patients with PDAC (24–31), the majority predated the Vigano publication (15), none used their (15) methods to classify CC stage, and nearly all classified cases as cachectic or non-cachectic (24–26, 28–31). Most studies included PDAC cases with any tumor stage (26, 28, 30, 31), while others focused only resectable disease (24, 25) or restricted to locally advanced or metastatic disease (27, 29). Additionally, the majority of studies of PDAC-associated cachexia did not evaluate patient-reported outcomes (PRO) as endpoints as recommended by the American Society of Clinical Oncology (22). Furthermore, practically all of these studies used a retrospective or cross-sectional design and did not collect measurements longitudinally to assess changes over time. Finally, except for one study from Taiwan (31), all studies of CC retrospectively analyzed homogeneous populations of Non-Hispanic White (NHW) or European PDAC cases. Only two studies reported inclusion of individuals who self-reported as Black people (26, 29). Based on the significantly higher PDAC incidence and mortality rates in African Americans (AA)/Black people compared to NHW and Hispanic Latinx (H/L) populations (32–44) and data from colorectal and esophageal cancers which showed Black people and H/L to have higher risks of presenting with CC compared to NHW (45), it seems prudent to prospectively evaluate PDAC-induced CC in racially and ethnically diverse populations.
The objectives of the current study were to 1) leverage the updated CC classification system by Vigano et al. (15) to determine the prevalence of CC stage at diagnosis among a diverse cohort of incident PDAC cases of all stages; 2) identify the prevalence of higher symptom burden, supportive care needs, and poor QoL, and factors predictive of these endpoints; and 3) examine the influence of individual factors on OS, controlling for tumor stage and resectability.
Materials and methods
Study population
This study included patients from 15 institutions (academic cancer centers and community hospitals) participating in the Florida Pancreas Collaborative (FPC), a state-wide population-based prospective cohort study and biobank conducted between May 2018 and September 2021 (46). Participants were eligible if they: a) were 18 years old and above, b) self-reported as African American or Black people, NHW, or H/L [the populations having the greatest PDAC burden in Florida and nationally (20)], c) were willing to complete the study questionnaire and donate biospecimens at the time of standard-of-care (SOC) procedures, and d) had a strong suspicion of PDAC and were treatment-naïve. The diagnosis was confirmed by pathologic review of tissue obtained through routine diagnostic procedures. The study was approved by the Advarra Institutional Review Board, and all patients provided informed consent to participate.
Data collection
As described in a whitepaper from the FPC (46), data collection occurred at baseline/enrollment and at 6- and 12-months post-baseline via health screens, questionnaires, and case report forms. The 3-page health screen comprises the abridged version of the Patient-Generated Subjective Global Assessment (aPG-SGA), a revised version of the Edmonton Symptom Assessment System (ESAS-r), and the Canadian Problem Checklist (Supplementary Figures 1A-C). The aPG-SGA (47) is a four-part questionnaire that gathers self-reported information as part of “boxes” pertaining to: 1) height, weight, and weight change over the past two weeks, 2) food intake over the past month, 3) presence of symptoms affecting food intake over the past two weeks, and 4) activities and function over the past month. ESAS-r assesses the prevalence and severity of symptoms (e.g., pain, tiredness/fatigue) on a scale of 0 (“no symptoms”) to 10 (“worst symptoms”) (48). The Canadian Problem Checklist (CPC) is based on supportive care needs of cancer patients and includes domains of emotional, informational, practical, spiritual, social, family, and physical concerns (49, 50). Information on cigarette smoking over a lifetime and the past 30 days was also ascertained in the health screen.
Participants also completed a self-administered web- or teleform-based baseline questionnaire and abbreviated versions at follow-up time-points. The baseline questionnaire gathered demographic, socioeconomic, epidemiologic, and clinical variables. We also assessed self-reported grip strength via questionnaire since using a dynamometer was cost-prohibitive for our multi-center study (51). Two questions were asked: “Have you found it challenging to grip objects with your entire hand (such as when giving a hand-shake or when holding on to a stairwell or carrying a handle of a bucket)?” and “Have you found it challenging to grip objects with your fingers (such as a piece of paper or a coin)?” Responses included not at all, a little, quite a bit, and very much. Validated questionnaires were used to assess mental health, lifetime stress, nutrition, and QoL (52–54). Performance status was assessed at the clinic visit by treating providers using ECOG guidelines (55). Data was obtained from the electronic medical record (EMR) on presenting symptoms, anthropometric measures, comorbidities (56), primary tumor location (head, body, tail, other), imaging studies, surgical and pathology details, chemotherapy regimen, and lab values. Treatment and follow-up data from the Florida Cancer Data System (57) was also obtained. Vital status was verified using the National Death Index, Social Security Death Index, obituaries, autopsy reports, and death certificates.
Laboratory values
Most participants had routine blood analyses performed as part of SOC, and had data on pre-treatment laboratory values considered in the Vigano classification (15) (CRP, albumin (Alb), hemoglobin (HgB), and white blood cell (WBC) count). Additionally, based on data supporting serum cancer antigen 19–9, the Glasgow Prognostic Score (GPS) (objective scoring based on concentrations of CRP and albumin), neutrophil to lymphocyte ratio (NLR), platelet count, and bilirubin as having prognostic value for patients with PDAC and other cancer types (58–65), these markers were also considered using previously-defined cut-offs (66–70). Since CRP was not routinely ordered as part of SOC for all participants, serum levels of CRP were evaluated as part of a multiplexed array research panel (Supplementary Methods) with other SOC markers and novel biomarkers of interest that are not a focus of Vigano (15) using archived serum from a subset of cases. Since biomarker concentrations may be influenced by antibiotics, steroids, or chemotherapy (27, 67, 71), neo- or adjuvant therapy and medication details were considered.
Cancer cachexia stage
Participants were classified into four CC stages (NCa, PCa, Ca, and RCa) at baseline using criteria in Table 1: abnormal biochemistry (A), decreased food intake (B), minimal weight loss (C), significant weight loss (D), and decreased activities and functioning (E-F). Due to small numbers of cases with complete data in certain categories, a dichotomous CC status variable (cachectic vs. non-cachectic) was created based on criteria from Fearon et al. (13) wherein cachectic patients reported weight loss >5% over the past 6 months or had a BMI <20 and any weight loss >2% over the past 6 months and non-cachectic cases did not meet either threshold. Quality of life (QOL) was assessed using the European Organization for Research and Treatment of Cancer (EORTC) QLQ-C30 and QLQ-PAN-26 instruments. The QLQ-C30 comprises 30 questions based on QoL, function, and symptoms, and is intended to determine general health-related QoL (HRQoL) specific to cancer patients. With the exception of two items, scoring involves a 4-point Likert scale where 1= “Not at all”, 2= “A little”, 3= “Quite a bit”, and 4= “Very much”. Items 29 (overall health rating) and 30 (overall QoL) are scored on a 7-point ranking ranging from 1= “very poor” to 7= “excellent”. Scales were linearly transformed to a score from 0 to 100 (72) with 100 depicting the best health quality. The EORTC QLQ-PAN26 was validated in PDAC (73–75) and contains 26 items on self-reported symptoms and issues specific to PDAC such as abdominal discomfort and back pain. Higher scores signify poorer QoL for all scales except for the satisfaction scale for which higher scores denote better QoL.
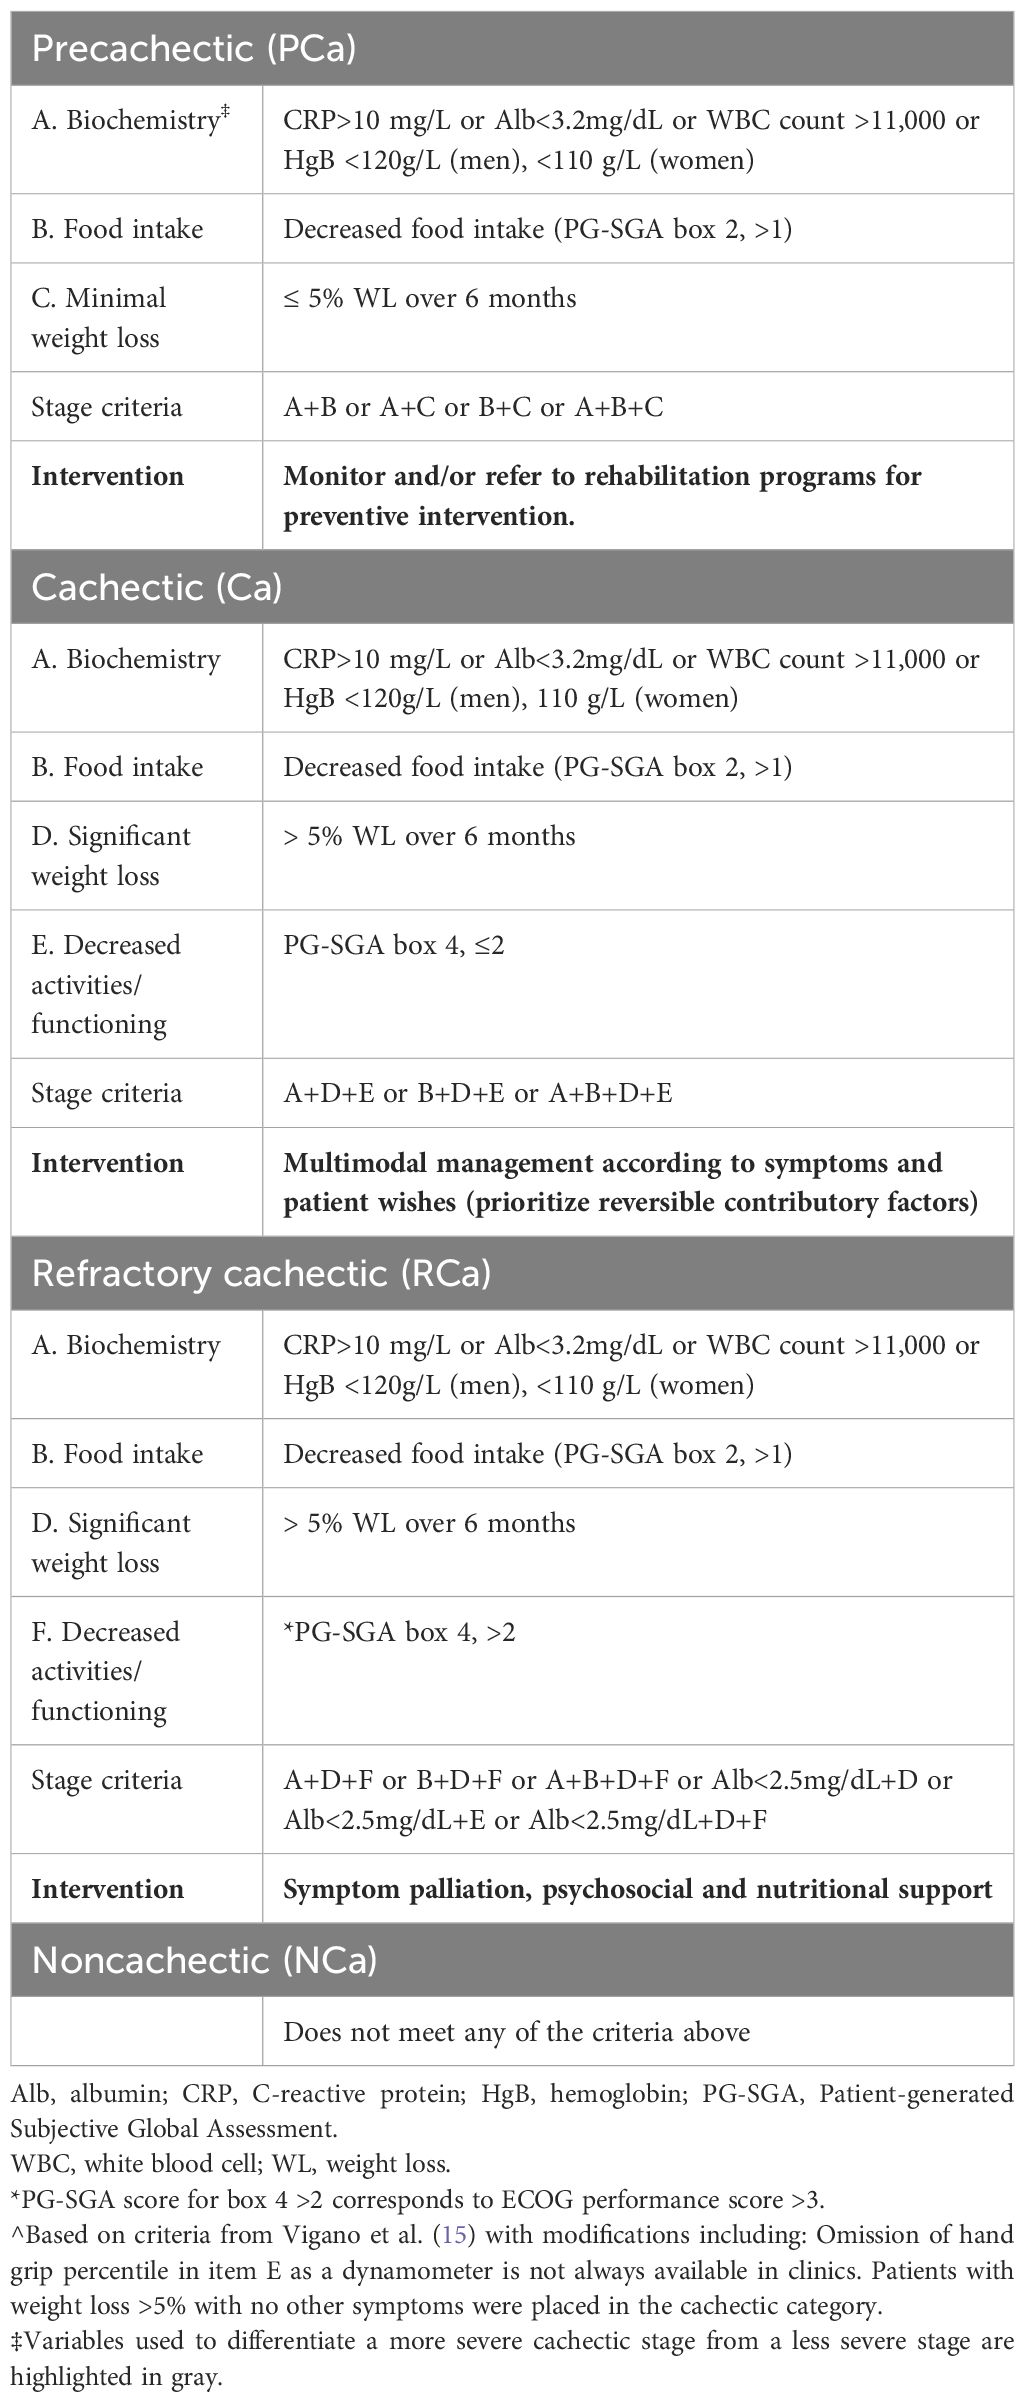
Table 1 Criteria used for cancer cachexia classification^ in the Florida pancreas collaborative pancreatic ductal adenocarcinoma cohort.
Statistical analysis
Descriptive statistics were used to summarize baseline characteristics of the study population. For continuous variables, differences between groups were tested by ANOVA with means ± standard deviations (SD) followed by the Tukey Honest Significant Differences post-hoc test. For non-normally distributed variables, non-parametric Kruskal Wallis tests were performed and followed by Mann Whitney U-tests. Chi-square tests or McNemar’s chi square tests were used to determine differences in proportions for categorical variables. Symptoms were also categorized into groups based on the nature of the symptoms. Physical symptoms included six domains (pain, fatigue, drowsiness, nausea, loss of appetite, and shortness of breath). Psychological symptoms included two domains (anxiety and depression). The mean of all symptoms represented the total symptom subscore. Individual symptom scores and subscores obtained from ESAS-r were dichotomized into 0–3 (none to mild) or 4–10 (moderate to severe) (76, 77). The frequency of “none to mild” or “moderate to severe” physical, psychological, and total symptom subscore categories were compared across groups using chi-squared tests.
To identify factors predictive of moderate to severe symptom burden, supportive care needs, HRQoL, and/or CC status, multivariate logistic regression models were used. Pearson correlation tests were used to evaluate the linear relationship between laboratory values and other characteristics. The influence of individual factors and CC status on QoL was investigated with multivariate generalized linear regression. Due to possible collinearity of contributing factors, we performed preliminary global data exploration using multiple correspondence analysis (MCA) (78). MCA is an analog to principal component analysis for categorical variables and was carried out using the R package FactoMiner. A sum of cosine2 of >0.3 (a measure of how well each variable is represented by the first 2 dimensions) was used as a cutoff for modeling.
To evaluate associations with OS, we conducted Kaplan-Meier analysis and multivariate Cox proportional hazards (PH) regression, and calculated hazard ratios and 95% confidence intervals (CIs). OS was calculated from the date of diagnosis to the date of death from any cause or last follow-up. Covariates considered in analyses included age at diagnosis, race and ethnicity, gender, BMI, age-adjusted Charlson Comorbidity Index (ACCI), tumor stage, smoking history (never, past, or current), laboratory values, and treatment received (20, 21, 26, 28, 29, 79–82). Effect modification was evaluated by conducting stratified analysis by biological sex and racial and ethnic group. Analyses were performed using R 4.3.1.
Results
Demographic, socioeconomic, epidemiologic, and clinical characteristics of the cohort
A total of 318 PDAC cases (161 female, 157 male) were recruited to the FPC study. Select characteristics of the cohort overall and by race and ethnicity are in Table 2. The average age at diagnosis was slightly younger in AA (67.2 years) and H/L (66.0 years) compared to NHW (70.5 years), with 25.5% of H/L and 14.3% of AA diagnosed at age 55 or younger compared to 4.2% of NHW (P<0.001 for H/L and P=0.015 for AA pairwise comparisons). A higher proportion of females was observed among AA and H/L racial and ethnic groups compared to NHW, at 62.9%, 66%, and 45.8%, respectively, though significance was only observed for H/L versus NHW pairwise comparisons (P=0.011). NHW were more likely to be married and report a higher annual income than AA and H/L. No significant differences were observed between racial and ethnic groups in education level or insurance status. A higher proportion of never smokers were observed amongst H/L (72.3%) compared to NHW (39.4%), P<0.001. Differences were also observed between racial and ethnic groups for several anthropometric variables. Namely, BMI was slightly higher in AA (28.2 kg/m2) compared to H/L (24.6 kg/m2) and NHW (26.7 kg/m2), with approximately 69% of AA, 60% of NHW, and 42% of H/L reported to be overweight or obese. Waist to hip ratio and waist circumference were significantly lower in H/L compared to NHW, with P=0.0161, P=0.04, respectively (ANOVA and Tukey’s HSD).
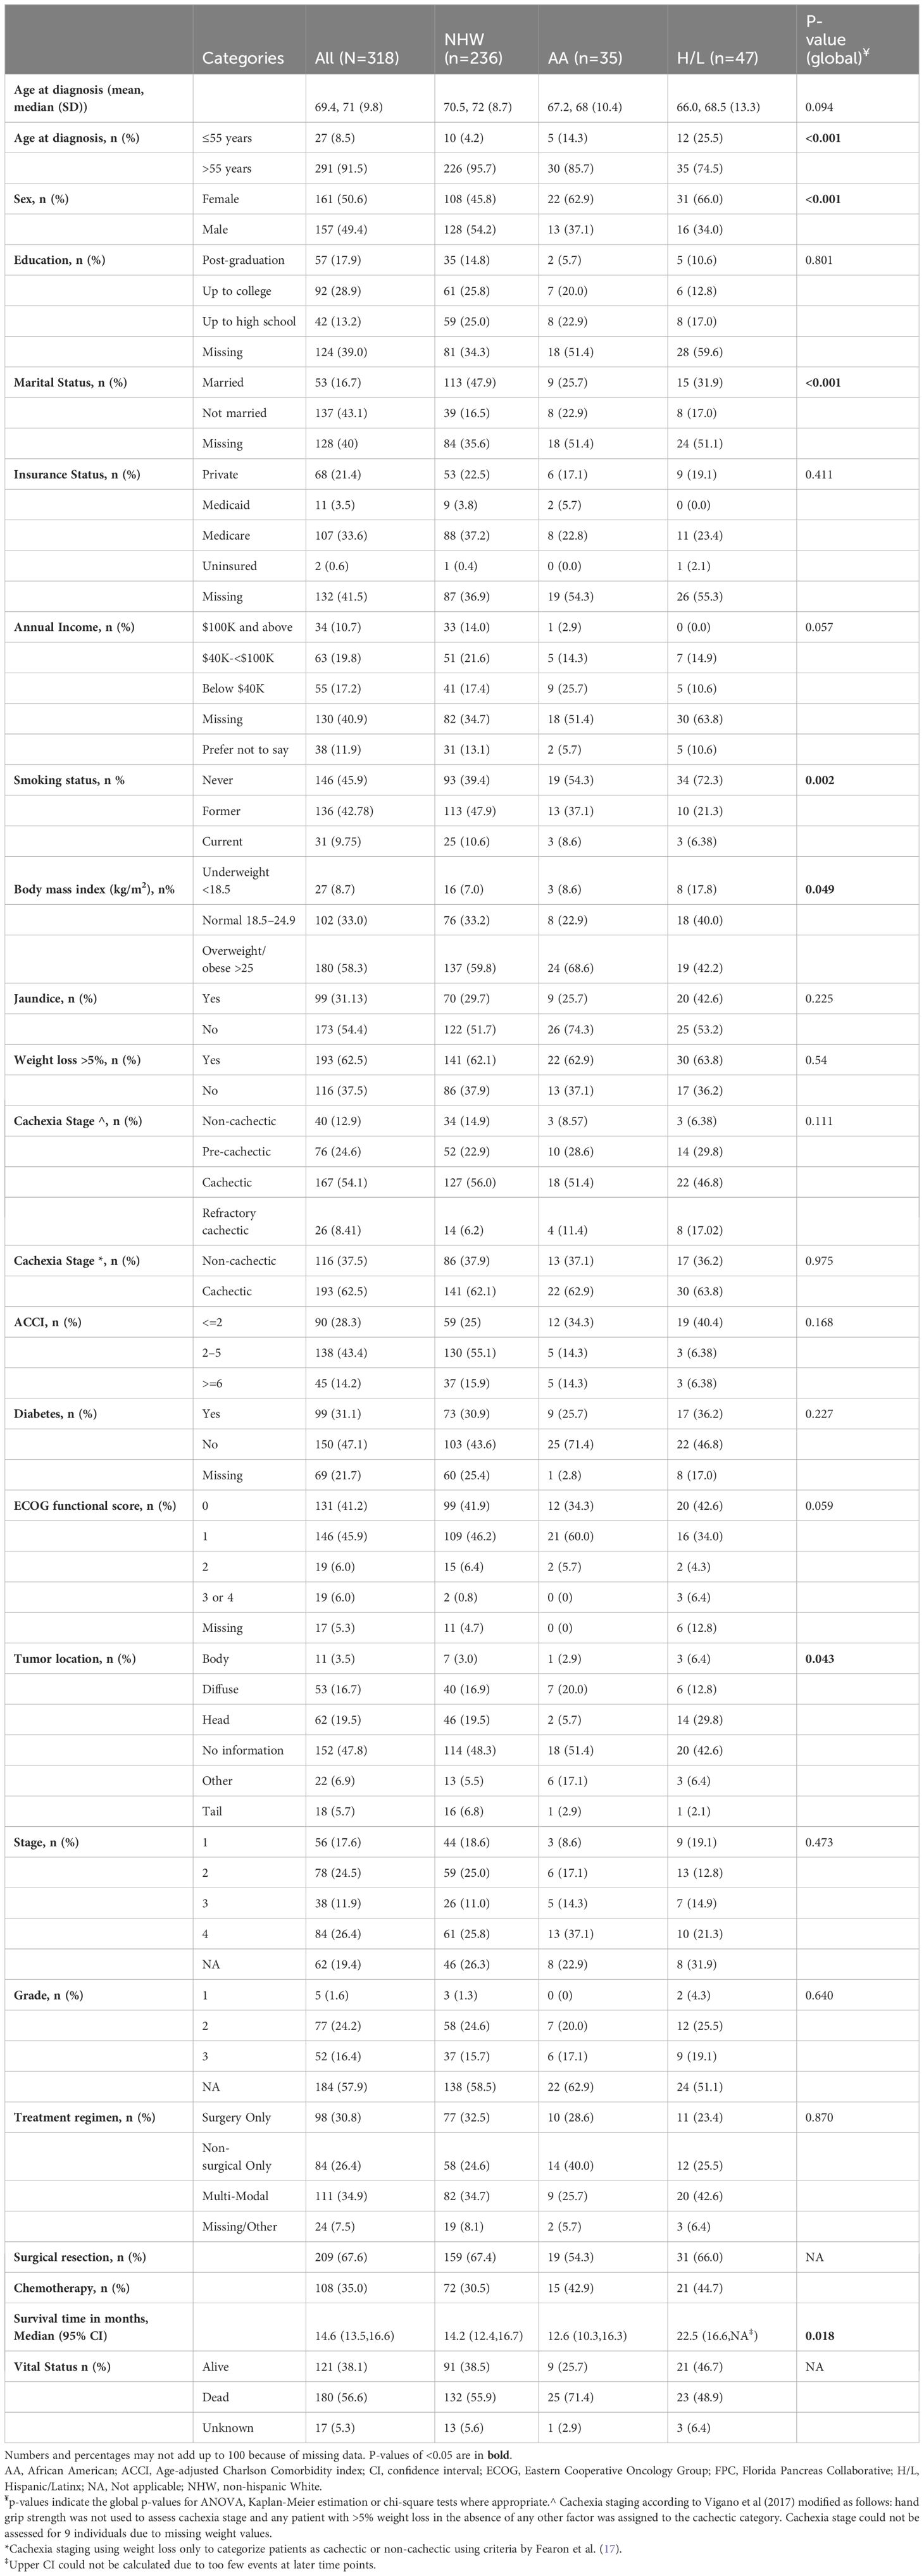
Table 2 Select characteristics of the FPC pancreatic ductal adenocarcinoma cohort at enrollment, by race and ethnicity (n=318).
Although no statistically significant differences were observed between racial and ethnic groups regarding their personal history of diabetes or the number of comorbidities, a slightly lower proportion of AA participants (34.3%) reported to be fully active/able to carry out pre-disease performance without restriction (ECOG performance status=0) at baseline compared to NHW (41.9%) and H/L (42.6%). Weight loss >5% over the prior 6 months was the most common presenting symptom across all racial and ethnic groups, affecting 62.5% of the cohort. Of cases with known tumor stage documented (n=256; 80.5%), 42.1% had stage I/II disease. When stratified by race and ethnicity, the highest proportion of stage III/IV cases was among AA (51.4%) followed by NHW (36.8%) and H/L (36.2%). Nearly 35% of cases underwent multimodal treatment (defined as receipt of curative-intent surgery and chemotherapy), with receipt of multi-modal treatment highest among H/L (42.6%) and lowest among AA (25.7%). Survival time was significantly longer among H/L (median 22.5 months, 95% CI: 16.6-unestimatable) compared to NHW (14.2 months 95% CI: 12.4–16.7) and AA (12.6 months 95% CI: 10.3–16.3) (P=0.016, log-rank test).
Cancer cachexia stage and status
CC status was determined for 309 (97.1%) of the 318 cases with available data. Using criteria from Vigano et al. (15), the prevalence of NCa, PCa, Ca, and RCa at enrollment was 12.9%, 24.6%, 54.1%, and 8.4%, respectively (Table 2; Supplementary Figure 2). Thus, approximately 87% of participants were deemed to have pre-cachexia, cachexia, or refractory disease at the time of diagnosis when using the five criteria (15). When using weight loss only to categorize participants as in (13), only 62.5% of individuals were classified as cachectic. More severe stages of CC were observed among males (NCa 10.5%; PCa 17.6%; Ca 62.1%; RCa 9.8%) than females (NCa 15.4%; PCa 31.4%; Ca 46.2%; RCa 7.5%). H/L had the highest proportion of cases with refractory cachexia at diagnosis (17%) followed by AA (11.4%) and NHW (6.2%), though these differences were not statistically significant (P=0.111, univariate chi square test) (Table 2). No associations between baseline BMI and CC stage at baseline were detected (data not shown).
Biochemical variables
The prevalence of the criterion variables used to categorize CC stage is in Table 3; Supplementary Figure 3. CRP was available in the EMR for only 7% of study participants. We therefore used blood from a subset of participants [n=202; 14.6% AA, 66% NHW, 19.4% H/L)] who donated it for serum processing (46) and evaluated CRP levels using a multiplex panel (Supplementary Methods). As expected, the prevalence of abnormal CRP (>10 mg/L) was higher in the RCa cohort (53.8%) compared to 0% of NCa, 25% of PCa, and 16.7% of Ca cases, with statistically significant differences (P<0.001) in CRP levels between CC stages. WBC levels >11,000/mL increased with CC severity, and were observed in 11.8%, 13.17%, and 34.62% of PCa, Ca, or RCa cases, respectively (P=0.0008). Similar to the higher prevalence of abnormal CRP levels among cases classified as PCa compared to Ca, abnormal albumin levels (<3.2 mg/dl) were more common in cases with PCa (11.84%) versus Ca (6.59%). Using a <3.2 mg/dl threshold to identify patients with PCa or Ca appeared to be more sensitive than the lower threshold of albumin (<2.5 mg/dl) used by Vigano et al. (15). Abnormal HgB levels were more prevalent in males than females across the CC continuum, affecting nearly two-thirds of patients classified as having refractory disease. The prevalence of abnormal HgB levels was highest among RCa cases followed by PCa and Ca (P=0.0418 for females, P=0.0007 for males). Laboratory values not considered by Vigano et al. (15) that were significantly different between CC stages using a Cochrane-Armitage trend test included NLR (P=0.0365), GPS (P=0.0059) and bilirubin (P<0.001).
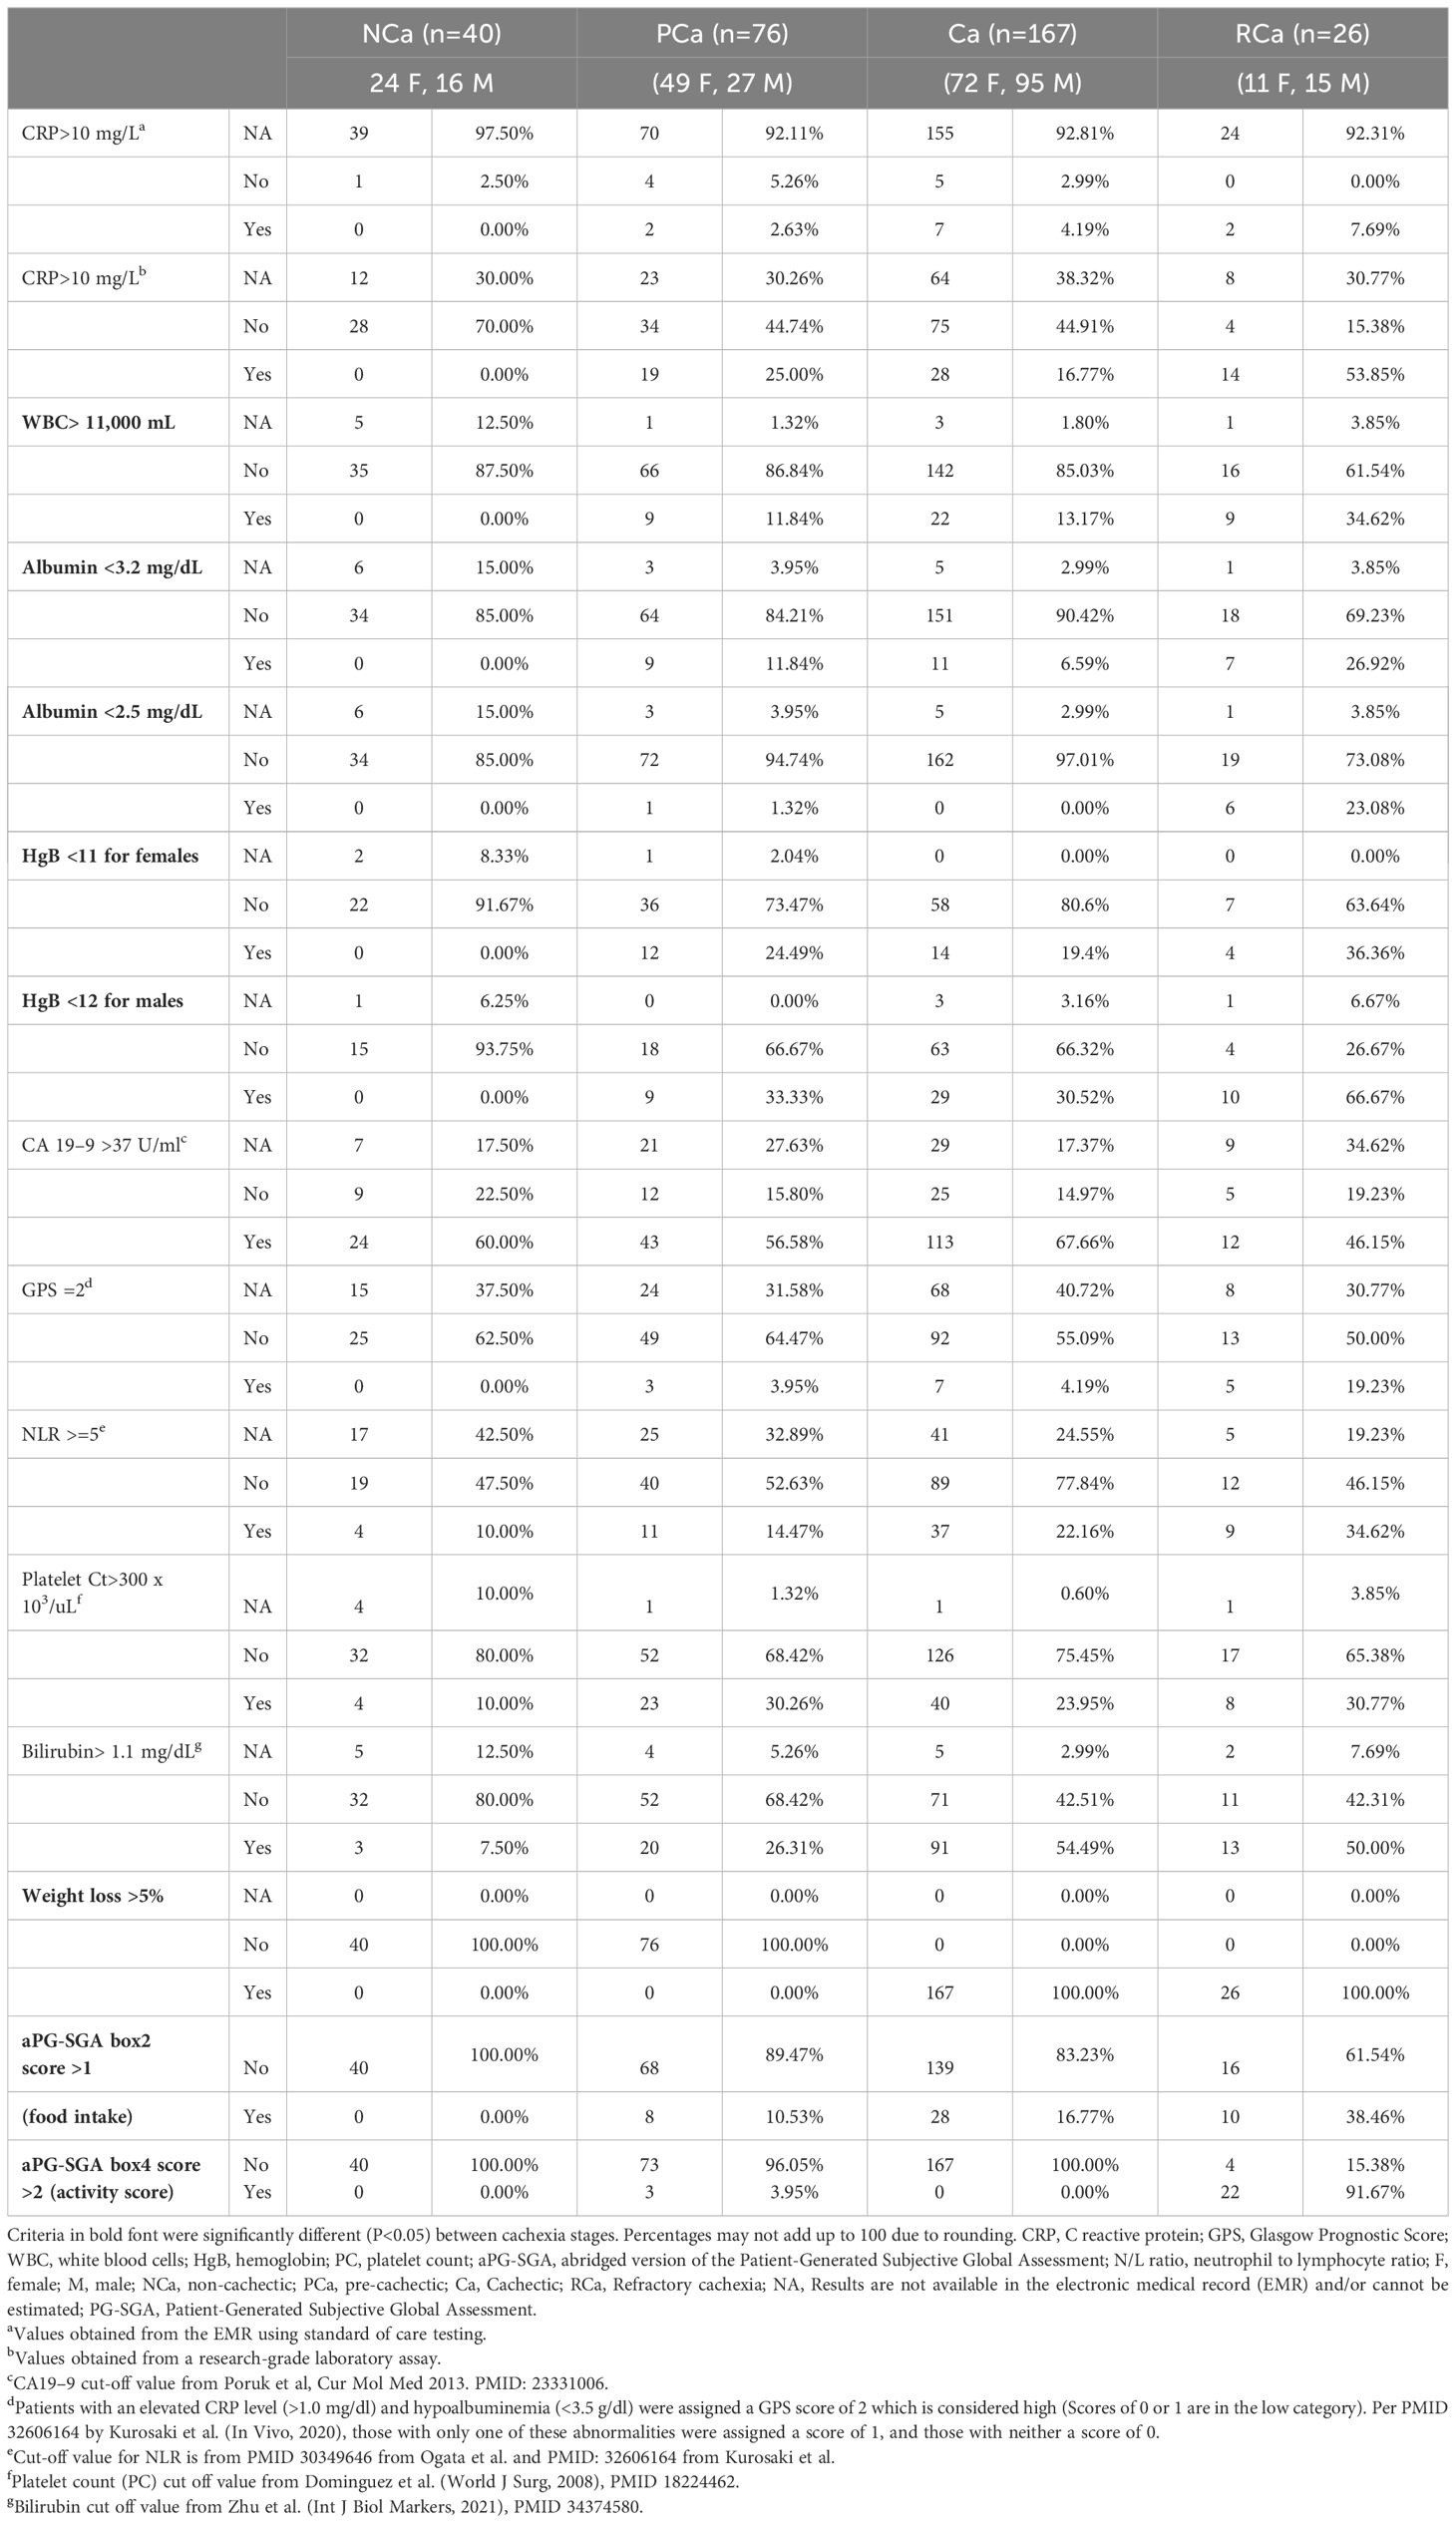
Table 3 Prevalence of criteria considered for cancer cachexia stage classification at baseline in the FPC PDAC cohort.
An exploratory evaluation of biomarker levels by race and ethnicity and CC status revealed AA patients were significantly more likely to present with normal CA19–9 levels than other racial and ethnic groups regardless of CC status (Supplementary Table 1), in line with other studies (83). NLR was also more likely to be in the low/normal category among AA, especially among those with CC, with P=0.051. Finally, bilirubin levels were more likely to be abnormal among AA patients with cachexia than patients in the other racial and ethnic groups.
Nutritional and functional variables
Nearly two-thirds of the 309 cases (n=193; 83 women,110 men) reported loss of >5% of their body weight in the 6 months prior to their diagnosis and were classified as having Ca or RCa (Tables 2, 3). Decreased food intake (aPG-SGA box 2 score >1) was observed in approximately 15% of cases (n=46) and was most prevalent among those with RCa. Reduced activities and functioning (aPG-SGA box 4 score >2) was reported in 8.1% of cases overall and in nearly 92% of the RCa cases (Table 3). No statistically significant differences were observed by race and ethnicity for weight loss, food intake, or activities/functioning. Of 178 participants who completed questions about hand-grip strength, 148 (83.1%) responded “not at all” to challenges related to hand or finger grip strength, 28 individuals reported having “a little” or “quite a bit” of challenges, and only 2 individuals (with RCa) reported challenges as “very much.” Concordance between self-reported grip strength and dynamometer measurements is unclear.
Symptom burden, supportive care needs, and HRQoL
Symptom burden, which includes symptom type, prevalence, and severity, is summarized overall and by sex and race and ethnicity in Supplementary Table 2, Supplementary Figure 4. At baseline, physical and psychological symptom sub-scores were moderate to severe in 43 (14.1%) and 82 (26.9%) of all participants, respectively. The total symptom score was moderate to severe in 19% of cases (n=58). The most commonly-reported physical symptoms across all racial and ethnic groups included fatigue (n=145, 45.5%), loss of appetite (n=108, 35.4%), pain (n=85, 27.9%), and drowsiness (n=68, 22.3%). Of psychological symptoms, anxiety (n=104, n=34.1%) and depression (n=67, 22.0%) were the most frequently reported. While the mean physical subscore was significantly higher among cases with stage III/IV versus stage I/II disease (2.07 versus 1.61, P=0.0354), the median psychological subscore did not differ by stage (P=0.7211) (data not shown). Physical and psychological subscores tended to be higher among females compared to males, though they were not statistically different. More severe anxiety was reported at a higher frequency among females compared to males (P=0.011) and at a lower frequency among AA compared to H/L and NHW (P=0.0346). The prevalence of moderate to severe nausea was significantly higher among H/L and AA participants compared to NHW. Importantly, evaluation of changes in symptom burden over the first 6 months post-diagnosis showed that while mean “tiredness/fatigue” scores nominally increased, “anxiety” and overall psychological scores decreased (Supplementary Table 3).
The problems and supportive care needs reported by participants at baseline are in Supplementary Table 4, Supplementary Figure 5. Of 314 participants who completed the Canadian Problem Checklist, emotional concerns ranked first by 177 cases (56.4%) who expressed fears, worries, frustration, and anger. Physical changes involving sleep and weight were the next most frequently cited concerns affecting 46.5% of patients followed by informational concerns (n=130, 41.4%) related to understanding their illness and/or treatment options. No statistically significant differences in concerns were evident when comparing participants by sex or race and ethnicity. Assessment of supportive care needs over the first 6-month time-period revealed significant changes in all major categories (Emotional, Physical, Spiritual, Practical, Informational and Social) when compared to the “None” category (Supplementary Table 5), with significant trends downwards. In contrast, concerns related to concentration/memory, frustration/anger, and worries about changes in appearance increased over time.
HRQoL was evaluated by 180 of 318 PDAC cases. “Tiredness”, “worry”, and “pain” were the main symptoms experienced using the QLQ-30 (Figure 1A). Stratification by cachexia status further demonstrated that all functional domains and overall HRQoL significantly worsen as cachexia stage progresses (Figure 1B). The distribution of responses to QLQ-PAN26 items plus two items concerning grip strength is shown overall and by cachexia stage in Figures 1C, D. The extent of pain, restrictions in the type and amount of food, and weight loss negatively affected HRQoL, especially among AA and H/L. H/L also reported fewer/less severe side effects from treatment than NHW and AA. Evaluation of responses to the QLQ-PAN26 over time indicates that the “most improved” symptoms are “food taste”, “treatment side effects”, “limited in doing planned activities” and “information from healthcare providers,” each with 56.14% of participants reporting improvements (Supplementary Table 6). Conversely, 42.11% and 47.37% of patients reported a deterioration in HRQoL from “back pain” and “pain at night” respectively. Joy from intimacy, abdominal bloating, and digestive issues worsened for a significant proportion of participants.

Figure 1 EORTC and PAN-26 heath-related quality of life (HRQoL) variables differ significantly based on cachexia stage at baseline. (A) Bar graph depicting mean of the EORTC QLQ30 scaled to 100 and colored by either EORTC domain (if a multi-item domain) or single-item (if item is part of a single-item domain). (B) Bar graph depicting mean scaled EORTC QLQ 30 domain and the overall QoL and health rating stratified by cachexia stage. Brackets indicate p<0.05 between RCa and all other categories (ANOVA). (C) Frequency of scores (“not at all”, “a little”, “quite a bit”, very much”) at baseline for the PAN-26 HRQoL questionnaire. (D) Frequency of scores of the 5 PAN-26 variables which were found to be significantly different by cachexia stage at baseline.
Predictors of higher symptom burden, supportive care needs, HRQoL, and CC status
MCA (78) of symptom burden, supportive care needs, and HRQoL variables indicated that ~36% of variability was explained by dimensions 1 and 2. ESAS-r categories of pain, appetite, and tiredness/fatigue explained most of the variability along dimension 1, PAN-26 symptom “Gas” explained the majority of variability along dimension 2, and ESAS-r scores for anxiety and depression were explanatory for both dimensions (Supplementary Figure 6). Interestingly and perhaps because physical symptoms may arise from varying clinical sequelae, clustering was only observed in the ESAS-r psychological domain. Binomial regression indicated male sex was negatively associated with an ESAS-r “tiredness” score of >=4 (P=0.03, OR=0.44;CI:0.21,0.90) and an “anxiety” score of >=4 (OR=0.39; 95%CI:0.15,0.95, P=0.045), and positively associated with high bilirubin (P=0.001, OR=2.18; 95%CI:1.06,4.59). Cachexia status was also associated with fatigue, although CIs were wide. Interestingly, patients with a GPS score of >1 were less likely to report “Gas” as a burden (OR=0.158; 95%CI:0.02,0.90, P=0.046). When CC status was modeled via ordinal regression using clinicopathological and demographic predictor variables, we found a significant association between CC status and GPS score >1 (P=0.030; OR=3.67; 95%CI:0.87,12.22). Male sex and late-stage disease also approached significance (P=0.13 and 0.065 respectively). Variance inflation factors were <2 (data not shown).
Associations between key covariates and OS
The median OS of the PDAC cohort was 14.6 months (95% CI: 13.5–16.6 months), with surgical patients having better OS than patients not receiving surgery. Females had slightly longer OS than males, though differences did not reach statistical significance (log-rank P=0.08) (Figure 2A). Kaplan Meier curves portrayed that race and ethnicity influenced OS, with H/L having significantly improved survival (HR: 0.57, 95% CI: 0.36–0.89) compared to NHW and AA (Figure 2B). AA had the poorest survival (HR:1.22, 95% 0.79–1.87), but survival time was not statistically different from NHW (P=0.37). Kaplan Meier curves for the four CC stages (15) are in Figure 2C and showed a significant difference (log-rank P=0.0034) between the stages. As expected, those with RCa had the poorest survival (HR: 3.24; 95% CI: 1.63–6.44, log-rank P=0.003) and those with NCa experienced the best survival. No significant differences in survival were observed between the PCa and Ca groups; Ca (HR: 1.87 CI: 1.07–3.28) but not PCa (HR: 1.50 CI: 0.82–2.75) was significantly associated with mortality in univariate analysis. Cachexia status [e.g., cachectic vs non-cachectic using the sole criteria of weight loss over 6 months (13)] also showed significant differences (log-rank test P=0.011) (Figure 2D), with cachectic participants having poorer survival on univariate analysis (HR: 1.51, 95% CI: 1.10–2.09). Although a formal analysis of survival for biological sex stratified by race and ethnicity was not performed due to small sample sizes for minorities, we did note an increase in median survival for females for both H/L (female median=34.8 months vs male median=16.6 months) and NHW (female median=16.1 months vs male median=13.5 months) but not AA (female median=12.4 months vs male median=14.9 months) racial and ethnic groups.
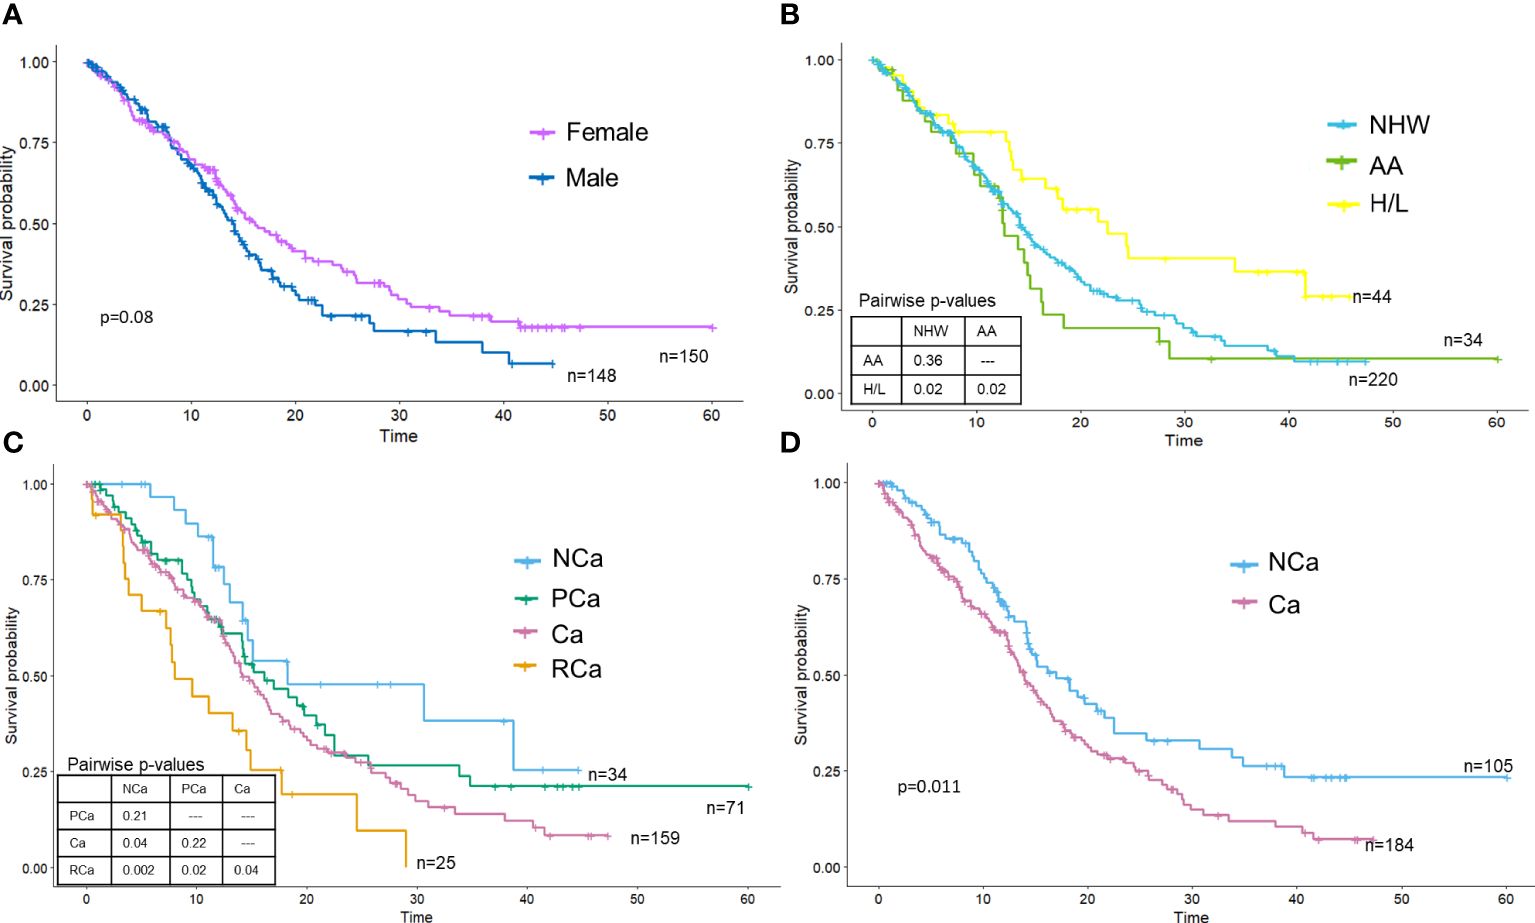
Figure 2 Overall survival is significantly different by race and ethnicity and cachexia stage. Kaplan-Meier survival curves were plotted and stratified by (A) sex, (B) race and ethnicity, (C) cachexia stage (Vigano criteria) or (D) cachexia stage (Fearon criteria).
Finally, based on findings of univariate analysis we performed PH modeling of OS using cachexia status, biological sex, race and ethnicity (NHW as reference), stage (III/IV vs I/II), GPS (>=2 or <2), NLR (high versus low), and age (early versus late-onset) as predictor variables. Our preliminary model indicated that only cachexia status (HR: 1.82, 95% CI: 1.09–3.0, P=0.021), stage (HR: 2.53, 95% CI: 1.39–4.61, P=0.0002) and GPS (HR:2.48, 95% CI: 1.03–5.96, P=0.01) were significantly associated with survival (Figure 3A). When including treatment status (multi-modal versus single therapy), only stage and GPS predicted survival, and upon further interrogation as expected single-therapy treatment status (e.g., palliative/systemic chemotherapy) was highly associated with stage III/IV unresectable disease (P<0.001). In a final more parsimonious PH model, cachectic status, late stage, and a high GPS were all associated with decreased survival times; NLR was not significant in the final model (Figure 3B).
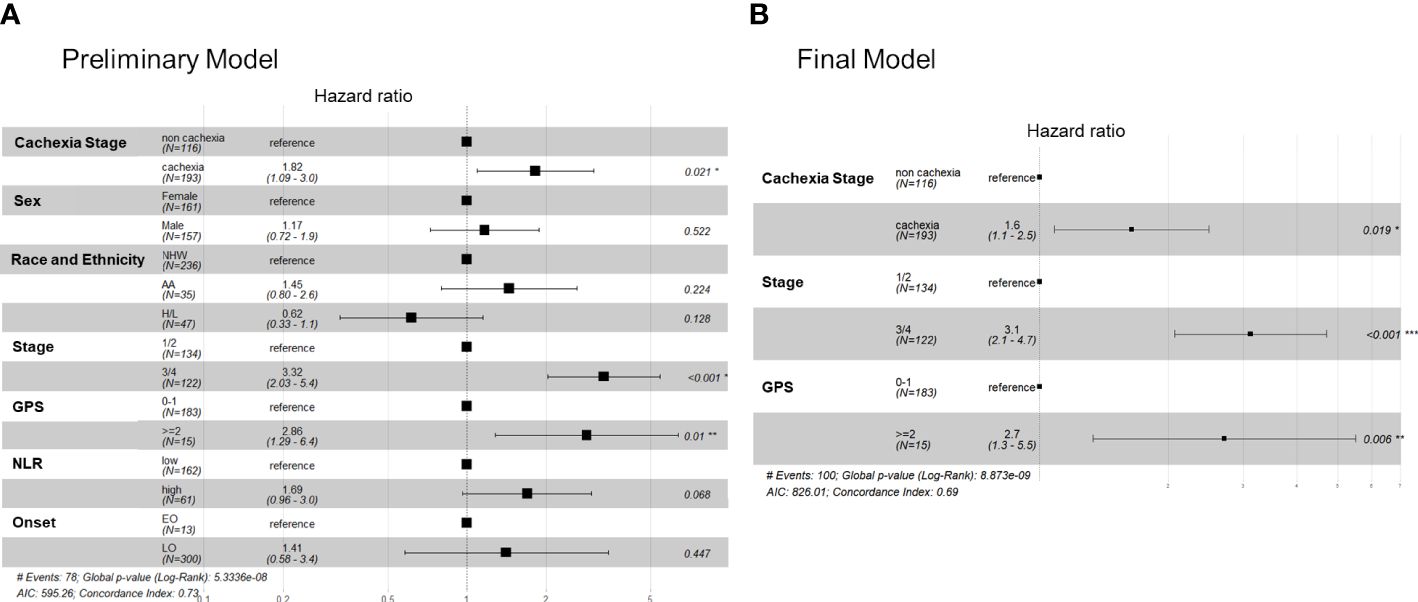
Figure 3 Cox proportional hazards models showing the association between key covariates and overall survival in the FPC cohort. Forest plots for the (A) preliminary (full) cox survival model (without the treatment variable) and (B) the finalized model.
Discussion
Early recognition and management of CC among individuals diagnosed with PDAC stem from the mission to improve treatment tolerability, optimize QoL, and prolong OS. To date, studies of PDAC-associated CC have been limited by: the varying definitions of CC used; the lack of racially and ethnically diverse populations studied; the retrospective or cross-sectional designs, and different endpoints evaluated, with a paucity of studies including QoL as a primary endpoint despite evidence-based guidance (22). To develop a consensus classification system for PDAC cachexia, clinical validation must occur via prospective studies with well-defined cohorts and clearly stated outcomes. The current multi-institutional study of PDAC is the first in the US we know of to publish on data obtained longitudinally from a diverse cohort as part of routine assessments to classify CC stage along its continuum and identify factors predictive of higher symptom burden, supportive care needs, QoL, and OS.
When using clinical, nutritional, and functional CC criteria recommended by Vigano and colleagues (15), nearly 25% of PDAC cases were classified as having pre-cachexia, 54.1% had cachexia, and 8.4% had refractory disease. In line with existing data (20, 26, 45, 84–89), a higher prevalence and severity of CC and slightly worse survival was observed in males. The estimate of pre-cachexia overall (25%) is higher than that reported in a study of unresectable PDAC by Wesseltoft-Rao and colleagues (27) which estimated the prevalence of pre-cachexia [using the classification by Fearon et al. (13)] to be 15% (27). The prevalence of cachexia was 60% among patients in that study (27). Using the sole criterion of weight loss over the prior 6 months to categorize participants as cachectic or non-cachectic as in Fearon et al. (13), 62.5% of individuals in our study were classified as cachectic. This estimate aligns with studies of PDAC-associated cachexia which categorized participants as cachectic or non-cachectic using weight loss only. For example, in a retrospective evaluation of 977 PDAC patients seen over an 8-year time-period at Kaiser Permanente (26), 63% of patients were diagnosed with cachexia (defined as weight loss >5% over the 6 months prior to diagnosis), regardless of stage. In a cohort of 227 patients with resectable PDAC (24), the prevalence of cachexia at the time of resection was 40% (defined as unintended weight loss greater than 10% of the pre-illness stable body weight). Had weight loss >5% been considered (24), the prevalence would have been 60.8%. Although weight loss assessment was evaluated in our study using self-report, short- and long-term patient-reported weight history has demonstrated validity and reproducibility compared to measured body weight (90–92). Since weight loss may serve as a marker of systemic disease, our findings and that of others suggest weight should be assessed at baseline and actively monitored throughout the patients’ cancer journey to assess early weight loss. Notably, there was a high correlation (r=0.98) between self-reported weight and objectively-measured weight at baseline among FPC participants.
Consistent with a retrospective analysis of PDAC (26), gastroesophageal and colorectal cancers (45), and lung cancers (93), there was a higher prevalence of CC at diagnosis in AA compared to NHW. However, to our knowledge, this is the first report of PDAC cases to show that H/L had a trend towards a higher prevalence of CC (and RCa in particular) yet longer survival compared to NHW and AA. Studies from other cancer types have also reported a higher prevalence of CC at diagnosis among H/L compared to NHW (45, 93, 94). Social determinants of health such as access to private insurance, education level, and income do not appear to influence racial and ethnic differences in CC prevalence or survival in our cohort. Furthermore, significant differences in tumor stage and treatment regimen received were not observed between the racial and ethnic groups. The greater cachexia prevalence in minority groups may therefore depend on social support, environmental, biological, or other constructs and mechanisms not yet evaluated. Indeed, chronic stress weathering has been highlighted as a potential factor in minority health disparities (95). The state of Florida is one of the lowest performing states (ranks number 44) in terms of health care access and affordability (96). Indeed, the proportion of FPC PDAC cases who reported on household income in the lowest bracket mimics that of cases state-wide using the Florida Cancer Data System. Taken together, the prevalence of the CC continuum (and PCa in particular) is very high at the time of PDAC diagnosis in our diverse and representative patient population, especially when using classification criteria from Vigano and colleagues (15).
In the FPC cohort, we found a significant difference in survival between the four stages of CC (15), with patients with refractory disease experiencing the worst survival and non-cachectic individuals experiencing the best survival. However, no significant differences in survival were observed between the PCa and Ca groups. Our findings align with studies of other cancers (10, 15, 18, 27, 97) which also did not find a significant difference in survival between pre-cachectic and cachectic patients. Explanations for these findings have been suggested (15), and include heterogeneity in the pre-cachectic group since it may comprise patients at high risk for cachexia as well as those already in an early cachectic phase. It is also possible that imprecision lies in subjective recall of weight changes, food intake, or activities, and that monitoring changes in these criteria over time using more objective measures may be required to discriminate further between these two stages. Nevertheless, in our study and that of Vigano et al. (15), non-cachectic cases lived longer and had a different prevalence of biochemical, nutritional, and functional variables than pre-cachectic individuals, suggesting that PCa status identified patients with forthcoming cachexia (27). We therefore contend that: classification of PCa is clinically relevant, this group is a prime target for intervention, and opportunities exist to better educate clinicians about how to identify and manage cachexia (98–100).
We found statistically significant differences between CC stages in the prevalence of WBC counts and CRP, albumin, and HgB levels, with the most abnormal values in patients with RCa. However, abnormal CRP, albumin, and HgB levels were more frequently reported among patients with PCa versus those with Ca. Of note, CRP was not routinely available in the EMR of FPC PDAC cohort participants; CRP merits evaluation at baseline and throughout treatment. Furthermore, because significant differences were identified between CC stages for NLR, GPS, and bilirubin, these markers should be considered in future longitudinal studies.
Nutritional and functional variables have not been considered in most existing studies of PDAC-associated cachexia. Although patients may purposely alter their diets and naturally lose weight after a cancer diagnosis (101, 102), decreased food intake was observed in approximately 15% of cases and was most prevalent among those with RCa, as in other studies (15). Although the aPG-SGA tool does not assess actual food intake, self-report of a “less than usual intake” has been shown to estimate reduced intake <1500 kcal/day (103, 104) and is far less time-consuming for a patient to complete compared to a daily dietary record. A reduced score for activities and functioning was reported in 8.1% of the subjects overall. Taken together, uniform, easy to use, cost-effective, accurate and objective methods to improve assessment of food intake and functioning could be valuable for cachexia monitoring and treatment.
Evaluating symptom burden and supportive care needs is crucial to mitigate physical and psychological comorbidities early and improve coping and treatment compliance (105). However, to our knowledge, few studies have been published on the routine collection of PRO among patients with PDAC-associated cachexia throughout the course of diagnosis and treatment. Based on self-report, at baseline physical and psychological symptoms were moderate to severe in 14.1% and 26.9% of all cohort participants, respectively. Consistent with published data (19), the most frequently reported physical symptoms included fatigue, loss of appetite, and pain, and the most common psychological symptoms were anxiety and depression. In our study, symptom intensity tended to be higher among females compared to males, in line with prior research (77). We also found that anxiety was reported at a significantly lower frequency among AA compared to H/L and NHW. The most commonly-reported problems and supportive care needs reported at baseline were emotional concerns related to fears and worries and physical changes involving sleep and weight. Fears and worries were also the highest-ranking problem amongst cancer patients in a study by Cuthbert and colleagues (105). Trends upwards over time were observed for physical concerns related to concentration/memory and emotions related to frustration/anger. Taken together, despite implementation of routine collection of PROs at cancer centers, these data underscore a call to action for early and ongoing assessment and interventions to address physical and psychological symptoms and supportive care needs and potentially other parameters including financial toxicity in real time to improve care delivery and QoL for patients with PDAC. Furthermore, given that only ~30% of PDAC patients receive early palliative care referral at end-of-life, this study provides support for the adoption of early supportive care models regardless of disease stage (106).
HRQoL evaluated by the EORTC QLQ-30/PAN26 has been found to be understandable and relevant among clinicians and patients with locally advanced or metastatic PDAC (107). These instruments revealed “tiredness”, “worry”, and “pain” as the main symptoms experienced by the FPC cohort, with symptoms significantly worsening with more advanced CC stages. The extent of pain, restrictions in the type and amount of food, and weight loss negatively affected HRQoL, especially among AA and H/L. Indeed, studies suggest race and ethnicity may influence the way functional limitations and well-being are perceived and reported (108, 109). Evaluation of responses to the more specific QLQ-PAN26 over time showcased 42.11% and 47.37% of patients reported worsening of “back pain” and “pain at night” respectively. Significant worsening in pain, abdominal discomfort, and sexual dissatisfaction was also reported in a study of PDAC patients 5 years post pancreatoduodedenctomy (110). Abdominal and back pain are among the most common symptoms of PDAC (and often serve as an indicator of unresectability and/or recurrence) (19, 111–114), with a recent report suggesting that approximately 75% of PDAC patients experience pain, and >50% of them have cachexia (115) The pathophysiology of pain in PDAC is complex and multifactorial and may be attributed to tumor invasion, pancreatic enzyme insufficiency, obstruction of ducts, and/or nerve involvement due to entrapment or infiltration of the dense network of nerves around the pancreas (111, 114, 116). Strategies for pain management include pancreatic enzyme therapy (for exocrine insufficiency) and range from acetaminophen and non-steroidal anti-inflammatory drugs and opioids to radiation therapy, neurolysis, intrathecal drug delivery, and integrative approaches such as nutraceuticals, acupuncture, and exercise physiotherapy (111, 114, 116), with some studies suggesting higher efficacy of earlier implementation of invasive treatment in reducing pain, preventing deterioration in QoL, and lengthening overall survival (116, 117). Our findings emphasize the critical need for timely and continued supportive care in the short and long term for all patients with PDAC to help decrease ongoing cancer-related pain according to its severity and origin. Additionally, great merit exists in developing and testing additional interventions to improve pain in partnership with patients and in examining PROs before and after administration of interventions.
Despite the study strengths, there are limitations and opportunities we are addressing with further research. Although data support the use of dual-energy X-ray absorptiometry (DXA) and computed tomography (CT) to evaluate lean body mass (118) and the loss of muscle mass and strength that occurs with age (e.g., sarcopenia) and in the presence of PDAC (119), Vigano et al. (15) did not incorporate these metrics into their CC criteria, likely due to the lack of implementation research to showcase incorporation of body composition analysis in real-time clinically. The FPC cohort does have longitudinally collected CT images and will be reporting on measures of muscle mass and quality and adiposity at baseline and changes over time in the future. Another opportunity for CC research is the discovery and validation of novel blood-based biomarkers that could aid in diagnosing earlier stages of CC, identifying patients at increased risk for treatment-related toxicities, and monitoring therapeutic effects. We are finalizing analysis of longitudinally collected serum samples from FPC cohort participants to evaluate cytokines, adipokines, chemokines, and other analytes. It is our intent to incorporate CT body composition data and novel serum biomarker data with data described in this study to assess their added value in improving prediction of CC stage (and pre-cachexia in particular) QoL, and survival.
In summary, our study demonstrated that classification based on data available in routine clinical practice can be leveraged to identify and characterize the presence and severity of cachexia and predict several endpoints in patients with PDAC. When compared to the NCa stage, PCa, Ca, and RCa were indeed associated with significant differences in clinical, nutritional, and functional measures and in outcomes across sexes and racial and ethnic groups. Pre-cachexia is difficult to identify but here, using the Vigano criteria (15), we identify 76/309 patients (24.6%) as pre-cachectic. This represents a significant number of people who could be targeted for early intervention. However, we fully acknowledge future longitudinal studies and objective measures may be needed to more accurately distinguish between pre-cachexia and cachexia and enable more timely and personalized interventions for patients with PDAC. Our findings support guidance from key stakeholders in the PDAC and cachexia community (19, 21, 22, 114, 120) which recommend a multidisciplinary approach inclusive of symptom management, nutrition and pharmacologic intervention, physical therapy, psychosocial support, resistance training, and targeted therapeutic agents. Based on our findings, management of pain should be addressed as early as possible to improve QoL. We also suggest that multidisciplinary care, especially referrals to a registered dietitian and supportive care team, occur pre-emptively for all patients with PDAC, regardless of weight loss, so they can be assessed for their appetite, nutritional intake, exocrine insufficiency, and hormonal and micronutrient deficiencies. Studies by members of our team also support the feasibility, acceptability, usability, and preliminary efficacy of remote nutrition and exercise monitoring interventions in cancer survivorship (121–127).
Data availability statement
The raw data supporting the conclusions of this article will be made available by the authors, without undue reservation.
Ethics statement
The studies involving humans were approved by Advarra Institutional Review Board. The studies were conducted in accordance with the local legislation and institutional requirements. The participants provided their written informed consent to participate in this study. Written informed consent was obtained from the individual(s) for the publication of any potentially identifiable images or data included in this article.
Author contributions
JP: Conceptualization, Data curation, Formal analysis, Funding acquisition, Methodology, Writing – original draft, Writing – review & editing, Investigation, Resources, Supervision. MP: Data curation, Formal analysis, Methodology, Writing – original draft, Writing – review & editing, Conceptualization, Visualization. D-TC: Formal analysis, Methodology, Writing – review & editing. TB: Data curation, Project administration, Writing – review & editing. BP: Writing – review & editing. CG: Writing – review & editing. KD: Data curation, Project administration, Writing – review & editing, Supervision. MG: Data curation, Project administration, Writing – review & editing. SV: Data curation, Project administration, Writing – review & editing, Formal Analysis. TBi: Writing – review & editing. EC: Writing – review & editing, Data curation, Project administration. SC: Writing – review & editing. MG-D: Data curation, Project administration, Writing – review & editing. BG: Writing – review & editing. AG: Writing – review & editing. CGr: Writing – review & editing. SH: Writing – review & editing. KJ: Writing – review & editing. BK: Data curation, Writing – review & editing. VV: Writing – review & editing. JG: Writing – review & editing. AM: Data curation, Writing – review & editing. QM: Writing – review & editing. LM-U: Data curation, Writing – review & editing. SM: Writing – review & editing. NP: Writing – review & editing. SR: Writing – review & editing. GR: Writing – review & editing. AS: Writing – review & editing. LS: Writing – review & editing. PS: Writing – review & editing. KT: Writing – review & editing, Data curation. AT: Writing – review & editing. JT: Writing – review & editing. DT: Writing – review & editing, Data curation. KT: Writing – review & editing. SVa: Writing – review & editing. CW: Writing – review & editing. WD: Writing – review & editing. VV: Writing – review & editing. AK: Writing – review & editing. AL: Writing – review & editing. KM: Writing – review & editing. MM-V: Writing – review & editing. KH: Writing – review & editing. JA: Writing – review & editing. MB: Writing – review & editing. JT: Funding acquisition, Writing – review & editing, Conceptualization. NM: Writing – review & editing. JPi: Writing – review & editing. PH: Writing – review & editing. MM: Writing – review & editing. JF: Writing – review & editing. SJ: Conceptualization, Methodology, Writing – original draft, Writing – review & editing. DJ: Conceptualization, Data curation, Writing – original draft, Writing – review & editing. AJ: Conceptualization, Methodology, Writing – original draft, Writing – review & editing.
Funding
The author(s) declare financial support was received for the research, authorship, and/or publication of this article. The research in this publication was supported in part by the James and Esther King Biomedical Research Program, Florida Department of Health (Grant #8JK02; awarded to JP and JT), the Department of Defense Health Program Congressionally Directed Medical Research Program (W81XWH-22–1-1021 LOG#PA210192; awarded to JP and JF), the Participant Research, Interventions, and Measurement (PRISM) Core, the Pharmacodynamics/Pharmacokinetics Core, and the Biostatistics and Bioinformatics Shared Resource at the H. Lee Moffitt Cancer Center & Research Institute, an NCI designated Comprehensive Cancer Center (P30-CA076292).
Acknowledgments
We thank our participants for their support and dedication to this project. We also thank the following FPC team members for their contributions to generating original data and/or data abstraction and entry: Karla N. Ali, Ziad Awad, Phillip Bao, Debashish Bose, Esther Katende, Jamii St. Julien.
Conflict of interest
The authors declare that the research was conducted in the absence of any commercial or financial relationships that could be construed as a potential conflict of interest.
Publisher’s note
All claims expressed in this article are solely those of the authors and do not necessarily represent those of their affiliated organizations, or those of the publisher, the editors and the reviewers. Any product that may be evaluated in this article, or claim that may be made by its manufacturer, is not guaranteed or endorsed by the publisher.
Author disclaimer
The content is solely the responsibility of the authors and does not necessarily represent the official views of the sponsors or the participating institutions.
Supplementary material
The Supplementary Material for this article can be found online at: https://www.frontiersin.org/articles/10.3389/fonc.2024.1362244/full#supplementary-material
References
1. Baracos VE, Martin L, Korc M, Guttridge DC, Fearon KC. Cancer-associated cachexia. Nat Rev Dis primers. (2018) 4:1–18. doi: 10.1038/nrdp.2017.105
2. Farkas J, von Haehling S, Kalantar-Zadeh K, Morley JE, Anker SD, Lainscak M. Cachexia as a major public health problem: frequent, costly, and deadly. J cachexia sarcopenia muscle. (2013) 4:173–8. doi: 10.1007/s13539-013-0105-y
3. Sun L, Quan X-Q, Yu S. An epidemiological survey of cachexia in advanced cancer patients and analysis on its diagnostic and treatment status. Nutr cancer. (2015) 67:1056–62. doi: 10.1080/01635581.2015.1073753
4. Bauer J, Capra S, Battistutta D, Davidson W, Ash S. Compliance with nutrition prescription improves outcomes in patients with unresectable pancreatic cancer. Clin Nutr (Edinburgh Scotland). (2005) 24:998–1004. doi: 10.1016/j.clnu.2005.07.002
5. Neuzillet C, Sauvanet A, Hammel P. Prognostic factors for resectable pancreatic adenocarcinoma. J Visc Surg. (2011) 148:e232–43. doi: 10.1016/j.jviscsurg.2011.07.007
6. Wigmore SJ, Plester CE, Richardson RA, Fearon KC. Changes in nutritional status associated with unresectable pancreatic cancer. Br J cancer. (1997) 75:106–9. doi: 10.1038/bjc.1997.17
7. Argilés JM, López-Soriano FJ, Toledo M, Betancourt A, Serpe R, Busquets S. The cachexia score (CASCO): a new tool for staging cachectic cancer patients. J cachexia sarcopenia muscle. (2011) 2:87–93. doi: 10.1007/s13539-011-0027-5
8. Argilés JM, Betancourt A, Guàrdia-Olmos J, Peró-Cebollero M, López-Soriano FJ, Madeddu C, et al. Validation of the CAchexia SCOre (CASCO). Staging cancer patients: the use of miniCASCO as a simplified tool. Front Physiol. (2017) 8:92. doi: 10.3389/fphys.2017.00092
9. Blum D, Omlin A, Fearon K, Baracos V, Radbruch L, Kaasa S, et al. Evolving classification systems for cancer cachexia: ready for clinical practice? Supportive Care Cancer Off J Multinational Assoc Supportive Care Cancer. (2010) 18:273–9. doi: 10.1007/s00520-009-0800-6
10. Blum D, Stene GB, Solheim TS, Fayers P, Hjermstad MJ, Baracos VE, et al. Validation of the Consensus-Definition for Cancer Cachexia and evaluation of a classification model–a study based on data from an international multicentre project (EPCRC-CSA). Ann Oncol. (2014) 25:1635–42. doi: 10.1093/annonc/mdu086
11. Bozzetti F, Mariani L. Defining and classifying cancer cachexia: a proposal by the SCRINIO Working Group. JPEN J parenteral enteral Nutr. (2009) 33:361–7. doi: 10.1177/0148607108325076
12. Evans WJ, Morley JE, Argilés J, Bales C, Baracos V, Guttridge D, et al. Cachexia: a new definition. Clin Nutr (Edinburgh Scotland). (2008) 27:793–9. doi: 10.1016/j.clnu.2008.06.013
13. Fearon K, Strasser F, Anker SD, Bosaeus I, Bruera E, Fainsinger RL, et al. Definition and classification of cancer cachexia: an international consensus. Lancet Oncol. (2011) 12:489–95. doi: 10.1016/S1470-2045(10)70218-7
14. Martin L, Muscaritoli M, Bourdel-Marchasson I, Kubrak C, Laird B, Gagnon B, et al. Diagnostic criteria for cancer cachexia: reduced food intake and inflammation predict weight loss and survival in an international, multi-cohort analysis. J cachexia sarcopenia muscle. (2021) 12:1189–202. doi: 10.1002/jcsm.12756
15. Vigano AAL, Morais JA, Ciutto L, Rosenthall L, di Tomasso J, Khan S, et al. Use of routinely available clinical, nutritional, and functional criteria to classify cachexia in advanced cancer patients. Clin Nutr (Edinburgh Scotland). (2017) 36:1378–90. doi: 10.1016/j.clnu.2016.09.008
16. Wallengren O, Lundholm K, Bosaeus I. Diagnostic criteria of cancer cachexia: relation to quality of life, exercise capacity and survival in unselected palliative care patients. Supportive Care Cancer Off J Multinational Assoc Supportive Care Cancer. (2013) 21:1569–77. doi: 10.1007/s00520-012-1697-z
17. Fearon KC, Voss AC, Hustead DS. Definition of cancer cachexia: effect of weight loss, reduced food intake, and systemic inflammation on functional status and prognosis. Am J Clin Nutr. (2006) 83:1345–50. doi: 10.1093/ajcn/83.6.1345
18. Vigano A, Del Fabbro E, Bruera E, Borod M. The cachexia clinic: from staging to managing nutritional and functional problems in advanced cancer patients. Crit Rev oncogenesis. (2012) 17:293–303. doi: 10.1615/CritRevOncog.v17.i3
19. Grossberg AJ, Chu LC, Deig CR, Fishman EK, Hwang WL, Maitra A, et al. Multidisciplinary standards of care and recent progress in pancreatic ductal adenocarcinoma. CA: Cancer J Clin. (2020) 70:375–403. doi: 10.3322/caac.21626
20. Permuth JB, Clark Daly A, Jeong D, Choi JW, Cameron ME, Chen DT, et al. Racial and ethnic disparities in a state-wide registry of patients with pancreatic cancer and an exploratory investigation of cancer cachexia as a contributor to observed inequities. Cancer Med. (2019) 8:3314–24. doi: 10.1002/cam4.2180
21. Hendifar AE, Petzel MQB, Zimmers TA, Denlinger CS, Matrisian LM, Picozzi VJ, et al. Pancreas cancer-associated weight loss. oncologist. (2019) 24:691–701. doi: 10.1634/theoncologist.2018-0266
22. Roeland EJ, Bohlke K, Baracos VE, Bruera E, Del Fabbro E, Dixon S, et al. Management of cancer cachexia: ASCO guideline. J Clin Oncol Off J Am Soc Clin Oncol. (2020) 38:2438–53. doi: 10.1200/JCO.20.00611
23. Wiegert EVM, de Oliveira LC, Calixto-Lima L, Mota ESLMSD, Peres WAF. Cancer cachexia: Comparing diagnostic criteria in patients with incurable cancer. Nutrition. (2020) 79-80:110945. doi: 10.1016/j.nut.2020.110945
24. Bachmann J, Heiligensetzer M, Krakowski-Roosen H, Büchler MW, Friess H, Martignoni ME. Cachexia worsens prognosis in patients with resectable pancreatic cancer. J gastrointestinal Surg Off J Soc Surg Alimentary Tract. (2008) 12:1193–201. doi: 10.1007/s11605-008-0505-z
25. Pausch T, Hartwig W, Hinz U, Swolana T, Bundy BD, Hackert T, et al. Cachexia but not obesity worsens the postoperative outcome after pancreatoduodenectomy in pancreatic cancer. Surgery. (2012) 152:S81–8. doi: 10.1016/j.surg.2012.05.028
26. Hendifar AE, Chang JI, Huang BZ, Tuli R, Wu BU. Cachexia, and not obesity, prior to pancreatic cancer diagnosis worsens survival and is negated by chemotherapy. J gastrointestinal Oncol. (2018) 9:17–23. doi: 10.21037/jgo
27. Wesseltoft-Rao N, Hjermstad MJ, Ikdahl T, Dajani O, Ulven SM, Iversen PO, et al. Comparing two classifications of cancer cachexia and their association with survival in patients with unresected pancreatic cancer. Nutr cancer. (2015) 67:472–80. doi: 10.1080/01635581.2015.1004728
28. Danai LV, Babic A, Rosenthal MH, Dennstedt EA, Muir A, Lien EC, et al. Altered exocrine function can drive adipose wasting in early pancreatic cancer. Nature. (2018) 558:600–4. doi: 10.1038/s41586-018-0235-7
29. Babic A, Rosenthal MH, Bamlet WR, Takahashi N, Sugimoto M, Danai LV, et al. Postdiagnosis loss of skeletal muscle, but not adipose tissue, is associated with shorter survival of patients with advanced pancreatic cancer. Cancer epidemiology Biomarkers Prev Publ Am Assoc Cancer Research cosponsored by Am Soc Prev Oncol. (2019) 28:2062–9. doi: 10.1158/1055-9965.EPI-19-0370
30. Di Sebastiano KM, Yang L, Zbuk K, Wong RK, Chow T, Koff D, et al. Accelerated muscle and adipose tissue loss may predict survival in pancreatic cancer patients: the relationship with diabetes and anaemia. Br J Nutr. (2013) 109:302–12. doi: 10.1017/S0007114512001067
31. Liao WC, Chen PR, Huang CC, Chang YT, Huang BS, Chang CC, et al. Relationship between pancreatic cancer-associated diabetes and cachexia. J cachexia sarcopenia muscle. (2020) 11:899–908. doi: 10.1002/jcsm.12553
32. Howlader N, Noone AM, Krapcho M, Miller D, Bishop K, Altekruse SF, Kosary CL, Yu M, Ruhl J, Tatalovich Z, Mariotto A, Lewis DR, Chen HS, Feuer EJ, Cronin KA eds. SEER cancer statistics review, 1975-2013. Bethesda, MD: National Cancer Institute (2016). Available at: http://seer.cancer.gov/csr/1975_2013/.
33. Rahib L, Smith BD, Aizenberg R, Rosenzweig AB, Fleshman JM, Matrisian LM. Projecting cancer incidence and deaths to 2030: the unexpected burden of thyroid, liver, and pancreas cancers in the United States. Cancer Res. (2014) 74:2913–21. doi: 10.1158/0008-5472.CAN-14-0155
34. Abraham A, Al-Refaie WB, Parsons HM, Dudeja V, Vickers SM, Habermann EB. Disparities in pancreas cancer care. Ann Surg Oncol. (2013) 20:2078–87. doi: 10.1245/s10434-012-2843-z
35. Chang KJ, Parasher G, Christie C, Largent J, Anton-Culver H. Risk of pancreatic adenocarcinoma: disparity between African Americans and other race/ethnic groups. Cancer. (2005) 103:349–57. doi: 10.1002/cncr.20771
36. Riall TS, Townsend CM Jr., Kuo YF, Freeman JL, Goodwin JS. Dissecting racial disparities in the treatment of patients with locoregional pancreatic cancer: a 2-step process. Cancer. (2010) 116:930–9. doi: 10.1002/cncr.24836
37. Singal V, Singal AK, Kuo YF. Racial disparities in treatment for pancreatic cancer and impact on survival: a population-based analysis. J Cancer Res Clin Oncol. (2012) 138:715–22. doi: 10.1007/s00432-012-1156-8
38. Wray CJ, Castro-Echeverry E, Silberfein EJ, Ko TC, Kao LS. A multi-institutional study of pancreatic cancer in Harris County, Texas: race predicts treatment and survival. Ann Surg Oncol. (2012) 19:2776–81. doi: 10.1245/s10434-012-2361-z
39. Murphy MM, Simons JP, Hill JS, McDade TP, Chau Ng S, Whalen GF, et al. Pancreatic resection: a key component to reducing racial disparities in pancreatic adenocarcinoma. Cancer. (2009) 115:3979–90. doi: 10.1002/cncr.24433
40. Zell JA, Rhee JM, Ziogas A, Lipkin SM, Anton-Culver H. Race, socioeconomic status, treatment, and survival time among pancreatic cancer cases in California. Cancer epidemiology Biomarkers Prev Publ Am Assoc Cancer Research cosponsored by Am Soc Prev Oncol. (2007) 16:546–52. doi: 10.1158/1055-9965.EPI-06-0893
41. Murphy MM, Simons JP, Ng SC, McDade TP, Smith JK, Shah SA, et al. Racial differences in cancer specialist consultation, treatment, and outcomes for locoregional pancreatic adenocarcinoma. Ann Surg Oncol. (2009) 16:2968–77. doi: 10.1245/s10434-009-0656-5
42. DeSantis CE, Siegel RL, Sauer AG, Miller KD, Fedewa SA, Alcaraz KI, et al. Cancer statistics for African Americans, 2016: Progress and opportunities in reducing racial disparities. CA: Cancer J Clin. (2016) 66:290–308. doi: 10.3322/caac.21340
43. Heller DR, Nicolson NG, Ahuja N, Khan S, Kunstman JW. Association of treatment inequity and ancestry with pancreatic ductal adenocarcinoma survival. JAMA Surg. (2020) 155:e195047. doi: 10.1001/jamasurg.2019.5047
44. Zhu F, Wang H, Ashamalla H. Racial and socioeconomic disparities in the treatments and outcomes of pancreatic cancer among different treatment facility types. Pancreas. (2020) 49:1355–63. doi: 10.1097/MPA.0000000000001688
45. Olaechea S, Sarver B, Liu A, Gilmore LA, Alvarez C, Iyengar P, et al. Race, ethnicity, and socioeconomic factors as determinants of cachexia incidence and outcomes in a retrospective cohort of patients with gastrointestinal tract cancer. JCO Oncol Pract. (2023), Op2200674. doi: 10.1200/OP.22.00674
46. Permuth JB, Dezsi KB, Vyas S, Ali KN, Basinski TL, Utuama OA, et al. The florida pancreas collaborative next-generation biobank: infrastructure to reduce disparities and improve survival for a diverse cohort of patients with pancreatic cancer. Cancers. (2021) 13:809. doi: 10.3390/cancers13040809
47. Gabrielson DK, Scaffidi D, Leung E, Stoyanoff L, Robinson J, Nisenbaum R, et al. Use of an abridged scored Patient-Generated Subjective Global Assessment (abPG-SGA) as a nutritional screening tool for cancer patients in an outpatient setting. Nutr cancer. (2013) 65:234–9. doi: 10.1080/01635581.2013.755554
48. Watanabe SM, Nekolaichuk C, Beaumont C, Johnson L, Myers J, Strasser F. A multicenter study comparing two numerical versions of the Edmonton Symptom Assessment System in palliative care patients. J Pain Symptom Manage. (2011) 41:456–68. doi: 10.1016/j.jpainsymman.2010.04.020
49. Ashbury FD, Findlay H, Reynolds B, McKerracher K. A Canadian survey of cancer patients' experiences: are their needs being met? J Pain Symptom Manage. (1998) 16:298–306. doi: 10.1016/S0885-3924(98)00102-X
50. Blais MC, St-Hilaire A, Fillion L, De Serres M, Tremblay A. What to do with screening for distress scores? Integrating descriptive data into clinical practice. Palliat Support Care. (2014) 12:25–38. doi: 10.1017/S1478951513000059
51. White JV, Guenter P, Jensen G, Malone A, Schofield M. Consensus statement: Academy of Nutrition and Dietetics and American Society for Parenteral and Enteral Nutrition: characteristics recommended for the identification and documentation of adult malnutrition (undernutrition). JPEN J parenteral enteral Nutr. (2012) 36:275–83. doi: 10.1177/0148607112440285
52. Martin L, Watanabe S, Fainsinger R, Lau F, Ghosh S, Quan H, et al. Prognostic factors in patients with advanced cancer: use of the patient-generated subjective global assessment in survival prediction. J Clin Oncol Off J Am Soc Clin Oncol. (2010) 28:4376–83. doi: 10.1200/JCO.2009.27.1916
53. Bruera E, Kuehn N, Miller MJ, Selmser P, Macmillan K. The Edmonton Symptom Assessment System (ESAS): a simple method for the assessment of palliative care patients. J palliative Care. (1991) 7:6–9. doi: 10.1177/082585979100700202
54. Howell D, Hack TF, Green E, Fitch M. Cancer distress screening data: translating knowledge into clinical action for a quality response. Palliative supportive Care. (2014) 12:39–51. doi: 10.1017/S1478951513000382
55. Roila F, Lupattelli M, Sassi M, Basurto C, Bracarda S, Picciafuoco M, et al. Intra and interobserver variability in cancer patients' performance status assessed according to Karnofsky and ECOG scales. Ann Oncol Off J Eur Soc Med Oncol / ESMO. (1991) 2:437–9. doi: 10.1093/oxfordjournals.annonc.a057981
56. Qu WF, Zhou PY, Liu WR, Tian MX, Jin L, Jiang XF, et al. Age-adjusted Charlson Comorbidity Index predicts survival in intrahepatic cholangiocarcinoma patients after curative resection. Ann Trans Med. (2020) 8:487. doi: 10.21037/atm
57. FCDSAa. Available online at: https://fcds.med.miami.edu/inc/statistics.shtml.
58. McMillan DC. The systemic inflammation-based Glasgow Prognostic Score: a decade of experience in patients with cancer. Cancer Treat Rev. (2013) 39:534–40. doi: 10.1016/j.ctrv.2012.08.003
59. Pointer DT Jr., Roife D, Powers BD, Murimwa G, Elessawy S, Thompson ZJ, et al. Neutrophil to lymphocyte ratio, not platelet to lymphocyte or lymphocyte to monocyte ratio, is predictive of patient survival after resection of early-stage pancreatic ductal adenocarcinoma. BMC cancer. (2020) 20:750. doi: 10.1186/s12885-020-07182-9
60. Nakamura Y, Watanabe R, Katagiri M, Saida Y, Katada N, Watanabe M, et al. Neutrophil/lymphocyte ratio has a prognostic value for patients with terminal cancer. World J Surg Oncol. (2016) 14:148. doi: 10.1186/s12957-016-0904-7
61. Menter DG, Kopetz S, Hawk E, Sood AK, Loree JM, Gresele P, et al. Platelet "first responders" in wound response, cancer, and metastasis. Cancer metastasis Rev. (2017) 36:199–213. doi: 10.1007/s10555-017-9682-0
62. Liu Y, Ge Y, Li Q, Ruan G, Zhang Q, Zhang X, et al. Association between platelet count with 1-year survival in patients with cancer cachexia. J Cancer. (2021) 12:7436–44. doi: 10.7150/jca.62788
63. Klocker EV, Barth DA, Riedl JM, Prinz F, Szkandera J, Schlick K, et al. Decreased activity of circulating butyrylcholinesterase in blood is an independent prognostic marker in pancreatic cancer patients. Cancers. (2020) 12:3868–76. doi: 10.3390/cancers12051154
64. Koh HH, Cho ES, Lee JH, Shin SJ, Lee HS, Park EJ, et al. Association of albumin-bilirubin grade and myosteatosis with its prognostic significance for patients with colorectal cancer. Ann Surg Oncol. (2022) 29:3868–76. doi: 10.1245/s10434-022-11445-z
65. Li XR, Zhang Q, Zhang KP, Zhang X, Ruan GT, Song MM, et al. Association of serum total bilirubin with survival outcomes in patients with cancer cachexia: A prospective, multicenter cohort study. Nutr (Burbank Los Angeles County Calif). (2022) 102:111711. doi: 10.1016/j.nut.2022.111711
66. Domínguez I, Crippa S, Thayer SP, Hung YP, Ferrone CR, Warshaw AL, et al. Preoperative platelet count and survival prognosis in resected pancreatic ductal adenocarcinoma. World J surgery. (2008) 32:1051–6. doi: 10.1007/s00268-007-9423-6
67. Jia Z, Zhu Z, Wang Y, Ding J, Lin Z, Zhang Y, et al. The prognostic value of serum bilirubin in colorectal cancer patients with surgical resection. Int J Biol Markers. (2021) 36:17246008211036128. doi: 10.1177/17246008211036128
68. Kurosaki T, Kawakami H, Mitani S, Kawabata R, Takahama T, Nonagase Y, et al. Glasgow prognostic score (GPS) and tumor response as biomarkers of nivolumab monotherapy in third- or later-line setting for advanced gastric cancer. In Vivo. (2020) 34:1921–9. doi: 10.21873/invivo.11989
69. Ogata T, Satake H, Ogata M, Hatachi Y, Inoue K, Hamada M, et al. Neutrophil-to-lymphocyte ratio as a predictive or prognostic factor for gastric cancer treated with nivolumab: a multicenter retrospective study. Oncotarget. (2018) 9:34520–7. doi: 10.18632/oncotarget.v9i77
70. Poruk KE, Gay DZ, Brown K, Mulvihill JD, Boucher KM, Scaife CL, et al. The clinical utility of CA 19-9 in pancreatic adenocarcinoma: diagnostic and prognostic updates. Curr Mol Med. (2013) 13:340–51. doi: 10.2174/1566524011313030003
71. Blum D, Omlin A, Baracos VE, Solheim TS, Tan BH, Stone P, et al. Cancer cachexia: a systematic literature review of items and domains associated with involuntary weight loss in cancer. Crit Rev oncology/hematology. (2011) 80:114–44. doi: 10.1016/j.critrevonc.2010.10.004
72. King M. The interpretation of scores from the EORTC quality of life questionnaire QLQ-C30. Qual Life Res. (1996) 5:555–67. doi: 10.1007/BF00439229
73. Schmidt U, Simunec D, Piso P, Klempnauer J, Schlitt HJ. Quality of life and functional long-term outcome after partial pancreatoduodenectomy: pancreatogastrostomy versus pancreatojejunostomy. Ann Surg Oncol. (2005) 12:467–72. doi: 10.1245/ASO.2005.04.005
74. Fitzsimmons D, Johnson CD, George S, Payne S, Sandberg AA, Bassi C, et al. Development of a disease specific quality of life (QoL) questionnaire module to supplement the EORTC core cancer QoL questionnaire, the QLQ-C30 in patients with pancreatic cancer. EORTC Study Group Qual Life Eur J Cancer. (1999) 35:939–41. doi: 10.1016/S0959-8049(99)00047-7
75. Fitzsimmons D, Kahl S, Butturini G, van Wyk M, Bornman P, Bassi C, et al. Symptoms and quality of life in chronic pancreatitis assessed by structured interview and the EORTC QLQ-C30 and QLQ-PAN26. Am J gastroenterology. (2005) 100:918–26. doi: 10.1111/j.1572-0241.2005.40859.x
76. Batra A, Yang L, Boyne DJ, Harper A, Cheung WY, Cuthbert CA. Associations between baseline symptom burden as assessed by patient-reported outcomes and overall survival of patients with metastatic cancer. Supportive Care Cancer Off J Multinational Assoc Supportive Care Cancer. (2021) 29:1423–31. doi: 10.1007/s00520-020-05623-6
77. Batra A, Yang L, Boyne DJ, Harper A, Cuthbert CA, Cheung WY. Symptom burden in patients with common cancers near end-of-life and its associations with clinical characteristics: a real-world study. Supportive Care Cancer Off J Multinational Assoc Supportive Care Cancer. (2021) 29:3299–309. doi: 10.1007/s00520-020-05827-w
78. Rasmussen A, Dawkins BA, Li C, Pezant N, Levin AM, Rybicki BA, et al. Multiple correspondence analysis and HLA-associations of organ involvement in a large cohort of african-american and european-american patients with sarcoidosis. Lung. (2023) 201:297–302. doi: 10.1007/s00408-023-00626-6
79. Riner AN, Underwood PW, Yang K, Herremans KM, Cameron ME, Chamala S, et al. Disparities in pancreatic ductal adenocarcinoma-the significance of hispanic ethnicity, subgroup analysis, and treatment facility on clinical outcomes. Cancer Med. (2020) 9(12):4069–82. doi: 10.1002/cam4.3042
80. Scarton L, Yoon S, Oh S, Agyare E, Trevino J, Han B, et al. Pancreatic cancer related health disparities: A commentary. Cancers. (2018) 10:235. doi: 10.3390/cancers10070235
81. Zhong X, Narasimhan A, Silverman LM, Young AR, Shahda S, Liu S, et al. Sex specificity of pancreatic cancer cachexia phenotypes, mechanisms, and treatment in mice and humans: role of Activin. J cachexia sarcopenia muscle. (2022) 13:2146–61. doi: 10.1002/jcsm.12998
82. Zhong X, Zimmers TA. Sex differences in cancer cachexia. Curr Osteoporos Rep. (2020) 18:646–54. doi: 10.1007/s11914-020-00628-w
83. Ogobuiro I, Collier AL, Khan K, de Castro Silva I, Kwon D, Wilson GC, et al. Racial disparity in pathologic response following neoadjuvant chemotherapy in resected pancreatic cancer: A multi-institutional analysis from the central pancreatic consortium. Ann Surg Oncol. (2023) 30:1485–94. doi: 10.1245/s10434-022-12741-4
84. Anoveros-Barrera A, Bhullar AS, Stretch C, Esfandiari N, Dunichand-Hoedl AR, Martins KJB, et al. Clinical and biological characterization of skeletal muscle tissue biopsies of surgical cancer patients. J cachexia sarcopenia muscle. (2019) 10:1356–77. doi: 10.1002/jcsm.12466
85. Wallengren O, Iresjö BM, Lundholm K, Bosaeus I. Loss of muscle mass in the end of life in patients with advanced cancer. Supportive Care Cancer Off J Multinational Assoc Supportive Care Cancer. (2015) 23:79–86. doi: 10.1007/s00520-014-2332-y
86. Stephens NA, Gray C, MacDonald AJ, Tan BH, Gallagher IJ, Skipworth RJ, et al. Sexual dimorphism modulates the impact of cancer cachexia on lower limb muscle mass and function. Clin Nutr (Edinburgh Scotland). (2012) 31:499–505. doi: 10.1016/j.clnu.2011.12.008
87. Kilgour RD, Vigano A, Trutschnigg B, Hornby L, Lucar E, Bacon SL, et al. Cancer-related fatigue: the impact of skeletal muscle mass and strength in patients with advanced cancer. J cachexia sarcopenia muscle. (2010) 1:177–85. doi: 10.1007/s13539-010-0016-0
88. Baracos VE, Reiman T, Mourtzakis M, Gioulbasanis I, Antoun S. Body composition in patients with non-small cell lung cancer: a contemporary view of cancer cachexia with the use of computed tomography image analysis. Am J Clin Nutr. (2010) 91:1133s–7s. doi: 10.3945/ajcn.2010.28608C
89. Johns N, Hatakeyama S, Stephens NA, Degen M, Degen S, Frieauff W, et al. Clinical classification of cancer cachexia: phenotypic correlates in human skeletal muscle. PloS One. (2014) 9:e83618. doi: 10.1371/journal.pone.0083618
90. Haverkort EB, de Haan RJ, Binnekade JM, van Bokhorst-de van der Schueren MA. Self-reporting of height and weight: valid and reliable identification of malnutrition in preoperative patients. Am J surgery. (2012) 203:700–7. doi: 10.1016/j.amjsurg.2011.06.053
91. Klipstein-Grobusch K, Kroke A, Boeing H. Reproducibility of self-reported past body weight. Eur J Clin Nutr. (1998) 52:525–8. doi: 10.1038/sj.ejcn.1600601
92. Dahl AK, Hassing LB, Fransson EI, Pedersen NL. Agreement between self-reported and measured height, weight and body mass index in old age–a longitudinal study with 20 years of follow-up. Age Ageing. (2010) 39:445–51. doi: 10.1093/ageing/afq038
93. Olaechea S, Liu A, Sarver B, Gilmore LA, Alvarez C, Yazdanbakhsh K, et al. Racial, ethnic, and socioeconomic characteristics independently predict for cachexia risk and associated survival outcomes in stage IV NSCLC: A brief report. JTO Clin Res Rep. (2023) 4:100496. doi: 10.1016/j.jtocrr.2023.100496
94. Murdock DJ, Wu N, Grimsby JS, Calle RA, Donahue S, Glass DJ, et al. The prevalence of low muscle mass associated with obesity in the USA. Skelet Muscle. (2022) 12:26. doi: 10.1186/s13395-022-00309-5
95. Forde AT, Crookes DM, Suglia SF, Demmer RT. The weathering hypothesis as an explanation for racial disparities in health: a systematic review. Ann Epidemiol. (2019) 33:1–18 e3. doi: 10.1016/j.annepidem.2019.02.011
96. The Commonwealth Fund. Achieving racial and ethnic equity in U.S. health care: a scorecard of state performance.
97. van der Meij BS, Schoonbeek CP, Smit EF, Muscaritoli M, van Leeuwen PA, Langius JA. Pre-cachexia and cachexia at diagnosis of stage III non-small-cell lung carcinoma: an exploratory study comparing two consensus-based frameworks. Br J Nutr. (2013) 109:2231–9. doi: 10.1017/S0007114512004527
98. Baracos VE, Coats AJ, Anker SD, Sherman L, Klompenhouwer T, International Advisory B, et al. Identification and management of cancer cachexia in patients: Assessment of healthcare providers' knowledge and practice gaps. J cachexia sarcopenia muscle. (2022) 13:2683–96. doi: 10.1002/jcsm.13105
99. Scott D, Reid J, Hudson P, Martin P, Porter S. Health care professionals' experience, understanding and perception of need of advanced cancer patients with cachexia and their families: The benefits of a dedicated clinic. BMC Palliat Care. (2016) 15:100. doi: 10.1186/s12904-016-0171-y
100. Amano K, Arakawa S, Hopkinson JB, Baracos VE, Oyamada S, Koshimoto S, et al. Factors associated with practice of multimodal care for cancer cachexia among physicians and nurses engaging in cancer care. JCO Oncol Pract. (2023) 19:602–9. doi: 10.1200/OP.23.00043
101. Ford KL, Trottier CF, Wismer WV, Sawyer MB, Siervo M, Deutz NEP, et al. Drivers of dietary choice after a diagnosis of colorectal cancer: A qualitative study. J Acad Nutr Diet. (2023) 123:407–16. doi: 10.1016/j.jand.2022.08.128
102. Trudel-Fitzgerald C, Tworoger SS, Poole EM, Zhang X, Giovannucci EL, Meyerhardt JA, et al. Psychological symptoms and subsequent healthy lifestyle after a colorectal cancer diagnosis. Health Psychol. (2018) 37:207–17. doi: 10.1037/hea0000571
103. Thoresen L, Fjeldstad I, Krogstad K, Kaasa S, Falkmer UG. Nutritional status of patients with advanced cancer: the value of using the subjective global assessment of nutritional status as a screening tool. Palliat Med. (2002) 16:33–42. doi: 10.1191/0269216302pm486oa
104. Deans DA, Tan BH, Wigmore SJ, Ross JA, de Beaux AC, Paterson-Brown S, et al. The influence of systemic inflammation, dietary intake and stage of disease on rate of weight loss in patients with gastro-oesophageal cancer. Br J cancer. (2009) 100:63–9. doi: 10.1038/sj.bjc.6604828
105. Cuthbert CA, Boyne DJ, Yuan X, Hemmelgarn BR, Cheung WY. Patient-reported symptom burden and supportive care needs at cancer diagnosis: a retrospective cohort study. Supportive Care Cancer Off J Multinational Assoc Supportive Care Cancer. (2020) 28:5889–99. doi: 10.1007/s00520-020-05415-y
106. Michael N, Beale G, O'Callaghan C, Melia A, DeSilva W, Costa D, et al. Timing of palliative care referral and aggressive cancer care toward the end-of-life in pancreatic cancer: a retrospective, single-center observational study. BMC Palliat Care. (2019) 18:13. doi: 10.1186/s12904-019-0399-4
107. Herman JM, Kitchen H, Degboe A, Aldhouse NVJ, Trigg A, Hodgin M, et al. Exploring the patient experience of locally advanced or metastatic pancreatic cancer to inform patient-reported outcomes assessment. Qual Life Res. (2019) 28:2929–39. doi: 10.1007/s11136-019-02233-6
108. Spencer SM, Albert SM, Bear-Lehman J, Burkhardt A. Relevance of race and ethnicity for self-reported functional limitation. J Am Geriatr Soc. (2008) 56:553–7. doi: 10.1111/j.1532-5415.2007.01595.x
109. Lui F, Finik J, Leng J, Gany F. Social determinants and health-related quality of life in a sample of diverse, low socioeconomic status cancer patients. Psychooncology. (2022) 31:1922–32. doi: 10.1002/pon.6006
110. Fong ZV, Sekigami Y, Qadan M, Fernandez-Del Castillo C, Warshaw AL, Lillemoe KD, et al. Assessment of the long-term impact of pancreatoduodenectomy on health-related quality of life using the EORTC QLQ-PAN26 module. Ann Surg Oncol. (2021) 28:4216–24. doi: 10.1245/s10434-021-09853-8
111. Moffat GT, Epstein AS, O'Reilly EM. Pancreatic cancer-A disease in need: Optimizing and integrating supportive care. Cancer. (2019) 125:3927–35. doi: 10.1002/cncr.32423
112. Tieftrunk E, Demir IE, Friess H, Ceyhan GO. Back pain as a potential indicator of local recurrence in pancreatic cancer. J Surg Case Rep. (2015) 2015:rjv127. doi: 10.1093/jscr/rjv127
113. Ridder GJ, Klempnauer J. Back pain in patients with ductal pancreatic cancer. Its impact on resectability and prognosis after resection. Scandinavian J gastroenterology. (1995) 30:1216–20. doi: 10.3109/00365529509101634
114. Coveler AL, Mizrahi J, Eastman B, Apisarnthanarax SJ, Dalal S, McNearney T, et al. Pancreas cancer-associated pain management. oncologist. (2021) 26:e971–e82. doi: 10.1002/onco.13796
115. Roberts DA, Watson E, Macdonald C, Khan Y, Prideaux S, Puthiyakunnel Saji A, et al. Management of pain and cachexia in pancreatic cancer: protocol for two systematic reviews, network meta-analysis, surveys, and focus groups. JMIR Res Protoc. (2023) 12:e46335. doi: 10.2196/46335
116. Dobosz Ł, Kaczor M, Stefaniak TJ. Pain in pancreatic cancer: review of medical and surgical remedies. ANZ J Surg. (2016) 86:756–61. doi: 10.1111/ans.13609
117. Dobosz Ł, Stefaniak T, Dobrzycka M, Wieczorek J, Franczak P, Ptaszyńska D, et al. Invasive treatment of pain associated with pancreatic cancer on different levels of WHO analgesic ladder. BMC Surg. (2016) 16:20. doi: 10.1186/s12893-016-0136-3
118. Han J, Harrison L, Patzelt L, Wu M, Junker D, Herzig S, et al. Imaging modalities for diagnosis and monitoring of cancer cachexia. EJNMMI Res. (2021) 11:94. doi: 10.1186/s13550-021-00834-2
119. Jin WH, Mellon EA, Frakes JM, Murimwa GZ, Hodul PJ, Pimiento JM, et al. Impact of sarcopenia in borderline resectable and locally advanced pancreatic cancer patients receiving stereotactic body radiation therapy. J gastrointestinal Oncol. (2018) 9:24–34. doi: 10.21037/jgo
120. Roeland EJ, Bohlke K, Baracos VE, Smith TJ, Loprinzi CL. Cancer cachexia: ASCO guideline rapid recommendation update. J Clin Oncol Off J Am Soc Clin Oncol. (2023) 41:4178–9. doi: 10.1200/JCO.23.01280
121. Allenson K, Turner K, Gonzalez BD, Gurd E, Zhu S, Misner N, et al. Pilot trial of remote monitoring to prevent malnutrition after hepatopancreatobiliary surgery. BMC Nutr. (2021) 7:82. doi: 10.1186/s40795-021-00487-3
122. Huelster HL, Zemp L, Turner K, Gonzalez BD, Jim H, Gore LR, et al. Mobile postoperative symptom intervention tool and biometric monitoring after radical cystectomy: pilot study evaluating feasibility, usability, and potential utility. J Urol. (2023) 209:410–21. doi: 10.1097/JU.0000000000003048
123. Parker NH, Basen-Engquist K, Rubin ML, Li Y, Prakash L, Ngo-Huang A, et al. Factors influencing exercise following pancreatic tumor resection. Ann Surg Oncol. (2021) 28:2299–309. doi: 10.1245/s10434-020-09062-9
124. Parker NH, Gorzelitz J, Ngo-Huang A, Caan BJ, Prakash L, Garg N, et al. The role of home-based exercise in maintaining skeletal muscle during preoperative pancreatic cancer treatment. Integr Cancer therapies. (2021) 20:1534735420986615. doi: 10.1177/1534735420986615
125. Parker NH, Katz MHG. ASO author reflections: it is time to prioritize exercise in pancreatic cancer survivorship. Ann Surg Oncol. (2021) 28:2310–1. doi: 10.1245/s10434-020-09091-4
126. Parker NH, Ngo-Huang A, Lee RE, O'Connor DP, Basen-Engquist KM, Petzel MQB, et al. Physical activity and exercise during preoperative pancreatic cancer treatment. Supportive Care Cancer Off J Multinational Assoc Supportive Care Cancer. (2019) 27:2275–84. doi: 10.1007/s00520-018-4493-6
Keywords: cancer-associated cachexia, pancreatic adenocarcinoma, longitudinal prospective cohort, health-related quality of life, racial and ethnic disparities
Citation: Permuth JB, Park MA, Chen D-T, Basinski T, Powers BD, Gwede CK, Dezsi KB, Gomez M, Vyas SL, Biachi T, Cortizas EM, Crowder S, Genilo-Delgado M, Green B, Greene A, Gregg C, Hoffe SE, Jiang K, Kim B, Vasudevan V, Garcialopez De Llano J, Menon AA, Mo Q, MorenoUrazan LM, Mok S, Parker N, Rajasekhara S, Rasool G, Sinnamon A, Sparks L, Stewart PA, Tardif K, Tassielli AF, Teer JK, Tran DV, Turner KL, Vadaparampil ST, Whelan CJ, Douglas WG, Velanovich V, Karachristos A, Legaspi A, Meredith K, Molina-Vega MA, Huguet KL, Arnoletti JP, Bloomston M, Trevino J, Merchant NB, Pimiento JM, Hodul PJ, Malafa M, Fleming J, Judge SM, Jeong DK and Judge A (2024) Leveraging real-world data to predict cancer cachexia stage, quality of life, and survival in a racially and ethnically diverse multi-institutional cohort of treatment-naïve patients with pancreatic ductal adenocarcinoma. Front. Oncol. 14:1362244. doi: 10.3389/fonc.2024.1362244
Received: 03 January 2024; Accepted: 03 July 2024;
Published: 23 July 2024.
Edited by:
Jung Mi Oh, Seoul National University, Republic of KoreaReviewed by:
Aneesha Dasgupta, Purdue University Indianapolis, United StatesBrittany Counts, Oregon Health and Science University, United States
Copyright © 2024 Permuth, Park, Chen, Basinski, Powers, Gwede, Dezsi, Gomez, Vyas, Biachi, Cortizas, Crowder, Genilo-Delgado, Green, Greene, Gregg, Hoffe, Jiang, Kim, Vasudevan, Garcialopez De Llano, Menon, Mo, MorenoUrazan, Mok, Parker, Rajasekhara, Rasool, Sinnamon, Sparks, Stewart, Tardif, Tassielli, Teer, Tran, Turner, Vadaparampil, Whelan, Douglas, Velanovich, Karachristos, Legaspi, Meredith, Molina-Vega, Huguet, Arnoletti, Bloomston, Trevino, Merchant, Pimiento, Hodul, Malafa, Fleming, Judge, Jeong and Judge. This is an open-access article distributed under the terms of the Creative Commons Attribution License (CC BY). The use, distribution or reproduction in other forums is permitted, provided the original author(s) and the copyright owner(s) are credited and that the original publication in this journal is cited, in accordance with accepted academic practice. No use, distribution or reproduction is permitted which does not comply with these terms.
*Correspondence: Jennifer B. Permuth, amVubnkucGVybXV0aEBtb2ZmaXR0Lm9yZw==