- 1Department of Radiology, Peking University First Hospital, Beijing, China
- 2School of Basic Medical Sciences, Capital Medical University, Beijing, China
- 3Beijing Smart Tree Medical Technology Co. Ltd., Beijing, China
- 4Department of Urology, Peking University First Hospital, Beijing, China
Purpose: To develop deep-learning radiomics model for predicting biochemical recurrence (BCR) of advanced prostate cancer (PCa) based on pretreatment apparent diffusion coefficient (ADC) maps.
Methods: Data were collected retrospectively from 131 patients diagnosed with advanced PCa, randomly divided into training (n = 93) and test (n = 38) datasets. Pre-treatment ADC images were segmented using a pre-trained artificial intelligence (AI) model to identify suspicious PCa areas. Three models were constructed, including a clinical model, a conventional radiomics model and a deep-radiomics model. The receiver operating characteristic (ROC), precision-recall (PR) curve and decision curve analysis (DCA) were used to assess predictive performance in test dataset. The net reclassification index (NRI) and integrated discrimination improvement (IDI) were employed to compare the performance enhancement of the deep-radiomics model in relation to the other two models.
Results: The deep-radiomics model exhibited a significantly higher area under the curve (AUC) of ROC than the other two (P = 0.033, 0.026), as well as PR curve (AUC difference 0.420, 0.432). The DCA curve demonstrated superior performance for the deep-radiomics model across all risk thresholds than the other two. Taking the clinical model as reference, the NRI and IDI was 0.508 and 0.679 for the deep-radiomics model with significant difference. Compared with the conventional radiomics model, the NRI and IDI was 0.149 and 0.164 for the deep-radiomics model without significant difference.
Conclusion: The deep-radiomics model exhibits promising potential in predicting BCR in advanced PCa, compared to both the clinical model and the conventional radiomics model.
1 Introduction
Prostate cancer (PCa) is the second most common cancer in men and cancer-related mortality ranks the fifth (1). Treatment options include active surveillance, radical prostatectomy (RP), radiotherapy (RT), hormonal therapy (HT), chemotherapy, immunotherapy and others (2). After treatment, some patients might experience biochemical recurrence (BCR) (3). BCR serves as a prognostic indicator for the cure of PCa, clinical metastases and ultimately PCa-related death (3). Prediction of BCR could help healthcare professionals in treatment planning by identifying patients who may benefit from additional therapies or interventions.
Various prediction models for BCR incorporate clinical variables such as age, prostate specific antigen (PSA) level, clinical stage, Gleason score, and other relevant factors (3–8). These clinical variables are believed to be associated with the aggressiveness of PCa, which explains their usefulness in predicting BCR. Magnetic resonance(MR) image features have also been found to be associated with the aggressiveness of PCa (9). Therefore, it is reasonable to expect that utilizing MR image features can contribute to the prediction of BCR (10). In studies focusing on MR prediction models, the use of radiomics methods enables the extraction of more information compared to human image interpretation alone (11, 12). Radiomics allows for the analysis of intricate quantitative image features that may not be readily apparent to the human eyes, thereby enhancing the predictive capabilities (13–18).
However, previous research has primarily focused on localized PCa treated with RP and/or RT. Patients with advanced PCa who received only HT or complex treatment were not included in analysis, especially those with lymph node metastasis or distant metastasis. Additionally, previous MR radiomics studies predominantly relied on manual annotations of regions of interest (ROI) by experts to construct the prediction models. This manual annotation approach is time-consuming and labor-intensive and hampers the widespread clinical application of these models. Moreover, most previous MR radiomics research involved the extraction and analysis of imaging features using generic morphological, textural, and statistical features defined by predetermined formulas (19). While these features provide useful information, they may not fully capture the intricate patterns and relationships presented within the images. Recently, deep learning methods have shown promising applications in automating the feature extraction process and capturing more complex patterns and relationships within images (19–21). Deep learning models of PCa were mainly applied in preclinical discovery (22), Gleason grading (23), tumor metastasis (24) and BCR in RP (25). Thus, our study was aimed to develop deep learning model with automatic segmentation derived from pretreatment apparent diffusion coefficient (ADC) maps that may be predictive of BCR in advanced PCa.
2 Methods
2.1 Data enrollment
This retrospective study received approval from the local institutional review board of the Peking University First Hospital Medical Science Research ethics committee (IRB number: 2021-342), and the requirement for written consent was waived.
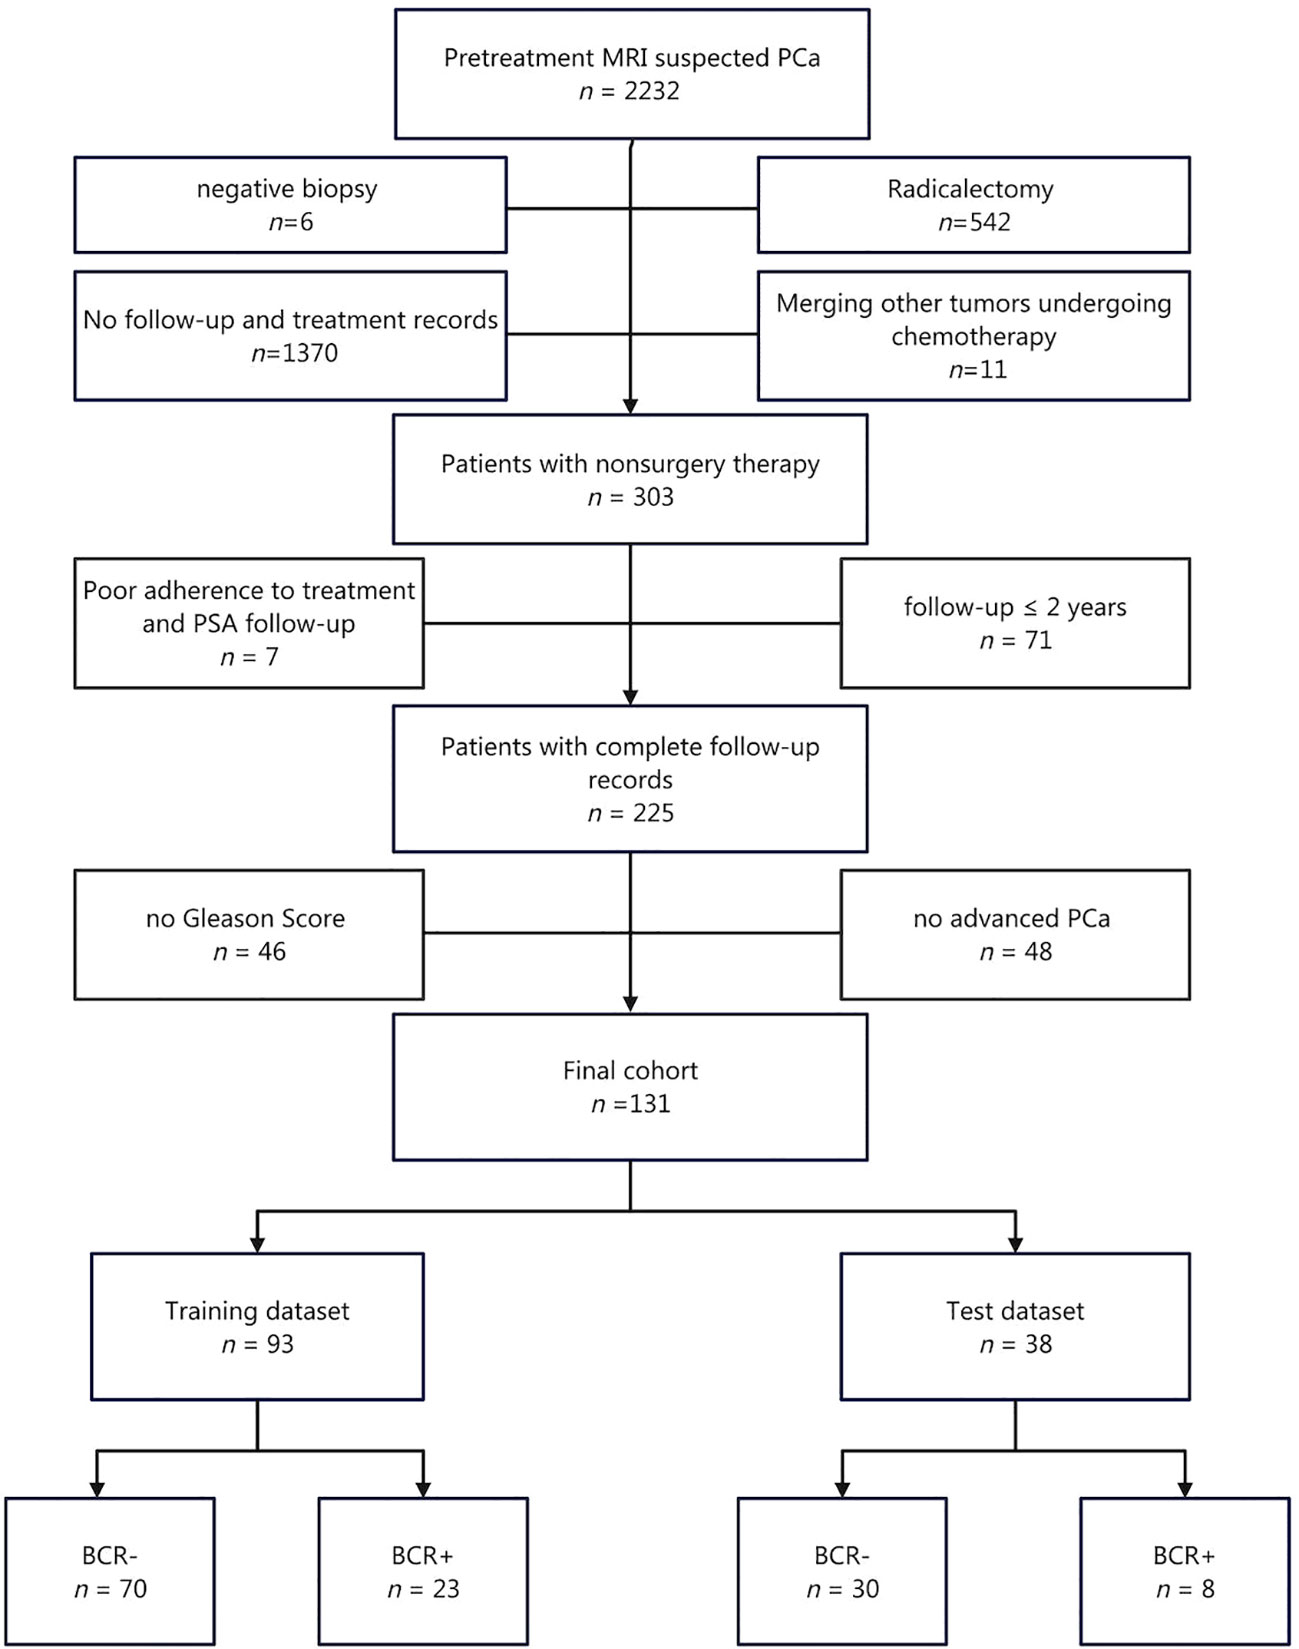
A total of 2,232 patients suspected of PCa between 2016 and 2020 in our institution were included in the study. The inclusion criteria were as follows: (a) Availability of pretreatment MR images in the Picture Archiving and Communication Systems (PACS). (b) Clinically diagnosed as advanced stage and initial treatment with RT, HT, or a combination of both. (c) Regular follow-up at least every three months in the first year and every six months in the second year. (d) Availability of clinical data. (e) Follow-up period of at least two years with documented biochemical recurrence (BCR+) or non-BCR (BCR-). BCR was defined as any PSA increase greater than 2 ng/mL compared to the PSA nadir value for patients who underwent RT with or without HT. For patients who received only HT, BCR was defined as castrate serum testosterone less than 1.7 nmol/L with either three consecutive PSA increases at least one week apart, resulting in a two-fold increase exceeding the nadir by 50% and a PSA greater than 2 ng/mL, or radiological progression evidenced by the appearance of new lesions (26).
Finally, a total of 131 consecutive patients were included in this study, consisting of 100 BCR- and 31 BCR+ patients (Figure 1). Of these patients, 4 received only RT (including 4 BCR- and 0 BCR+), 75 received RT with HT (74 BCR- and 1 BCR+), and 52 received only HT (22 BCR- and 30 BCR+).
2.2 MRI acquisition parameters
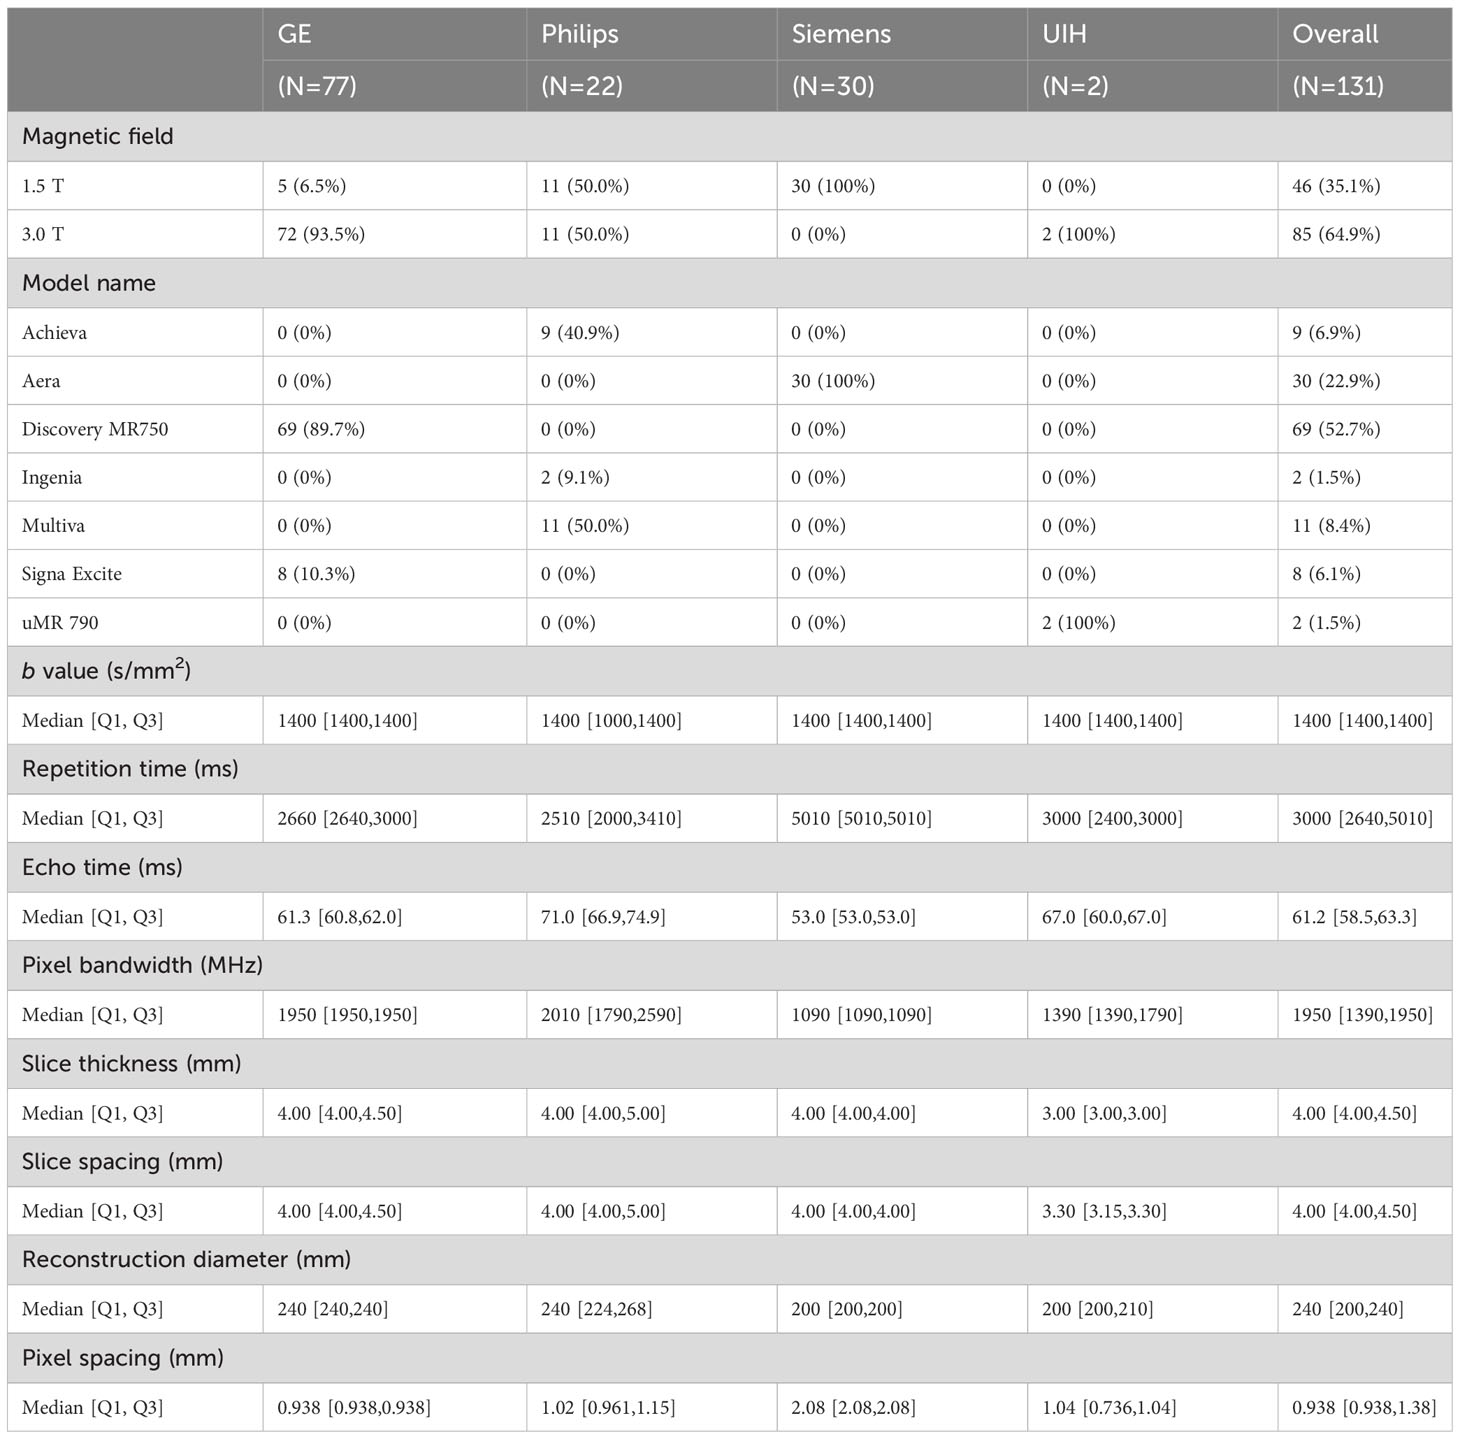
A comprehensive description of acquisition parameters for seven different MR scanners are provided in Table 1. The magnetic field strength of MR scanners included 1.5 T (n = 46, 35.1%) and 3.0 T (n = 85, 64.9%). The radiomics analysis exclusively focused on ADC images, which were obtained with a median b value of 1400 s/mm2. Diffusion weighted imaging (DWI) was acquired by using single-shot echo planner imaging (SS-EPI) sequence. The calculation of ADC maps was performed using vendor-specific software associated with each MR scanner (GE: Advantage Workstation, Philips: IntelliSpace Portal, Siemens: syngo.via, UIH: uWS-MR Advanced Postprocess Workstation). Other imaging sequences, including T1-weighted imaging (T1WI), T2-weighted imaging (T2WI) and dynamic contrast enhancement (DCE), were acquired simultaneously but were not subjected to analysis in current study.
2.3 Region of interest
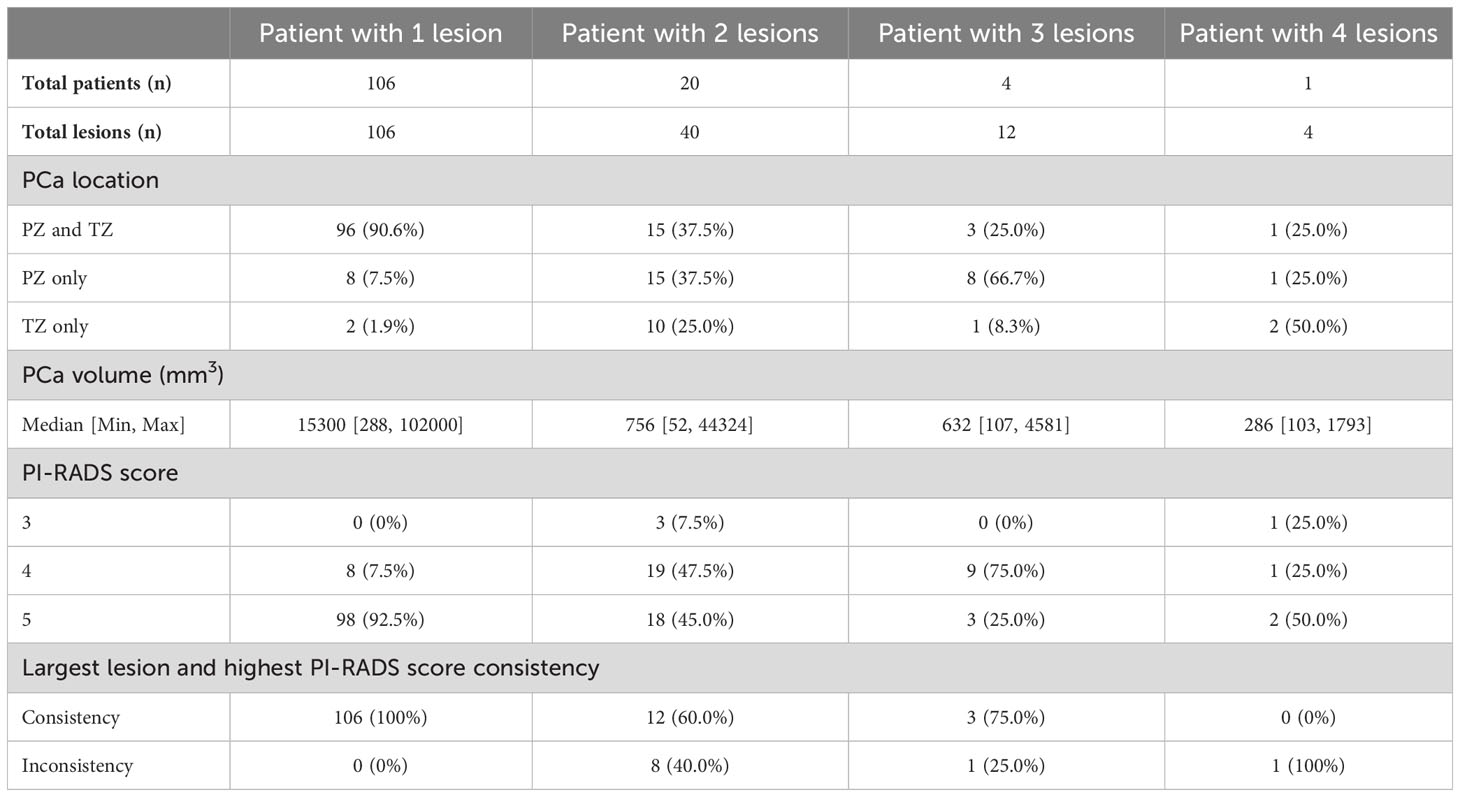
The areas of PCa were predicted by priorly trained models (22) on the ADC maps (Figure 2). Initially, the areas corresponding to prostate gland were segmented by artificial intelligence (AI) models. Subsequently, the regions of suspected PCa were segmented in a sequential manner. The three-dimensional volume ROI was utilized for extracting image features required for model development. If multiple PCa foci were segmented, the largest one was automatically taken as the ROI. Prostate Imaging and Reporting Archiving Data System (PI-RADS) v2.1 was used to score lesions of interest by an experienced radiologist (work experience more than 10 years). Among 131 patients, 106 had only one suspicious lesion, 20 had two, 4 had three, and 1 had four. The volume, location, and PI-RADS scores of these lesions are detailed in Table 2. In 121 patients, the largest lesion coincided with the one rated as the highest PI-RADS score. In 10 cases, the largest lesion shared the same PI-RADS score as the second largest lesion.

Figure 2 Illustration of an ROI example. (A, B) Two different slices of the ADC map. (C,D) AI model’s prediction of the prostate region (blue zone). (E,F) AI model’s detection of suspicious lesion areas (green zone). (G,H) The largest lesion (red zone) was selected for radiomics modeling. ROI, region of interest; ADC, apparent diffusion coefficient.
2.4 Model development
The collected data were divided into two datasets, namely, the training dataset (n = 93) and the test dataset (n = 38), using a random allocation with a ratio of 7:3 (27). Subsequently, three prediction models were developed using the training dataset: a clinical model, a conventional radiomics model, and a deep-radiomics model. The clinical characteristics, including age, PSA level, PI-RADS score, International Society of Urological Pathology (ISUP) group for biopsy pathology, clinical stage and treatment, remained consistent across all models. However, the image features varied among models, and their specific extraction methods will be elaborated in the subsequent manuscript.
To construct the clinical model, location, volume and ADC value of PCa area segmented by the AI models were selected as image features. Univariable logistic regression and multivariable logistic regression analysis were conducted to identify the significant predictors. The selection of predictors was performed using a stepwise selection approach guided by the Akaike information criterion (AIC). The adequacy of the model was evaluated by calculating the R2 value using the Nagelkerke method. To help comprehensive interpretation of the model, a nomogram graph was generated.
To construct the conventional radiomics model, the image features were extracted from ROIs on the ADC maps using the Pyradiomics package in Python (https://pyradiomics.readthedocs.io/en/latest/changes.html). To account for potential variations across different scanners, preprocessing of the ADC maps was performed by applying image normalization to mitigate confounding effects. Three types of images were analyzed: “Original Images” representing unfiltered images, “LoG Images” obtained by applying the Laplacian of Gaussian filter, and “Wavelet Images” generated through a three-dimensional wavelet transformation using the PyWavelet package in the x, y, and z directions. The ROIs were then preprocessed to ensure a consistent size. A total of 14 shape features, 18 first-order statistical features, and 24 texture features were extracted from the images. The shape features were exclusively extracted from the “Original Images,” while the first-order statistical and texture features were extracted from all three types of images. Therefore, a total of 14 shape features, 216 first-order statistical features, and 840 texture features were obtained. The mathematical expressions and semantic meanings of the features extracted can be found at https://pyradiomics.readthedocs.io/en/latest/. After feature extraction, several additional steps were performed. Z score normalization was applied to rescale the extracted features, and Pearson correlation coefficients (PCCs) were calculated to identify highly correlated features. Features with a PCC value exceeding 0.99 were removed to mitigate multicollinearity. Analysis of variance (ANOVA) was then used to select features for the final radiomics model. As the classifier, eXtreme gradient boosting (XGBoost) algorithm was employed. And SHAP (SHapley Additive exPlanations) values were used to interpret the results obtained from the XGBoost models.
To construct the deep-radiomics model, the image features were extracted by employing a deep learning algorithm. The construction process involved several steps. First, the intensities of ADC maps were preprocessed by normalizing them. Second, ROIs were resampled to ensure a consistent voxel size. Third, a pre-trained deep learning model was utilized to extract features from ROIs, leveraging the power of learned representations. Specifically, the ROIs were input into the convolutional layers of the MedicalNet architecture, which had been initialized with pre-trained weights to extract discriminative features. A comprehensive description of the network can be found in previous work (https://github.com/Tencent/MedicalNet). The resulting channel feature maps were then subjected to feature dimension reduction by filtering with the maximum value. This process yielded a set of 2048 one-dimensional features. After extracting deep features, the construction of the deep-radiomics model followed a similar procedure to the conventional radiomics model.
The parameters used for feature extraction, feature selection, internal validation, and model building are presented in the Supplementary Material.
2.5 Model evaluation
Multiple metrics were employed to evaluate of the constructed models performance using the test dataset. First, the receiver operating curve (ROC) analysis with the use of the area under the curve (AUC) was utilized as a widely accepted metric.
Because of the imbalanced distribution of the BCR- and BCR+ cases, the precision-recall (PR) curve was employed. The AUC of the PR and 95% bootstrap confidence interval (BCa) were calculated. If the BCa does not include zero, it indicates that the difference in PR AUC between the models is statistically significant.
To gain insights into the clinical utility of the models, decision curve analysis (DCA) was employed. The net reclassification index (NRI) and integrated discrimination improvement (IDI) were utilized to quantify the enhancement in prediction accuracy achieved by the radiomics and deep-radiomics models compared to the clinical model. A positive NRI indicates improved risk classification, while a negative NRI suggests misclassification. A higher IDI value indicates enhanced discrimination between individuals with and without the event of interest.
2.6 Statistical analysis
IBM SPSS® 20.0 (www.ibm.com), MedCalc 20.014 (www.medcalc.org) and R 3.5.1 (www.r-project.org) were used for statistical analysis.
Descriptive statistics were used to summarize the data, with mean (standard deviation) reported of continuous variables that followed a normal distribution and median [Q1, Q3] of continuous variables that did not follow a normal distribution. Categorical variables were reported as frequencies (percentage%). A Mann-Whitney U test or chi-square test was used to assess differences in clinical characteristics both between the training and test cohorts and between the BCR- and BCR+ groups. The DeLong test was used to compare the difference between the AUCs of ROC. The level of statistical significance was set at P < 0.05.
3 Results
3.1 Clinical characteristics
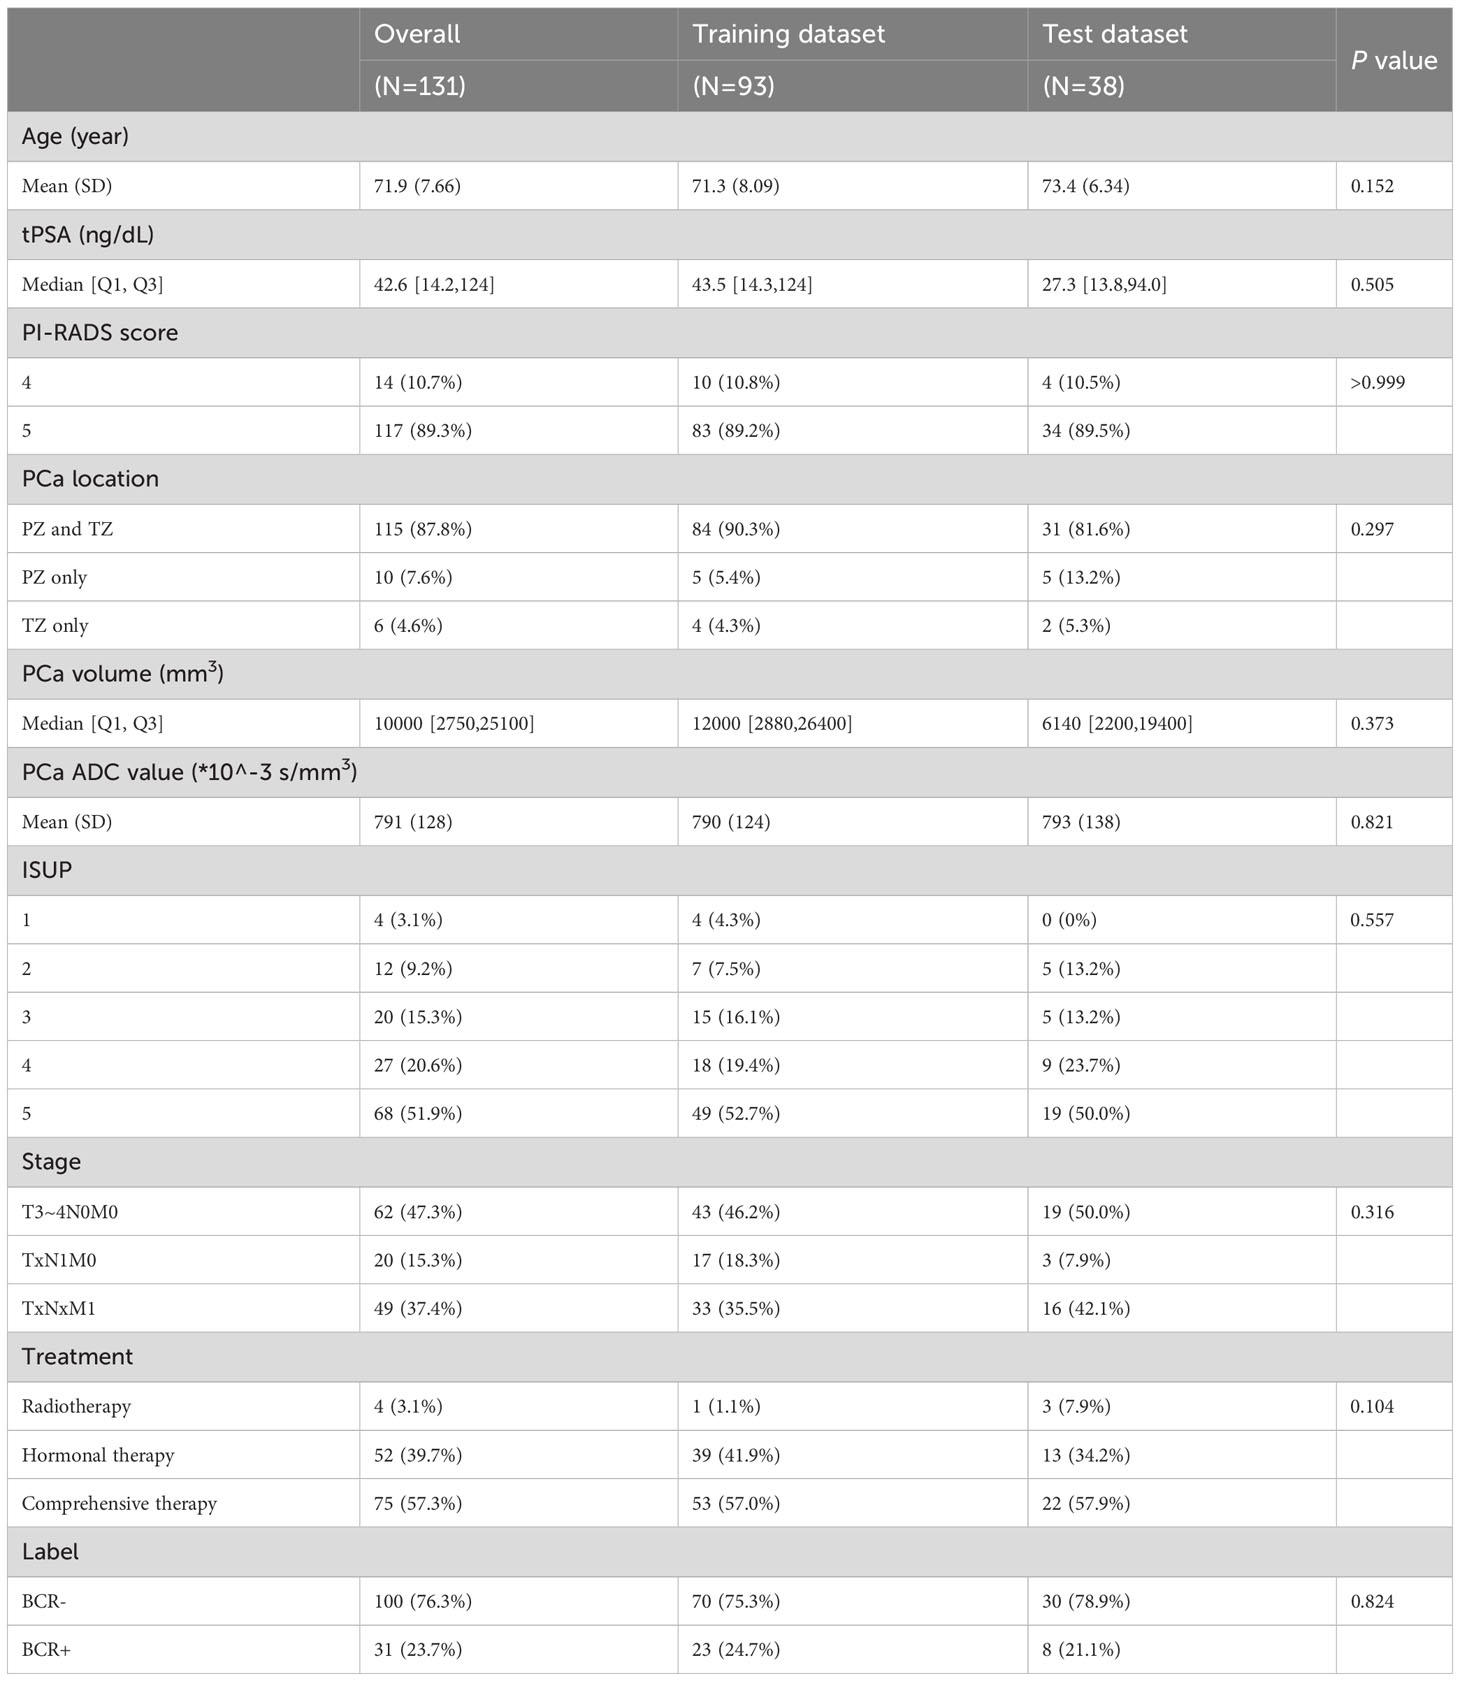
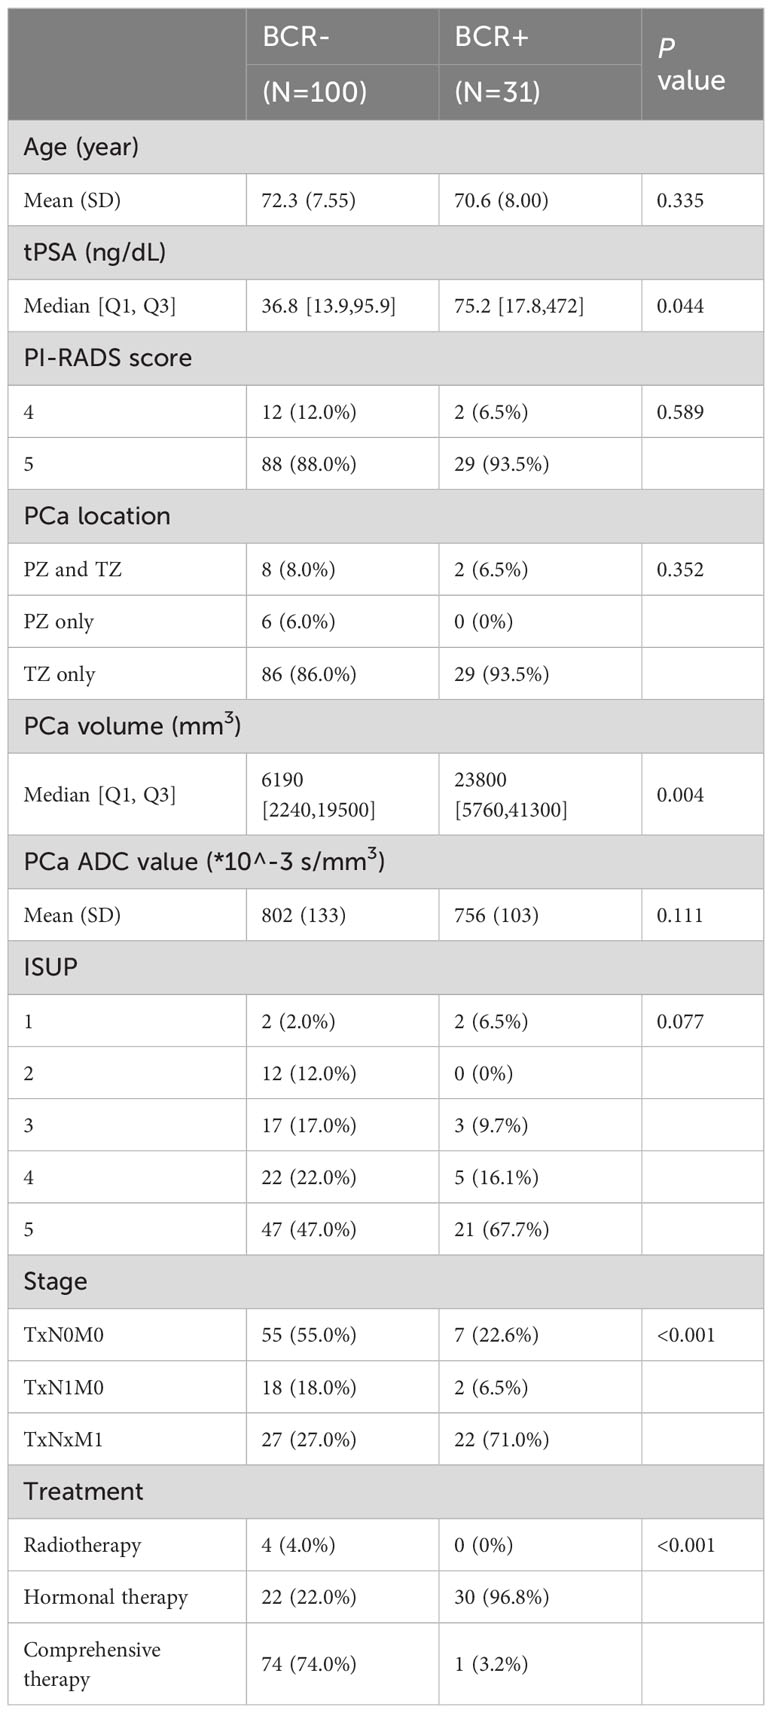
Out of 131 cases, 62 (47.3%) were classified as locally advanced PCa, while 20 (15.3%) exhibited lymph node metastasis, and 49 (37.4%) presented with distant metastasis. There was no significant difference in any feature between the training and test datasets (Table 3). BCR rates were 24.7% (23/93) in the training cohort and 21.1% (8/38) in the test cohort, without significant difference (P = 0.824).
Compared the BCR+ and BCR- groups (Table 4), no significant difference was found in age, PI-RADS score, PCa location, PCa ADC value, and ISUP group (all P > 0.05). There were significant differences in PSA level, PCa volume, clinical stage and treatment method between the BCR- and BCR+ groups (all P < 0.05).
3.2 Model development
The clinical model was constructed using stepwise multivariable logistic regression. PSA and stage were the final predictor variables included in the model after selection process (Table 5, Figure 3). The conventional radiomics model incorporated PSA, stage, treatment, and four image features extracted from ADC maps as the final predictor variables (Figure 4). Similarly, the deep-radiomics model included PSA, stage, treatment, and three image features extracted using a deep learning algorithm as the final predictor variables (Figure 5).
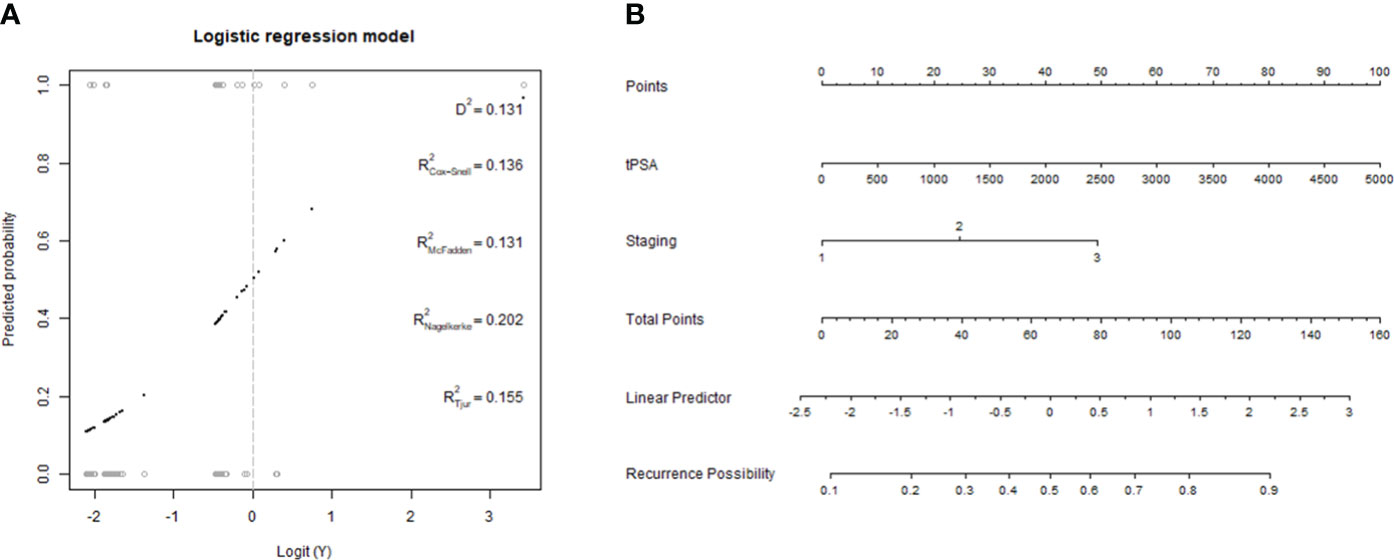
Figure 3 Development of clinical model. (A, B) a generalized linear model and the nomogram of the clinical model.
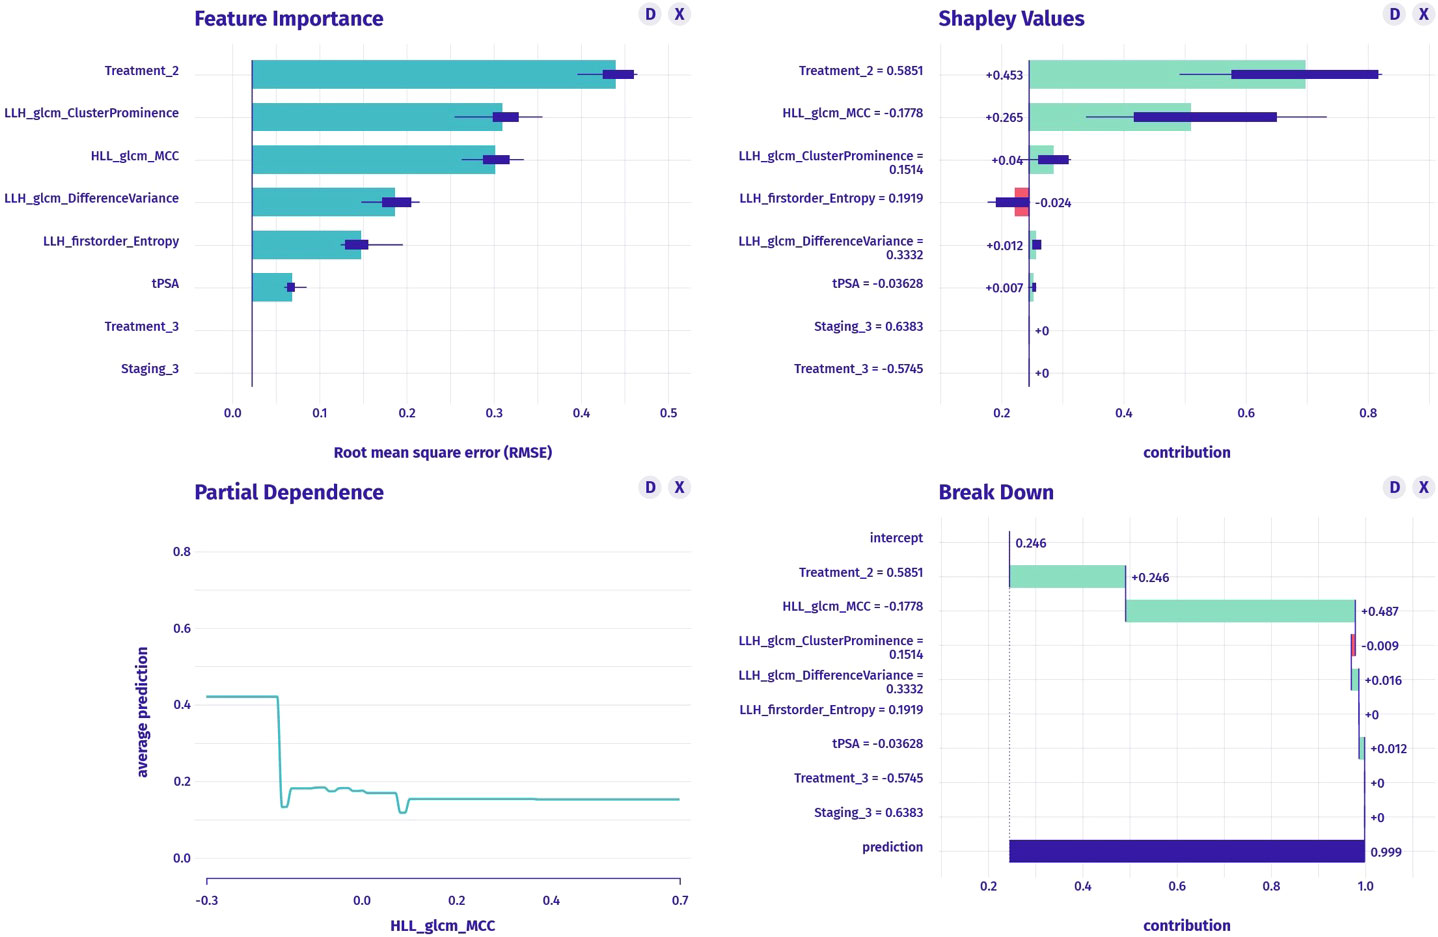
Figure 4 The construction of conventional radiomics model, including feature importance (upper left graph), SHAP values (upper right graph), partial dependence plot (lower left graph) and breakdown plot (lower right graph).
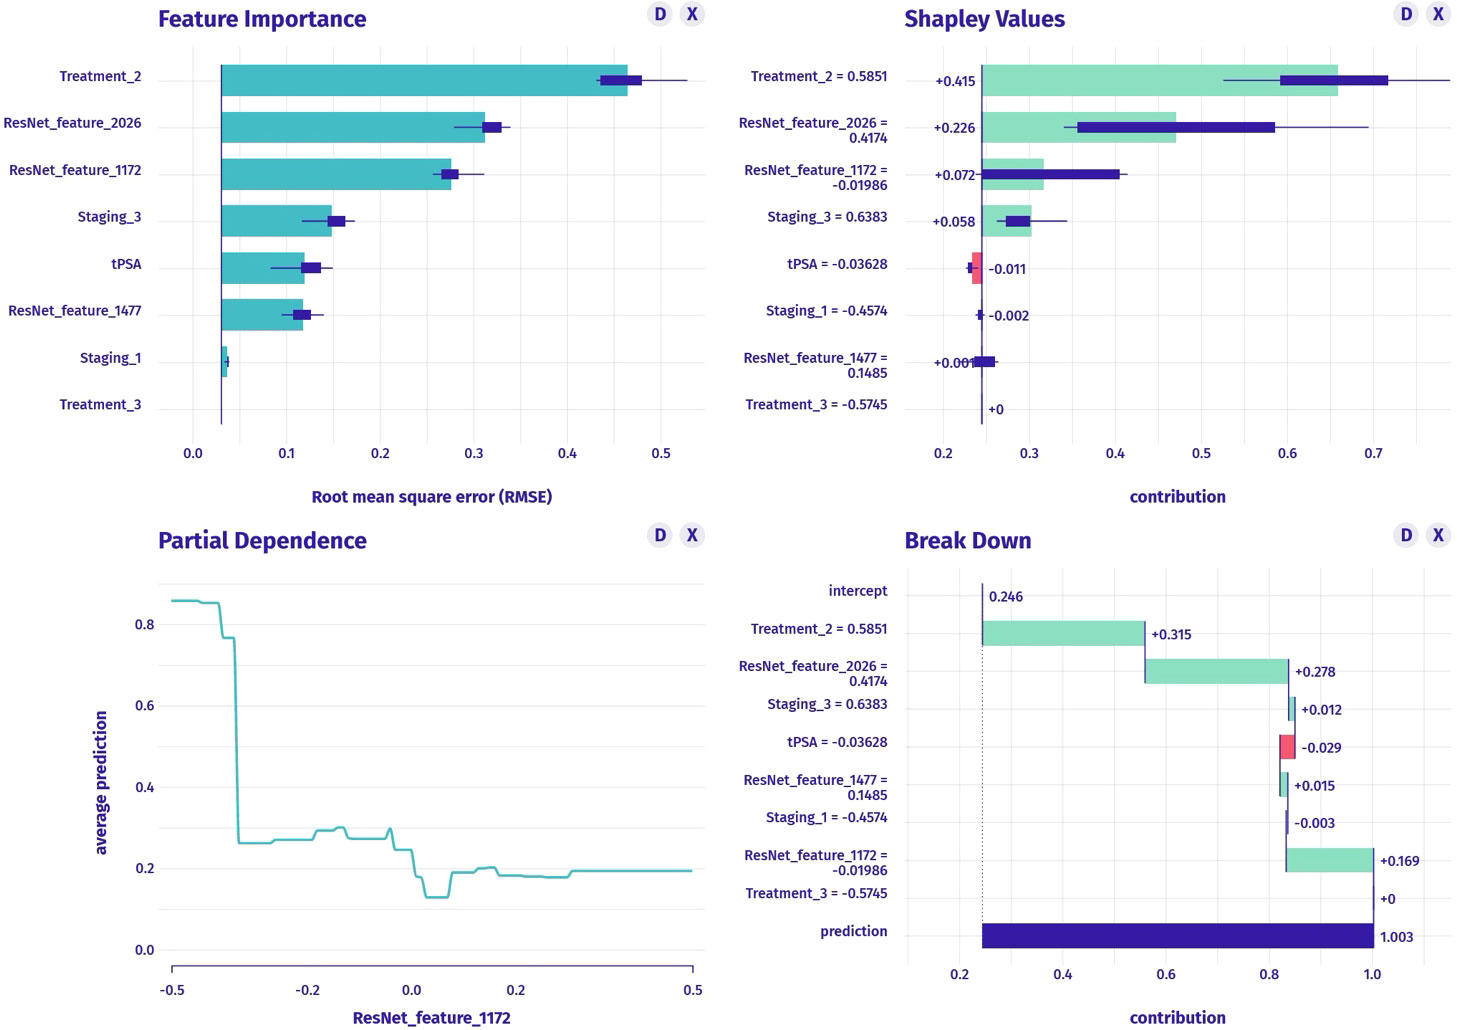
Figure 5 The construction of deep-radiomics model, including feature importance (upper left graph), SHAP values (upper right graph), partial dependence plot (lower left graph) and breakdown plot (lower right graph).
3.3 Model evaluation
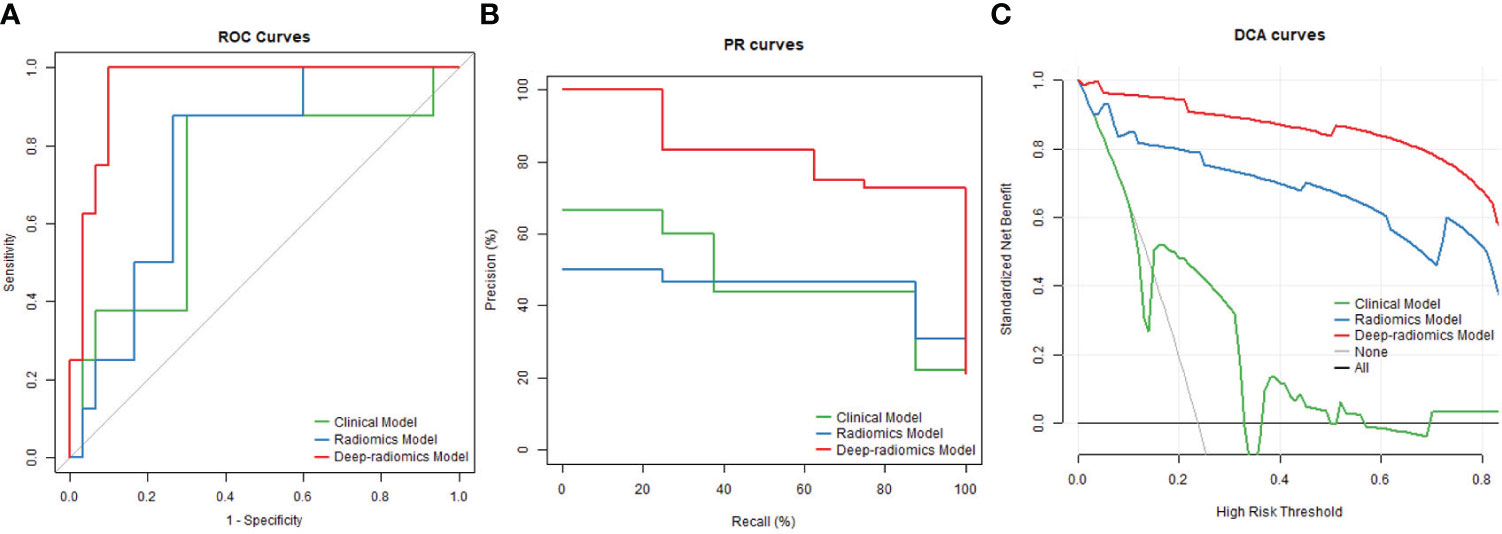
The AUC of the ROC was 0.717 (95% CI: 0.492, 0.941) for the clinical model, 0.771 (95% CI: 0.607, 0.935) for the conventional radiomics model, and 0.954 (95% CI: 0.892, 1.000) for the deep-radiomics model in the test dataset (Figure 6A). The deep-radiomics model exhibited a significantly higher AUC than the clinical model (P = 0.033) and the conventional radiomics model (P = 0.026). However, there was no significant difference between the AUC of the clinical model and the conventional radiomics model (P = 0.570).
The AUC of the PR curve was 0.385 (95% CI: 0.191, 0.696) for the clinical model, 0.373 (95% CI: 0.209, 0.665) for the conventional radiomics model, and 0.805 (95% CI: 0.451, 0.985) for the deep-radiomics model (Figure 6B). The PR AUC difference between the clinical model and the deep-radiomics model was 0.420 (95% BCa: 0.292, 0.651), indicating a statistically significant distinction. Similarly, the PR AUC difference between the conventional radiomics model and the deep-radiomics model was 0.432 (95% BCa: 0.327, 0.638), demonstrating statistical significance. However, the PR AUC difference between the clinical model and the conventional radiomics model was 0.011 (95% BCa: -0.070, 0.216), revealing no statistical significance.
The DCA curve demonstrated superior performance of the deep-radiomics model compared to the conventional radiomics model and the clinical model across all risk thresholds. Additionally, the DCA curve of the conventional radiomics model outperformed the clinical model across all risk thresholds (Figure 6C).
Compared to the clinical model, the conventional radiomics model demonstrated an NRI of 0.359 (95% CI: 0.099, 0.973), and the deep-radiomics model showed a higher NRI of 0.508 (95% CI: 0.309, 1.175). Compared to the conventional radiomics model, the deep-radiomics model showed an NRI of 0.149 (95% CI: 0.032, 0.300).
When using the clinical model as reference, the conventional radiomics model exhibited an IDI of 0.516 (95% CI: 0.294, 0.666), and the deep-radiomics model showed a higher IDI of 0.679 (95% CI: 0.431, 0.795). When comparing the conventional radiomics model to the deep-radiomics model, the IDI was 0.164 (95% CI: -0.045, 0.363) without statistical difference.
4 Discussion
In the current study, we introduced a clinical model and two radiomics models demonstrating favorable accuracy in predicting BCR for patients with advanced PCa and the deep-radiomics model showed the most excellent performance. Several clinical prediction models have been proposed (3–8), and MR radiomics models also showed promising results (10, 13–18). Our findings align with previous studies in terms of the predictive efficiency of radiomics models for BCR. However, our study differs from previous research in three main aspects: (1) patients with advanced PCa who received non-surgical treatment as research objective, (2) the utilization of a pre-trained AI model for automatic segmentation of the ROI, and (3) a comparison between conventional radiomics models and deep learning radiomics models in terms of feature extraction.
MR radiomics models have demonstrated diverse applications in the detection, classification and management of PCa (28, 29). However, studies specifically focusing on radiomics models for predicting BCR remain limitation and exist inconsistency in the methodologies (13–18). A review of literature indicates that a variety of MR imaging sequences were used in BCR prediction models, such as MR perfusion (13), T2WI (15, 17), ADC maps (14), a combination of T2WI and ADC maps (14, 16) and combinations of T1WI with T2WI and DWI (14, 16). In these studies, different types of ROI were annotated, encompassing the prostate gland (13, 17, 18), prostate with an expanded margin (15) and prostate tumor (14–16). Notably, manual annotation methods were predominantly employed for ROI delineation (13, 16–18) and a small number of studies utilized semi-automatic annotation techniques (14, 15). These MR radiomics models demonstrated AUC values ranging from 0.63 to 0.85 for the prediction of BCR (13–18). Our study demonstrated that the three models had predictive performance (AUCs ranging from 0.717 to 0.954) comparable to or slightly better than previous studies. Additionally, a notable strength of this study was the utilization of an automatic annotation approach for ROIs using a pre-trained AI model. This automatic process addresses the inherent challenges associated with manual ROI annotation, such as the labor-intensive nature and the potential for intra- and inter-observer variability, which can compromise the robustness of radiomics models.
Another strength of our study is the comparison of image feature extraction methods in the radiomics pipeline. In the process of constructing radiomics models, the subsequent step after selecting ROI involves extracting image features for training the classifier (20). In our study, we developed two types of radiomics models: a conventional radiomics model and a deep-radiomics model. The key distinction between the two models lies in the approach of feature generation. The conventional radiomics model extracts standard features from ROIs calculated based on predefined formulas, whereas the deep-radiomics model employs deep network architectures to discover task-specific optimal features (21). Predictive features in the deep-radiomics model are learned independently during training, eliminating the need for explicit feature definitions. Given that the deep-radiomics model adapts to the data, it is reasonable to expect it to yield superior results compared to the conventional model. However, in 26% of previous studies, deep-radiomics models did not surpass conventional models (21). It reported that deep-radiomics models outperformed conventional radiomics models with a median increase in the AUC from 0.025 to 0.045. Since it is generally unknown which method will perform best in advance, it is recommended to test multiple methods as a best practice (30). It is inspiring that the predictive model that combined clinical characteristics, visual features, deep learning features, and radiomics features based on computed tomography (CT) or MR images showed improved predictive efficiency (31–33), while the purpose of our study was to find a simple and convenient way to predict the BCR in advanced PCa. If a large number of parameters and complex predictive methods were used, the complexity of operations may affect the efficiency of clinical work and limit predictive models promotion. Therefore, three separate predictive models were evaluated instead of combining them in this study.
In this study, we employed multiple methods to evaluate the performance of predictive models from different perspectives (34). The ROC analysis is commonly used in this type of research because it provides a measure of the overall discriminatory power of a model. However, in our study, PR evaluation was more informative than the ROC because of the imbalanced sample sizes of BCR+ and BCR-. It helps assess the model’s ability to correctly identify positive instances while minimizing false positives (35). While ROC and PR curve provide valuable insights into the model’s classification abilities, they do not directly consider real-world clinical scenarios or the specific context in which the model will be applied. DCA, on the other hand, takes into account the net benefit or harm associated with using a predictive model to guide clinical actions compared to other strategies or no action, thereby providing a more comprehensive evaluation of the model’s performance in terms of its clinical impact (35). Besides, NRI and IRI are commonly used in the field of predictive modeling and risk assessment (34). They provide a way to assess the added value of incorporating certain variables or features into a model compared to a baseline or reference model. They help evaluate to what extent the new model improves the classification or discrimination performance, thereby achieving better risk stratification or outcome prediction. Our results consistently showed that the deep-radiomics model outperformed the other two models in most aspects.
Our study has several inherent limitations that should be acknowledged. First, the retrospective nature conducted in a single center resulted in a relatively small cohort, reducing the statistical power and potentially limiting the generalizability of the findings. Indeed, this is a recurring problem in the field of radiomics research, as seen in examples of other sample sizes in the literature include 49 (36), 120 (15, 16) and 133 (17) patients. In an ideal manner, it is recommended to train an unbiased classifier with the same number of samples from both BCR+ and BCR- groups in the training dataset. The test dataset may be imbalanced, but it is not recommended to have an imbalanced training set. However, considering the distribution of our enrollment cases and previous studies (17, 18), it was not feasible in this study and may lead to inaccurate model parameters. Given AUC is a powerful indicator of classification performance in skewed datasets, we still obtain a reasonable AUC on the test dataset, indicating the robustness of radiomic features in predicting BCR. Our findings are encouraging, as this study provide preliminary evidence of the correlation between imaging and prognosis in advanced cancer patients. Besides, previous study has shown that the performance of the model may decrease due to heterogeneity in the collection protocols and patients with external data validation (37). So our results require a larger validation and external validation before these findings can be applied in the clinical practice. Further study would increase the patient sample size by extend inclusion time and potentially develop this study into a multicenter research project. Second, there was a possibility of selection bias in our study due to the influence of urologists’ and patient-related factors on treatment decisions, which were not fully captured in the data. The diverse treatment options and their impact on prognosis were not thoroughly analyzed. At last, the application of deep learning models in our study focused on a specific network architecture. The reproducibility and generalizability of deep networks remain uncertain, as they are known to be sensitive to initial weights and may exhibit erratic behavior. Further studies should explore the use of alternative network architectures to evaluate their performance.
5 Conclusion
Despite the above limitations, we can conclude that the deep-radiomics model, shows excellent accuracy in predicting BCR in advanced PCa, which may make an effect on treatment methods and subsequent therapeutic interventions. The deep-radiomics model was superior than the clinical model and the conventional radiomics model in the aspect of prediction accuracy, clinical impact and risk assessment.
Data availability statement
The original contributions presented in the study are included in the article/Supplementary Material, further inquiries can be directed to the corresponding author/s.
Ethics statement
The studies involving humans were approved by Ethics Committee of Peking University First Hospital. The studies were conducted in accordance with the local legislation and institutional requirements. The ethics committee/institutional review board waived the requirement of written informed consent for participation from the participants or the participants’ legal guardians/next of kin because this was a retrospective study.
Author contributions
HW: Writing – review & editing, Data curation, Funding acquisition, Investigation, Validation, Visualization, Writing – original draft. KW: Writing – original draft, Formal analysis, Software. YZ: Software, Writing – original draft, Methodology, Validation. YC: Conceptualization, Investigation, Writing – review & editing. XZ: Writing – review & editing, Resources, Software, Validation. XW: Writing – review & editing, Conceptualization, Methodology, Project administration, Supervision.
Funding
The author(s) declare financial support was received for the research, authorship, and/or publication of this article. This study was funded by National High Level Hospital Clinical Research Funding (Scientific Research Seed Fund of Peking University First Hospital) (2022SF52).
Conflict of interest
Author YZ was employed by the company Beijing Smart Tree Medical Technology Co. Ltd.
The remaining authors declare that the research was conducted in the absence of any commercial or financial relationships that could be construed as a potential conflict of interest.
Publisher’s note
All claims expressed in this article are solely those of the authors and do not necessarily represent those of their affiliated organizations, or those of the publisher, the editors and the reviewers. Any product that may be evaluated in this article, or claim that may be made by its manufacturer, is not guaranteed or endorsed by the publisher.
Supplementary material
The Supplementary Material for this article can be found online at: https://www.frontiersin.org/articles/10.3389/fonc.2024.1342104/full#supplementary-material
References
1. Gandaglia G, Leni R, Bray F, Fleshner N, Freedland SJ, Kibel A, et al. Epidemiology and prevention of prostate cancer. Eur Urol Oncol. (2021) 4:877–92. doi: 10.1016/j.euo.2021.09.006
2. Rebello RJ, Oing C, Knudsen KE, Loeb S, Johnson DC, Reiter RE, et al. Prostate cancer. Nat Rev Dis Primers. (2021) 7:9. doi: 10.1038/s41572-020-00243-0
3. Van den Broeck T, van den Bergh RCN, Briers E, Cornford P, Cumberbatch M, Tilki D, et al. Biochemical recurrence in prostate cancer: the european association of urology prostate cancer guidelines panel recommendations. Eur Urol Focus. (2020) 6:231–4. doi: 10.1016/j.euf.2019.06.004
4. Kutluhan MA, Ünal S, Özsoy E, Şahin A, Özayar A, Okulu E, et al. Evaluation of four pre-operative models for prediction of biochemical recurrence after radical prostatectomy in localized prostate cancer. Int J Clin Pract. (2021) 75:e14682. doi: 10.1111/ijcp.14682
5. Cooperberg MR, Pasta DJ, Elkin EP, Litwin MS, Latini DM, Du Chane J, et al. The University of California, San Francisco Cancer of the Prostate Risk Assessment score: a straightforward and reliable preoperative predictor of disease recurrence after radical prostatectomy. J Urol. (2005) 173:1938–42. doi: 10.1097/01.ju.0000158155.33890.e7
6. D’Amico AV, Whittington R, Malkowicz SB, Schultz D, Blank K, Broderick GA, et al. Biochemical outcome after radical prostatectomy, external beam radiation therapy, or interstitial radiation therapy for clinically localized prostate cancer. JAMA. (1998) 280:969–74. doi: 10.1001/jama.280.11.969
7. Yoshioka Y, Inoue T. Prostate Risk Index (PRIX) as a new method of risk classification for clinically localized prostate cancer. Strahlenther Onkol. (2007) 183:490–6. doi: 10.1007/s00066-007-1692-3
8. Soga N, Ogura Y, Wakita T, Kageyama T, Furusawa J. The GP score, a simplified formula (Bioptic gleason score times prostate specific antigen) as a predictor for biochemical failure after prostatectomy in prostate cancer. Curr Urol. (2019) 13:25–30. doi: 10.1159/000499298
9. Boschheidgen M, Schimmöller L, Arsov C, Ziayee F, Morawitz J, Valentin B, et al. MRI grading for the prediction of prostate cancer aggressiveness. Eur Radiol. (2022) 32:2351–9. doi: 10.1007/s00330-021-08332-8
10. Gandaglia G, Ploussard G, Valerio M, Marra G, Moschini M, Martini A, et al. Prognostic implications of multiparametric magnetic resonance imaging and concomitant systematic biopsy in predicting biochemical recurrence after radical prostatectomy in prostate cancer patients diagnosed with magnetic resonance imaging-targeted biopsy. Eur Urol Oncol. (2020) 3:739–47. doi: 10.1016/j.euo.2020.07.008
11. Han C, Ma S, Liu X, Liu Y, Li C, Zhang Y, et al. Radiomics models based on apparent diffusion coefficient maps for the prediction of high-grade prostate cancer at radical prostatectomy: comparison with preoperative biopsy. J Magn Reson Imaging. (2021) 54:1892–901. doi: 10.1002/jmri.27565
12. Ma S, Xie H, Wang H, Han C, Yang J, Lin Z, et al. MRI-based radiomics signature for the preoperative prediction of extracapsular extension of prostate cancer. J Magn Reson Imaging. (2019) 50:1914–25. doi: 10.1002/jmri.26777
13. An P, Lin Y, Hu Y, Qin P, Ye Y, Gu W, et al. Predicting model of biochemical recurrence of prostate carcinoma (PCa-BCR) using MR perfusion-weighted imaging-based radiomics. Technol Cancer Res Treat. (2023) 22:15330338231166766. doi: 10.1177/15330338231166766
14. Bourbonne V, Fournier G, Vallières M, Lucia F, Doucet L, Tissot V, et al. External validation of an MRI-derived radiomics model to predict biochemical recurrence after surgery for high-risk prostate cancer. Cancers (Basel). (2020) 12:814. doi: 10.3390/cancers12040814
15. Dinis Fernandes C, Dinh CV, Walraven I, Heijmink SW, Smolic M, van Griethuysen JJM, et al. Biochemical recurrence prediction after radiotherapy for prostate cancer with T2w magnetic resonance imaging radiomic features. Phys Imaging Radiat Oncol. (2018) 7:9–15. doi: 10.1016/j.phro.2018.06.005
16. Shiradkar R, Ghose S, Jambor I, Taimen P, Ettala O, Purysko AS, et al. Radiomic features from pretreatment biparametric MRI predict prostate cancer biochemical recurrence: Preliminary findings. J Magn Reson Imaging. (2018) 48:1626–36. doi: 10.1002/jmri.26178
17. Shiradkar R, Ghose S, Mahran A, Li L, Hubbard I, Fu P, et al. Prostate surface distension and tumor texture descriptors from pre-treatment MRI are associated with biochemical recurrence following radical prostatectomy: preliminary findings. Front Oncol. (2022) 12:841801. doi: 10.3389/fonc.2022.841801
18. Zhong QZ, Long LH, Liu A, Li CM, Xiu X, Hou XY, et al. Radiomics of multiparametric MRI to predict biochemical recurrence of localized prostate cancer after radiation therapy. Front Oncol. (2020) 10:731. doi: 10.3389/fonc.2020.00731
19. Guiot J, Vaidyanathan A, Deprez L, Zerka F, Danthine D, Frix AN, et al. A review in radiomics: Making personalized medicine a reality via routine imaging. Med Res Rev. (2022) 42:426–40. doi: 10.1002/med.21846
20. Avanzo M, Wei L, Stancanello J, Vallières M, Rao A, Morin O, et al. Machine and deep learning methods for radiomics. Med Phys. (2020) 47:e185–202. doi: 10.1002/mp.13678
21. Demircioğlu A. Are deep models in radiomics performing better than generic models? A systematic review. Eur Radiol Exp. (2023) 7:11. doi: 10.1186/s41747-023-00325-0
22. Sun Z, Wu P, Cui Y, Liu X, Wang K, Gao G, et al. Deep-learning models for detection and localization of visible clinically significant prostate cancer on multi-parametric MRI. J Magn Reson Imaging. (2023) 58:1067–81. doi: 10.1002/jmri.28608
23. Bulten W, Pinckaers H, van Boven H, Vink R, de Bel T, van Ginneken B, et al. Automated deep-learning system for gleason grading of prostate cancer using biopsies: A diagnostic study. Lancet Oncol. (2020) 21:233–41. doi: 10.1016/S1470-2045(19)30739-9
24. Wessels F, Schmitt M, Krieghoff-Henning E, Jutzi T, Worst TS, Waldbillig F, et al. Deep learning approach to predict lymph node metastasis directly from primary tumor histology in prostate cancer. BJU Int. (2021) 128:352–60. doi: 10.1111/bju.15386
25. Yan Y, Shao L, Liu Z, He W, Yang G, Liu J, et al. Deep learning with quantitative features of magnetic resonance images to predict biochemical recurrence of radical prostatectomy: A multi-center study. Cancers (Basel). (2021) 13:3098. doi: 10.3390/cancers13123098
26. Mottet N, van den Bergh RCN, Briers E, Van den Broeck T, Cumberbatch MG, De Santis M, et al. EAU-EANM-ESTRO-ESUR-SIOG guidelines on prostate cancer-2020 update. Part 1: screening, diagnosis, and local treatment with curative intent. Eur Urol. (2021) 79:243–62. doi: 10.1016/j.eururo.2020.09.042
27. Jia X, Zhai Y, Song D, Wang Y, Wei S, Yang F, et al. A multiparametric MRI-based radiomics nomogram for preoperative prediction of survival stratification in glioblastoma patients with standard treatment. Front Oncol. (2022) 12:758622. doi: 10.3389/fonc.2022.758622
28. Sun Y, Reynolds HM, Parameswaran B, Wraith D, Finnegan ME, Williams S, et al. Multiparametric MRI and radiomics in prostate cancer: a review. Australas Phys Eng Sci Med. (2019) 42:3–25. doi: 10.1007/s13246-019-00730-z
29. Ferro M, de Cobelli O, Musi G, Del Giudice F, Carrieri G, Busetto GM, et al. Radiomics in prostate cancer: an up-to-date review. Ther Adv Urol. (2022) 14:17562872221109020. doi: 10.1177/17562872221109020
30. Rodrigues A, Rodrigues N, Santinha J, Lisitskaya MV, Uysal A, Matos C, et al. Value of handcrafted and deep radiomic features towards training robust machine learning classifiers for prediction of prostate cancer disease aggressiveness. Sci Rep. (2023) 13:6206. doi: 10.1038/s41598-023-33339-0
31. Liang D, Fan Y, Zeng Y, Zhou H, Zhou H, Li G, et al. Development and validation of a deep learning and radiomics combined model for differentiating complicated from uncomplicated acute appendicitis. Acad Radiol. (2023) 27:S1076–6332(23)00433-6. doi: 10.1016/j.acra.2023.08.018
32. Khanfari H, Mehranfar S, Cheki M, Mohammadi Sadr M, Moniri S, Heydarheydari S, et al. Exploring the efficacy of multi-flavored feature extraction with radiomics and deep features for prostate cancer grading on mpMRI. BMC Med Imaging. (2023) 23:195. doi: 10.1186/s12880-023-01140-0
33. Zhang J, Zhao Y, Lu Y, Li P, Dang S, Li X, et al. Meningioma consistency assessment based on the fusion of deep learning features and radiomics features. Eur J Radiol. (2023) 5:170:111250. doi: 10.1016/j.ejrad.2023.111250
34. Steyerberg EW, Vickers AJ, Cook NR, Gerds T, Gonen M, Obuchowski N, et al. Assessing the performance of prediction models: a framework for traditional and novel measures. Epidemiology (2010) 21(1):128–38. doi: 10.1097/EDE.0b013e3181c30fb2
35. Saito T, Rehmsmeier M. The precision-recall plot is more informative than the ROC plot when evaluating binary classifiers on imbalanced datasets. PLoS One (2015) 10(3):e0118432. doi: 10.1371/journal.pone.0118432
36. Gugliandolo SG, Pepa M, Isaksson LJ, Marvaso G, Raimondi S, Botta F, et al. MRI-based radiomics signature for localized prostate cancer: a new clinical tool for cancer aggressiveness prediction? Sub-study of prospective phase II trial on ultra-hypofractionated radiotherapy (AIRC IG-13218). Eur Radiol. (2021) 31:716–28. doi: 10.1007/s00330-020-07105-z
Keywords: prostate cancer, biochemical recurrence, apparent diffusion coefficient, radiomics, deep learning
Citation: Wang H, Wang K, Zhang Y, Chen Y, Zhang X and Wang X (2024) Deep learning-based radiomics model from pretreatment ADC to predict biochemical recurrence in advanced prostate cancer. Front. Oncol. 14:1342104. doi: 10.3389/fonc.2024.1342104
Received: 21 November 2023; Accepted: 05 February 2024;
Published: 27 February 2024.
Edited by:
Nesrin Dogan, University of Miami, United StatesReviewed by:
Rodrigo Delgadillo, University of Miami Health System, United StatesGiulia Marvaso, University of Milan, Italy
Copyright © 2024 Wang, Wang, Zhang, Chen, Zhang and Wang. This is an open-access article distributed under the terms of the Creative Commons Attribution License (CC BY). The use, distribution or reproduction in other forums is permitted, provided the original author(s) and the copyright owner(s) are credited and that the original publication in this journal is cited, in accordance with accepted academic practice. No use, distribution or reproduction is permitted which does not comply with these terms.
*Correspondence: Xiaoying Wang, d2FuZ3hpYW95aW5nQGJqbXUuZWR1LmNu
 Huihui Wang1
 Yuke Chen
 Xiaodong Zhang
 Xiaoying Wang