- 1Department of General Surgery, Guangdong Provincial People’s Hospital (Guangdong Academy of Medical Sciences), Southern Medical University, Guangzhou, China
- 2School of Medicine, South China University of Technology, Guangzhou, China
- 3Department of General Surgery, Heyuan People’s Hospital, Heyuan, China
Background: Accurate detection of the histological grade of pancreatic neuroendocrine tumors (PNETs) is important for patients’ prognoses and treatment. Here, we investigated the performance of radiological image-based artificial intelligence (AI) models in predicting histological grades using meta-analysis.
Method: A systematic literature search was performed for studies published before September 2023. Study characteristics and diagnostic measures were extracted. Estimates were pooled using random-effects meta-analysis. Evaluation of risk of bias was performed by the QUADAS-2 tool.
Results: A total of 26 studies were included, 20 of which met the meta-analysis criteria. We found that the AI-based models had high area under the curve (AUC) values and showed moderate predictive value. The pooled distinguishing abilities between different grades of PNETs were 0.89 [0.84-0.90]. By performing subgroup analysis, we found that the radiomics feature-only models had a predictive value of 0.90 [0.87-0.92] with I2 = 89.91%, while the pooled AUC value of the combined group was 0.81 [0.77-0.84] with I2 = 41.54%. The validation group had a pooled AUC of 0.84 [0.81-0.87] without heterogenicity, whereas the validation-free group had high heterogenicity (I2 = 91.65%, P=0.000). The machine learning group had a pooled AUC of 0.83 [0.80-0.86] with I2 = 82.28%.
Conclusion: AI can be considered as a potential tool to detect histological PNETs grades. Sample diversity, lack of external validation, imaging modalities, inconsistent radiomics feature extraction across platforms, different modeling algorithms and software choices were sources of heterogeneity. Standardized imaging, transparent statistical methodologies for feature selection and model development are still needed in the future to achieve the transformation of radiomics results into clinical applications.
Systematic Review Registration: https://www.crd.york.ac.uk/prospero/, identifier CRD42022341852.
Introduction
Pancreatic neuroendocrine tumors (PNETs), which account for 3–5% of all pancreatic tumors, are a heterogeneous group of tumors derived from pluripotent stem cells of the neuroendocrine system (1–3). In the past 10 years, the incidence and prevalence of PNETs have steadily increased (4–6). Unlike malignant tumors, PNETs are heterogeneous: they range from indolent to aggressive (7, 8). The World Health Organization (WHO) histological grading system is used to evaluate the features of PNETs, and a treatment strategy is developed accordingly (9, 10). Therefore, accurate evaluation of the histological grade is crucial for patients with PNETs; non-invasive methods are helpful, especially for tumors that are difficult to biopsy.
The application of artificial intelligence (AI) to medicine is becoming more common; it is useful in areas such as radiology, pathology, genomics, and proteomics (11–14), with broad applications in disease diagnosis and treatment (15–18). Owing to developments in AI technology, radiomic analysis can now be used to predict PNETs grade, with promising results (19, 20). A study by Guo et al. (21), which included 37 patients with PNETs, showed that the portal enhancement ratio, arterial enhancement ratio, mean grey-level intensity, kurtosis, entropy, and uniformity were significant predictors of histological grade. Luo et al. (22) found that by using specific computed tomography (CT) images, the deep learning (DL) algorithm achieved a higher accuracy rate than radiologists (73.12% vs. 58.1%) from G3 to G1/G2. Despite promising results, other studies with different methodologies have produced different findings. Thus, quantitative analysis will be valuable for comparing study efficacy and assessing the overall predictive power of AI in detecting the histological grade for PNETs.
In this review, we aimed to systematically summarize the latest literature on AI histological grade prediction for PNETs. By performing a meta-analysis, we aimed to evaluate AI accuracy and provide evidence for its clinical application and role in decision making.
Materials and methods
This combined systematic review and meta-analysis was based on the Preferred Reporting Items for Systematic reviews and Meta-Analyses (PRISMA) guidelines. The study was registered in the Prospective Register of Systematic Reviews (PROSPERO ID: CRD42022341852).
Search strategy
Primary publications were extracted from multiple electronic databases (PubMed, MEDLINE, Cocorane and Web of Science) in September 2023 using radiomics/DL/machine learning (ML)/AI on CT/magnetic resonance imaging (MRI) examinations of PNETs grade. The search terms consisted of ML, AI, radiomics, or DL, along with PNETs grade. The detail of search string was as follows: (radiomics or machine learning or deep learning or artificial intelligence)and (PNETs or pancreatic neuroendocrine tumors). The reference lists of generated studies were then screened for eligibility.
Study selection
Two researchers determined the eligibility of each article by title and abstract evaluation and removed the duplicates. Case reports, non-original investigations (e.g., editorials, letters, and reviews), and studies that did not focus on the topic of interest were excluded. Based on the “PICOS” principle, the following inclusion criteria were designed. 1) All studies about PNETs grading which trained the models using only histology (and not biopsy) as gold standard were selected; 2) All PNETs grading predictive models built by AI were included. 3) Compared with physicians or models obtained from clinical and traditional imaging characteristics; 4) The main research purposes of the included studies were to differentiate the grades of PNETs; 5) Research types: case-control studies, cohort studies, nested case-control studies, and case-cohort studies; 6) English language. Exclusion criteria were: 1) Only the influencing factors were analyzed and a complete risk model was not built; 2) guides, case reports and non-original investigations (e.g., editorials, letters, meta-analyses and reviews); 3) other than English and animal studies. Any disagreements were resolved by consensus arbitrated by a third author.
Data extraction
Data extraction was performed independently by two reviewers, and any discrepancies were resolved by a third reviewer. The extracted data included first author, country, year of publication, study aim, study type, number of patients, sample size, validation, treatment, reference standard, imaging modality and features, methodology, model features and algorithm, software segmentation, and use of clinical information (e.g., age, tumor stage, and expression biomarkers). A detailed description of the true positive (TP), false positive (FP), true negative (TN), false negative (FN), sensitivity, and specificity were recorded. The AUC value of the validation group along with the 95% confidence interval (CI) or standard error (SE) of the model was also collected if reported.
Quality assessment
All included studies were independently assessed using the radiomics quality score (RQS), for image acquisition, radiomics feature extraction, data modeling, model validation, and data sharing. Each of the sixteen items was scored within a range of -8–36. Subsequently, the score was converted to a percentage, where -8 to 0 was defined as 0% and 36 as 100% (23).
The methodological quality of the included studies was accessed by the Quality Assessment of Diagnostic Accuracy Studies 2 (QUADAS-2) criteria (24). Two reviewers independently performed data extraction and quality assessment. Disagreements between the two reviewers were discussed at a research meeting until a consensus was reached.
Statistical analysis
Three software packages, Stata, version 12.0, MedCalc for Windows, version 16.4.3 (MedCalc Software, Ostend, Belgium), and RevMan, version 5.3.21 were used for statistical analysis. A bivariate meta-analysis model was employed to calculate the pooled sensitivity, specificity, positive likelihood ratio (PLR), negative likelihood ratio (NLR), and diagnostic odds ratio (DOR), respectively. The symmetric receiver operating characteristic (SROC) curve was generated. The I2 value was used to assess statistical heterogeneity and estimate the percentage of variability among the included studies. An I2 value >50% indicated substantial heterogeneity, and a random-effects model was used to analyze the differences within and between studies. In contrast, if the value was <50%, it signified less heterogeneity and a fixed-effects model was used (25). Meta-regression and subgroup analysis were conducted to explore the sources of heterogeneity. Moreover, the sensitivity analysis was also performed to evaluate the stability. Deeks’ funnel plot was used to examine publication bias. A p value less than 0.05 was considered significant. Fagan’s nomogram was employed to examine the post-test probability.
Results
Literature selection
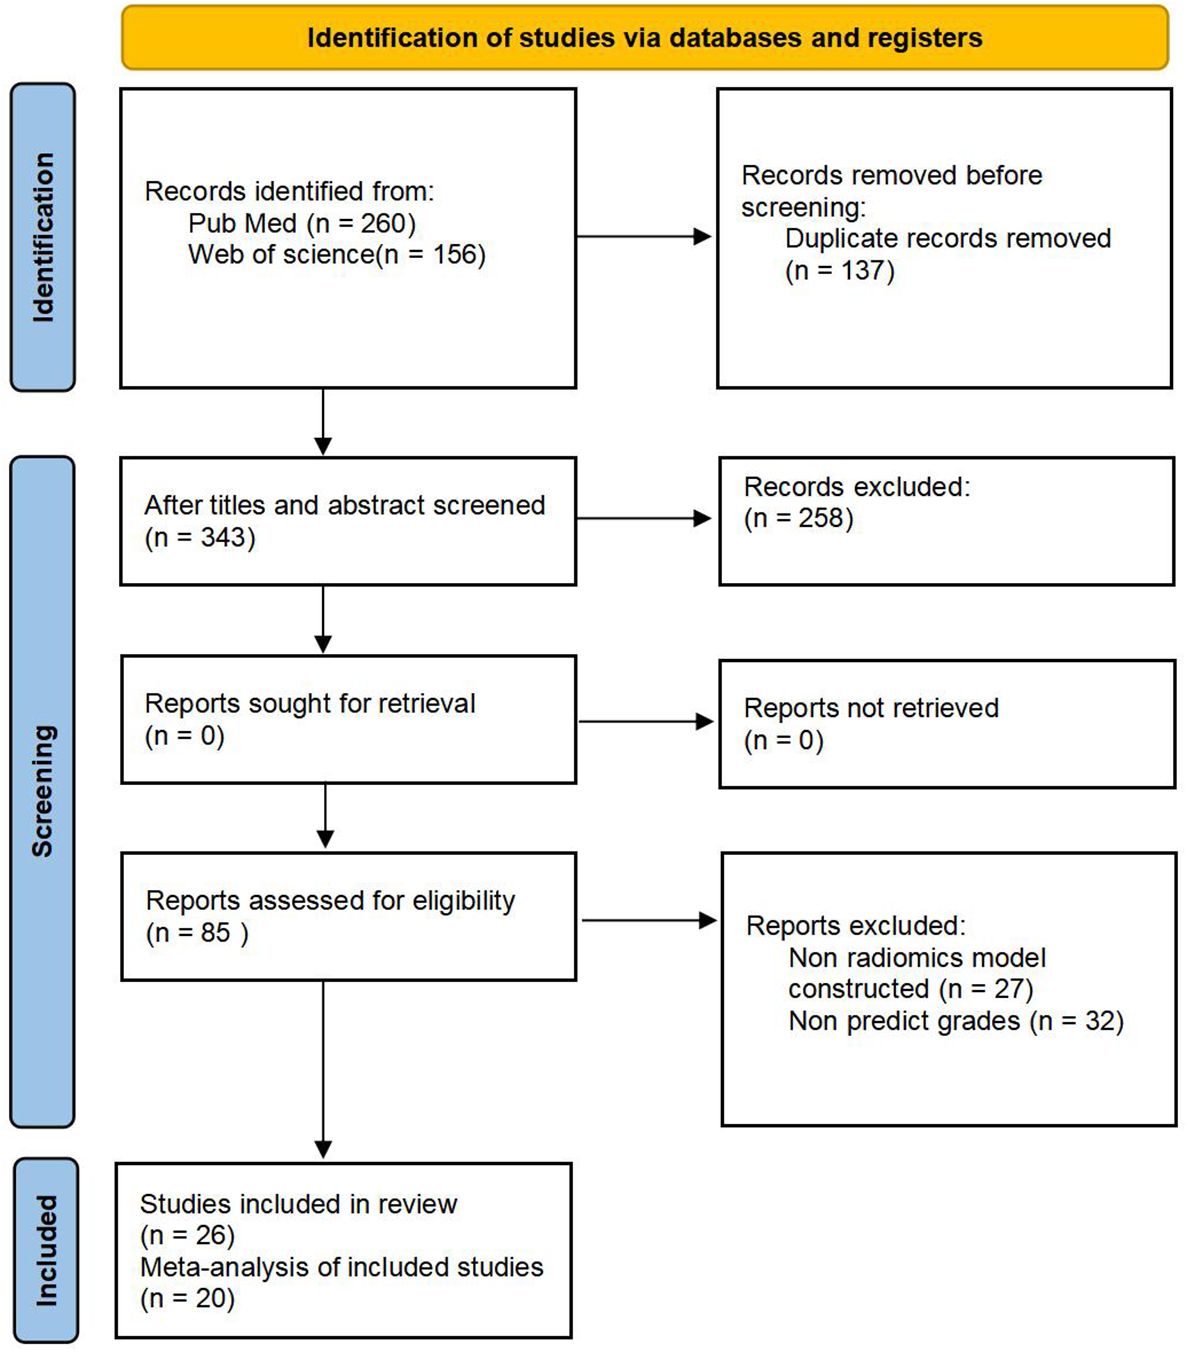
We retrieved 260 articles from PubMed and 156 from Web of Science; 137 were duplicates and were eliminated, resulting in 343 studies. After screening titles and abstracts, 85 potentially eligible articles were identified. After full-text review, six articles were excluded because of insufficient information; thus, 26 articles were included in this systematic review (21, 22, 26–49). Among them, six studies lacked information on positive and negative diagnosis values; therefore, only 20 articles were eligible for the meta-analysis. The results of the literature search are shown in Figure 1.
Quality and risk bias assessment
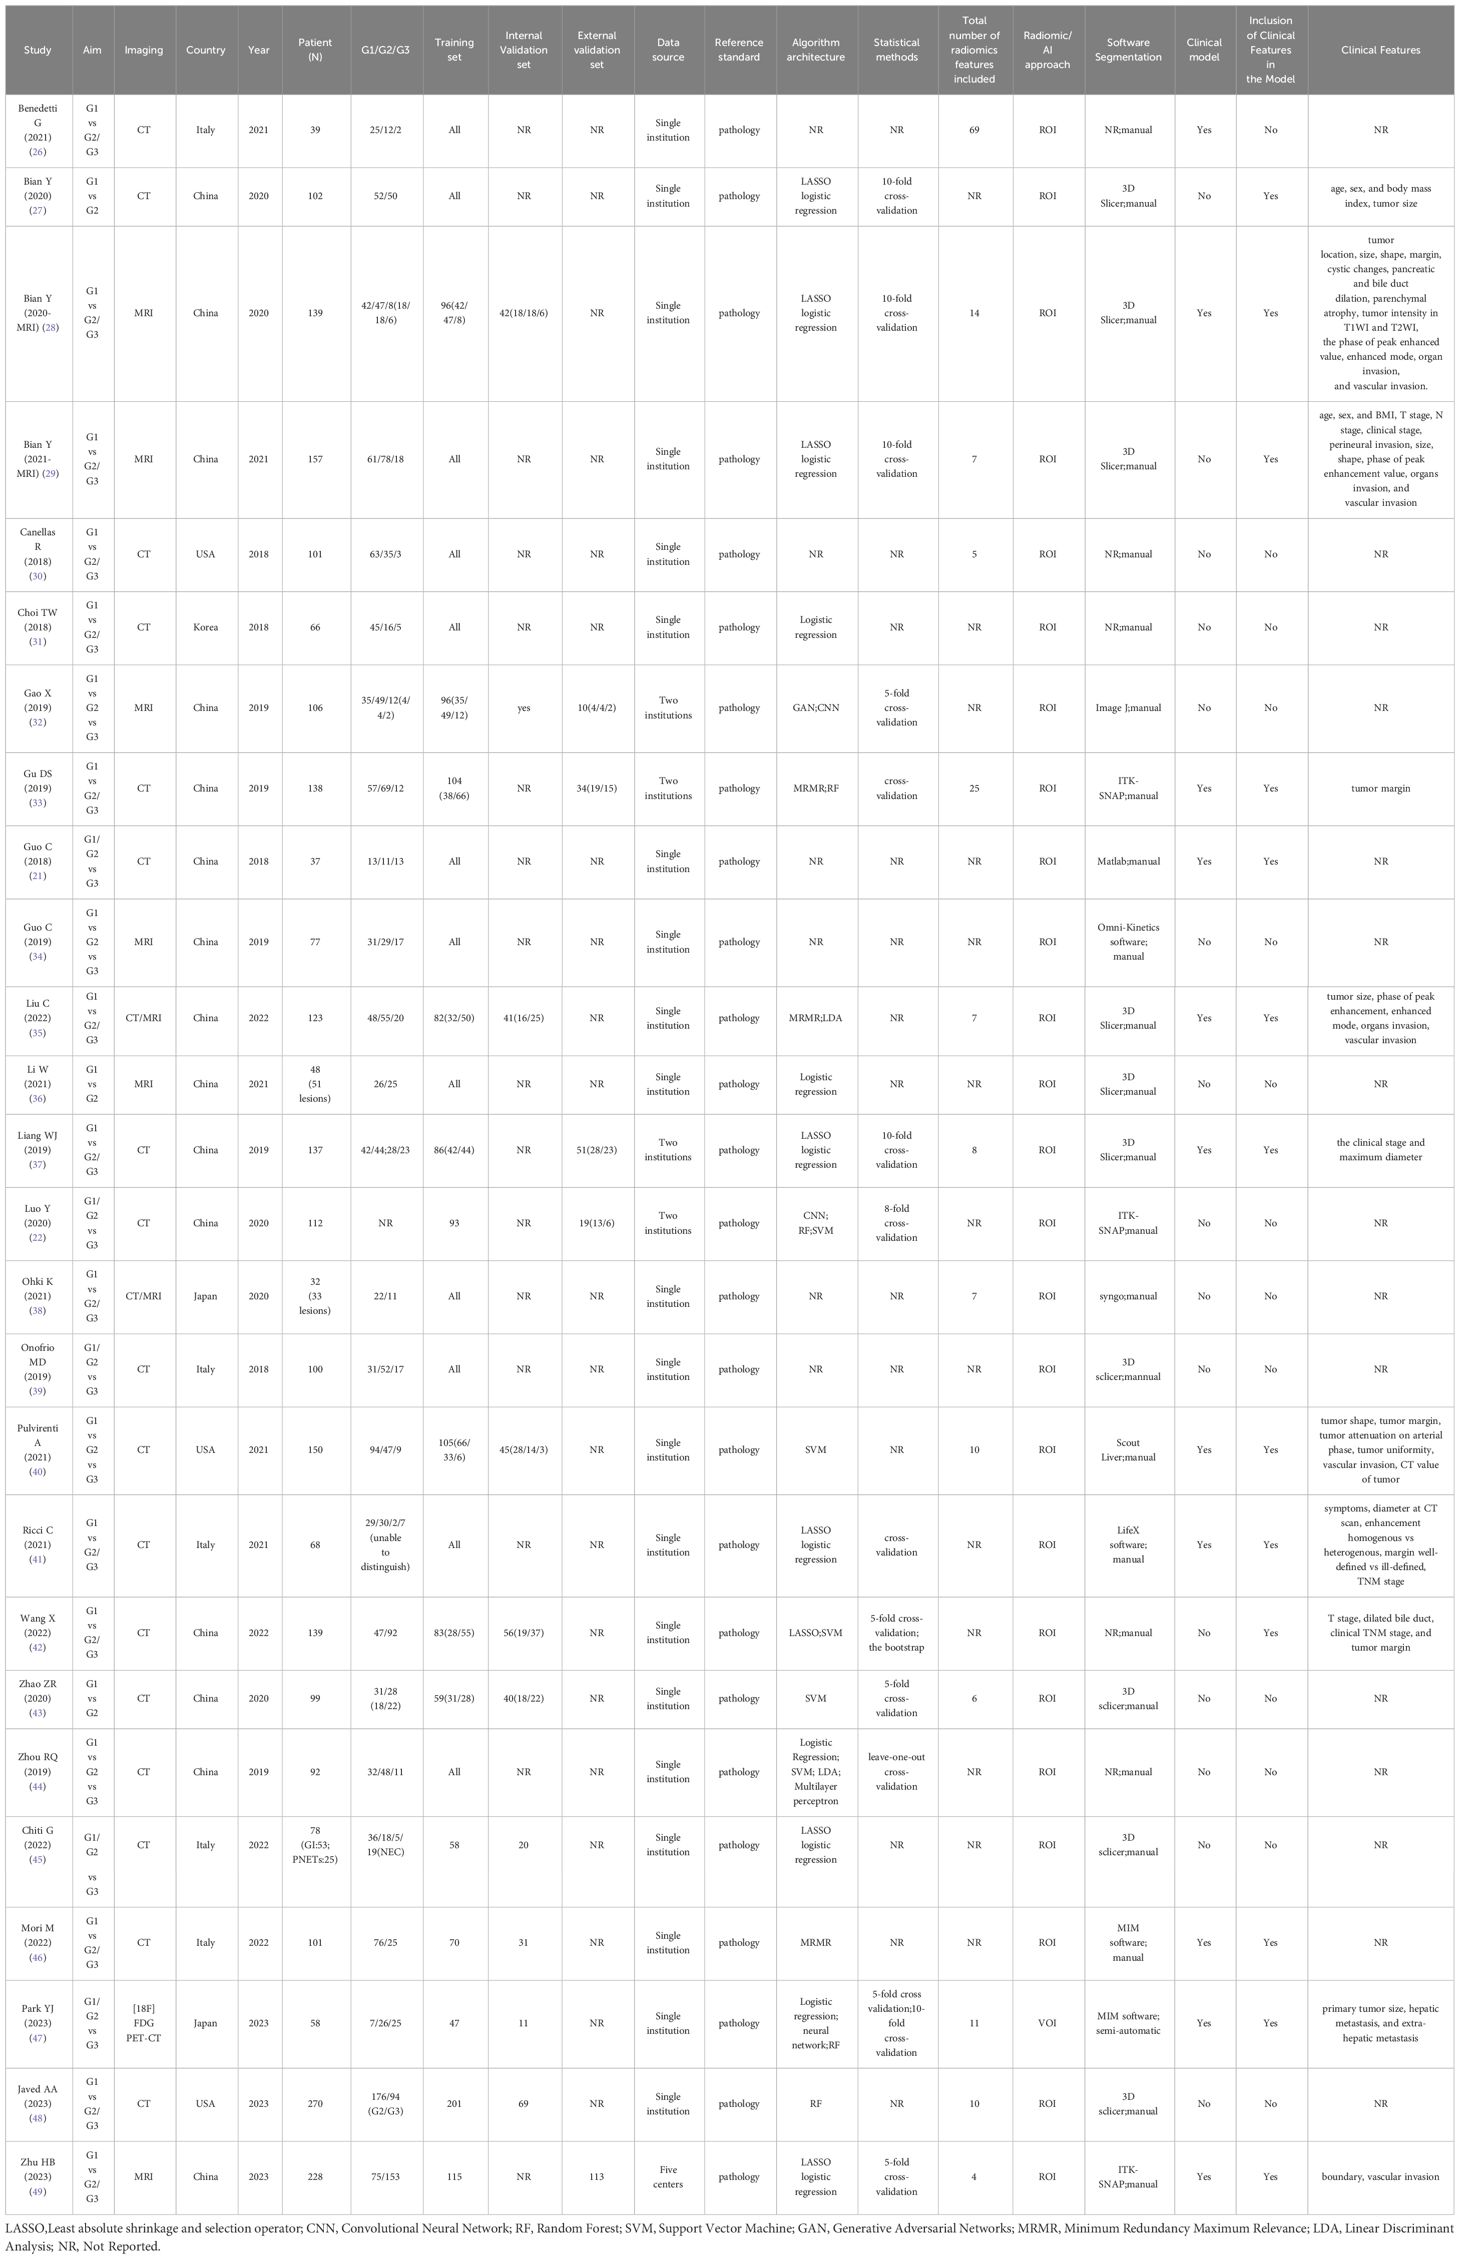
As shown in Table 1, the selected articles were published between 2018 and 2023. The RQS average total and relative scores were 9.58 (2–20) and 26.60% (5.56–55.56%), respectively. No validation group in 13 studies, and five were based on two datasets from more than two distinct institutes. Due to the lack of prospective studies, deficiency of phantom studies on all scanners, absence of imaging at multiple time points, shortness of cost-effectiveness analysis, and unavailable open science and data, all the 11 included studies obtained the point of zero in these items. A detailed report of the RQS allocated by the expert reader is presented in Supplementary Table S1.
Study quality and risk of bias were assessed using the QUADAS-2 criteria; the details are presented in Supplementary Figure S1. A majority of studies showed a low or unclear risk of bias in each domain. In the Patient Selection domain, one study is at high risk, 25 studies are at moderate risk, and this risk mainly arises from “discontinuous patient inclusion”. In the Index Test domain, 9 studies are at moderate risk due to the insufficient information provided to make a judgment, while others were at low risk. In the Reference Standard domain, only one study is at high risk because some patients cannot be accurately categorized to the specific grading in this study. In the Flow and Timing domain, all were at low risk.
Publication bias
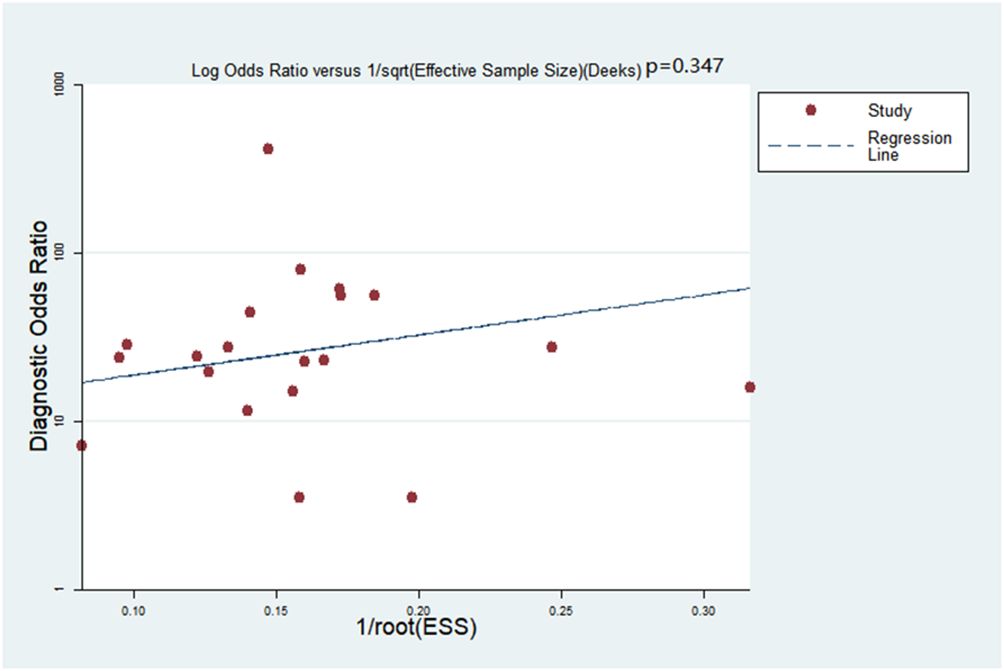
Deeks’ funnel plot asymmetry test was adopted to detect publication bias: no bias was detected within the meta-analysis (p=0.347, Figure 2).
Clinical diagnostic value of grading PNETs
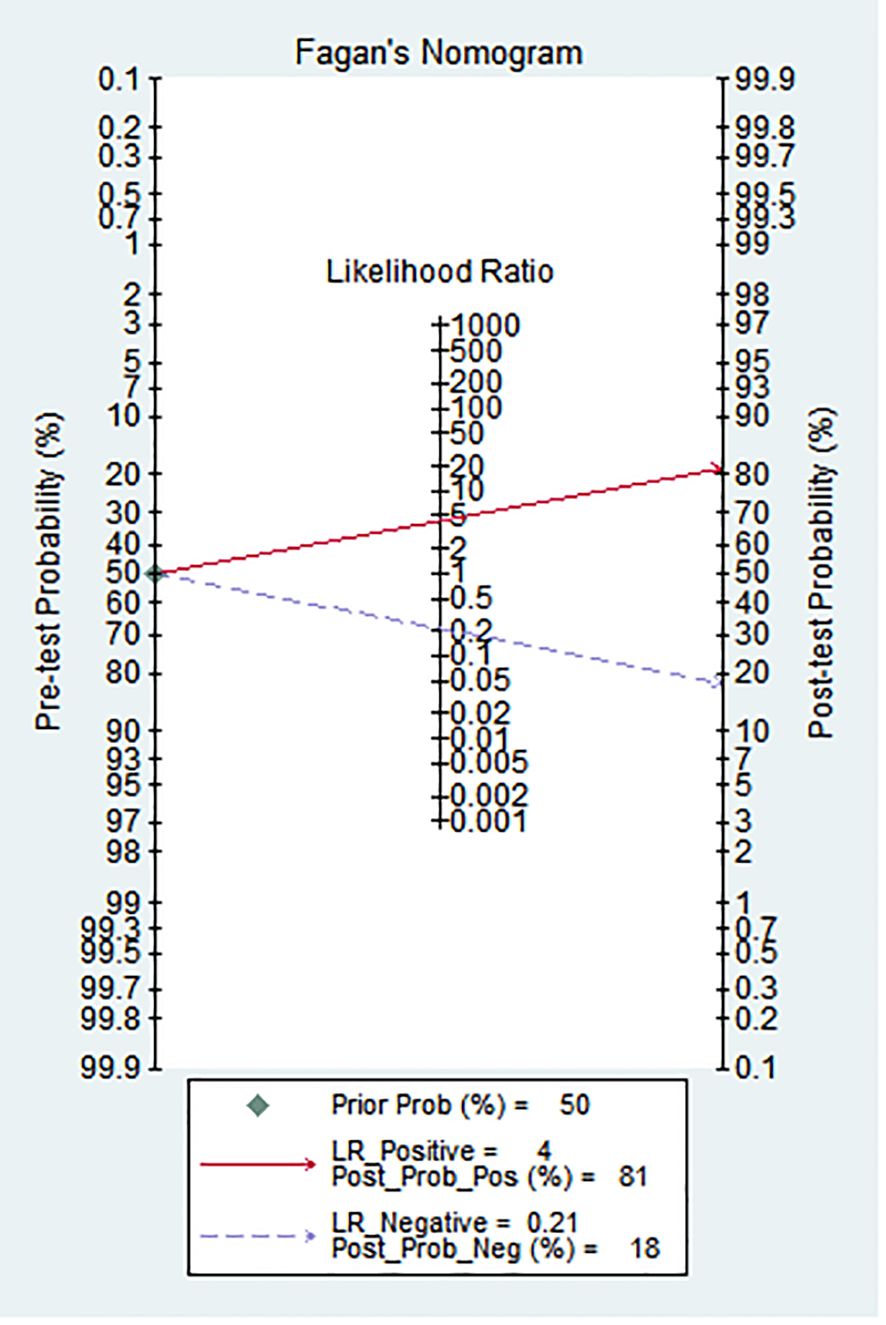
As shown in Figure 3, Fagan’s nomogram was useful for evaluating the diagnostic value of PNETs grade, and clinical application. The results showed an increase of post-test probability of the positive result (at 50%) to 81%, and a decrease of the negative result to 4%.
Study characteristics
Study characteristics are summarized in Table 1. All studies employed a retrospective design, were published between 2018 and 2023, and the number of included patients was 32–270. Among the 26 studies, China was the main publication country (15 studies), followed by Italy (5 studies), the USA (3 studies), Korea (2 study), and Japan (1 study). Nineteen studies were based on CT and eight on MRI images, while two combined images from CT and MRI, and one applied for PET-CT. Thirteen of the 26 studies had validation sets; five were externally validated using data from another institute. The majority (20/26) used different kinds of ML classifications (such as Randon Rorest (RF); Support Vector Machine (SVM); Least absolute shrinkage and selection operator (LASSO) logistic regression), and two of them adopted Convolutional Neural Network (CNN). About half of the included studies (11/21) used models combined with clinical features (such as tumor size, tumor margin, TMN stage, etc.), while others used only radiomics features. Thirteen studies applied cross-validation to select stable features between observers.
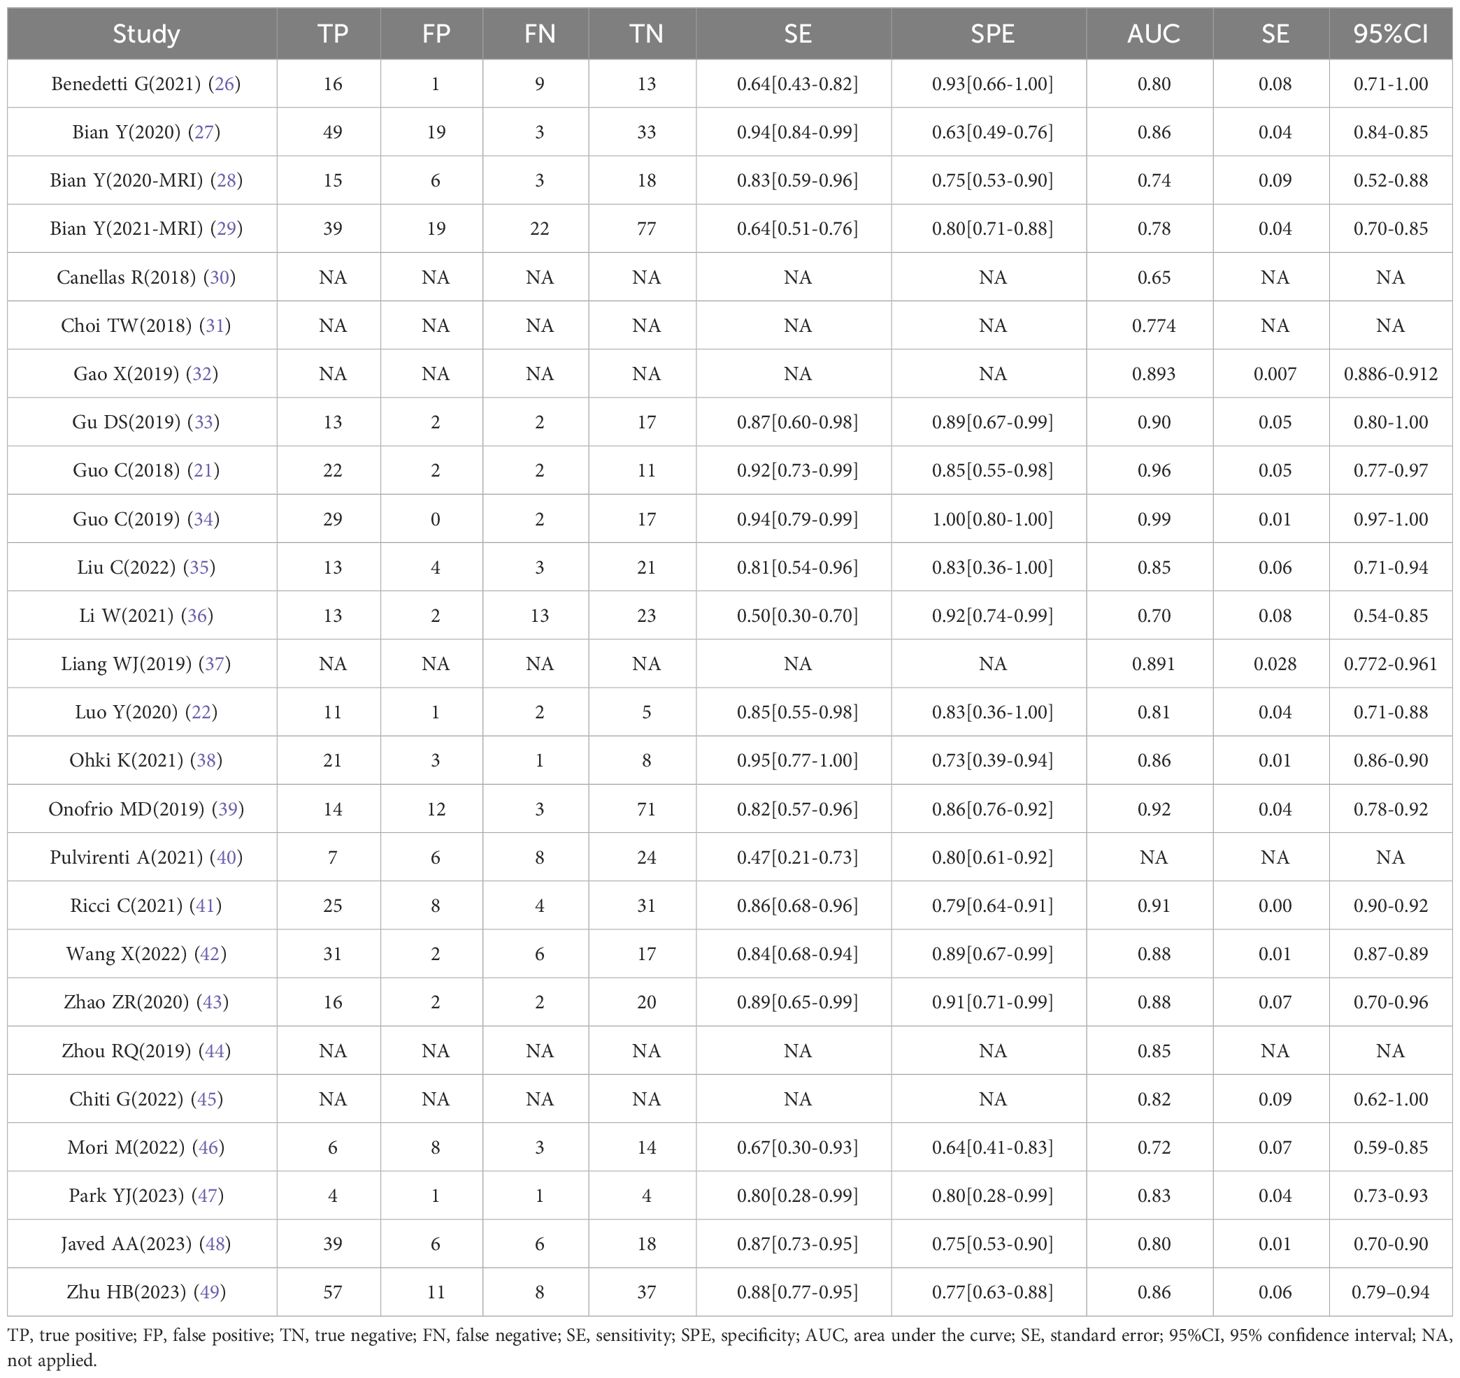
The details of TP/FP/FN/TN and the models’ sensitivity and specificity are shown in Table 2. The highest area under the curve (AUC) value of the AI-based validation model was 0.99 (95% CI: 0.97–1.00). Six studies offered no details regarding TP/FP/FN/TN, and the AUC value of four studies was incomplete; thus, all of these six studies were excluded in meta-analysis.
Meta-analysis
Overall performance of the AI models
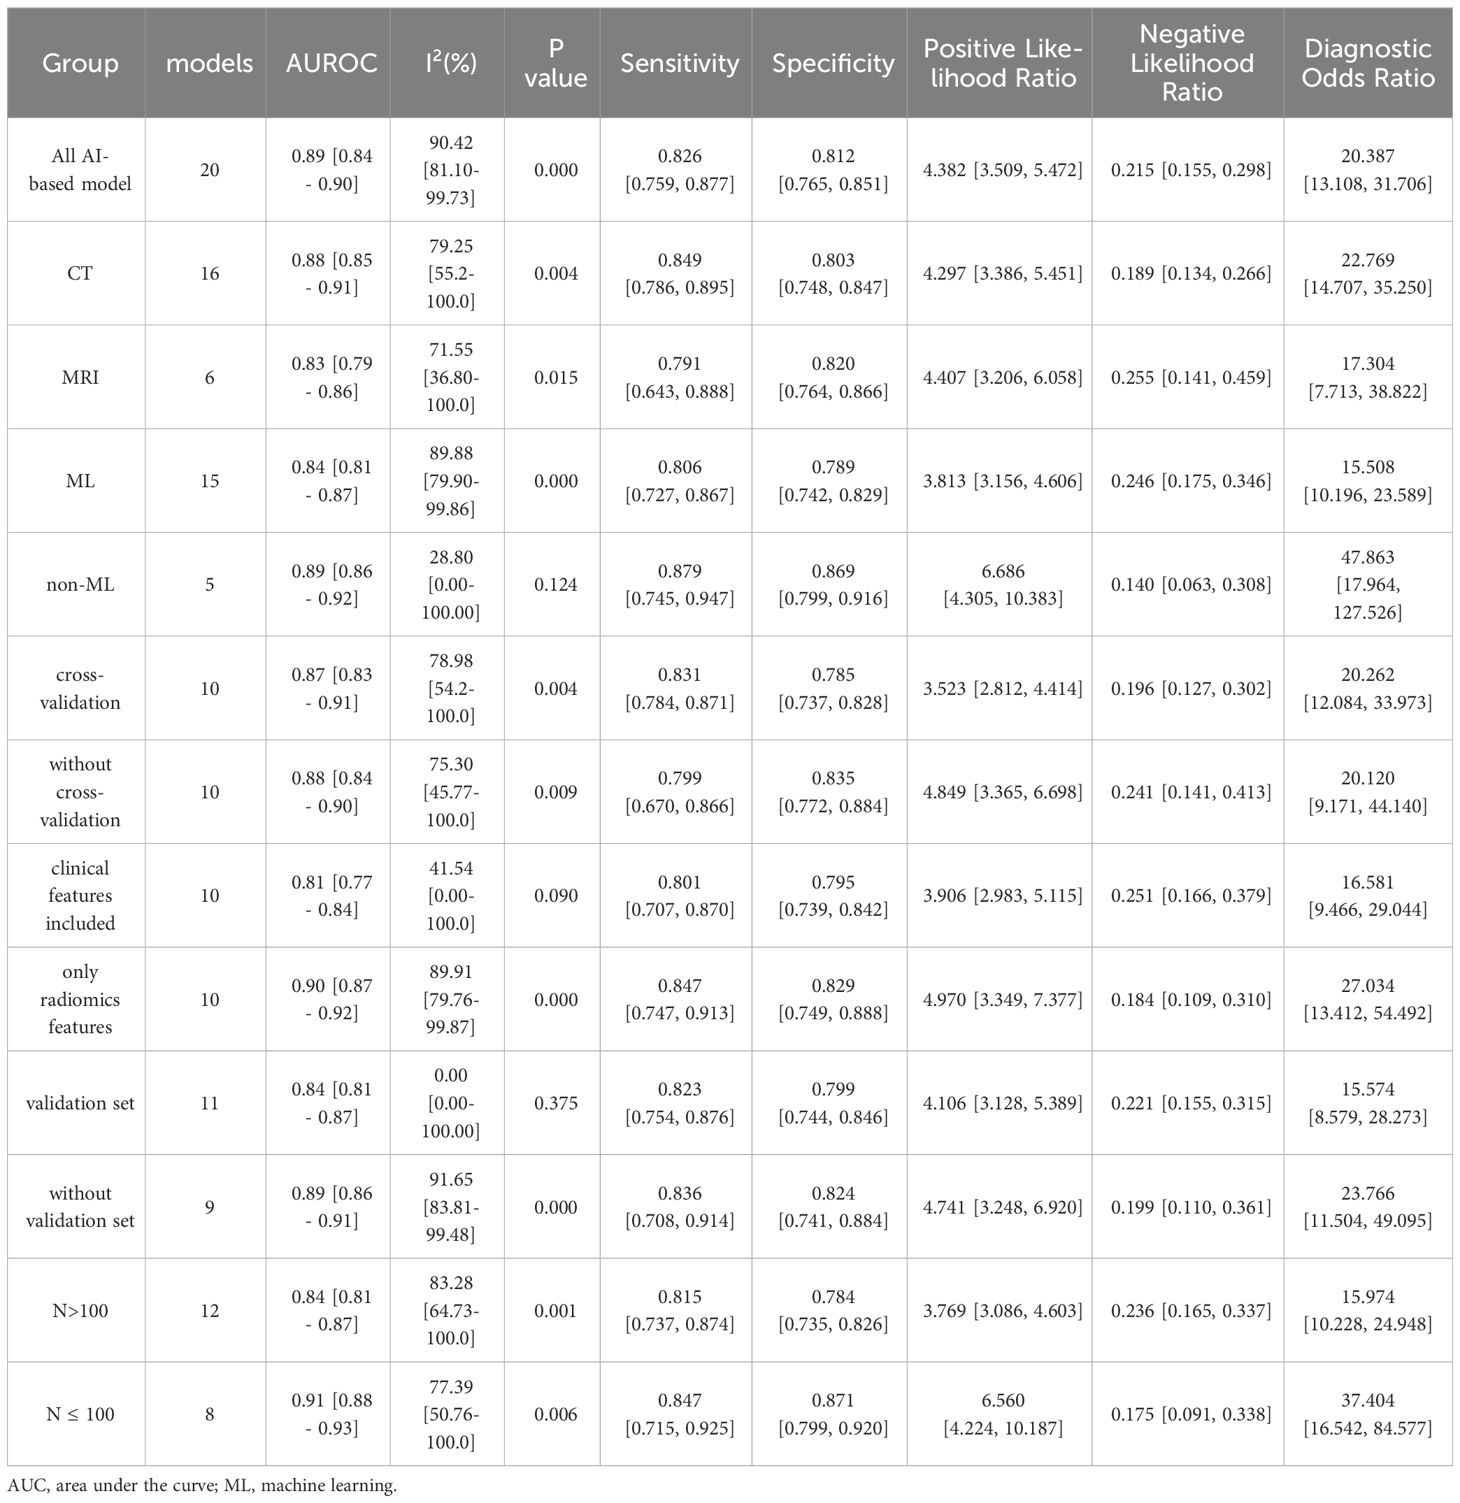
Twenty studies with 2639 patients were included in the meta-analysis, which provided data on TP/FP/FN/TN and model sensitivity and specificity, and 19 studies offered the AUC with 95% CI of the models. The results are reported in Tables 2 and 3 and Figure 4. The AI models for PNETs showed an overall pooled sensitivity of 0.826 [0.759, 0.877], a pooled specificity of 0.812 [0.765, 0.851] and the pooled PLR and NLR were 4.382 [3.509, 5.472] and 0.215 [0.155, 0.298], respectively. Moreover, the pooled DOR was 20.387 [13.108, 31.706], and the AUC of the SROC curve was 0.89 [0.84-0.90] with I2 = 90.42% [81.10-99.73], P=0.000.
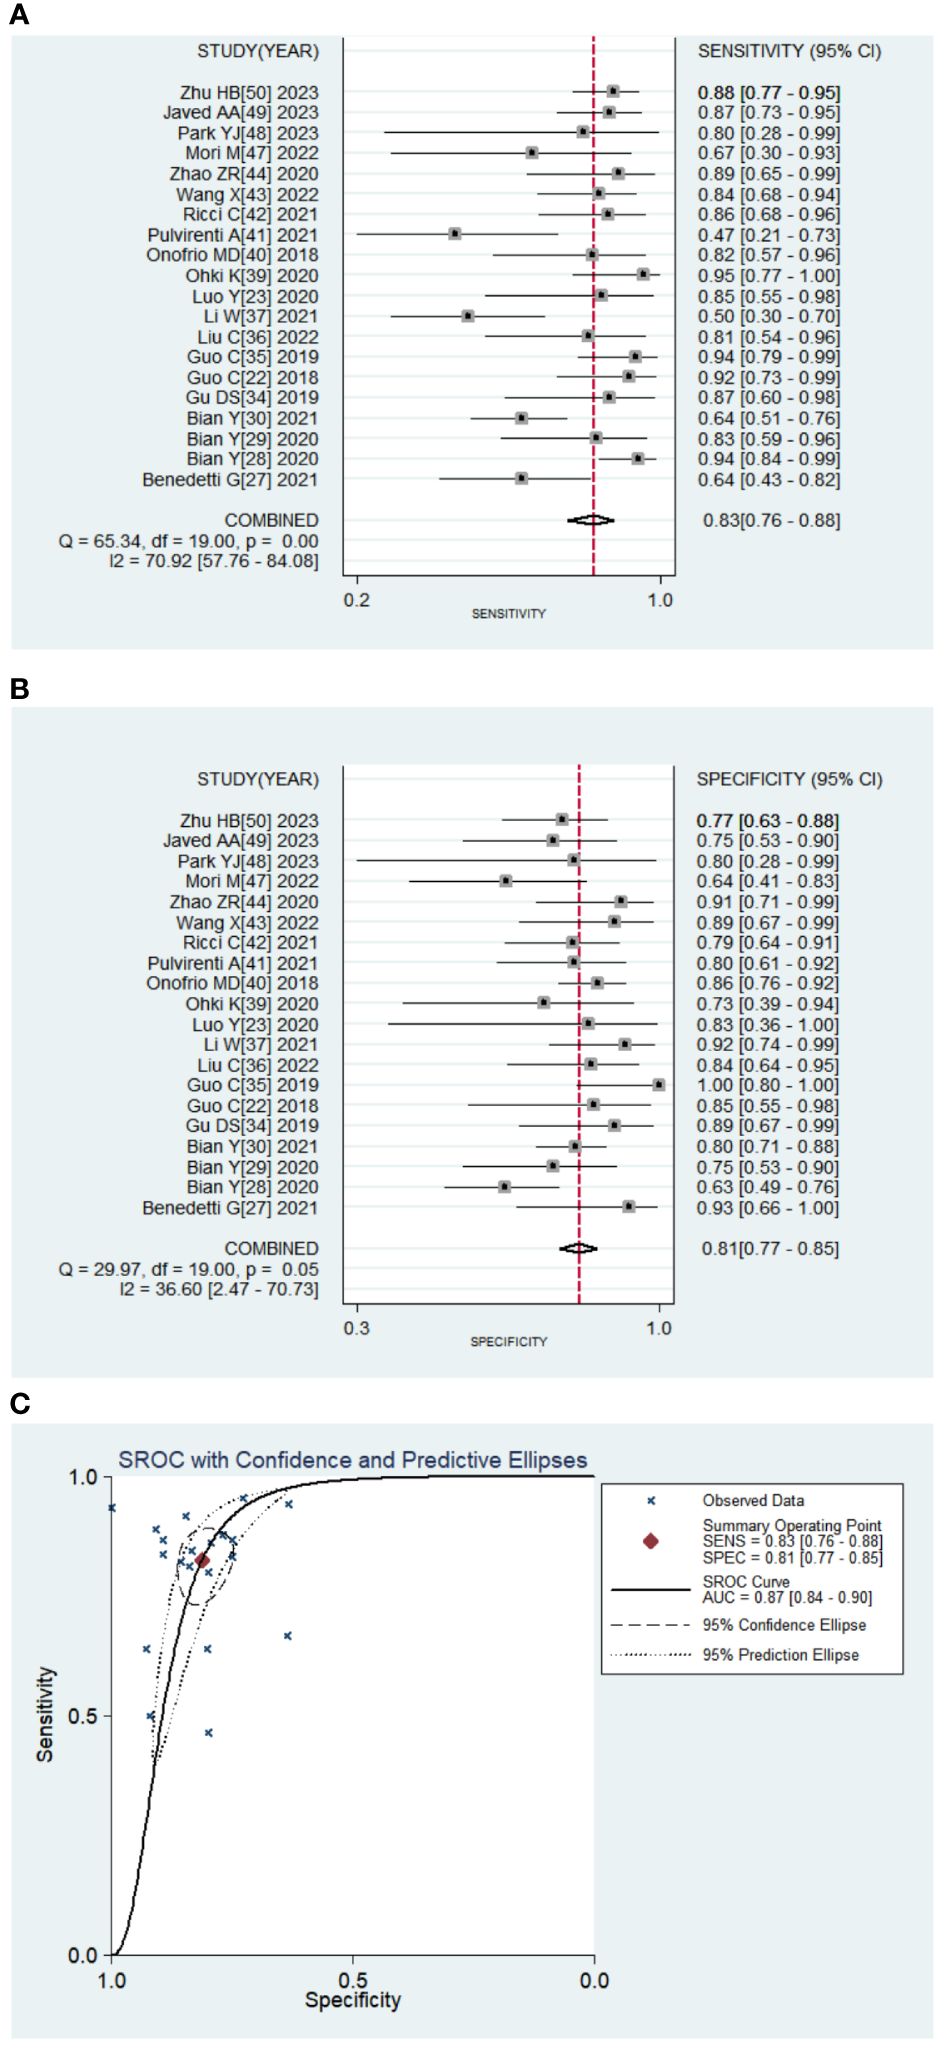
Figure 4 Pooled diagnostic accuracy of PNETs. (A, B) Forest plots of sensitivity, specificity; (C). Summary receiver operator characteristic curve.
Subgroup analysis based on the image source and AI methodology
Meta-regression was conducted and found there was no significant differences between groups (Supplementary Table S2). Then subgroup analysis was performed to compare studies evaluating the performance of different image sources: CT and MRI. Two models used both CT and MRI images; thus, 16 models extracted radiomic features from CT images and six models from MRI. The pooled SE, SP, PLR, and NLR were 0.849 [0.786, 0.895], 0.803 [0.748, 0.847], 4.297 [3.386, 5.451], and 0.189 [0.134, 0.266], respectively for CT models, and 0.791 [0.643, 0.888], 0.820 [0.764, 0.866], 4.407 [3.206, 6.058], 0.255 [0.141, 0.459], respectively for MRI models. The pooled DOR was 22.769 [14.707, 35.250] and 17.304 [7.713, 38.822] for CT and MRI models, respectively. The AUC of the SROC curve was 0.88 [0.85-0.91] with heterogeneity (I2 = 79.25% [55.20-100.00], P=0.004) on CT images compared with MRI (AUC=0.83 [0.79-0.86], I2 = 71.55%[36.80-100.00], P=0.015).
Subgroup analysis of different AI methodologies was used to compare algorithm architecture; most models not only applied ML classifiers, but more than one classifier. In total, 15 models were conducted using ML for PNETs. The pooled SE, SP, PLR, and NLR were 0.806 [0.727, 0.867, 0.789 [0.742, 0.829], 3.813 [3.156, 4.606], and 0.246 [0.175, 0.346], respectively. The pooled DOR was 15.508 [10.196, 23.589] and the AUC of the SROC curve was 0.84[0.81-0.87] with heterogenicity, I2 = 89.88%[79.90-99.86]. Of the remaining three models for non-ML, the pooled AUC value was 0.89 [0.86-0.92] with I2 = 28.80[0.00-100.00] (Table 3).
There were ten models using cross-validation to select the best features and models. The group with cross-validation had a pooled AUC of 0.87 [0.83-0.91] with I2 = 78.98%, while the group without was 0.88 [0.84-0.90] with I2 = 75.30%. The pooled SE, SP, PLR, and NLR were 0.831 [0.784, 0.871], 0.785 [0.737, 0.828], 3.523 [2.812, 4.414] and 0.196 [0.127, 0.302], respectively for the cross-validation group, and 0.799 [0.670, 0.866], 0.835 [0.772, 0.884], 4.849 [3.365, 6.698], and 0.241 [0.141, 0.413], respectively for the group without ICC. The pooled DOR were 20.262 [12.084, 33.973] and 20.120 [9.171, 44.140] for the groups with and without ICC, respectively.
Subgroup analysis based on dataset characteristics
We also compared the models that included clinical data and by utilizing radiomics features only, and found that clinical features reduced heterogenicity. The pooled SE, SP, PLR, and NLR were 0.801 [0.707, 0.870], 0.795 [0.739, 0.842], 3.906 [2.983, 5.115], and 0.251 [0.166, 0.379], respectively for the group including clinical data, and 0.847 [0.747, 0.913], 0.829 [0.749, 0.888], 4.970 [3.349, 7.377], and 0.184 [0.109, 0.310], respectively for the radiomics-only group. The pooled DOR for the radiomics group was 27.034 [13.412, 54.492], and the AUC of the SROC curve was 0.81 [0.77-0.84] with I2 = 41.54%, which was a little higher than that of the included clinical data group (DOR: 16.581 [9.466, 29.044]); AUC: 0.90 [0.87-0.92]) (Table 3).
Moreover, 11 models were validated, while nine models were not. The pooled SE, SP, PLR, and NLR were 0.823 [0.754, 0.876], 0.799 [0.744, 0.846], 4.106 [3.128, 5.389], and 0.221 [0.155, 0.315], respectively for the validated group, and 0.836 [0.708, 0.914], 0.824 [0.741, 0.884], 4.741 [3.248, 6.920], and 0.199 [0.110,0.361], respectively for the control group. The pooled DOR for the validated group was 15.574 [8.579, 28.273] and 23.766 [11.504, 49.095] for the control group. The AUC of the SROC curve was 0.84 [0.81-0.87] without heterogeneity for the validation group and 0.89 [0.86-0.91] with I2 = 91.65% for the control group.
In a subgroup analysis based on the number of patients, the pooled results of 12 models, which included >100 patients, were 0.815 [0.737, 0.874], 0.784 [0.735, 0.826], 3.769 [3.086, 4.603], and 0.236 [0.165, 0.337] for the pooled SE, SP, PLR, and NLR, respectively. For the remaining eight models, the pooled SE, SP, PLR, and NLR were 0.847 [0.715, 0.925], 0.871 [0.799, 0.920], 6.560 [4.224, 10.187], and 0.175 [0.091, 0.338], respectively. The pooled DOR and the AUC values for the two groups were 15.974 [10.228, 24.948] and 0.84 [0.81-0.87] vs. 37.404 [16.542, 84.577] and 0.91 [0.88-0.93] (Table 3).
Discussion
PNETs are a heterogeneous group of malignancies: they can be grouped into grades G1, G2, and G3 according to mitotic count and Ki-67 index (1–3). Accurate classification of PNETs grades is important for treatment selection, prognosis, and follow-up. However, due to the heterogeneity of PNETs, tumor grading may not be uniform within a single lesion or between different lesions in the same patient (7, 8). Moreover, histology is currently the only validated tool to grade tumors and describe their characteristics; surgery and endoscopic biopsy are used clinically to analyze the histological grade of PNETs. However, it is difficult to perform a satisfactory biopsy for PNETs located around major vessels, or small tumors—especially using fine-needle aspiration biopsy (50–53). Therefore, the detection of histological grades based on radiological images is also an important diagnostic tool. With increasing AI application in medical fields, we believe that AI-based models can enhance the prediction value of tumor grading. To the best of our knowledge, we are only aware of few and insufficiently updated systematic review on this topic that has evaluated the diagnostic accuracy of radiomics.
In our study, we investigated the ability of imaging-based AI to detect PNETs histologic grading. Our results showed that AI-based grading of PNETs with an AUC of 0.89 [0.84 - 0.90] exhibited good performance but high heterogeneity (I2 = 90.42% [81.10-99.73], P = 0.000). Among the included studies, we found considerable heterogeneity in pooled sensitivity and specificity. Moreover, according to our sensitive analysis, 3 articles (29, 40, 46) had poor robustness and may be one of the sources of heterogeneity (Figure S2). There was no significant publication bias between studies.
The diagnostic performance of the radiomics model varied with the strategies employed. CT and MRI images are the main sources for analyzing PNETs. Because of its high availability and low cost, CT is widely used than MRI. In this study, we found that imaging techniques may be influencing factors of prediction power, but not independently so. CT was more commonly used (16 studies) and showed better performance than MRI (6 studies) in grading PNETs, with an AUC of 0.88 [0.85-0.91] vs. 0.83 [0.79-0.86]. Although unconfirmed, we speculate that CT may be more powerful for obtaining vessel enhancement characteristics and observing the neo-vascular distribution, which is useful in vascularly-rich PNETs (54). Future studies are needed to validate this finding. We had only one study applied PET-CT grading PNETs and found AUROC of 0.864 in the tumor grade prediction model which showed good forecasting ability (47). Thus, more investigation into PET-CT will be useful in developing AI models, which showing good predictive performance (AUC = 0.992) and can detect cell surface expression of somatostatin receptors (55, 56).
Clinical data such as age, gender, tumor size, tumor shape, tumor margin and CT stage are closely related to the pathogenic process of PNETs and therefore should not be ignored in diagnostic models (27–29, 47, 49).,Liang et al. (37) built a combined model which can improve the performance (0.856, [0.730–0.939] vs. 0.885 [0.765–0.957]). Wang et al. (42) found that the addition of clinical features can improve the radiomics models (from 0.837 [0.827–0.847] to 0.879 [0.869–0.889]). However, we found that including clinical factors did not always result in better performance but did decrease the heterogenicity (AUC of 0.81 [0.77-0.84] with I2 = 41.94% vs. 0.90 [0.87-0.92] with I2 = 89.91%). This may due to the data are processed differently, such as age or other clinical numerical data can be easily quantified by radiomic modeling (i.e., age as a variable in an algorithm or function). And in clinical models, age regarded as risk factors always varied in different situations. Therefore, future radiomics analyses should incorporate clinical features to create more reliable models or add radiomics features to existing diagnostic models to validate their true diagnostic power.
The lack of standardized quality control and reporting throughout the workflow limits the application of radiomics (17, 57). For example, validation/testing data must remain completely independent or hidden until validation/testing is performed in order to create generalizable predictive models at each step of a radiomics study. In our study, 11 studies of 20 had validation set and only 3 had external validation. Lack of proper external validation would influence the transportability and generalizability of the models in the studies and also hamper the conclusions of the review. Moreover, according to our findings, lacking validation sets was also one of the main causes of heterogeneity. There should be no direct comparison between the results obtained by studying only the primary cohort and those obtained by studying both the primary and validation cohorts. Validated models should be considered more reliable and promising, even if the reported performance is lower.
As shown in Table 1, there were also a wide variety of feature extraction and model selection methods, and although AI classifiers did not show outstanding diagnostic performance in our evaluation, it is undeniably a future research direction and trend. Most of the included studies used more than one machine learning or deep learning for feature selection or classification, but the best performing AI classifiers varied from study to study. To date, there are no universal and well-recognized classifiers, and the characteristics of the samples are a key factor affecting the performance of classifiers (58, 59). Finding uniform and robust classifiers for specific medical problems has always been a challenge.
Despite the encouraging results of this meta-analysis, the overall methodological quality of the included literature was poor, reducing the reliability and reproducibility of radiomics models for clinical applications. Lack of prospective studies with scanner modeling studies, lack of imaging studies at multiple time points, insufficient validation and calibration validity of the models, short time frame for cost-effectiveness analyses, insufficient cost-effectiveness analyses, and lack of publicly available science and data contributed to the low RQS scores. In addition, only half of the studies were internally validated and less independent external validation. To further standardize the process and improve the quality of radiomics, the RQS should be used not only to assess the methodological quality of radiomics studies, but also to guide the design of radiomics studies (17).
Diversity of the samples, inconsistencies with radiomics feature extraction across platforms, different modeling algorithms, and simultaneous incorporation of clinical features may all account for the high heterogenicity of the combined models. According to our sub-analysis results, the heterogenicity mainly came from the different imaging materials (CT vs MRI), the algorithm architecture (ML vs non-ML), whether validated or not and clinical features included. Thus, standardized imaging, a standardized independent and robust set of features, as well as validation even external validation are all approaches to lower the heterogenicity and highlights for attention in future research. To sum, the AI method was effective in the preoperative prediction of PNETs grade; this may help with the understanding of tumor behavior, and facilitate vision-making in clinical practice.
Our study has several limitations. First, most included studies were single-center and retrospective, inevitably causing patient selection bias. Second, different methods were investigated, including the type of imaging scans utilized, the type and number of radiological features studied, the choice of software, and the type of analysis/methods implemented, thus leading to the high heterogeneity among studies. Therefore, some pooled estimates of the quantitative results must be interpreted with caution. Further prospective studies could validate these results; a stable method of data extraction and analysis is important for developing a reproducible AI model.
Conclusions
Overall, this meta-analysis demonstrated the value of AI models in predicting PNETs grading. According to our result, diversity of the samples, lack of external validation, imaging modalities, inconsistencies with radiomics feature extraction across platforms, different modeling algorithms and the choice of software all are sources of heterogeneity. Thus, standardized imaging, as well as a standardized, independent and robust set of features will be important for future application. Multi-center, large-sample, randomized clinical trials could be used to confirm the predictive power of image-based AI systems in clinical practice. To sum, AI can be considered as a potential tool to detect histological PNETs grades.
Data availability statement
The original contributions presented in the study are included in the article/Supplementary Material. Further inquiries can be directed to the corresponding authors.
Author contributions
QY: Conceptualization, Methodology, Visualization, Writing – original draft. YC: Data curation, Methodology, Software, Writing – original draft. CL: Data curation, Investigation, Software, Writing – original draft. HS: Data curation, Investigation, Validation, Writing – original draft. MH: Formal analysis, Software, Writing – original draft. ZW: Investigation, Validation, Writing – original draft. SH: Data curation, Formal analysis, Funding acquisition, Writing – review & editing. CZ: Funding acquisition, Project administration, Supervision, Writing – review & editing. BH: Funding acquisition, Project administration, Supervision, Writing – review & editing.
Funding
The author(s) declare that financial support was received for the research, authorship, and/or publication of this article. This study was supported by the Natural Science Foundation of China (82102961, 82072635 and 82072637), High-level Hospital Construction Research Project of Heyuan People's Hospital (YNKT202202), the Science and Technology Program of Heyuan (23051017147335), the Science and Technology Program of Guangzhou (2024A04J10016 and 202201011642).
Conflict of interest
The authors declare that the research was conducted in the absence of any commercial or financial relationships that could be construed as a potential conflict of interest.
Publisher’s note
All claims expressed in this article are solely those of the authors and do not necessarily represent those of their affiliated organizations, or those of the publisher, the editors and the reviewers. Any product that may be evaluated in this article, or claim that may be made by its manufacturer, is not guaranteed or endorsed by the publisher.
Supplementary material
The Supplementary Material for this article can be found online at: https://www.frontiersin.org/articles/10.3389/fonc.2024.1332387/full#supplementary-material
Supplementary Figure 1 | The quality assessment of 26 included studies by QUADAS-2 tool.
Supplementary Figure 2 | The sensitive analysis of 26 included studies.
References
1. Chang A, Sherman SK, Howe JR, Sahai V. Progress in the management of pancreatic neuroendocrine tumors. Annu Rev Med. (2022) 73:213–29. doi: 10.1146/annurev-med-042320-011248
2. Ma ZY, Gong YF, Zhuang HK, Zhou ZX, Huang SZ, Zou YP, et al. Pancreatic neuroendocrine tumors: A review of serum biomarkers, staging, and management. World J Gastroenterol. (2020) 26:2305–22. doi: 10.3748/wjg.v26.i19.2305
3. Cives M, Strosberg JR. Gastroenteropancreatic neuroendocrine tumors. CA Cancer J Clin. (2018) 68:471–87. doi: 10.3322/caac.21493
4. Pulvirenti A, Marchegiani G, Pea A, Allegrini V, Esposito A, Casetti L, et al. Clinical implications of the 2016 international study group on pancreatic surgery definition and grading of postoperative pancreatic fistula on 775 consecutive pancreatic resections. Ann Surg. (2018) 268:1069–75. doi: 10.1097/SLA.0000000000002362
5. Fan JH, Zhang YQ, Shi SS, Chen YJ, Yuan XH, Jiang LM, et al. A nation-wide retrospective epidemiological study of gastroenteropancreatic neuroendocrine neoplasms in China. Oncotarget. (2017) 8:71699–708. doi: 10.18632/oncotarget.17599
6. Yao JC, Hassan M, Phan A, Dagohoy C, Leary C, Mares JE, et al. One hundred years after "carcinoid": epidemiology of and prognostic factors for neuroendocrine tumors in 35,825 cases in the United States. J Clin Oncol. (2008) 26:3063–72. doi: 10.1200/JCO.2007.15.4377
7. Yang Z, Tang LH, Klimstra DS. Effect of tumor heterogeneity on the assessment of Ki67 labeling index in well-differentiated neuroendocrine tumors metastatic to the liver: implications for prognostic stratification. Am J Surg Pathol. (2011) 35:853–60. doi: 10.1097/PAS.0b013e31821a0696
8. Partelli S, Gaujoux S, Boninsegna L, Cherif R, Crippa S, Couvelard A, et al. Pattern and clinical predictors of lymph node involvement in nonfunctioning pancreatic neuroendocrine tumors (NF-PanNETs). JAMA Surg. (2013) 148:932–9. doi: 10.1001/jamasurg.2013.3376
9. Marchegiani G, Landoni L, Andrianello S, Masini G, Cingarlini S, D'Onofrio M, et al. Patterns of recurrence after resection for pancreatic neuroendocrine tumors: who, when, and where? Neuroendocrinology. (2019) 108:161–71. doi: 10.1159/000495774
10. Nagtegaal ID, Odze RD, Klimstra D, Paradis V, Rugge M, Schirmacher P, et al. The 2019 WHO classification of tumours of the digestive system. Histopathology. (2020) 76:182–8. doi: 10.1111/his.13975
11. Hosny A, Parmar C, Quackenbush J, Schwartz LH, Aerts HJWL. Artificial intelligence in radiology. Nat Rev Cancer. (2018) 18:500–10. doi: 10.1038/s41568-018-0016-5
12. Jin P, Ji X, Kang W, Li Y, Liu H, Ma F, et al. Artificial intelligence in gastric cancer: a systematic review. J Cancer Res Clin Oncol. (2020) 146:2339–50. doi: 10.1007/s00432-020-03304-9
13. Yu KH, Beam AL, Kohane IS. Artificial intelligence in healthcare. Nat BioMed Eng. (2018) 2:719–31. doi: 10.1038/s41551-018-0305-z
14. Beam AL, Kohane IS. Big data and machine learning in health care. JAMA. (2018) 319:1317–8. doi: 10.1001/jama.2017.18391
15. Greener JG, Kandathil SM, Moffat L, Jones DT. A guide to machine learning for biologists. Nat Rev Mol Cell Biol. (2022) 23:40–55. doi: 10.1038/s41580-021-00407-0
16. Issa NT, Stathias V, Schürer S, Dakshanamurthy S. Machine and deep learning approaches for cancer drug repurposing. Semin Cancer Biol. (2021) 68:132–42. doi: 10.1016/j.semcancer.2019.12.011
17. Bezzi C, Mapelli P, Presotto L, Neri I, Scifo P, Savi A, et al. Radiomics in pancreatic neuroendocrine tumors: methodological issues and clinical significance. Eur J Nucl Med Mol Imaging. (2021) 48:4002–15. doi: 10.1007/s00259-021-05338-8
18. Rauschecker AM, Rudie JD, Xie L, Wang J, Duong MT, Botzolakis EJ, et al. Artificial intelligence system approaching neuroradiologist-level differential diagnosis accuracy at brain MRI. Radiology. (2020) 295:626–37. doi: 10.1148/radiol.2020190283
19. Caruso D, Polici M, Rinzivillo M, Zerunian M, Nacci I, Marasco M, et al. CT-based radiomics for prediction of therapeutic response to Everolimus in metastatic neuroendocrine tumors. Radiol Med. (2022) 127:691–701. doi: 10.1007/s11547-022-01506-4
20. Yang J, Xu L, Yang P, Wan Y, Luo C, Yen EA, et al. Generalized methodology for radiomic feature selection and modeling in predicting clinical outcomes. Phys Med Biol. (2021) 66:10.1088/1361-6560/ac2ea5. doi: 10.1088/1361-6560/ac2ea5
21. Guo C, Zhuge X, Wang Z, Wang Q, Sun K, Feng Z, et al. Textural analysis on contrast-enhanced CT in pancreatic neuroendocrine neoplasms: association with WHO grade. Abdom Radiol (NY). (2019) 44:576–85. doi: 10.1007/s00261-018-1763-1
22. Luo Y, Chen X, Chen J, Song C, Shen J, Xiao H, et al. Preoperative prediction of pancreatic neuroendocrine neoplasms grading based on enhanced computed tomography imaging: validation of deep learning with a convolutional neural network. Neuroendocrinology. (2020) 110:338–50. doi: 10.1159/000503291
23. Lambin P, Leijenaar RTH, Deist TM. Radiomics: the bridge between medical imaging and personalized medicine. Nat Rev Clin Oncol. (2017) 14:749–62. doi: 10.1038/nrclinonc.2017.141
24. Whiting PF, Rutjes AW, Westwood ME, Mallett S, Deeks JJ, Reitsma JB, et al. QUADAS-2: a revised tool for the quality assessment of diagnostic accuracy studies. Ann Intern Med. (2011) 155:529–36. doi: 10.7326/0003-4819-155-8-201110180-00009
25. Higgins JP, Thompson SG, Deeks JJ, Altman DG. Measuring inconsistency in meta- analyses. BMJ. (2003) 327:557–60. doi: 10.1136/bmj.327.7414.557
26. Benedetti G, Mori M, Panzeri MM, Barbera M, Palumbo D, Sini C, et al. CT-derived radiomic features to discriminate histologic characteristics of pancreatic neuroendocrine tumors. Radiol Med. (2021) 126:745–60. doi: 10.1007/s11547-021-01333-z
27. Bian Y, Jiang H, Ma C, Wang L, Zheng J, Jin G, et al. CT-based radiomics score for distinguishing between grade 1 and grade 2 nonfunctioning pancreatic neuroendocrine tumors. AJR Am J Roentgenol. (2020) 215:852–63. doi: 10.2214/AJR.19.22123
28. Bian Y, Zhao Z, Jiang H, Fang X, Li J, Cao K, et al. Noncontrast radiomics approach for predicting grades of nonfunctional pancreatic neuroendocrine tumors. J Magn Reson Imaging. (2020) 52:1124–36. doi: 10.1002/jmri.27176
29. Bian Y, Li J, Cao K, Fang X, Jiang H, Ma C, et al. Magnetic resonance imaging radiomic analysis can preoperatively predict G1 and G2/3 grades in patients with NF-pNETs. Abdom Radiol (NY). (2021) 46:667–80. doi: 10.1007/s00261-020-02706-0
30. Canellas R, Burk KS, Parakh A, Sahani DV. Prediction of pancreatic neuroendocrine tumor grade based on CT features and texture analysis. AJR Am J Roentgenol. (2018) 210:341–6. doi: 10.2214/AJR.17.18417
31. Choi TW, Kim JH, Yu MH, Park SJ, Han JK. Pancreatic neuroendocrine tumor: prediction of the tumor grade using CT findings and computerized texture analysis. Acta Radiol. (2018) 59:383–92. doi: 10.1177/0284185117725367
32. Gao X, Wang X. Deep learning for World Health Organization grades of pancreatic neuroendocrine tumors on contrast-enhanced magnetic resonance images: a preliminary study. Int J Comput Assist Radiol Surg. (2019) 14:1981–91. doi: 10.1007/s11548-019-02070-5
33. Gu D, Hu Y, Ding H, Wei J, Chen K, Liu H, et al. CT radiomics may predict the grade of pancreatic neuroendocrine tumors: a multicenter study. Eur Radiol. (2019) 29:6880–90. doi: 10.1007/s00330-019-06176-x
34. Guo CG, Ren S, Chen X, Wang QD, Xiao WB, Zhang JF, et al. Pancreatic neuroendocrine tumor: prediction of the tumor grade using magnetic resonance imaging findings and texture analysis with 3-T magnetic resonance. Cancer Manag Res. (2019) 11:1933–44. doi: 10.2147/CMAR
35. Liu C, Bian Y, Meng Y, Liu F, Cao K, Zhang H, et al. Preoperative prediction of G1 and G2/3 grades in patients with nonfunctional pancreatic neuroendocrine tumors using multimodality imaging. Acad Radiol. (2022) 29:e49–60. doi: 10.1016/j.acra.2021.05.017
36. Li W, Xu C, Ye Z. Prediction of pancreatic neuroendocrine tumor grading risk based on quantitative radiomic analysis of MR. Front Oncol. (2021) 11:758062. doi: 10.3389/fonc.2021.758062
37. Liang W, Yang P, Huang R, Xu L, Wang J, Liu W, et al. A combined nomogram model to preoperatively predict histologic grade in pancreatic neuroendocrine tumors. Clin Cancer Res. (2019) 25:584–94. doi: 10.1158/1078-0432.CCR-18-1305
38. Ohki K, Igarashi T, Ashida H, Takenaga S, Shiraishi M, Nozawa Y, et al. Usefulness of texture analysis for grading pancreatic neuroendocrine tumors on contrast-enhanced computed tomography and apparent diffusion coefficient maps. Jpn J Radiol. (2021) 39:66–75. doi: 10.1007/s11604-020-01038-9
39. D'Onofrio M, Ciaravino V, Cardobi N, De Robertis R, Cingarlini S, Landoni L, et al. CT enhancement and 3D texture analysis of pancreatic neuroendocrine neoplasms. Sci Rep. (2019) 9:2176. doi: 10.1038/s41598-018-38459-6
40. Pulvirenti A, Yamashita R, Chakraborty J, Horvat N, Seier K, McIntyre CA, et al. Quantitative computed tomography image analysis to predict pancreatic neuroendocrine tumor grade. JCO Clin Cancer Inform. (2021) 5:679–94. doi: 10.1200/CCI.20.00121
41. Ricci C, Mosconi C, Ingaldi C, Vara G, Verna M, Pettinari I, et al. The 3-dimensional-computed tomography texture is useful to predict pancreatic neuroendocrine tumor grading. Pancreas. (2021) 50:1392–9. doi: 10.1097/MPA.0000000000001927
42. Wang X, Qiu JJ, Tan CL, Chen YH, Tan QQ, Ren SJ, et al. Development and validation of a novel radiomics-based nomogram with machine learning to preoperatively predict histologic grade in pancreatic neuroendocrine tumors. Front Oncol. (2022) 12:843376. doi: 10.3389/fonc.2022.843376
43. Zhao Z, Bian Y, Jiang H, Fang X, Li J, Cao K, et al. CT-radiomic approach to predict G1/2 nonfunctional pancreatic neuroendocrine tumor. Acad Radiol. (2020) 27:e272–81. doi: 10.1016/j.acra.2020.01.002
44. Zhou RQ, Ji HC, Liu Q, Zhu CY, Liu R. Leveraging machine learning techniques for predicting pancreatic neuroendocrine tumor grades using biochemical and tumor markers. World J Clin Cases. (2019) 7:1611–22. doi: 10.12998/wjcc.v7.i13.1611
45. Chiti G, Grazzini G, Flammia F, Matteuzzi B, Tortoli P, Bettarini S, et al. Gastroenteropancreatic neuroendocrine neoplasms (GEP-NENs): a radiomic model to predict tumor grade. Radiol Med. (2022) 127:928–38. doi: 10.1007/s11547-022-01529-x
46. Mori M, Palumbo D, Muffatti F, Partelli S, Mushtaq J, Andreasi V, et al. Prediction of the characteristics of aggressiveness of pancreatic neuroendocrine neoplasms (PanNENs) based on CT radiomic features. Eur Radiol. (2023) 33:4412–21. doi: 10.1007/s00330-022-09351-9
47. Park YJ, Park YS, Kim ST, Hyun SH. A machine learning approach using [18F]FDG PET-based radiomics for prediction of tumor grade and prognosis in pancreatic neuroendocrine tumor. Mol Imaging Biol. (2023) 25:897–910. doi: 10.1007/s11307-023-01832-7
48. Javed AA, Zhu Z, Kinny-Köster B, Habib JR, Kawamoto S, Hruban RH, et al. Accurate non-invasive grading of nonfunctional pancreatic neuroendocrine tumors with a CT derived radiomics signature. Diagn Interv Imaging. (2024) 105:33–39. doi: 10.1016/j.diii.2023.08.002
49. Zhu HB, Zhu HT, Jiang L, Nie P, Hu J, Tang W, et al. Radiomics analysis from magnetic resonance imaging in predicting the grade of nonfunctioning pancreatic neuroendocrine tumors: a multicenter study. Eur Radiol. (2023) 34:90–102. doi: 10.1007/s00330-023-09957-7
50. Sadula A, Li G, Xiu D, Ye C, Ren S, Guo X, et al. Clinicopathological characteristics of nonfunctional pancreatic neuroendocrine neoplasms and the effect of surgical treatment on the prognosis of patients with liver metastases: A study based on the SEER database. Comput Math Methods Med. (2022) 2022:3689895. doi: 10.1155/2022/3689895
51. Wallace MB, Kennedy T, Durkalski V, Eloubeidi MA, Etamad R, Matsuda K, et al. Randomized controlled trial of EUS-guided fine needle aspiration techniques for the detection of Malignant lymphadenopathy. Gastrointest Endosc. (2001) 54:441–7. doi: 10.1067/mge.2001.117764
52. Canakis A, Lee LS. Current updates and future directions in diagnosis and management of gastroenteropancreatic neuroendocrine neoplasms. World J Gastrointest Endosc. (2022) 14:267–90. doi: 10.4253/wjge.v14.i5.267
53. Sallinen VJ, Le Large TYS, Tieftrunk E, Galeev S, Kovalenko Z, Haugvik SP, et al. Prognosis of sporadic resected small (≤2 cm) nonfunctional pancreatic neuroendocrine tumors—a multiinstitutional study. HPB. (2018) 20:251–9. doi: 10.1016/j.hpb.2017.08.034
54. Liu Y, Shi S, Hua J, Xu J, Zhang B, Liu J, et al. Differentiation of solid-pseudopapillary tumors of the pancreas from pancreatic neuroendocrine tumors by using endoscopic ultrasound. Clin Res Hepatol Gastroenterol. (2020) 44:947–53. doi: 10.1016/j.clinre.2020.02.002
55. Mapelli P, Bezzi C, Palumbo D, Canevari C, Ghezzo S, Samanes Gajate AM, et al. 68Ga-DOTATOC PET/MR imaging and radiomic parameters in predicting histopathological prognostic factors in patients with pancreatic neuroendocrine well-differentiated tumours. Eur J Nucl Med Mol Imaging. (2022) 49:2352–63. doi: 10.1007/s00259-022-05677-0
56. Atkinson C, Ganeshan B, Endozo R, Wan S, Aldridge MD, Groves AM, et al. Radiomics-based texture analysis of 68Ga-DOTATATE positron emission tomography and computed tomography images as a prognostic biomarker in adults with neuroendocrine cancers treated with 177Lu-DOTATATE. Front Oncol. (2021) 11:686235. doi: 10.3389/fonc.2021.686235
57. Jha AK, Mithun S, Sherkhane UB, Dwivedi P, Puts S, Osong B, et al. Emerging role of quantitative imaging (radiomics) and artificial intelligence in precision oncology. Explor Target Antitumor Ther. (2023) 4:569–82. doi: 10.37349/etat
58. Parmar C, Grossmann P, Bussink J, Lambin P, Aerts HJWL. Machine learning methods for quantitative radiomic biomarkers. Sci Rep. (2015) 5:13087. doi: 10.3389/fonc.2015.00272
Keywords: pancreatic neuroendocrine tumors, meta-analysis, radiomics, machine learning, deep learning
Citation: Yan Q, Chen Y, Liu C, Shi H, Han M, Wu Z, Huang S, Zhang C and Hou B (2024) Predicting histologic grades for pancreatic neuroendocrine tumors by radiologic image-based artificial intelligence: a systematic review and meta-analysis. Front. Oncol. 14:1332387. doi: 10.3389/fonc.2024.1332387
Received: 02 November 2023; Accepted: 02 April 2024;
Published: 23 April 2024.
Edited by:
Stefano Francesco Crinò, University of Verona, ItalyReviewed by:
Chunyin Zhang, Southwest Medical University, ChinaSamuele Ghezzo, Vita-Salute San Raffaele University, Italy
Maria Picchio, Vita-Salute San Raffaele University, Italy
Copyright © 2024 Yan, Chen, Liu, Shi, Han, Wu, Huang, Zhang and Hou. This is an open-access article distributed under the terms of the Creative Commons Attribution License (CC BY). The use, distribution or reproduction in other forums is permitted, provided the original author(s) and the copyright owner(s) are credited and that the original publication in this journal is cited, in accordance with accepted academic practice. No use, distribution or reproduction is permitted which does not comply with these terms.
*Correspondence: Shanzhou Huang, aHNoYW56aEAxNjMuY29t; Chuanzhao Zhang, emhhbmdjaHVhbnpoYW9AZ2RwaC5vcmcuY24=; Baohua Hou, aGJoMTAwMEAxMjYuY29t
†These authors have contributed equally to this work
 Qian Yan
 Yubin Chen
 Chunsheng Liu1†
 Zelong Wu
 Shanzhou Huang
 Chuanzhao Zhang
 Baohua Hou