 Muhammad Awais
 Md. Nazmul Abdal
 Tallha Akram
 Areej Alasiry4
 Mehrez Marzougui
 Anum Masood
- 1Department of Electrical and Computer Engineering, COMSATS University Islamabad, Wah, Pakistan
- 2Department of Computer Engineering, TED University, Ankara, Türkiye
- 3Department of Computer Science and Engineering, University of Liberal Arts Bangladesh, Dhaka, Bangladesh
- 4College of Computer Science, King Khalid University, Abha, Saudi Arabia
- 5Department of Physics, Norwegian University of Science and Technology, Trondheim, Norway
In the field of medicine, decision support systems play a crucial role by harnessing cutting-edge technology and data analysis to assist doctors in disease diagnosis and treatment. Leukemia is a malignancy that emerges from the uncontrolled growth of immature white blood cells within the human body. An accurate and prompt diagnosis of leukemia is desired due to its swift progression to distant parts of the body. Acute lymphoblastic leukemia (ALL) is an aggressive type of leukemia that affects both children and adults. Computer vision-based identification of leukemia is challenging due to structural irregularities and morphological similarities of blood entities. Deep neural networks have shown promise in extracting valuable information from image datasets, but they have high computational costs due to their extensive feature sets. This work presents an efficient pipeline for binary and subtype classification of acute lymphoblastic leukemia. The proposed method first unveils a novel neighborhood pixel transformation method using differential evolution to improve the clarity and discriminability of blood cell images for better analysis. Next, a hybrid feature extraction approach is presented leveraging transfer learning from selected deep neural network models, InceptionV3 and DenseNet201, to extract comprehensive feature sets. To optimize feature selection, a customized binary Grey Wolf Algorithm is utilized, achieving an impressive 80% reduction in feature size while preserving key discriminative information. These optimized features subsequently empower multiple classifiers, potentially capturing diverse perspectives and amplifying classification accuracy. The proposed pipeline is validated on publicly available standard datasets of ALL images. For binary classification, the best average accuracy of 98.1% is achieved with 98.1% sensitivity and 98% precision. For ALL subtype classifications, the best accuracy of 98.14% was attained with 78.5% sensitivity and 98% precision. The proposed feature selection method shows a better convergence behavior as compared to classical population-based meta-heuristics. The suggested solution also demonstrates comparable or better performance in comparison to several existing techniques.
1 Introduction
Blood is a vital fluid for the human body. It performs a number of crucial physiological functions, including the distribution of oxygen and nutrients from organs to cells, delivery of waste products from cells to organs for elimination, the maintenance of the human immune system, clotting and wound healing process, and the regulation of body temperature and fluid balance. The body’s main source of blood production is the bone marrow, a spongy tissue-like structure located within the bone cavities. A complex process known as hematopoiesis involves the maturation of stem cells into other blood cell types.
Figure 1 demonstrates the categorization of stem cells during hematopoiesis of a normal human being. The hematopoietic stem cells develop into either of two types of cells, i.e., a) lymphoid stem cells and b) myeloid stem cells. The lymphoid stem cells are then converted into the lymphoid blast, which then matures into B and T subtypes of lymphocytes. In contrast, the myeloid type of stem cells matures to synthesize erythrocytes, platelets, and various types of granulocytes (i.e., basophils, eosinophils, neutrophils, and monocytes).
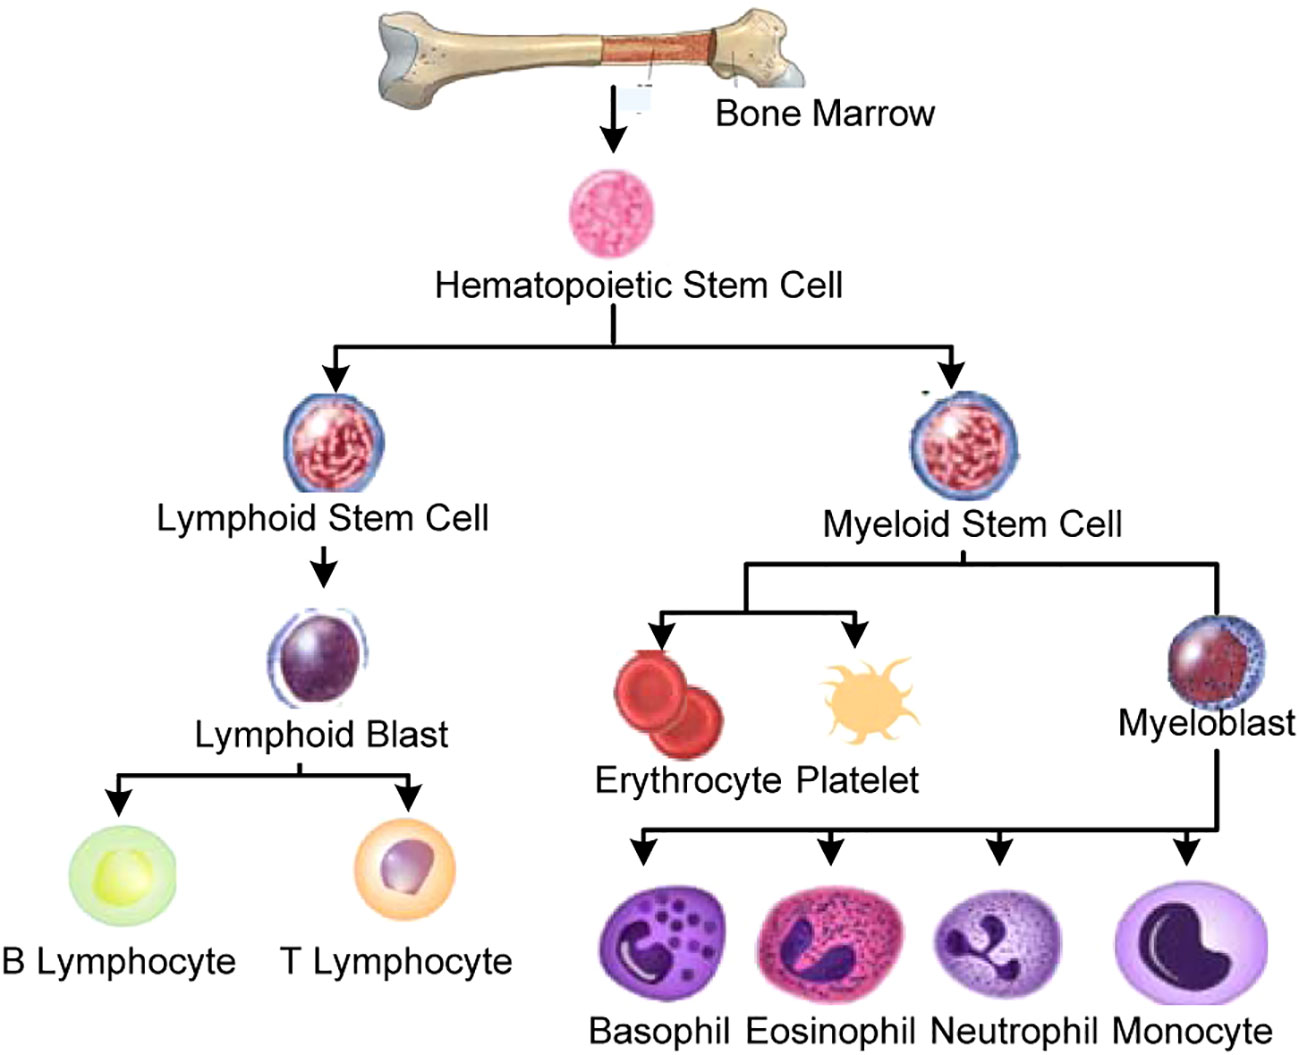
Figure 1 Human hematopoiesis.
The body produces the blood cells in a controlled manner as per its requirements. Each cell type has a specific function in preserving a person’s general state of health. An abnormality in the production and structure of blood cells leads to certain medical conditions. For example, white blood cells (WBCs), also referred to as leukocytes, constitute an integral part of the general immune and inflammatory response system (1, 2). Leukemia is a blood malignancy that is caused by the unregulated production of immature leukocytes in the bone marrow. Figure 2 shows a broad classification of leukemia, which is primarily of two types, i.e., acute and chronic, depending upon its progress rate. Chronic leukemia is slow-growing and takes months or years to manifest its symptoms, whereas acute leukemia develops rather swiftly. Each type of leukemia is further categorized on the basis of affected leukocytes. In the chronic leukemia category, chronic myeloid leukemia (CML) affects the myeloid type of cells, whereas chronic lymphocytic leukemia affects the lymphoid cells. Similarly, the acute leukemia category is further classified as acute lymphoblastic leukemia (ALL) and acute myeloid leukemia (AML) categories. ALL is further categorized into T-cell or B-cell subtypes. B-cell ALL is the most prevalent type of leukemia, impacting the B-cell lymphocytes; it is further divided into pre-curser, pro, mature, and common B-cell ALL subtypes.
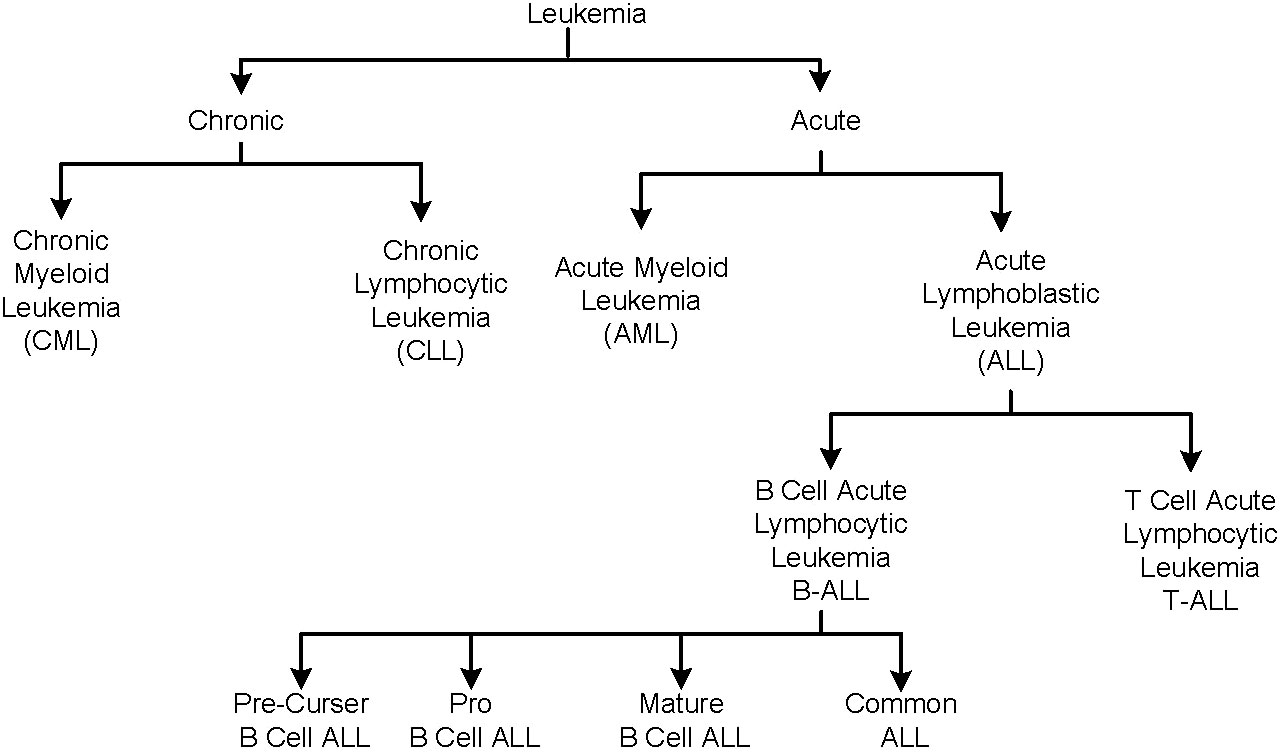
Figure 2 Classification of leukemia disease.
The existing medical approach for leukemia diagnosis involves a series of tests, ranging from simple blood count tests to more invasive tests such as needle biopsy or bone marrow aspiration. A blood test that shows a high value of white blood cell count suggests leukemia diagnosis. An important diagnostic tool in the evaluation of leukemia is the peripheral blood smear test. It involves the smearing of blood on the slide and its visual inspection under the microscope. A blood smear of a leukemia patient shows a significant number of purple-stained lymphoblasts in the bloodstream, with poorly defined boundaries. Traditionally, hematologists perform this ocular inspection of blood smears. This manual method not only consumes much time and effort of medical experts but can also be error-prone due to several external factors. Blood analysis is usually the first step of leukemia diagnosis and is carried out in conjunction with more detailed analysis methods such as RNA sequencing and molecular genetics. Computer-aided automation of blood analysis can be a significant step in reducing the time and cost of leukemia diagnosis.
Thanks to the landmark advancement in the domain of digital electronics and imaging technologies, automated blood analysis has been made possible. In particular, computer vision-based blood disease diagnosis has seen an increased research focus in recent years. However, due to morphological similarities across various blood entities as well as their structural anomalies, accurate machine learning-based blood analysis, particularly leukemia subtype detection, is still a challenge. A breakthrough in modern computer vision approaches, i.e., deep convolutional neural networks (CNNs), has shown a promising solution for a variety of classification scenarios (3, 4). They are capable of extracting a diverse range of features from the images. However, a large and well-labeled dataset is typically required to achieve a certain acceptable accuracy level. In the biomedical domain, a detailed dataset for CNN training from scratch is not readily available. Transfer learning is an often adopted approach in which deep CNN, pre-trained on another dataset, is retrained for a specific task (5, 6). Some well-known pre-trained CNNs include ResNet (7), MobileNet (8), DarkNet (9), Inception (10), and Xception (11). Modern methods also propose ensembles of feature vectors extracted from multiple CNNs (12). Apart from the wide use of deep CNNs in the computer vision domain, one limiting factor is the very high size of their extracted feature vectors. The present focus of research is to investigate approaches to improve the accuracy of classification systems while reducing their computational complexity and memory requirements.
2 Literature review
Existing research on leukemia detection can be broadly categorized into two types of approaches. In the first category, the studies are included, which perform white blood cell classification as an important preliminary step. The second category of work is focused on considering the stained images containing leukemia blasts and proposing an efficient method for leukemia subtype classification. Some considerable studies from the first category are summarized as follows. Sanei and Lee proposed a method that computes eigenvectors of blood cell images using the minimization of similarity approach (13). Using the density and color information of eigencells, a Bayesian classifier was used to perform cell classification. Kumar et al. (14) used various image pre-processing techniques with a random forest classifier for blood cancer detection. Su et al. (15) suggested a segmentation method based on detecting a discriminating zone of WBCs on the hue, saturation, and intensity (HSI) space. WBC classification was performed using geometrical, color, and local directional pattern (LDP) features. Sharma et al. (16) used DenseNet121 CNN for WBC classification. Almezhghwi and Serte (17) proposed an image augmentation approach using generative adversarial networks, and classification was performed using DenseNet. Yildirim and Çinar (18) proposed Gaussian and median filtering approaches for image pre-processing. Then, multiple CNN architectures were trained for WBC classification.
Table 1 summarizes some recently published leukemia classification methods using blood smear images containing cell blasts. Bhattacharjee and Saini (19) applied different morphological operations to perform image segmentation. This was followed by classification using multiple baseline classifiers to diagnose the presence of ALL. The proposed solution achieved the best accuracy of 95.23% with the artificial neural network (ANN) classifier. Goutam and Sailaja (20) applied K-means clustering for segmentation, followed by the local directional path technique in order to extract features, and, finally, classification using support vector machines (SVMs). The F-measure achieved by this approach was 93.44. Patel and Mishra (21) applied histogram equalization along with the zack algorithm group wbcS in the smear images. Next, various morphological features including area, color, mean, and standard deviation were extracted and classified using SVM. The overall accuracy achieved by the system was 93.57%. Rawat et al. (22) proposed a method in which leukocytes and lymphocytes were sequentially separated from other blood cells. The shape and grey-level occurrence matrices were classified using a binary SVM classifier. Mishra et al. (23) performed nucleus feature extraction from RGB images using discrete cosine transform (DCT), followed by SVM classification. Di Ruberto et al. (24) utilized a multiscale blob detection scheme followed by the watershed algorithm for segmentation and, finally, classification using CNN and SVM classifiers. The proposed solution achieves a binary classification accuracy of 94.18%. Anwar and Alam (26) proposed a three-phase filtering algorithm to perform image segmentation. Next, 16 robust features were extracted, and classification was performed using ANN and SVM classifiers, yielding a specificity of 95.41%. Bodzas et al. (25) utilized different data augmentation techniques and performed training on their custom-proposed CNN architecture to obtain an overall accuracy of 99.5% for the binary classification of leukemic cells. Batool and Byun (27) proposed a lightweight deep learning-based EfficientNet-B3 model, which employs depth-wise separable convolutions for ALL classification. The proposed method achieves an accuracy of 96.81% for leukemia subtype classification using public datasets. Elhassan et al. (28) proposed an approach of AML detection from WBC images. First, a CMYK moment-based region of interest (ROI) localization method was used, followed by deep learning-based feature extraction and classification using several baseline classifiers. The proposed system achieves the best accuracy of 97.57%. In our previous work (29), we utilized a quantum-inspired deep feature selection method for WBC classification for leukemia detection.
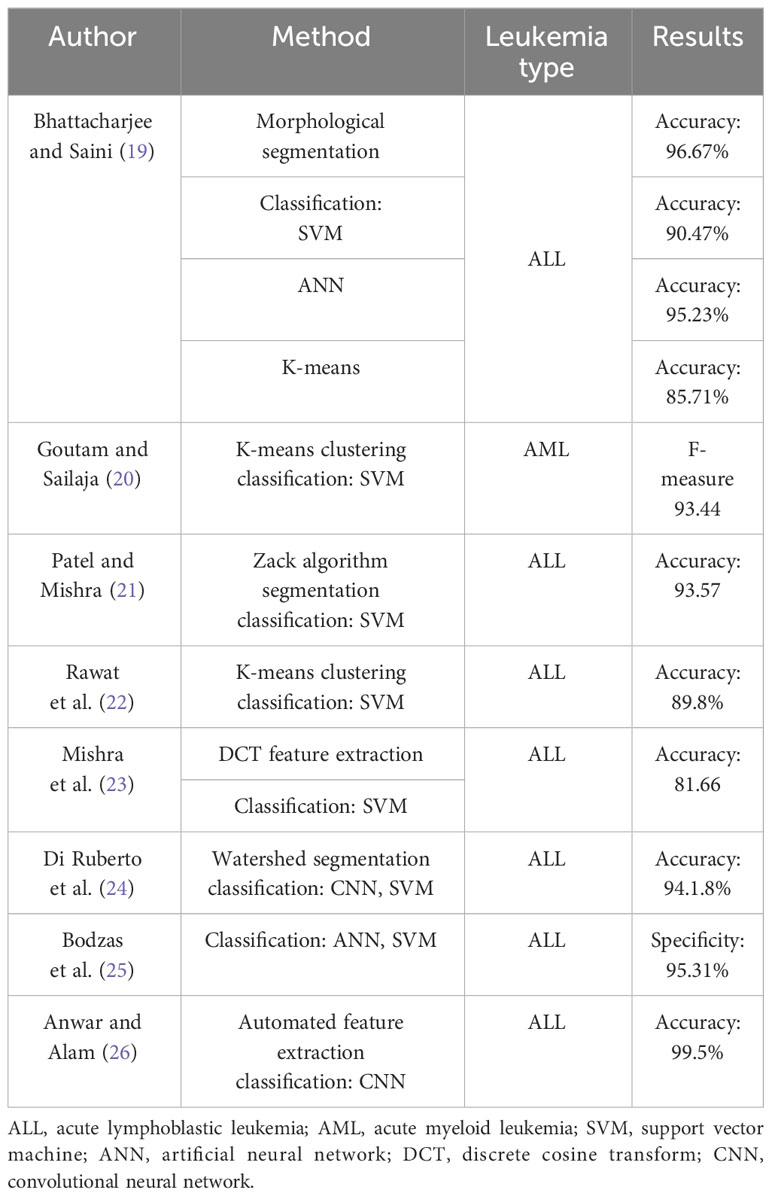
Table 1 Summary of some published studies on leukemia identification.
Modern transfer learning-based deep CNN techniques are characterized by their ability to extract a high number of characteristics from the input images. Due to the unreasonably huge feature sets that must be stored and processed, this has enormous computational costs and memory needs (30, 31). Most frequently, a large portion of these extracted deep characteristics are redundant and provide nothing to help with categorization. By selecting just potent, discriminating characteristics, feature selection is essential to reduce the complexity of feature vectors. This shortens the processing time while simultaneously improving the accuracy of the classification system. Several studies have investigated efficient feature selection methods, which include two kinds of approaches, namely, the filter approach and the wrapper approach. The filter approach quickly converges to the critical features, but it ignores the relationship between the classification algorithm and the feature subset. The wrapper approach, in contrast, considers a tight relationship between a subset of selected features and accuracy. While nature-inspired metaheuristics have been extensively applied in a wide range of combinatorial optimization problems (32–34), they have been recently investigated for feature selection optimization (35–38).
3 Contributions
This work proposes an improved pipeline for ALL subtype identification. The following are the main contributions of this study.
1. First, an efficient neighborhood pixel-based contrast enhancement technique was proposed based on a differential evolution algorithm, whose parameters were optimized using a greedy metaheuristic.
2. Next, two CNNs, namely, InceptionV3 and DenseNet201, were used for feature extraction using deep transfer learning.
3. A combined feature vector was created by performing a fusion of extracted feature vectors.
4. As a main contribution, the deep feature selection problem was modeled as an optimization problem and solved using a nature-inspired Grey Wolf Optimization (GWO) algorithm. The suggested approach selects only the most pertinent features, efficiently excluding correlated and noisy information.
5. The classification performance of various baseline classifiers was validated on the selected feature set to obtain the best-performing classifiers.
6. The proposed system achieves better performance metrics as compared to several existing feature selection methods, with a significant reduction in feature vector size.
4 Materials and method
The key components of the suggested methodology are elaborated upon in the subsequent sections.
4.1 Description of datasets
This study utilized different datasets of blood smear images. The initial dataset utilized in this study was the ALL-IDB2 dataset introduced by Scotti et al. (39). This dataset consisted of a total of 260 pictures, encompassing both healthy individuals and subjects diagnosed with ALL. The dataset was generated by employing an optical microscope that was attached to a Canon Power Shot G5 camera. The IDB2 dataset comprises images in which the region of interest has been cropped to include the area of interest for both normal and blast cells. All images were stored in the Tagged Image File Format (TIFF) and had a resolution of 2,592 pixels in width and 1,944 pixels in height. Figure 3 displays a selection of sample images from the ALL-IDB2 dataset.
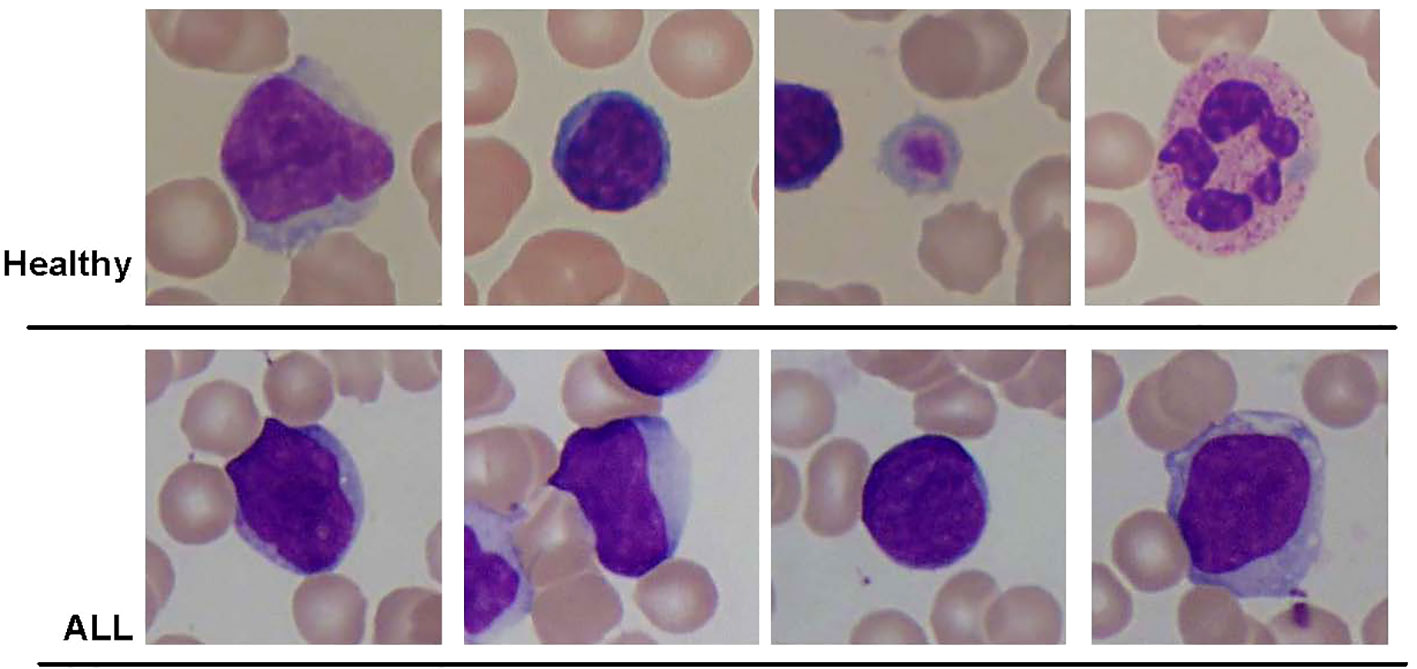
Figure 3 Some samples of images from ALL-IDB2 dataset of Scotti et al. (39) used in this study.
This study used multiple datasets of blood smear images. First, the ALL-IDB2 dataset was used, which was composed of 260 images of healthy and ALL subjects. The dataset was prepared using an optical microscope connected to a Canon Power Shot G5 camera. The IDB2 dataset contained images in which the area of interest of normal and blast cells was cropped as the region of interest. All images were in TIFF format with a resolution of 2,592 × 1,944 pixels. The figure demonstrates some sample images of the ALL-IDB2 dataset.
Another dataset prepared by the bone marrow laboratory of Taleqani Hospital, Iran (40) was also used. The dataset consisted of 3,242 peripheral blood smear images belonging to two classes, i.e., benign and malignant. The latter class was further divided into three sub-classes of ALL, i.e., early, precursor B-cell ALL, and pro-B-cell ALL. The images were captured using a Zeiss camera integrated with a microscope setting with ×100 magnification. The resolution of images was 224 × 224. Figure 4 shows some sample images of the dataset of (40), whereas Table 2 shows the class distribution.
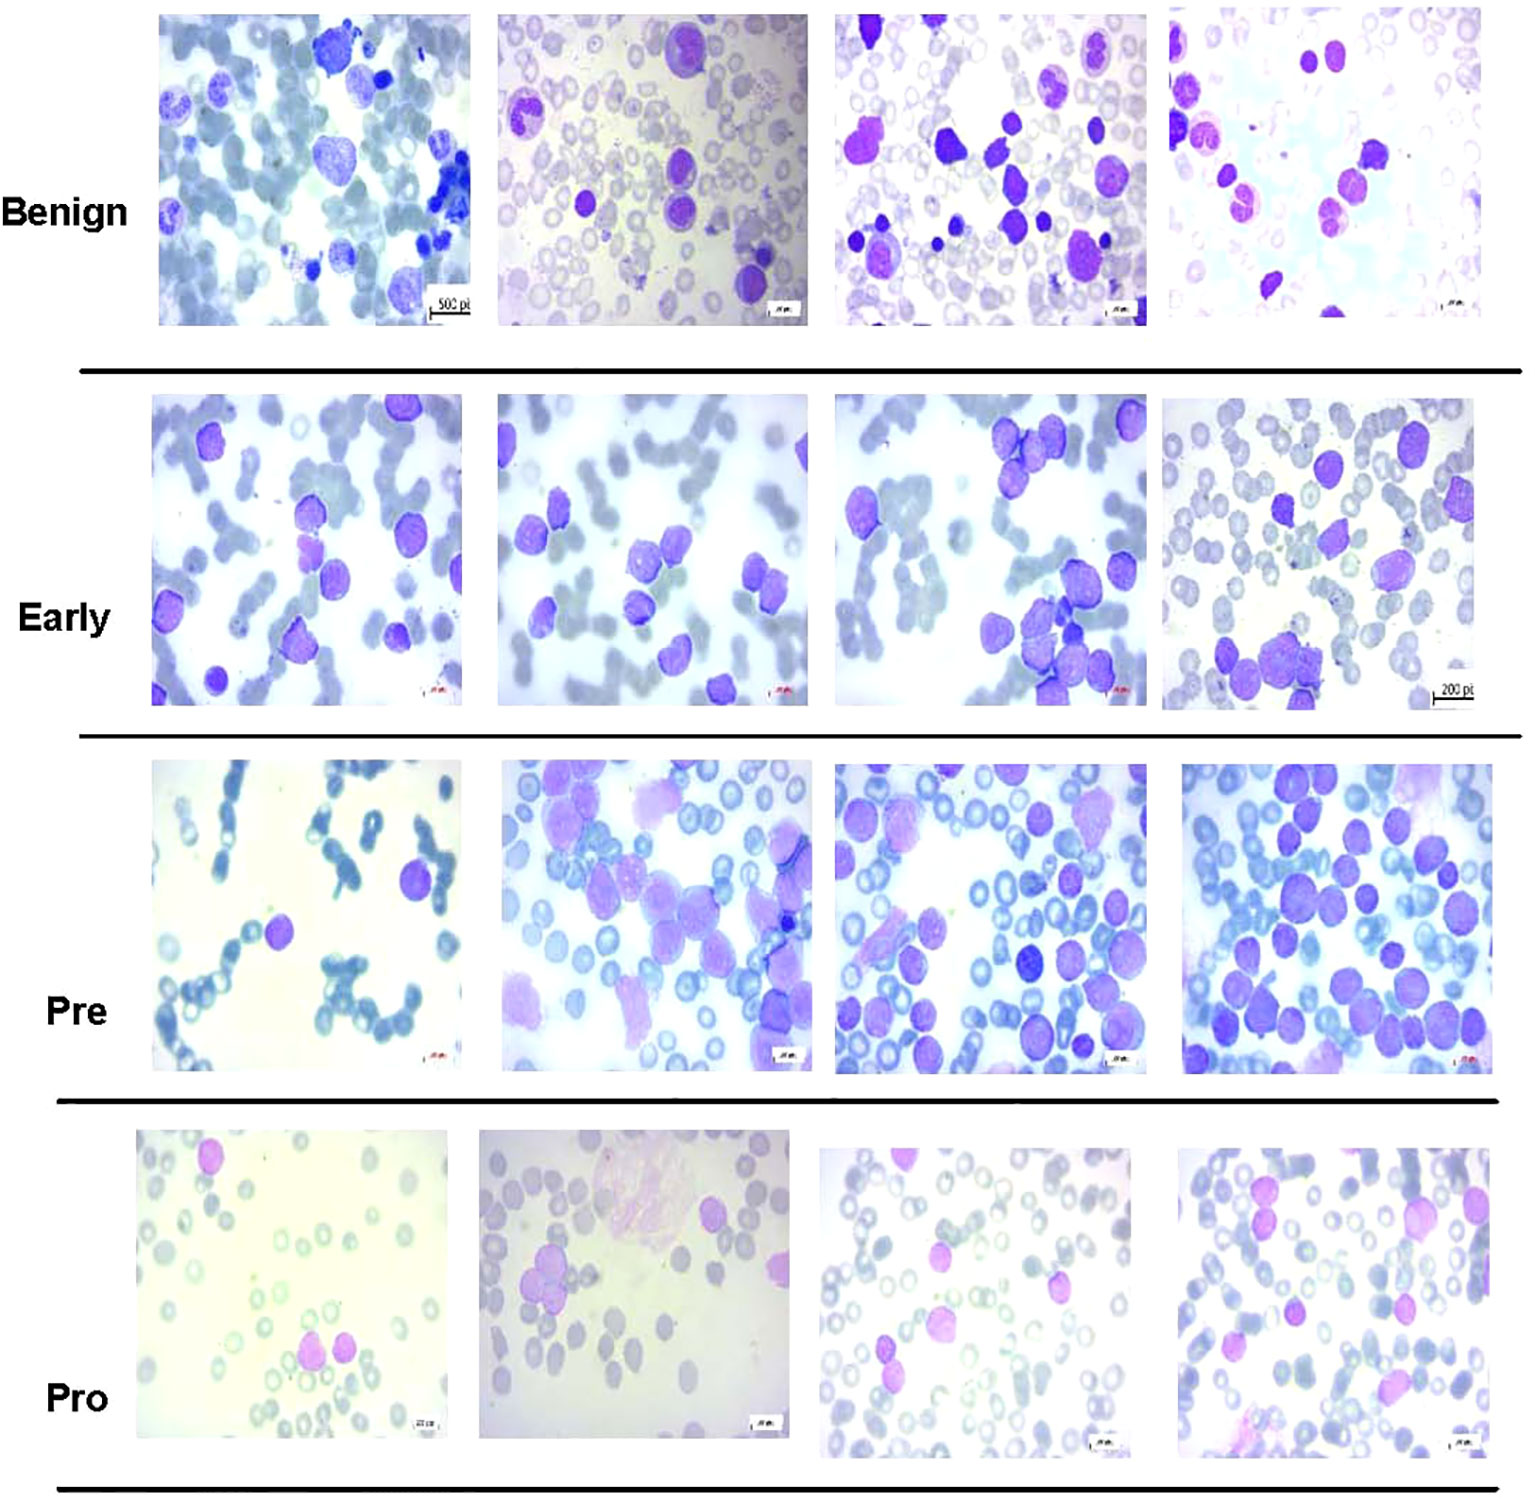
Figure 4 Some samples of images from acute lymphoblastic leukemia (ALL) subtype dataset (40) used in this study.
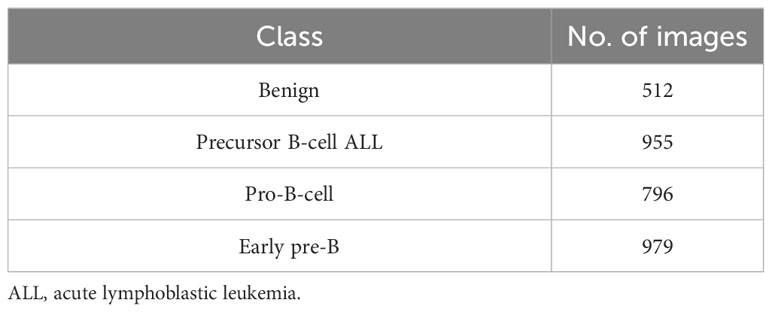
Table 2 Class distribution of image dataset of Ghaderzadeh et al. (40).
4.2 Proposed system pipeline
In Figure 5, a pipeline is presented for the proposed system. The main steps of computation are discussed in the following.
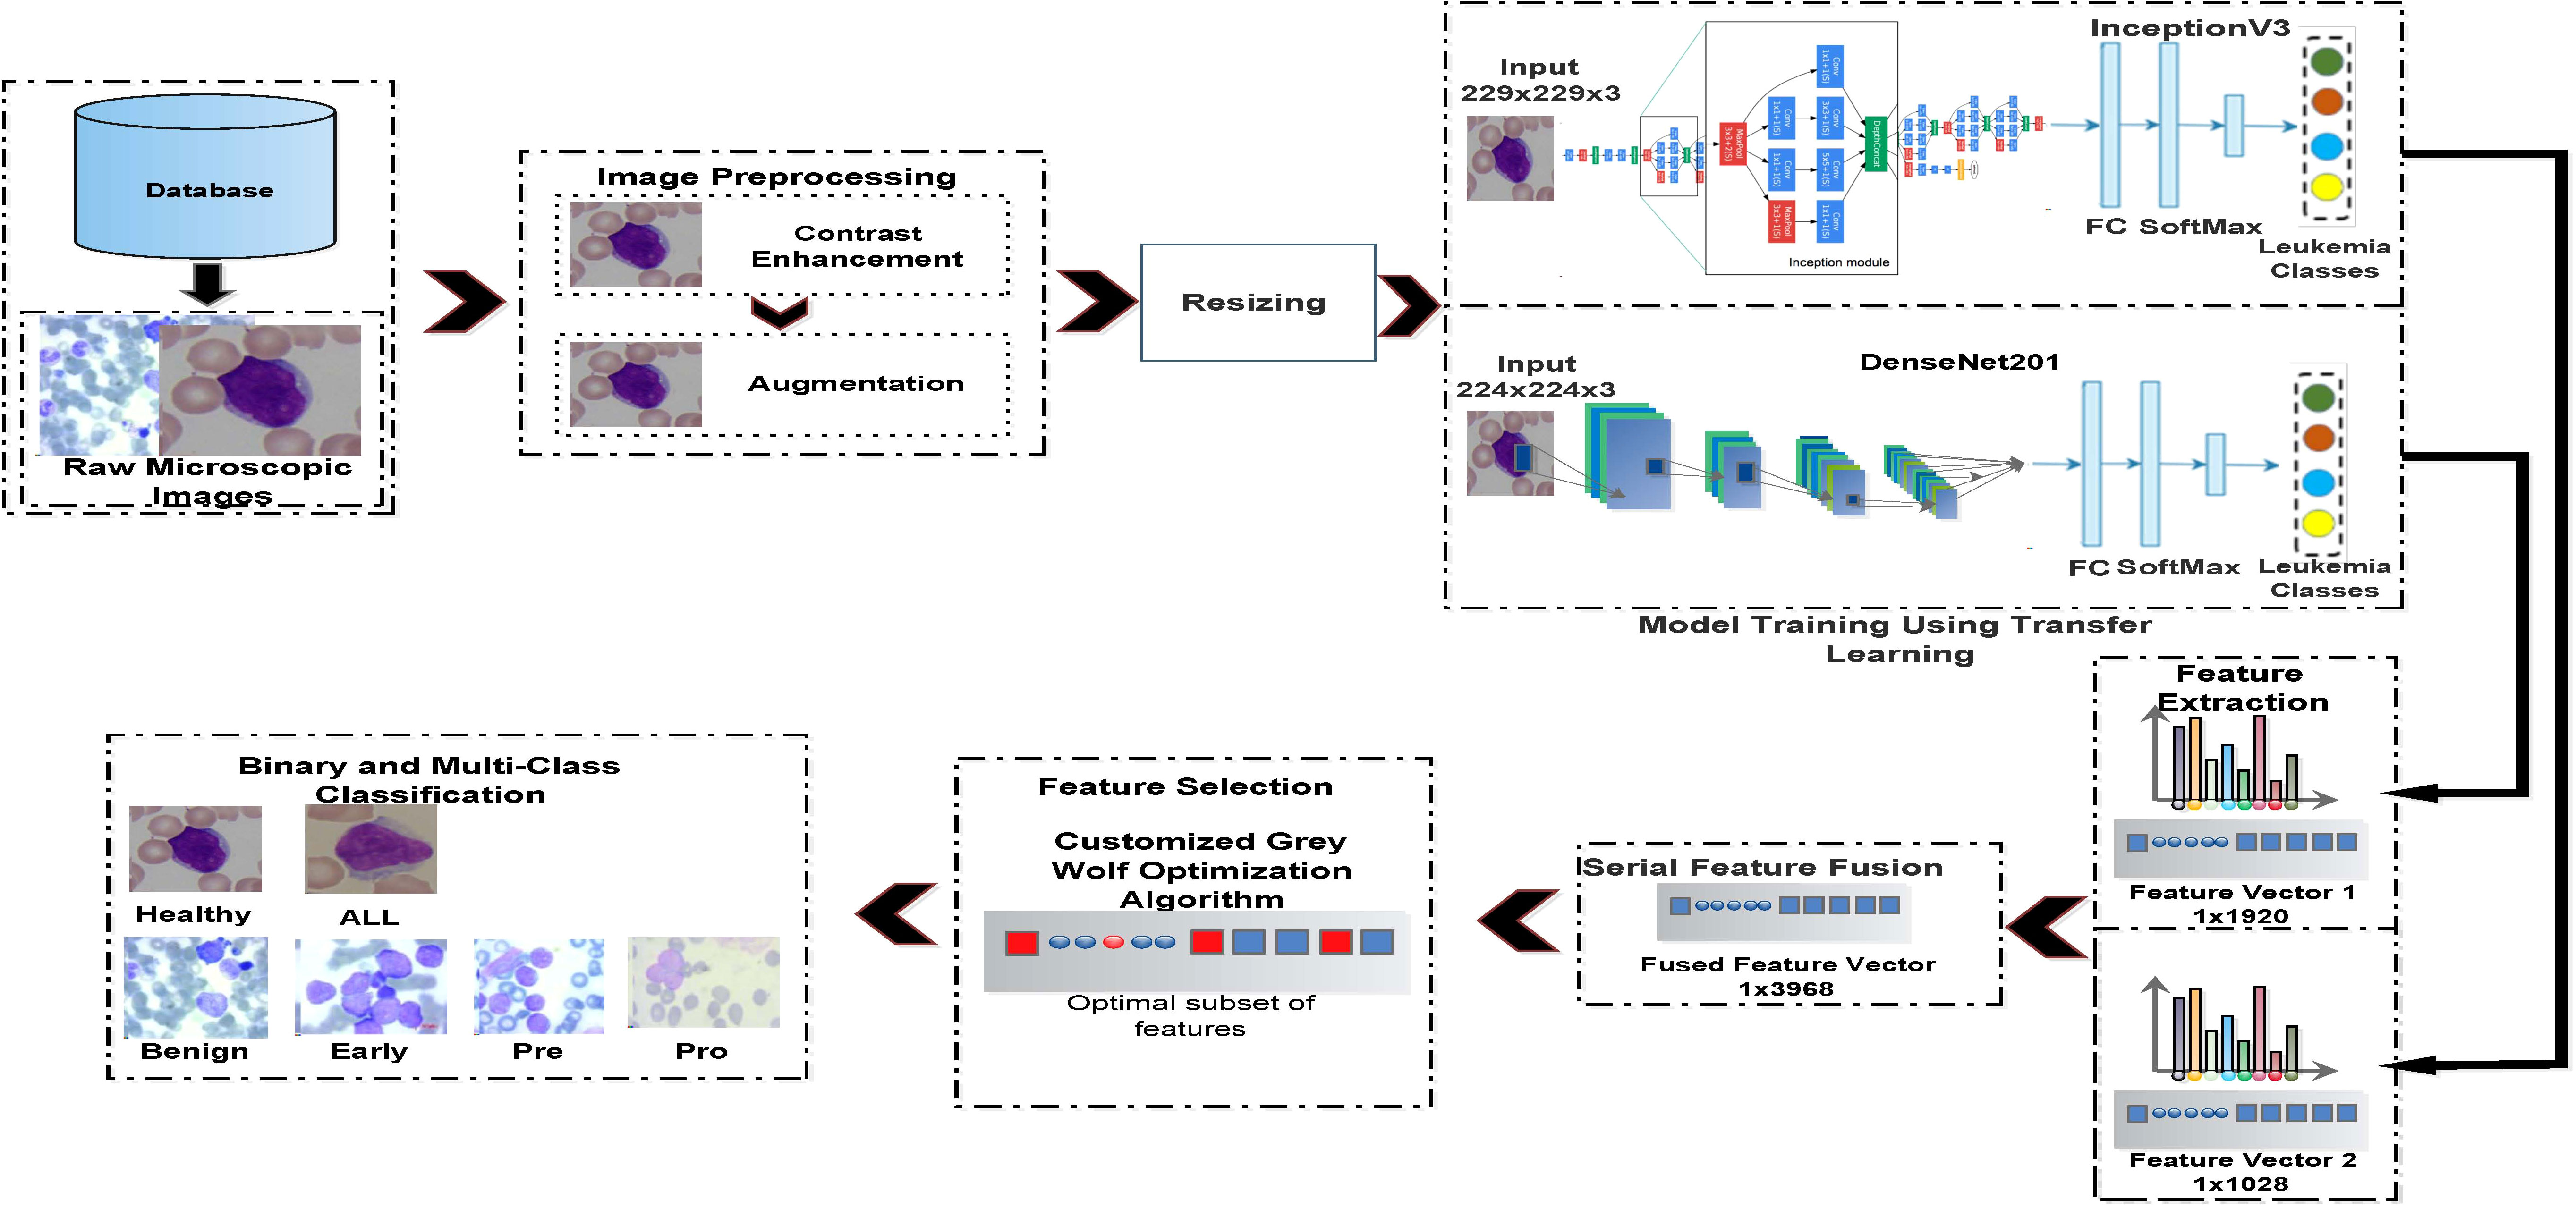
Figure 5 Proposed pipeline for binary and multiclass identification of acute lymphoblastic leukemia.
4.2.1 Contrast enhancement
In most of the existing works, image enhancement is mainly accomplished using transforms, points, and spatial operations (41). Among the transforms, various kinds of filtering operations are included such as homomorphic or linear operations. Point operations include contrast enhancement, thresholding, and histogram adjustment. The main limitation of most of these methods is that they perform a global operation on the input image without considering region-specific contrast stretching. Spatial transformation includes neighborhood-based methods such as filtering or masking. These techniques sometimes produce unnecessary noise enhancement of images or increase the smoothness of image regions where sharpness is required (42).
In this work, we performed image contrast stretching using a greedy differential evolution approach, which consisted of the following steps.
1. Convert the input image from RGB image space to HSI image.
2. Perform contrast stretching of the I-channel of the image using the proposed greedy differential approach
3. Convert the HSI image to RGB image space.
The proposed contrast stretching method was based on neighborhood pixel transformations instead of image-wise global operators. Considering an input intensity image I with dimensions M × N, we used the following function for pixel-wise update based on local neighborhood (41). Mathematically, it is formulated by Equation 1.
where I(m, n) is the current pixel value of the intensity image with coordinates m and n, µ is the global mean of the image, µp(m, n) is the local mean, and σp(m, n) is the local variance of a window comprising of p × p neighborhood pixels around the central pixel I(i, j). Munteanu and Rosa (41) used the non-zero constants α, β, and γ. The non-zero value of β allows to have zero standard deviation σp(i, j) of the pixel window. The final term of Equation 2 was added to achieve smoothness while preserving the brightness.
In this work, we performed automatic estimation of decision variables α, β, γ, and δ using a meta-heuristic algorithm. The following objective function was used in Equation 2:
where I∗ denotes an enhanced intensity image obtained using (2) on the input intensity image, and ne(I∗) and H(I∗), respectively, denote the number of pixels on the boundary and value of entropy of I∗. The value of function G(I∗) was obtained by applying a Sobel kernel on the enhanced intensity image I∗.
4.2.2 Optimization of decision variables using differential evolution
The estimation of variables α, β, γ, and δ was performed using bounded exploration of search space. First, a population matrix P consisting of Np row vectors was generated, where each vector was composed of four variables, i.e., α, β, γ, and δ. Each entity of the population matrix was generated randomly, as Equations 3–6 (43).
where lb and ub are respectively the minimum and maximum values of the decision variable as given in Table 3, and r1 denotes a random number in [0, 1]. All vectors of population P then participated in computing the value of intensity transformation function f(i, j) of Equation 2 and objective function F(I∗) of Equation 2. The vector yielding the maximum value of the objective function was selected as the population best, i.e., Pb.
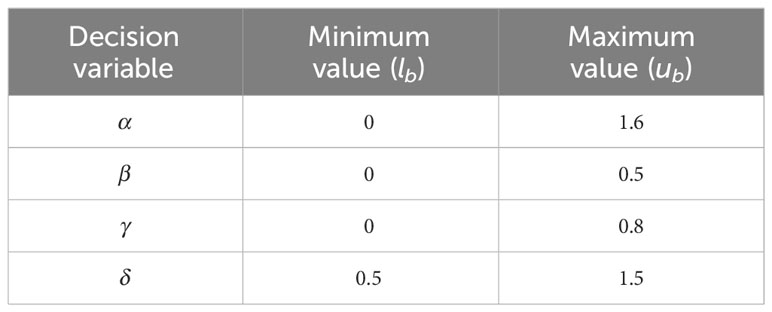
Table 3 Minimum and maximum values of decision variables used in differential evolution.
In the next step, each population vector Pi i ∈{1, …, Np} underwent mutation operation to generate its corresponding mutation vector Mi such that (43)
where t denotes the value of the current iteration, Pb(t) denotes the iteration’s best individual vector, and scaling factor A is a random number in [0, 1]. The indices of population vectors (i.e., r1, r2, r3, and r4) were randomly chosen such that they are all distinct from each other and the index i of the current population vector.
The population vector Pi and its corresponding mutation vector Mi then underwent binomial crossover operation to generate vector Ci such that (43)
where x1 is a randomly generated index within the interval [1, Np] and x2 is a random number in [0, 1]. Next, all decision variables each vector Ci(t) are bounded within limits lb and ub. In differential evolution, a greedy selection of survival of the fittest was carried out using the following criteria to update the population matrix (43).
where F(Pi) and F(Ci) denote the cost of the objective function (2) using the vectors Pi and Ci, respectively. This completes one iteration of the algorithm, which was repeated for T iterations.
4.2.3 Feature extraction
The contrast-enhanced images of datasets were used in the feature extraction step. For this purpose, we employed transfer learning as a feature extraction using two well-known deep CNNs, namely, InceptionV3 and ResNetV2.
InceptionV3 is a deep CNN that belongs to the Inception family of CNNs. It is pre-trained on the ImageNet database (44) consisting of 1,000 object classes. The network has 316 layers and 350 connections (45). The size of the first layer, i.e., the input layer, is 299 × 299 × 3. A convolution layer consists of different filters and stride sizes. Each convolution layer also incorporates batch normalization and ReLU layers for adding non-linearity. A pooling layer is also added between the convolution layers to obtain active neurons. The addition of Inception modules is a distinguishing characteristic of this network. They are designed for multiscale feature extraction. Each inception module is built using multiple parallel convolution layers with different filter sizes and a pooling layer. The outputs of these layers are concatenated along the depth dimension.
To use InceptionV3 for feature extraction, its last learnable layer, “predictions”, was replaced with a fully connected layer, which had outputs matching the number of classes of our datasets [i.e., two classes for ALL-IDB2 and four classes for the dataset of (40)]. The softmax layer named “predictions softmax” was replaced by the new softmax layer. A label-free classification layer was added to the network, which replaced the “ClassificationLayer predictions” layer. Prior to the network training, the dataset image resizing was performed per the requirement of the network’s input layer. Then, specific augmentation steps were performed. The activations were applied on the “avg pool” layer, and a feature vector of length 2,048 was obtained per image of the training and testing datasets.
DenseNet201 (46) has a depth of 201 layers and was initially trained on the ImageNet (44) dataset. The DenseNet201 is based on the idea of layer concatenation; i.e., each layer obtains data from all of its previous layers and transfers its computed feature maps to all its next layers. As a result, a thinner and more compact network is realized, which is computationally efficient and achieves considerable memory savings.
To use DenseNet201 as a feature extractor, its “fc1000” layer was substituted with a fully connected one that contains an equal number of classes from our datasets. Similarly, a new softmax and classification layer without labels was inserted in the network in place of their respective layers. After performing image resizing and augmentation, feature activation was applied on the global average pool layer, and a feature vector of size 1,920 was extracted per image of the dataset.
4.2.4 Feature fusion
In this work, we performed a simple horizontal concatenation of the individual feature vectors extracted from the abovementioned deep CNNs and formed a fused feature vector of size 1 × (a + b), where a = 2,048 and b = 1,920 are the number of features extracted from InceptionV3 and DenseNet201 networks, respectively.
4.2.5 Meta-heuristic for feature selection
The combined feature vector obtained from the transfer learning steps above has a considerably large size. Directly using the extracted fused feature vector to train the baseline classifiers requires a huge amount of processing power and memory. As a main contribution, this work modeled the optimization problem of feature selection with the objective of maximizing classification accuracy with the minimum feature set. The optimization problem was then solved with the help of a population-based meta-heuristic named Grey Wolf Algorithm. This technique (47) mimics the hunting behavior of grey wolves. A pack of grey wolf apex predators consists of an average of five to 12 individuals. The grey wolf population is composed of four distinct individuals categorized as alpha, beta, delta, and omega, based on their dominant order. The alpha wolf is the individual within a population that holds the highest rank and assumes the role of decision-maker and dominant figure. The subsequent position in the dominance hierarchy is occupied by the beta wolf. It is subordinate to the alpha and helps in the decision-making. The delta wolf ranks third in the hierarchy and only dominates the least significant omega group.
In the mathematical framework of GWO, the most optimal solution is referred to as the alpha wolf (α). Subsequently, the second and third most optimal solutions are denoted as the beta (β) and delta (δ) wolves, respectively. The main steps of grey wolf hunting are as follows:
● Search the prey (exploration).
● Encircle the prey.
● Attack the prey (exploitation).
The prey encircle behavior of a pack of wolves is mathematically modeled as defined in Equations 7–18.
where Vp denotes the prey vector position at iteration t, V (t) is the current position of the grey wolf, A and C are the vectors of coefficients:
where x1 and x2 are vectors containing random vectors in [0, 1], and a is the encircling coefficient that mimics the encircling behavior by decreasing linearly from 2 to 0, which is linearly decreased from 2 to 0 with iterations as (47)
where tmax is the maximum number of algorithm iterations. During an iteration t, each wolf updates its position using the α, β, and δ wolves such that (47)
where Vα, Vβ, and Vδ denote the position vectors of α, β, and δ wolves, respectively, at iteration t; A1, A2, and A3 are computed using Equation 9. The vectors D, Dβ, and Dδ are computed as
The coefficients C1, C2, and C3 are computed using Equation 10. The original GWO algorithm of Mirjalili et al. (47) is generally applicable to continuous optimization problems with variables X ∈ ℛ.
4.2.5.1 Binary Grey Wolf Algorithm
This work used a binary GWO algorithm of Emary et al. (48), in which the position update of the wolf is determined using the crossover operation of individual genes, and mathematically formulated by Equations 19–23.
where V1, V2, and V3 are binary vectors for dimension dmax and computed as
For , is equal to , and , whereas is equal to , and respectively. is computed as (48):
where r4 is the vector of random numbers in [0, 1]. The continuous step size is computed as (48)
is equal to , and , respectively, for , and 3. is computed using Equation 9, whereas is computed using Equations 16 – 18. The new position of the wolf is updated using the following crossover operation (48).
where r6 is a random variable that follows a uniform distribution in the interval [0, 1].
4.2.5.2 Wrapper feature selection using binary GWO
This study presents the application of the binary GWO method for the purpose of deep feature selection within the leukemia classification pipeline. The computational steps of the suggested feature selection strategy are presented in Algorithm 1.
The main inputs to the binary GWO algorithm include the fused feature matrix , the vector L, which contains the labels of the training image set; the maximum count of iterations tmax the size of grey wolf population np; and dimension size dmax, which represents the total number of variables (features) of each wolf (solution) of population. The size of matrix is nt × dmax, where nt and dmax respectively denote the number of training images and the dimension of fused feature vector per image.
Phase 1 initializes the main parameters including iteration counter t, and alpha, beta, and delta grey wolves Xα, Xβ, and Xδ along with their fitness values fα, fβ, and fδ, respectively. In Phase 2, an initial population is generated and stored in matrix of size np × dmax. The randn(1, np, 1: dmax) function generates a matrix of dimensions np ×dmax of binary values of uniform distribution in [0, 1]. The execution phase of the GWO algorithm proceeds in Steps 6–75. The while loop is executed for tmax iterations. In an iteration, first, a prey is extracted from the population matrix (Step 8), and its fitness is evaluated (Step 9). The Fitness function receives three inputs, namely, the fused feature set , the vector L of labels, and one member of the population, i.e., a binary vector X. In the Fitness function routine, Steps 85–86 obtain the features from , which are indexed by non-zero values of X. The updated feature matrix 2 is then divided into testing and training parts. In Steps 87–93 of the Fitness function, the classification error of the K-nearest neighbor (KNN) classifier is used as a fitness value (cost). This value is then used to update the alpha, beta, and delta Xα, Xβ, and Xδ grey wolf vectors, respectively, in Steps 10–23 of the main function. Steps 26–74 of the main routine perform the position update of each grey wolf of the population according to Equations 19, 20 of the binary GWO algorithm. After the execution of the while loop for tmax iterations, the global best solution, i.e., alpha wolf Xα, contains the indices of features to be selected from the fused feature vector.

ALGORITHM 1. Feature selection based on binary GWO algorithm.
4.2.6 Classification
The set of selected features from the binary GWO algorithm was then used along with the label L for training and classification of outer classifiers. Multiple classifiers were used in this work, and the best-performing classifiers were selected.
5 Results and discussion
The proposed decision support system for leukemia identification was implemented on an Intel Core i5 CPU with and 64-bit Windows 10 operating system and 16GB RAM.
5.1 Experiment 1: binary classification
First, the proposed pipeline was implemented for binary detection of leukemia using the ALL-IDB2 dataset. The classification performance of CNN was influenced by the quality and size of the training dataset. A small dataset leads to overfitting and poor generalization of the model. Hence, augmentation of contrast stretched ALL-IDB2 dataset was performed using the operations of random rotation, flipping, intensity modification, and brightness correction. Table 4 shows the class distribution of ALL-IDB2 as a result of augmentation. In the next step, the augmented dataset was divided into training and test parts with a 70:30 split ratio, as shown in Table 5. Then, the training dataset was used for transfer learning of InceptionV3 and DenseNet201 models with parameters listed in Table 6.
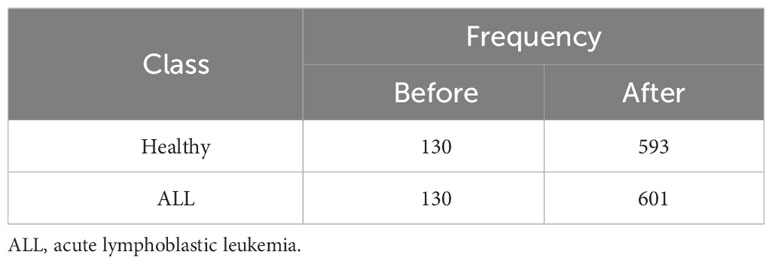
Table 4 Class distribution of ALL-IDB2 dataset before and after augmentation.
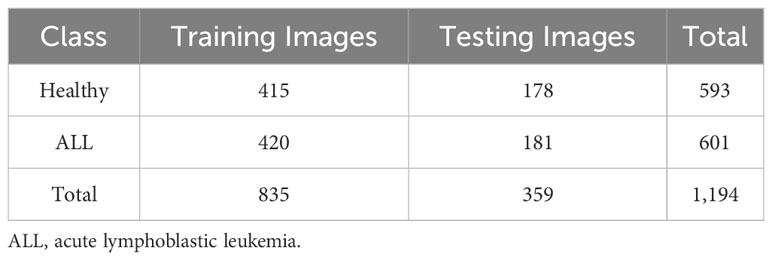
Table 5 Training and testing ALL-IDB2 dataset for binary classification of leukemia.
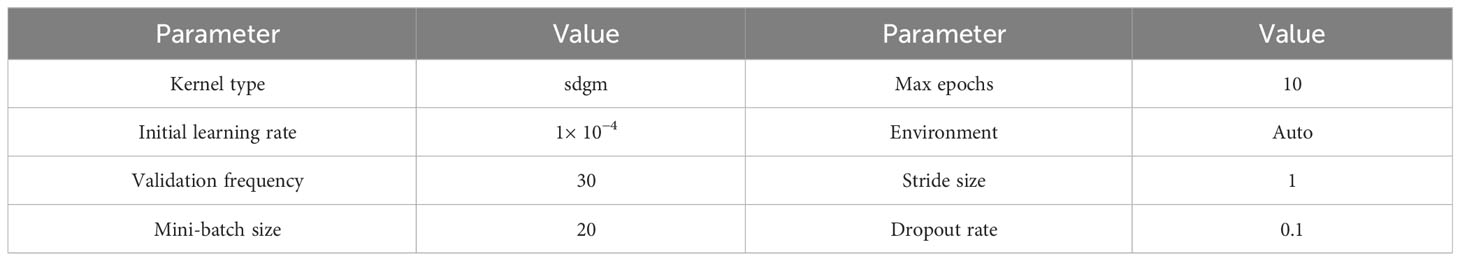
Table 6 Parameter settings for training of InceptionV3 and DenseNet201 models.
InceptionV3 and DenseNet201 return deep feature vectors of sizes 2,048 and 1,920, respectively, which are horizontally concatenated to obtain a fused feature vector of size 3,968. This vector is then subjected to the proposed feature selection step using the GWO algorithm. After a fixed number of iterations, the GWO algorithm returns its best solution, i.e., a reduced vector of the most important selected features, which are then used to train several baseline classifiers with multiple settings of their kernel. Table 7 shows the performance results of the proposed binary classification pipeline. The KNN classifier with cosine kernel achieves the best performance metrics with a reduced feature vector of 797 features, which is approximately 80% smaller than the original fused feature vector of size 3,986. The confusion matrix of the KNN cosine classifier is demonstrated in Table 8.
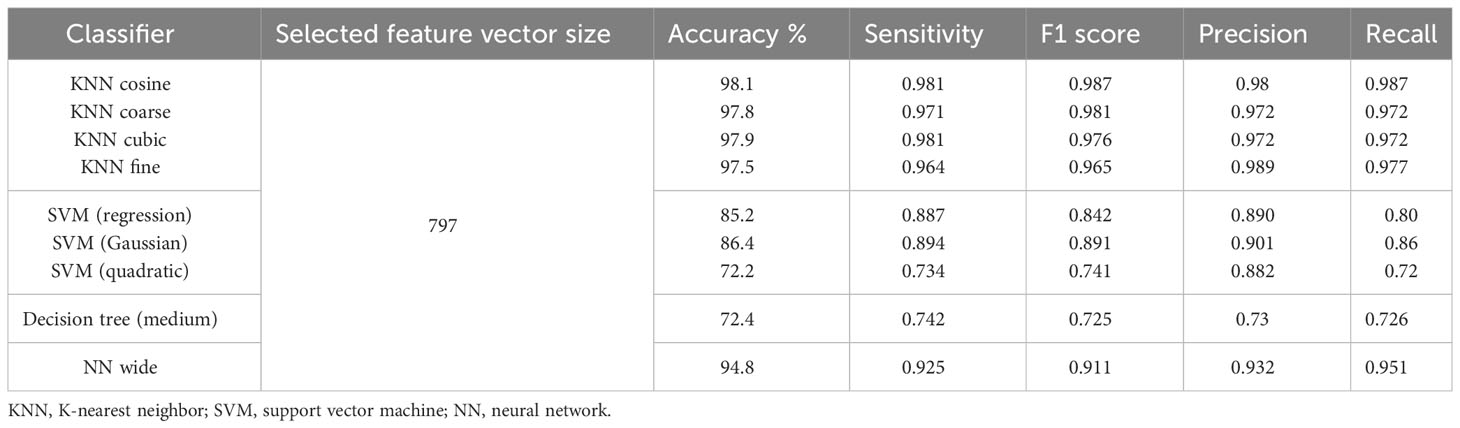
Table 7 Results of binary classification of leukemia on ALL-IDB2 dataset.
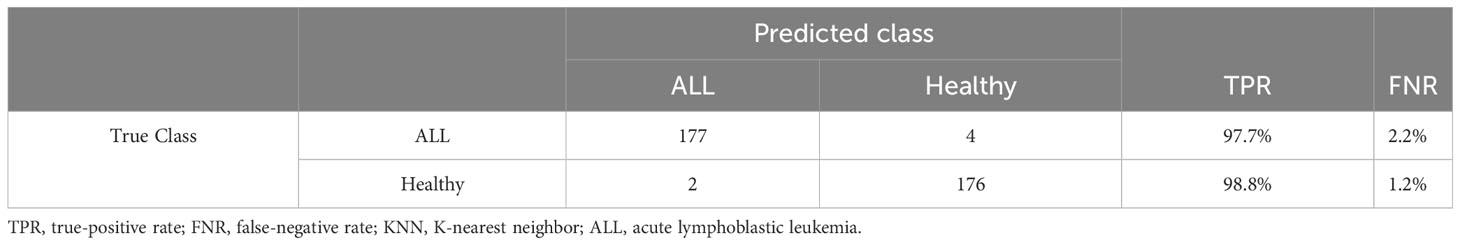
Table 8 Confusion matrix of binary classification experiment of ALL-IDB2 with KNN-cosine classifier.
In Figure 6, the error rate of the GWO algorithm is plotted along with the standard genetic algorithm (GA), as a function of iterations with a constant value of population size np = 20. A better convergence behavior is demonstrated by the GWO algorithm as compared to GA, which reveals that GWO performs better exploration of feature search space.
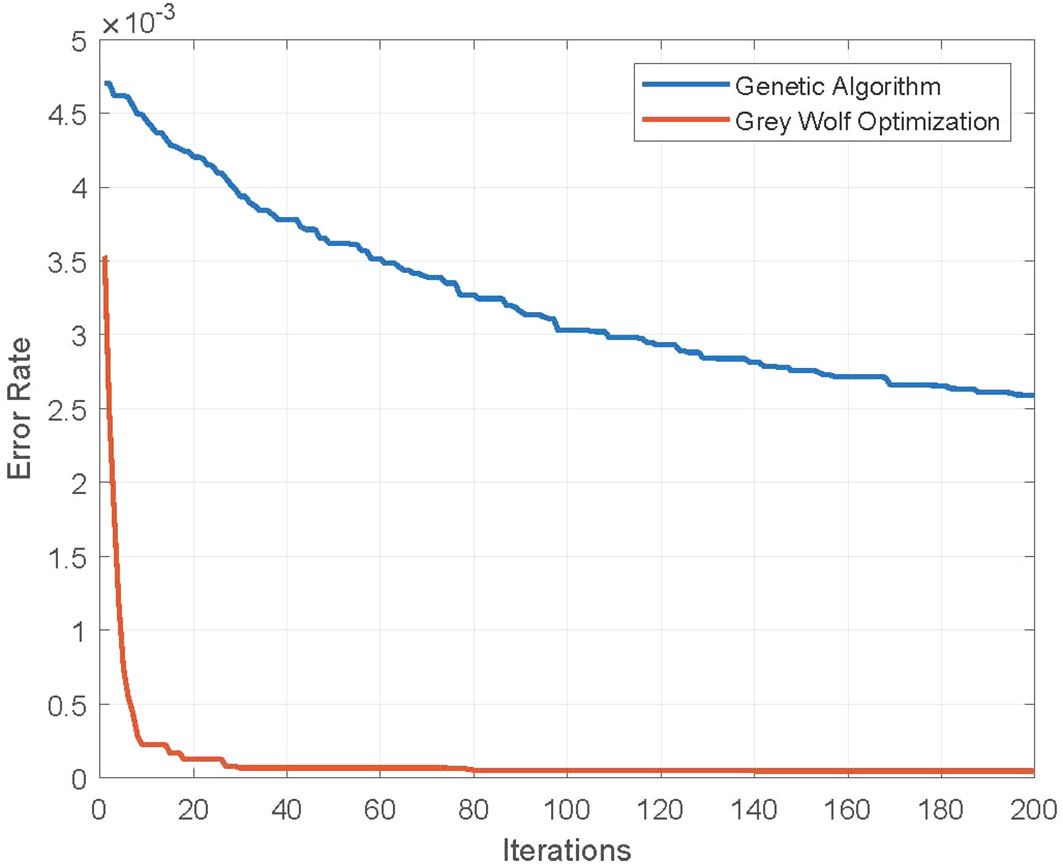
Figure 6 Error rate of feature selection using genetic and Grey Wolf Optimization algorithms. Population size np = 20.
5.2 Experiment 2: leukemia subtype classification
In the second step, the proposed pipeline was implemented for multiclass problems, i.e., leukemia subtype identification using the dataset of Ghaderzadeh et al. (40). As discussed earlier, the dataset consists of four classes, i.e., benign, precursor, pro-B-cell, and early pre-B. Following the contrast stretching phase (Section 4.2.1) on the dataset, the augmentation was carried out using the same methodology as binary classification. The class distribution of the augmented dataset is shown in Table 9. Next, with a splitting ratio of 70:30, the training and testing parts of the dataset were extracted as shown in Table 10.
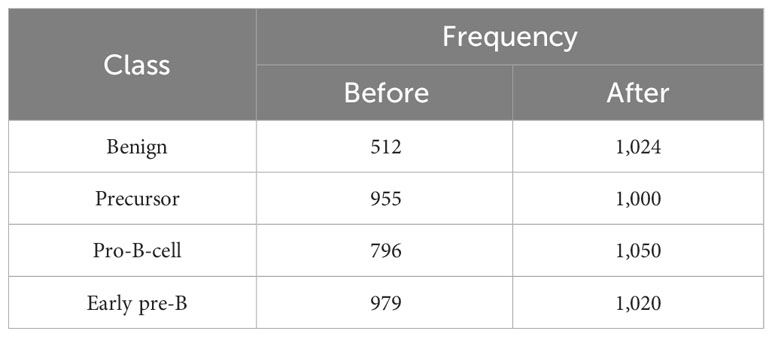
Table 9 Class distribution of dataset of Ghaderzadeh et al. (40) before and after augmentation.

Table 10 Class distribution of training and testing parts of dataset of Ghaderzadeh et al. (40) for leukemia subtype classification.
In Table 11, the leukemia subtype classification results are presented. Several classifiers with various kernels were tested. The performance metrics, i.e., accuracy, precision, recall, sensitivity, specificity, and F1 score, were computed through macro averaging of the individual class metrics. In this case, the SVM classifier with Gaussian kernel achieved the best average accuracy of 98.05%, whereas the maximum average accuracy values achieved by KNN, decision tree, and neural network (NN) classifiers were 97.9%, 82.4%, and 95.8%, respectively. The testing confusion matrix with the SVM Gaussian classifier is demonstrated in Table 12, whereas the class-wise statistics are mentioned in Table 13. The maximum accuracy of 98.66% was achieved by the pro-B-cell class, whereas all other classes achieved an accuracy of above 90%.
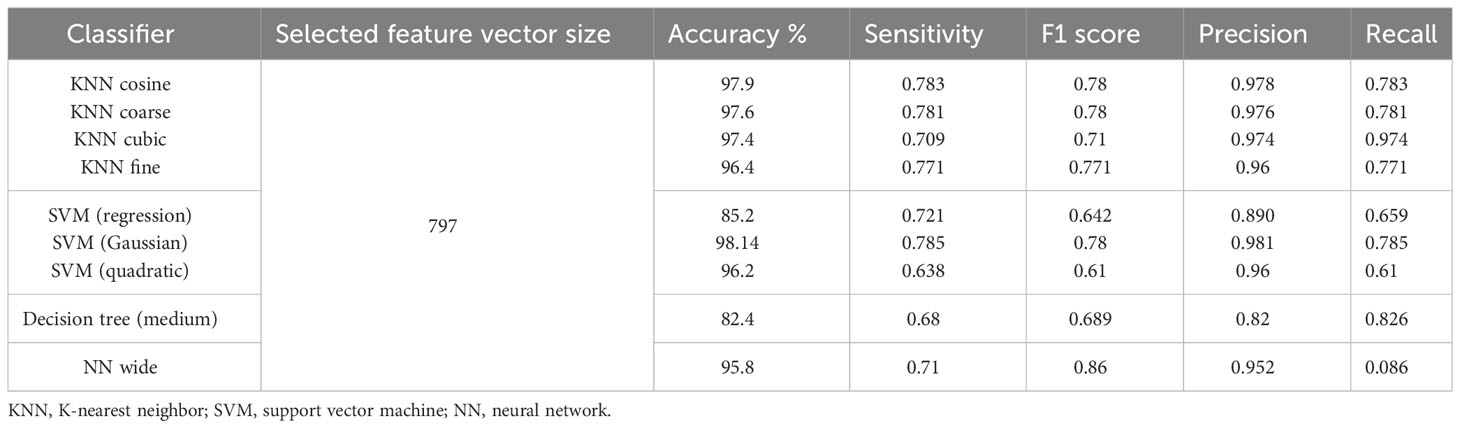
Table 11 Results of leukemia subtype classification using the dataset of Ghaderzadeh et al. (40).
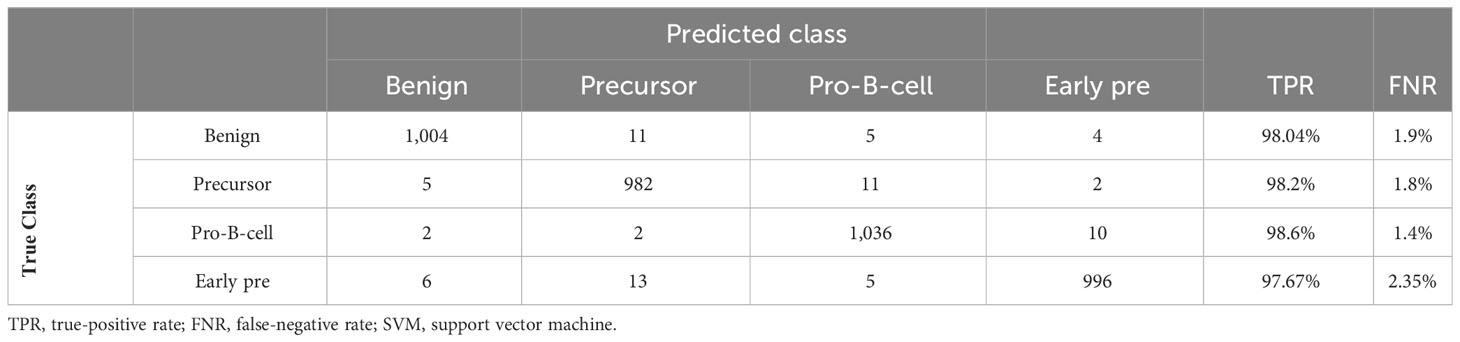
Table 12 Confusion matrix of leukemia subtype identification using SVM Gaussian classifier on dataset of Ghaderzadeh et al. (40).
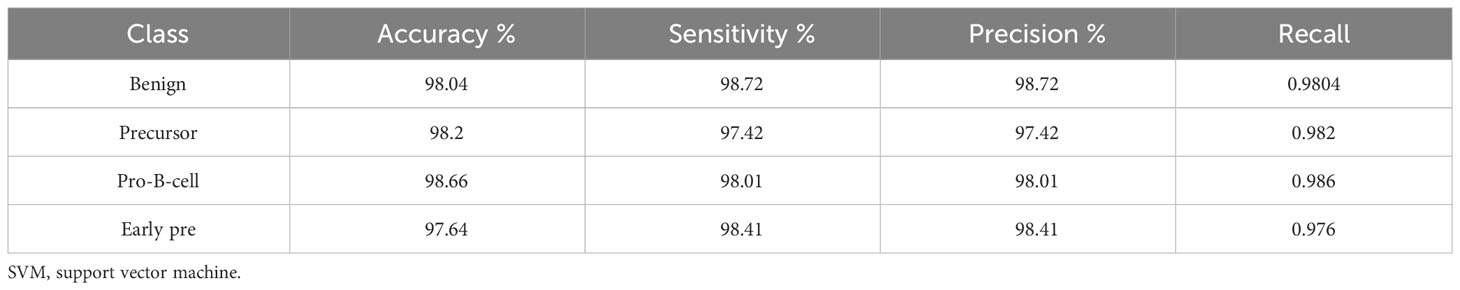
Table 13 Statistics of individual classes using SVM Gaussian kernel.
Table 14 presents an accuracy comparison of three feature extraction methods, i.e., a full set of deep features extracted from InceptionV3 and DenseNet201 CNNs, a reduced set of features selected by the proposed GWO algorithm, and a standard genetic algorithm. The table demonstrates that the GWO algorithm achieves a better or comparable accuracy as compared to the other two feature selection methods with a significantly small feature set.
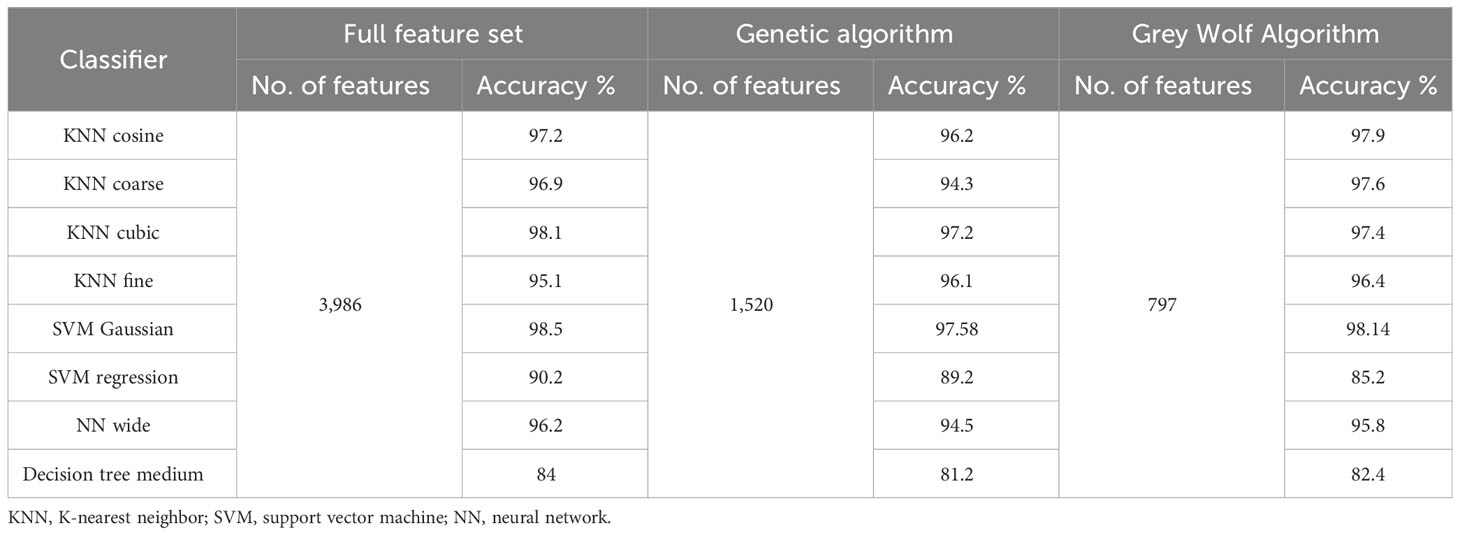
Table 14 Performance comparison of leukemia classification using three feature selection approaches, i.e., proposed GWO feature selection algorithm, feature selection using genetic algorithm, and full feature set.
In Table 15, a comparison is presented of the performance of our proposed method with some existing studies on leukemia identification. For a fair comparison, we selected the published studies that have used identical or almost similar datasets. Our proposed pipeline for leukemia binary detection and subtype identification achieves better or comparable performance metrics as compared to several other relevant studies with smaller feature sizes. This shows the validity and applicability of the proposed approach.
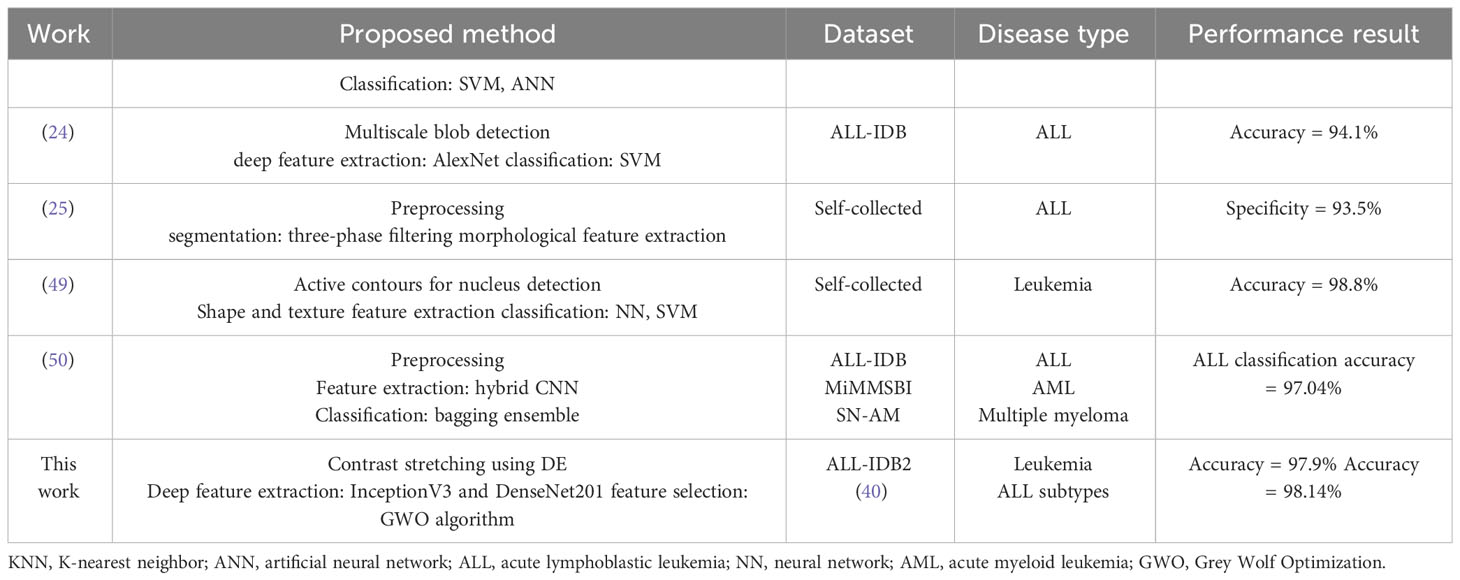
Table 15 Comparison of classification accuracy of proposed leukemia identification pipeline with some existing relevant works.
6 Conclusion
Leukemia, a kind of hematologic malignancy, is frequently diagnosed in both pediatric and geriatric populations. An automated, computer-aided system of leukemia diagnosis is essential to aid medical professionals in making informed decisions about the disease and making an effective prognosis and treatment plan. In this work, we have demonstrated the effectiveness of deep feature optimization taking as a relevant design case, the detection, and classification of leukemia disease from blood smear images. We have proposed a hybrid deep learning methodology utilizing transfer learning as feature extraction. The problem of feature selection has been modeled as a combinatorial optimization problem and solved using a customized Grey Wolf Optimization algorithm. Our proposed leukemia identification system can be used as a supporting evidence tool in conjunction with other more detailed analysis methods such as RNA sequencing and molecular testing. We believe that the proposed expert system can also be integrated with more complex and rather practical image analysis systems such as image flow cytometry.
Data availability statement
The original contributions presented in the study are included in the article/Supplementary Material. Further inquiries can be directed to the corresponding authors.
Author contributions
MA: Conceptualization, Investigation, Methodology, Software, Writing – original draft, Writing – review & editing. MNA: Methodology, Software, Writing – review & editing. TA: Investigation, Methodology, Validation, Writing – review & editing. AA: Resources, Supervision, Writing – review & editing. MM: Resources, Supervision, Writing – review & editing. AM: Funding acquisition, Resources, Validation, Writing – review & editing.
Funding
The author(s) declare financial support was received for the research, authorship, and/or publication of this article. The authors extend their appreciation to the Deanship of Scientific Research at King Khalid University for funding this work through small group Research Project under grant number RGP1/417/44.
Conflict of interest
The authors declare that the research was conducted in the absence of any commercial or financial relationships that could be construed as a potential conflict of interest.
Publisher’s note
All claims expressed in this article are solely those of the authors and do not necessarily represent those of their affiliated organizations, or those of the publisher, the editors and the reviewers. Any product that may be evaluated in this article, or claim that may be made by its manufacturer, is not guaranteed or endorsed by the publisher.
Supplementary material
The Supplementary Material for this article can be found online at: https://www.frontiersin.org/articles/10.3389/fonc.2024.1328200/full#supplementary-material
Supplementary Table 1 | Description of main symbols used in Algorithm 1.
References
1. Farag MR, Alagawany M. Erythrocytes as a biological model for screening of xenobiotics toxicity. Chemico-biol. Interact. (2018) 279:73–83. doi: 10.1016/j.cbi.2017.11.007.
2. Rezatofighi SH, Soltanian-Zadeh H. Automatic recognition of five types of white blood cells in peripheral blood. Computer. Med Imaging Graphics. (2011) 35:333–43. doi: 10.1016/j.compmedimag.2011.01.003.
4. Bengio Y, Courville A, Vincent P. Representation learning: A review and new perspectives. IEEE Trans Pattern Anal Mach Intell. (2013) 35:1798–828. doi: 10.1109/TPAMI.2013.50.
5. Nguyen LD, Lin D, Lin Z, Cao J. (2018). Deep cnns for microscopic image classification by exploiting transfer learning and feature concatenation, in: 2018 IEEE international symposium on circuits and systems (ISCAS), , Vol. 1–5. IEEE.
6. Ahamed KU, Islam M, Uddin A, Akhter A, Paul BK, Yousuf MA, et al. A deep learning approach using effective preprocessing techniques to detect covid-19 from chest ct-scan and x-ray images. Comput Biol Med. (2021) 139:105014. doi: 10.1016/j.compbiomed.2021.105014.
7. He K, Zhang X, Ren S, Sun J. (2016). Deep residual learning for image recognition, in: Proceedings of the IEEE conference on computer vision and pattern recognition, (IEEE). pp. 770–8.
8. Howard AG, Zhu M, Chen B, Kalenichenko D, Wang W, Weyand T, et al. Mobilenets: Efficient convolutional neural networks for mobile vision applications. arXiv preprint arXiv:1704.04861. (2017).
10. Chollet F. (2017). Xception: Deep learning with depthwise separable convolutions, in: Proceedings of the IEEE conference on computer vision and pattern recognition, (IEEE). pp. 1251–8.
11. Shin HC, Roth HR, Gao M, Lu L, Xu Z, Nogues I, et al. Deep convolutional neural networks for computer-aided detection: Cnn architectures, dataset characteristics and transfer learning. IEEE Trans Med Imaging. (2016) 35:1285–98. doi: 10.1109/TMI.42.
12. Biswas S, Mostafiz R, Paul BK, Uddin KMM, Rahman MM, Shariful F. Dfu multinet: A deep neural network approach for detecting diabetic foot ulcers through multi-scale feature fusion using the dfu dataset. Intelligence-Based Med. (2023), 100128. doi: 10.1016/j.ibmed.2023.100128.
13. Sanei S, Lee TK. (2003). T: Cell recognition based on pca and bayesian classification, in: 4th International Symposium, ICA 2003 (Citeseer), .
14. Kumar P. Matlab based potent algorithm for wbc cancer detection and classification. Biomed Pharmacol J. (2021) 14:2277–84. doi: 10.13005/bpj.
15. Su MC, Cheng CY, Wang PC. A neural-network-based approach to white blood cell classification. Sci World J. (2014). doi: 10.1155/2014/796371.
16. Sharma S, Gupta S, Gupta D, Juneja S, Gupta P, Dhiman G, et al. Deep learning model for the automatic classification of white blood cells. Comput Intell Neurosci. (2022). doi: 10.1155/2022/7384131.
17. Almezhghwi K, Serte S. Improved classification of white blood cells with the generative adversarial network and deep convolutional neural network. Comput Intell Neurosci. (2020). doi: 10.1155/2020/6490479.
18. Yildirim M, Çinar A. Classification of white blood cells by deep learning methods for diagnosing disease. Rev d’Intel. Artif. (2019) 33:335–40. doi: 10.18280/ria.
19. Bhattacharjee R, Saini LM. (2015). Robust technique for the detection of acute lymphoblastic leukemia, in: 2015 IEEE Power, Communication and Information Technology Conference (PCITC), pp. 657–62. IEEE.
20. Goutam D, Sailaja S. (2015). Classification of acute myelogenous leukemia in blood microscopic images using supervised classifier, in: 2015 IEEE International Conference on Engineering and Technology (ICETECH), , Vol. 1–5. IEEE.
21. Patel N, Mishra A. Automated leukaemia detection using microscopic images. Proc Comput Sci. (2015) 58:635–42. doi: 10.1016/j.procs.2015.08.082.
22. Rawat J, Singh A, Bhadauria H, Virmani J. Computer aided diagnostic system for detection of leukemia using microscopic images. Proc Comput Sci. (2015) 70:748–56. doi: 10.1016/j.procs.2015.10.113.
23. Mishra S, Sharma L, Majhi B, Sa PK. (2017). Microscopic image classification using dct for the detection of acute lymphoblastic leukemia (all), in: Proceedings of International Conference on Computer Vision and Image Processing: CVIP 2016, Volume 1. pp. 171–80. Springer.
24. Di Ruberto C, Loddo A, Puglisi G. Blob detection and deep learning for leukemic blood image analysis. Appl Sci. (2020) 10:1176. doi: 10.3390/app10031176.
25. Bodzas A, Kodytek P, Zidek J. Automated detection of acute lymphoblastic leukemia from microscopic images based on human visual perception. Front Bioeng. Biotechnol. (2020) 8:1005. doi: 10.3389/fbioe.2020.01005.
26. Anwar S, Alam A. A convolutional neural network–based learning approach to acute lymphoblastic leukaemia detection with automated feature extraction. Med Biol Eng comput. (2020) 58:3113–21. doi: 10.1007/s11517-020-02282-x.
27. Batool A, Byun YC. Lightweight efficientnetb3 model based on depthwise separable convolutions for enhancing classification of leukemia white blood cell images. IEEE Access. (2023) 11:37203–15. doi: 10.1109/ACCESS.2023.3266511
28. Elhassan TAM, Rahim MSM, Swee TT, Hashim SZM, Aljurf M. Feature extraction of white blood cells using cmyk-moment localization and deep learning in acute myeloid leukemia blood smear microscopic images. IEEE Access. (2022) 10:16577–91. doi: 10.1109/ACCESS.2022.3149637
29. Ahmad R, Awais M, Kausar N, Tariq U, Cha JH, Balili J. Leukocytes classification for leukemia detection using quantum inspired deep feature selection. Cancers. (2023) 15:2507. doi: 10.3390/cancers15092507.
30. Ahmed N, Yigit A, Isik Z, Alpkocak A. Identification of leukemia subtypes from microscopic images using convolutional neural network. Diagnostics. (2019) 9:104. doi: 10.3390/diagnostics9030104.
31. Al Amin M, Paul BK, Bithi NI. (2022). Real time detection and localization of colorectal polyps from colonoscopy images: A deep learning approach, in: 2022 IEEE International Women in Engineering (WIE) Conference on Electrical and Computer Engineering (WIECON-ECE), . pp. 58–61. IEEE.
32. Ahmed A, Khan Q, Naeem M, Iqbal M, Anpalagan A, Awais M. An insight to the performance of estimation of distribution algorithm for multiple line outage identification. Swarm evolution. Comput. (2018) 39:114–22. doi: 10.1016/j.swevo.2017.09.006.
33. Ahmed A, Awais M, Naeem M, Iqbal M, Ejaz W, Anpalagan A, et al. Multiple power line outage detection in smart grids: probabilistic bayesian approach. IEEE Access. (2017) 6:10650–61. doi: 10.1109/ACCESS.2017.2710285.
34. Awais M, Ahmed A, Naeem M, Iqbal M, Qadri N, Anpalagan A. Multiple line outages identification: A customized quantum inspired approach. Electric Power Syst Res. (2016) 134:47–55. doi: 10.1016/j.epsr.2015.12.001.
35. Gupta D, Agrawal U, Arora J, Khanna A. Bat-inspired algorithm for feature selection and white blood cell classification. Nature-Inspired Comput Swarm Intell (Elsevier). (2020), 179–97. doi: 10.1016/B978-0-12-819714-1.00022-1.
36. Shahzad A, Raza M, Shah JH, Sharif M, Nayak RS. Categorizing white blood cells by utilizing deep features of proposed 4b-additionnet-based cnn network with ant colony optimization. Complex Intel. Syst. (2022), 1–17. doi: 10.1007/s40747-021-00564-x.
37. Liu J, Lin Y, Li Y, Weng W, Wu S. Online multi-label streaming feature selection based on neighborhood rough set. Pattern Recogn. (2018) 84:273–87. doi: 10.1016/j.patcog.2018.07.021.
38. Ahmad R, Awais M, Kausar N, Akram T. White blood cells classification using entropy-controlled deep features optimization. Diagnostics. (2023) 13:352. doi: 10.3390/diagnostics13030352.
39. Scotti F, Labati R, Piuri V. Acute lymphoblastic leukemia image database for image processing. Department Comput Sci. Univ Milan Italy. (2005).
40. Ghaderzadeh M, Aria M, Hosseini A, Asadi F, Bashash D, Abolghasemi H. A fast and efficient cnn model for b-all diagnosis and its subtypes classification using peripheral blood smear images. Int J Intel. Syst. (2022) 37:5113–33. doi: 10.1002/int.22753.
41. Munteanu C, Rosa A. (2000). Towards automatic image enhancement using genetic algorithms, in: Proceedings of the 2000 Congress on Evolutionary Computation. CEC00 (Cat. No. 00TH8512), , Vol. 2. pp. 1535–42. IEEE.
43. Malik S, Akram T, Awais M, Khan MA, Hadjouni M, Alasiry A, et al. Improved skin lesion boundary estimation for enhanced-intensity images using hybrid metaheuristics. Diagnostics. (2023) 13(7):1285.
44. Imagenet. Available online at: http://www.image-net.org.
45. Szegedy C, Vanhoucke V, Ioffe S, Shlens J, Wojna Z. (2016). Rethinking the inception architecture for computer vision, in: Proceedings of the IEEE conference on computer vision and pattern recognition, (IEEE). pp. 2818–26.
46. Huang G, Liu Z, van der Maaten L, Weinberger KQ. (2017). Densely connected convolutional networks, in: Proceedings of the IEEE conference on computer vision and pattern recognition, (IEEE). pp. 4700–8.
47. Mirjalili S, Mirjalili SM, Lewis A. Grey wolf optimizer. Adv Eng software. (2014) 69:46–61. doi: 10.1016/j.advengsoft.2013.12.007.
48. Emary E, Zawbaa HM, Hassanien AE. Binary grey wolf optimization approaches for feature selection. Neurocomputing. (2016) 172:371–81. doi: 10.1016/j.neucom.2015.06.083.
49. Hegde RB, Prasad K, Hebbar H, Singh BMK, Sandhya I. Automated decision support system for detection of leukemia from peripheral blood smear images. J digital Imaging. (2020) 33:361–74. doi: 10.1007/s10278-019-00288-y.
Keywords: bio-inspired, CNN, transfer learning, leukemia classification, deep learning, metaheuristics optimization
Citation: Awais M, Abdal MN, Akram T, Alasiry A, Marzougui M and Masood A (2024) An efficient decision support system for leukemia identification utilizing nature-inspired deep feature optimization. Front. Oncol. 14:1328200. doi: 10.3389/fonc.2024.1328200
Received: 26 October 2023; Accepted: 25 January 2024;
Published: 05 March 2024.
Edited by:
Yuxiang Zhou, Mayo Clinic Arizona, United StatesReviewed by:
Bikash Kumar Paul, Mawlana Bhashani Science and Technology University, BangladeshJaya Lakshmi Thangaraj, University of California, San Diego, United States
Copyright © 2024 Awais, Abdal, Akram, Alasiry, Marzougui and Masood. This is an open-access article distributed under the terms of the Creative Commons Attribution License (CC BY). The use, distribution or reproduction in other forums is permitted, provided the original author(s) and the copyright owner(s) are credited and that the original publication in this journal is cited, in accordance with accepted academic practice. No use, distribution or reproduction is permitted which does not comply with these terms.
*Correspondence: Anum Masood, YW51bS5tYXNvb2RAbnRudS5ubw==; Muhammad Awais, bXVoYW1tYWRhd2Fpc0BjaWl0d2FoLmVkdS5waw==