
94% of researchers rate our articles as excellent or good
Learn more about the work of our research integrity team to safeguard the quality of each article we publish.
Find out more
SYSTEMATIC REVIEW article
Front. Oncol., 19 March 2024
Sec. Gastrointestinal Cancers: Gastric and Esophageal Cancers
Volume 14 - 2024 | https://doi.org/10.3389/fonc.2024.1267596
This article is part of the Research TopicNovel Biomarkers and Big Data-Based Biomedical Studies in Cancer Diagnosis and ManagementView all 21 articles
 Liangsen Liu1,2
 Hai Liao1
 Yang Zhao1
 Jiayu Yin1,3Chen Wang1Lixia Duan1Peihan Xie1Wupeng Wei4Meihai Xu3
 Danke Su1*
Objective: We aimed to evaluate the diagnostic effectiveness of computed tomography (CT)-based radiomics for predicting lymph node metastasis (LNM) in patients diagnosed with esophageal cancer (EC).
Methods: The present study conducted a comprehensive search by accessing the following databases: PubMed, Embase, Cochrane Library, and Web of Science, with the aim of identifying relevant studies published until July 10th, 2023. The diagnostic accuracy was summarized using the pooled sensitivity, specificity, positive likelihood ratio (PLR), negative likelihood ratio (NLR), diagnostic odds ratio (DOR), and area under the curve (AUC). The researchers utilized Spearman’s correlation coefficient for assessing the threshold effect, besides performing meta-regression and subgroup analysis for the exploration of possible heterogeneity sources. The quality assessment was conducted using the Quality Assessment of Diagnostic Accuracy Studies-2 and the Radiomics Quality Score (RQS).
Results: The meta-analysis included six studies conducted from 2018 to 2022, with 483 patients enrolled and LNM rates ranging from 27.2% to 59.4%. The pooled sensitivity, specificity, PLR, NLR, DOR, and AUC, along with their corresponding 95% CI, were 0.73 (0.67, 0.79), 0.76 (0.69, 0.83), 3.1 (2.3, 4.2), 0.35 (0.28, 0.44), 9 (6, 14), and 0.78 (0.74, 0.81), respectively. The results demonstrated the absence of significant heterogeneity in sensitivity, while significant heterogeneity was observed in specificity; no threshold effect was detected. The observed heterogeneity in the specificity was attributed to the sample size and CT-scan phases (P < 0.05). The included studies exhibited suboptimal quality, with RQS ranging from 14 to 16 out of 36. However, most of the enrolled studies exhibited a low-risk bias and minimal concerns relating to applicability.
Conclusion: The present meta-analysis indicated that CT-based radiomics demonstrated a favorable diagnostic performance in predicting LNM in EC. Nevertheless, additional high-quality, large-scale, and multicenter trials are warranted to corroborate these findings.
Systematic Review Registration: Open Science Framework platform at https://osf.io/5zcnd.
Esophageal cancer (EC), a prevalent and deadly neoplasm, has been identified as the seventh most commonly diagnosed cancer globally in 2020, with 604,000 new cases reported and the sixth leading cause of death, with 544,000 fatalities (1). Patients with EC are often diagnosed at advanced stages, making them unsuitable for surgery and leading to a poor prognosis with low 5-year survival rates of only 20%-30% (2–4). Lymph node metastasis (LNM) has been identified as a vital prognostic determinant for patient survival (5–7). The eighth edition of the AJCC’s International Staging Standard for Esophageal Cancer introduced a clinical staging system based on preoperative imaging; it incorporated the count of lymph node metastases in postoperative staging (8, 9). While pathological findings continue to be the gold standard for diagnosing LNM, lymph node biopsy represents an invasive procedure with a non-trivial incidence of complications (10). Therefore, accurate evaluation of lymph node status using non-invasive imaging methods is imperative for making informed treatment decisions and essential for precise prognostication.
The computed tomography (CT) scans is a widely used non-invasive imaging technique for acquiring preoperative and postoperative tumor-related data to assess lymph node status in EC patients (11). However, relying solely on morphological standards, including short diameter and shape measured by physicians with varying levels of clinical diagnostic expertise, conventional CT scans are inadequate for accurately identifying LNM. The accuracy of conventional CT scans for precise detection is suboptimal, with sensitivity ranging from 37.3% to 67.2% and specificity ranging from 63.9% to 96.4% (12). Furthermore, these criteria have limitations culminating in a markedly low diagnostic accuracy for normal-sized lymph nodes. Consequently, conventional evaluation of lymph node status through CT scans remains challenging.
Radiomics is an innovative technique that swiftly extracts numerous quantitative features from conventional medical images using high-throughput computation, yielding invaluable information for diagnostic and prognostic purposes (13–15). In recent years, radiomics has been extensively employed in detecting, grading, assessing the therapeutic response, and prognostic evaluation for patients with EC (16–20). CT-based radiomics have been utilized to predict LNM in patients with EC (11, 21–23). These findings suggest that this approach has great potential as an accurate and reproducible tool for non-invasive preoperative evaluation of LNM. Radiomics techniques offer a promising solution that overcomes some of the limitations of conventional CT imaging. However, owing to variations in imaging protocols, study design, sample size, modeling techniques, and software used for radiomics analysis across various studies on EC, the reported diagnostic efficacy of radiomics in preoperative identification of LNM has demonstrated significant variability. These inconsistencies have led to uncertainty regarding the effectiveness of using radiomics for this purpose in clinical practice. Therefore, we aimed to conduct a comprehensive meta-analysis that thoroughly assesses the diagnostic accuracy of CT-based radiomics in predicting LNM in individuals diagnosed with EC.
This study followed the guidelines of Preferred Reporting Items for Systematic Reviews and Meta-Analyses (PRISMA) (24). The protocol for this review has been registered on the Open Science Framework (OSF) platform, with the registration link available at https://osf.io/5zcnd.
In attempting to comprehensively identify all studies that may be related to our question, an independent search was conducted by two authors (L.S.L. and Y.Z.) in four databases, namely PubMed, Embase, Web of Science, and Cochrane Library, which was limited to studies published until July 10th, 2023. Various keywords, including “artificial intelligence,” “machine learning,” “radiomics,” “deep learning,” “esophageal neoplasms,” “esophageal cancer,” “lymph node metastasis,” “lymph node,” and “LNM” were used for the search. MeSH terms and variations of each keyword were utilized during the search to ensure inclusivity. Any disagreements during the literature selection process were resolved through discussion and consensus among the research team, with the assistance of a designated third-party reviewer (H.L.).
The selected studies had to meet specific criteria: (1) original research studies with sample sizes greater than 40; (2) histopathological diagnosis of EC and LNM; (3) LNM detected using CT-based radiomics, and (4) data sufficient for reconstructing 2×2 contingency table, aiming at determining diagnostic sensitivity and specificity. Meanwhile, the criteria used to exclude ineligible studies were: (1) reviews, case reports, consensus statements, guidelines, animal studies, letters, and editorials, and (2) multiple studies using the same study population (in such cases, the most recent or comprehensive report was also included).
The quality assessment and data extraction were independently evaluated by two reviewers, L.S.L. and Y.Z. Any disagreements were resolved by the third reviewer, H.L. Four domains of the Quality Assessment of Diagnostic Accuracy Studies-2 (QUADAS-2) were customized to evaluate the potential bias in the selected studies, including patient selection, index testing, reference standards, and flow and timing (25). The researchers utilized the Radiomics Quality Score (RQS) to evaluate the methodological quality of the included studies. The RQS comprises five components: imaging protocol, feature extraction from radiological images, data modeling, model validation, and data sharing (13). Additional details can be found in the Supplementary Table S1. The concordance between the two primary reviewers was determined through the calculation of the intra-class correlation coefficient (ICC). The ICC values were classified as excellent (≥ 0.85), good (0.70–0.84), moderate (0.55–0.69), and weak or poor (≤ 0.54) (26).
All pertinent data was acquired from the entirety of the incorporated full-text articles. The information that was obtained through extraction were: first author, publication year, country, study type, total number of patients and LNM cases, CT machine type, segmentation details, feature selection method, algorithms, information about radiomics and deep learning, data source (single or multiple institutions), sensitivity, and specificity. The researchers calculated the numbers of true positive/negative and false positive/negative cases using the reported sensitivity, specificity, LNM-present, and LNM-absent values in each study. If a single study presented multiple models derived from the same patient cohort, only the model demonstrating superior diagnostic accuracy in the validation cohort (or the training cohort if a validation cohort was unavailable) was considered for inclusion in this meta-analysis (27).
Stata 16.0, Meta-Disc 1.4, and Review Manager 5.3 were employed for statistical analysis of meta-analysis. Diagnostic accuracy was evaluated by pooling sensitivity, specificity, positive likelihood ratio (PLR), negative likelihood ratio (NLR), and diagnostic odds ratio (DOR) with their respective 95% CI. The summary receiver operating characteristic curve (SROC) and its corresponding area under the curve (AUC) were used to summarize the findings. Heterogeneity assessment of the studies incorporated in the analysis was performed through Cochran’s Q-test and Higgins’ I2 test. A P < 0.05 (Cochran’s Q-test) or a Higgins’ I2 value >50% indicated significant heterogeneity between the studies (28). Sensitivity analysis were conducted by systematically eliminating individual studies from the meta-analysis calculations to evaluate their influence on the overall estimation. Deeks’ test assessed the publication bias by analyzing the effective sample size funnel plot (29).
The study employed Fagan plot analysis for assessing the clinical effectiveness of CT-based radiomics in predicting LNM. This method calculated the LNM post-test probability (P-post) based on the pre-test probabilities (P-pre), signifying a suspicion of LNM (30).
By using the aforementioned search strategy, 163 studies were initially identified; only 96 remained after duplicate removal. After reviewing the titles and abstracts, only 24 studies were deemed eligible for further analysis and potential inclusion. After carefully reading the full-text articles, six studies (21, 31–35) were considered eligible for inclusion. In contrast, seven were excluded due to insufficient data, and eleven did not meet the intended purpose of investigating radiomics for predicting LNM (Figure 1).
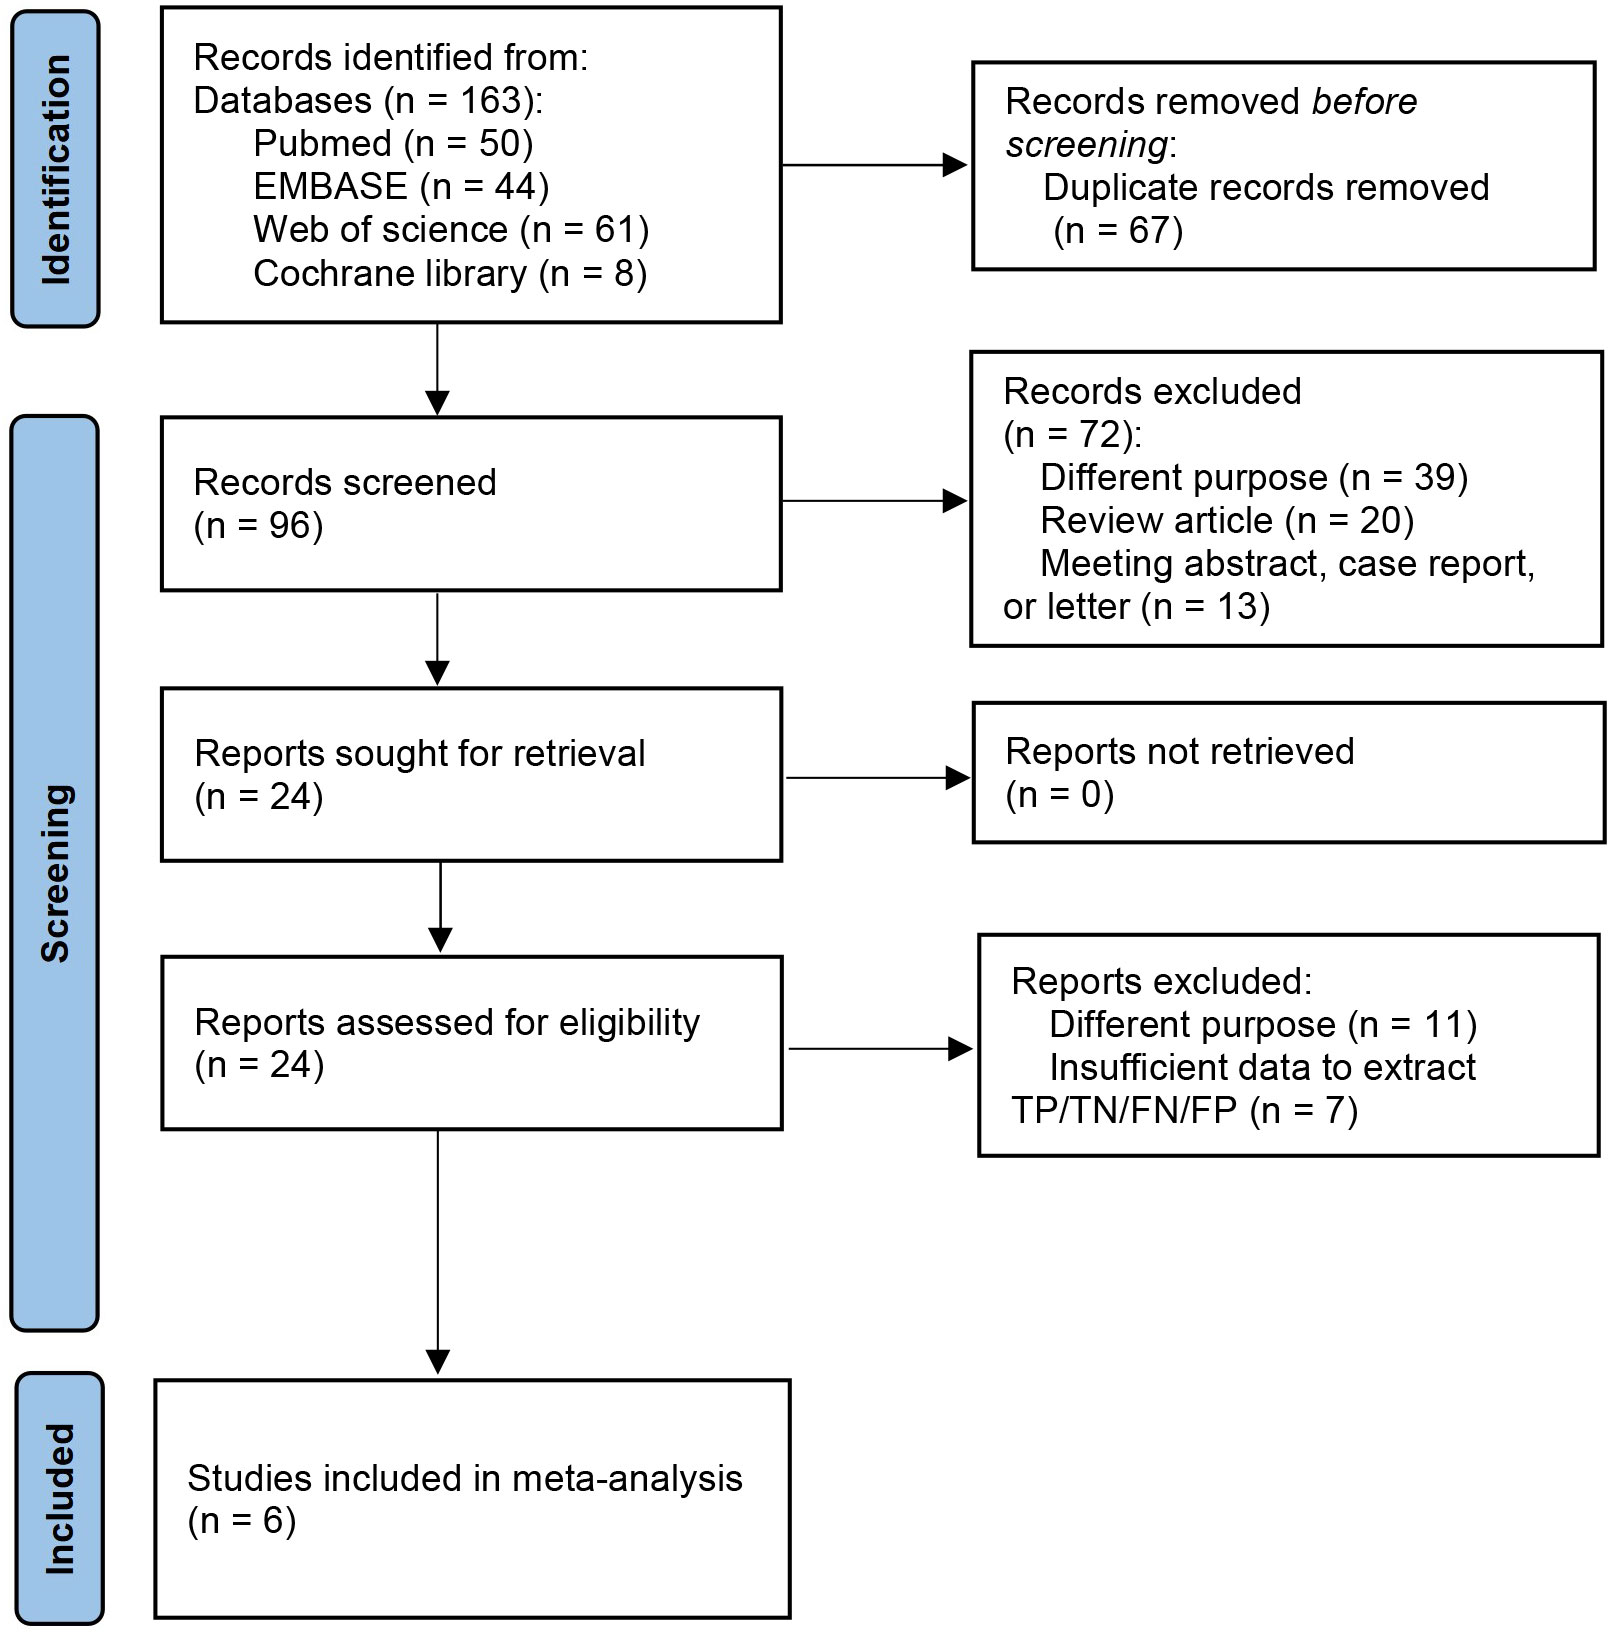
Figure 1 Flow diagram of study selection for meta-analysis according to PRISMA.
Table 1 lists an overview of the six enrolled studies spanning from 2018 to 2022. A total of 483 patients were enrolled, with LNM rates varying between 27.2% to 59.4%. The included studies were conducted retrospectively and exclusively in China. Additionally, all the studies were based on single-center data. Three studies focused on esophageal squamous cell carcinoma, while the remaining three did not specify the cancer subtype. Manual segmentation was utilized for radiomics analysis in all the studies. Furthermore, only one study combined feature extraction with deep learning methods, while the other five exclusively relied on radiomics. The feature selection methods employed in radiomics analysis included the least absolute shrinkage and selection operator (LASSO), t-test, analysis of variance, and ridge regression. In terms of the radiomics diagnostic model developed using machine learning algorithms, logistic regression (LR) was used in four studies, while random forest (RF) and support vector machine (SVM) were used in one study each.
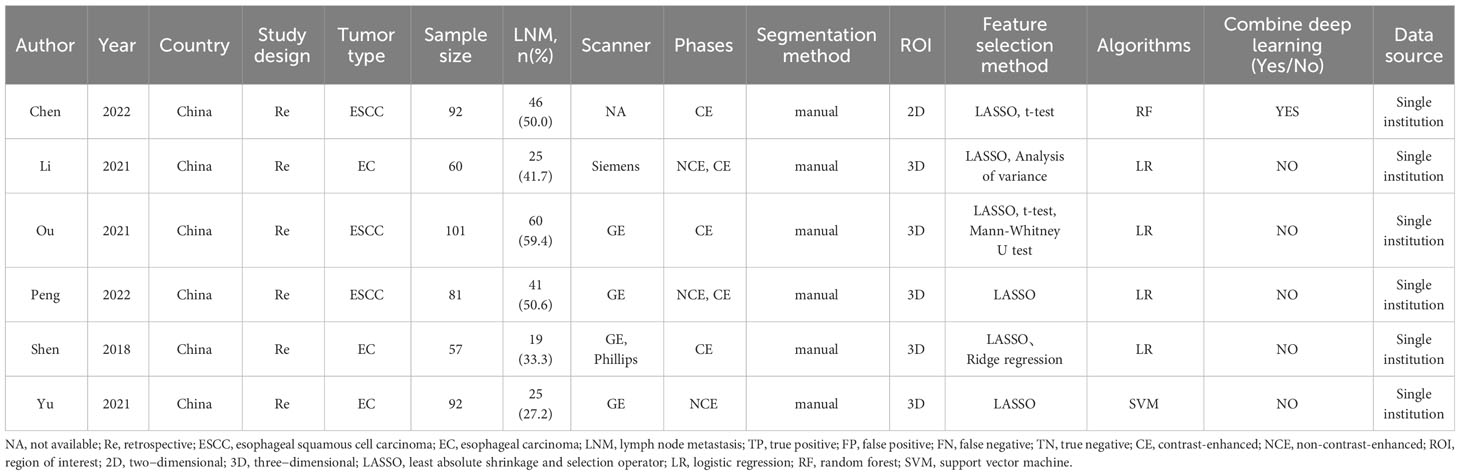
Table 1 Key characteristics of included studies in the meta-analysis.
The detailed assessments of RQS and QUADAS-2 for each study are provided in Supplementary Tables S2 and S3. The agreement between primary reviewers was excellent, with ICC values of 0.94 (95% CI 0.64-0.99) for RQS and 0.92 (95% CI 0.56-0.99) for QUADAS-2. The RQS varied between 14 and 16 across studies, with two studies (33, 34) achieving the highest RQS percentage at 44.4%. However, all the selected studies lacked the use of phantoms to evaluate robustness, prospective research design, discussion of potential biological correlates, or comprehensive cost-effectiveness analysis. The qualitative assessment using the QUADAS-2 tool indicated that most studies had a low risk of bias and minimal concerns regarding their applicability (Figure 2). Deeks’ funnel plot analysis revealed no evidence of publication bias, suggesting a low risk of bias among the included studies. (Figure 3; P = 0.78).
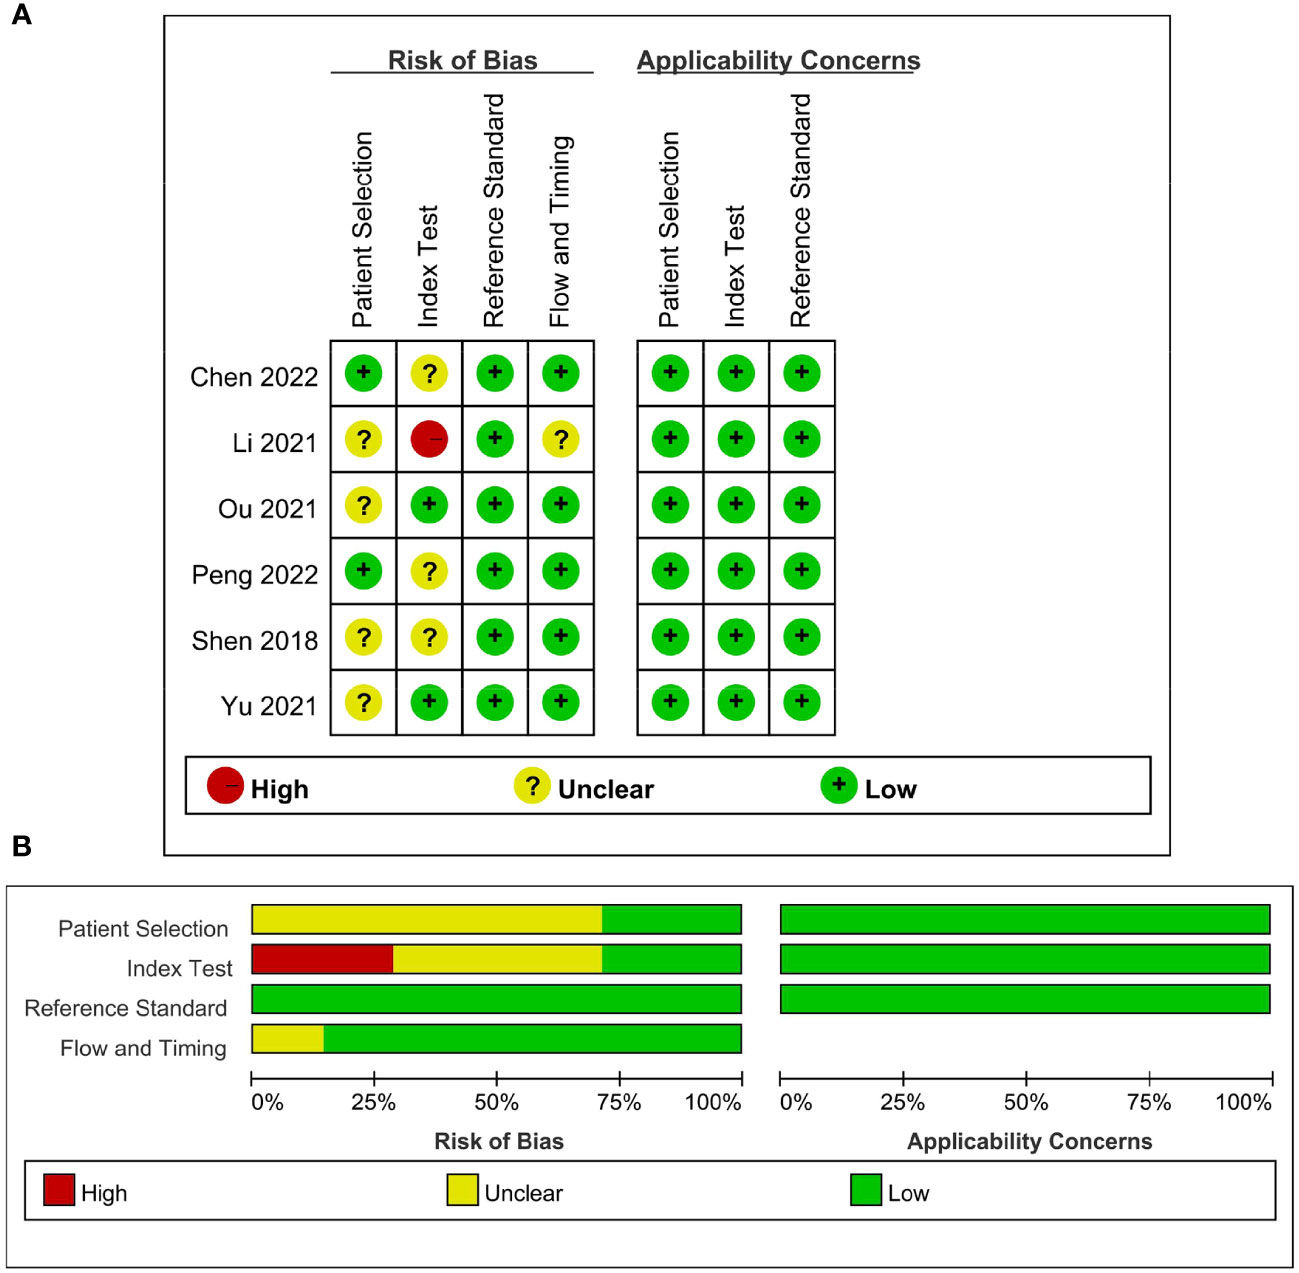
Figure 2 Quality assessment of included studies according to Quality Assessment of Diagnostic Accuracy Studies-2 (QUADAS-2) criteria. (A) Individual studies, (B) summary.
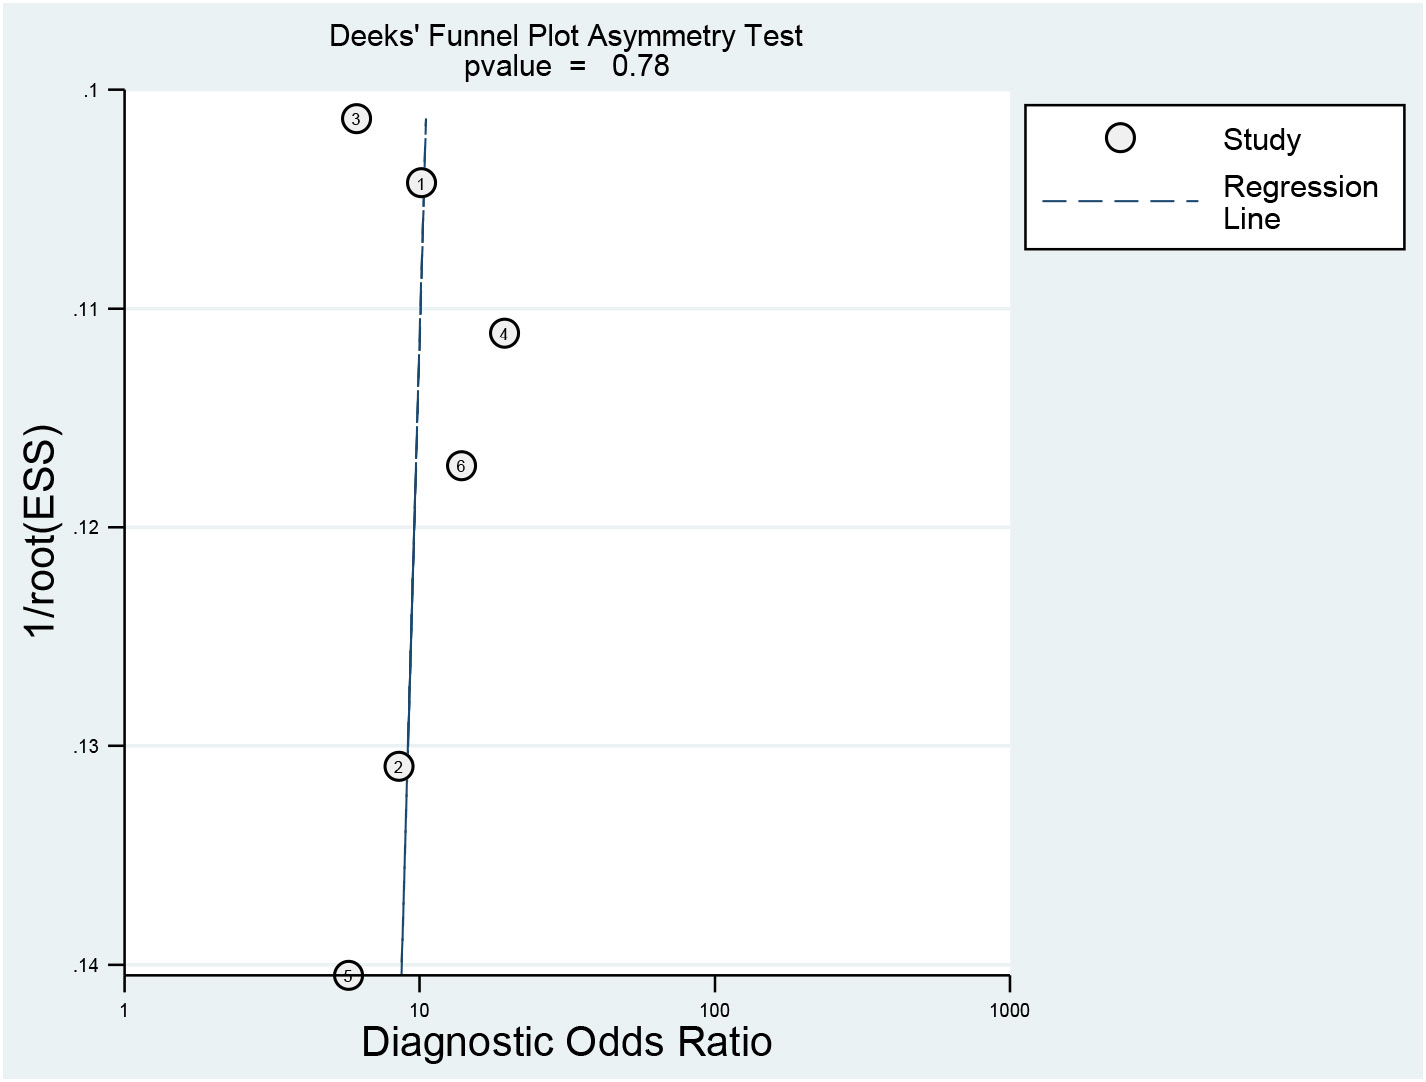
Figure 3 Deeks’ funnel plot asymmetry test for publication bias.
Across all six selected studies, the pooled sensitivity and specificity (as displayed by the forest plots in Figure 4) for the CT-based radiomics in evaluating LNM in EC were determined to be 0.73 (95% CI, 0.67-0.79) and 0.76 (95% CI, 0.69-0.83), respectively. The PLR, NLR, and DOR were found to be 3.1 (95% CI, 2.3-4.2), 0.35 (95% CI, 0.28-0.44), and 9 (95% CI, 6-14), respectively. Furthermore, the SROC analysis yielded an AUC of 0.78 (95% CI, 0.74-0.81), indicating significant overall diagnostic efficacy (Figure 5).
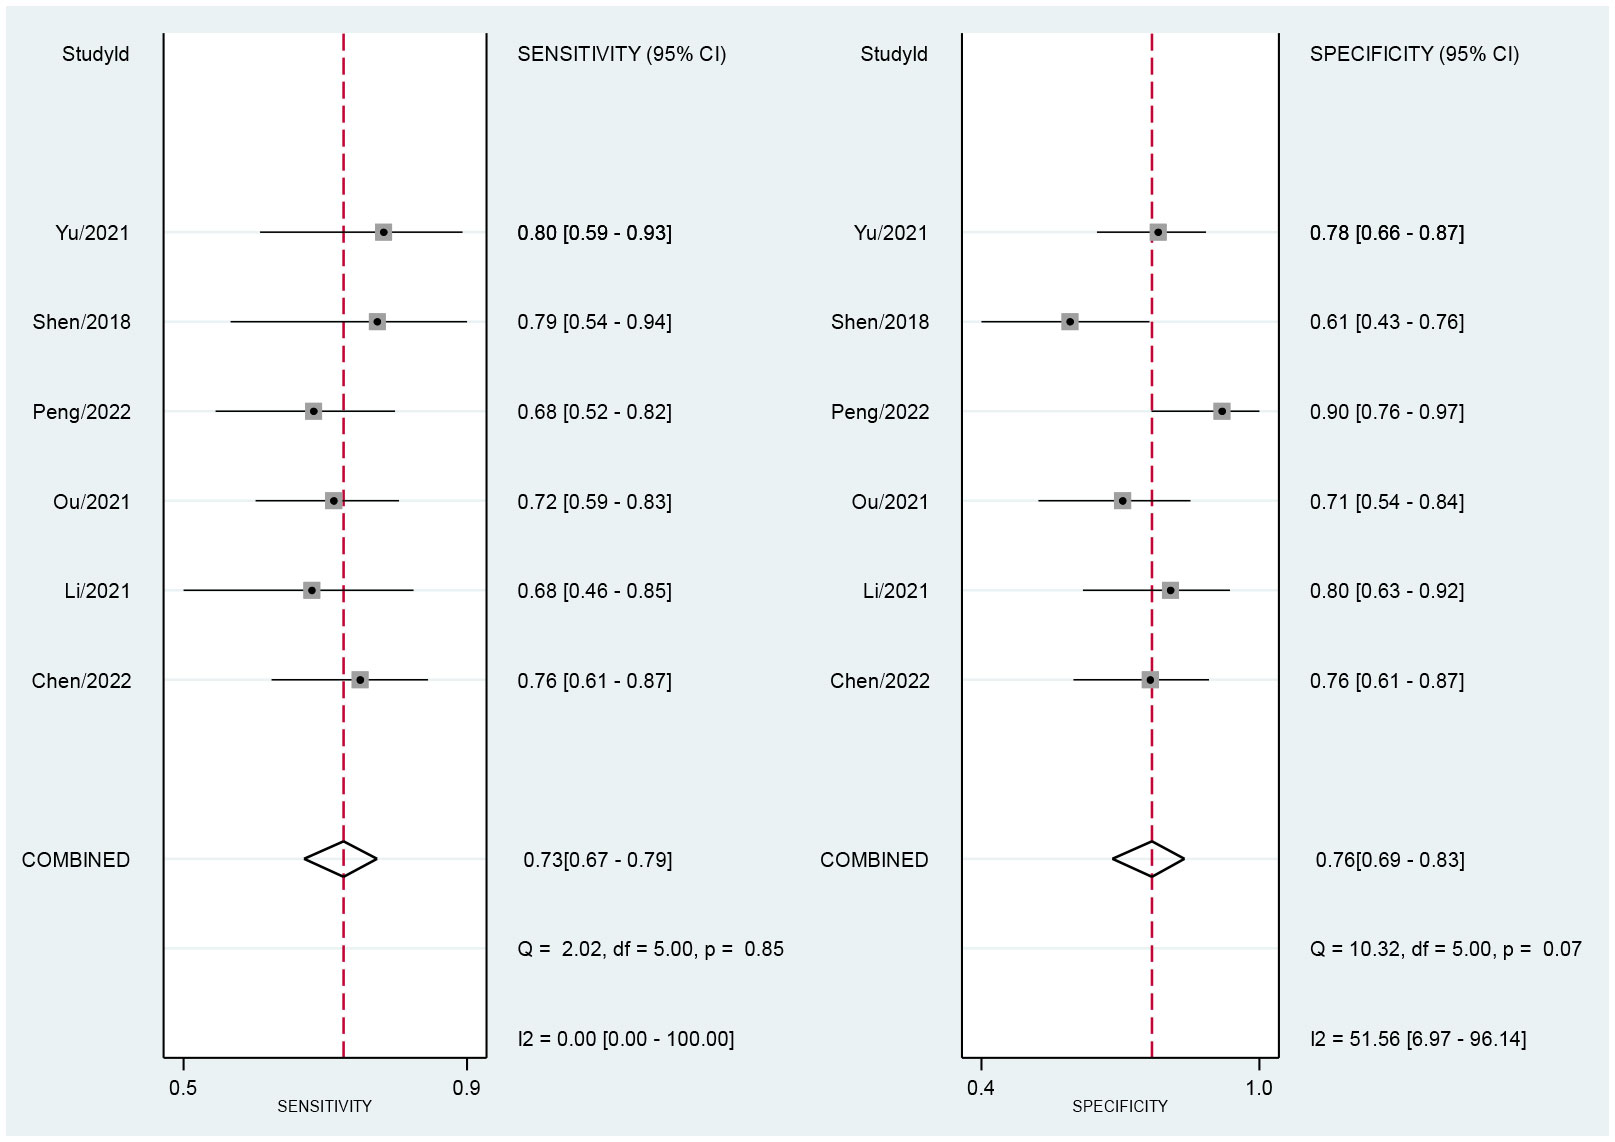
Figure 4 Forest plot of sensitivity and specificity based on radiomics for predicting LNM in esophageal carcinoma.
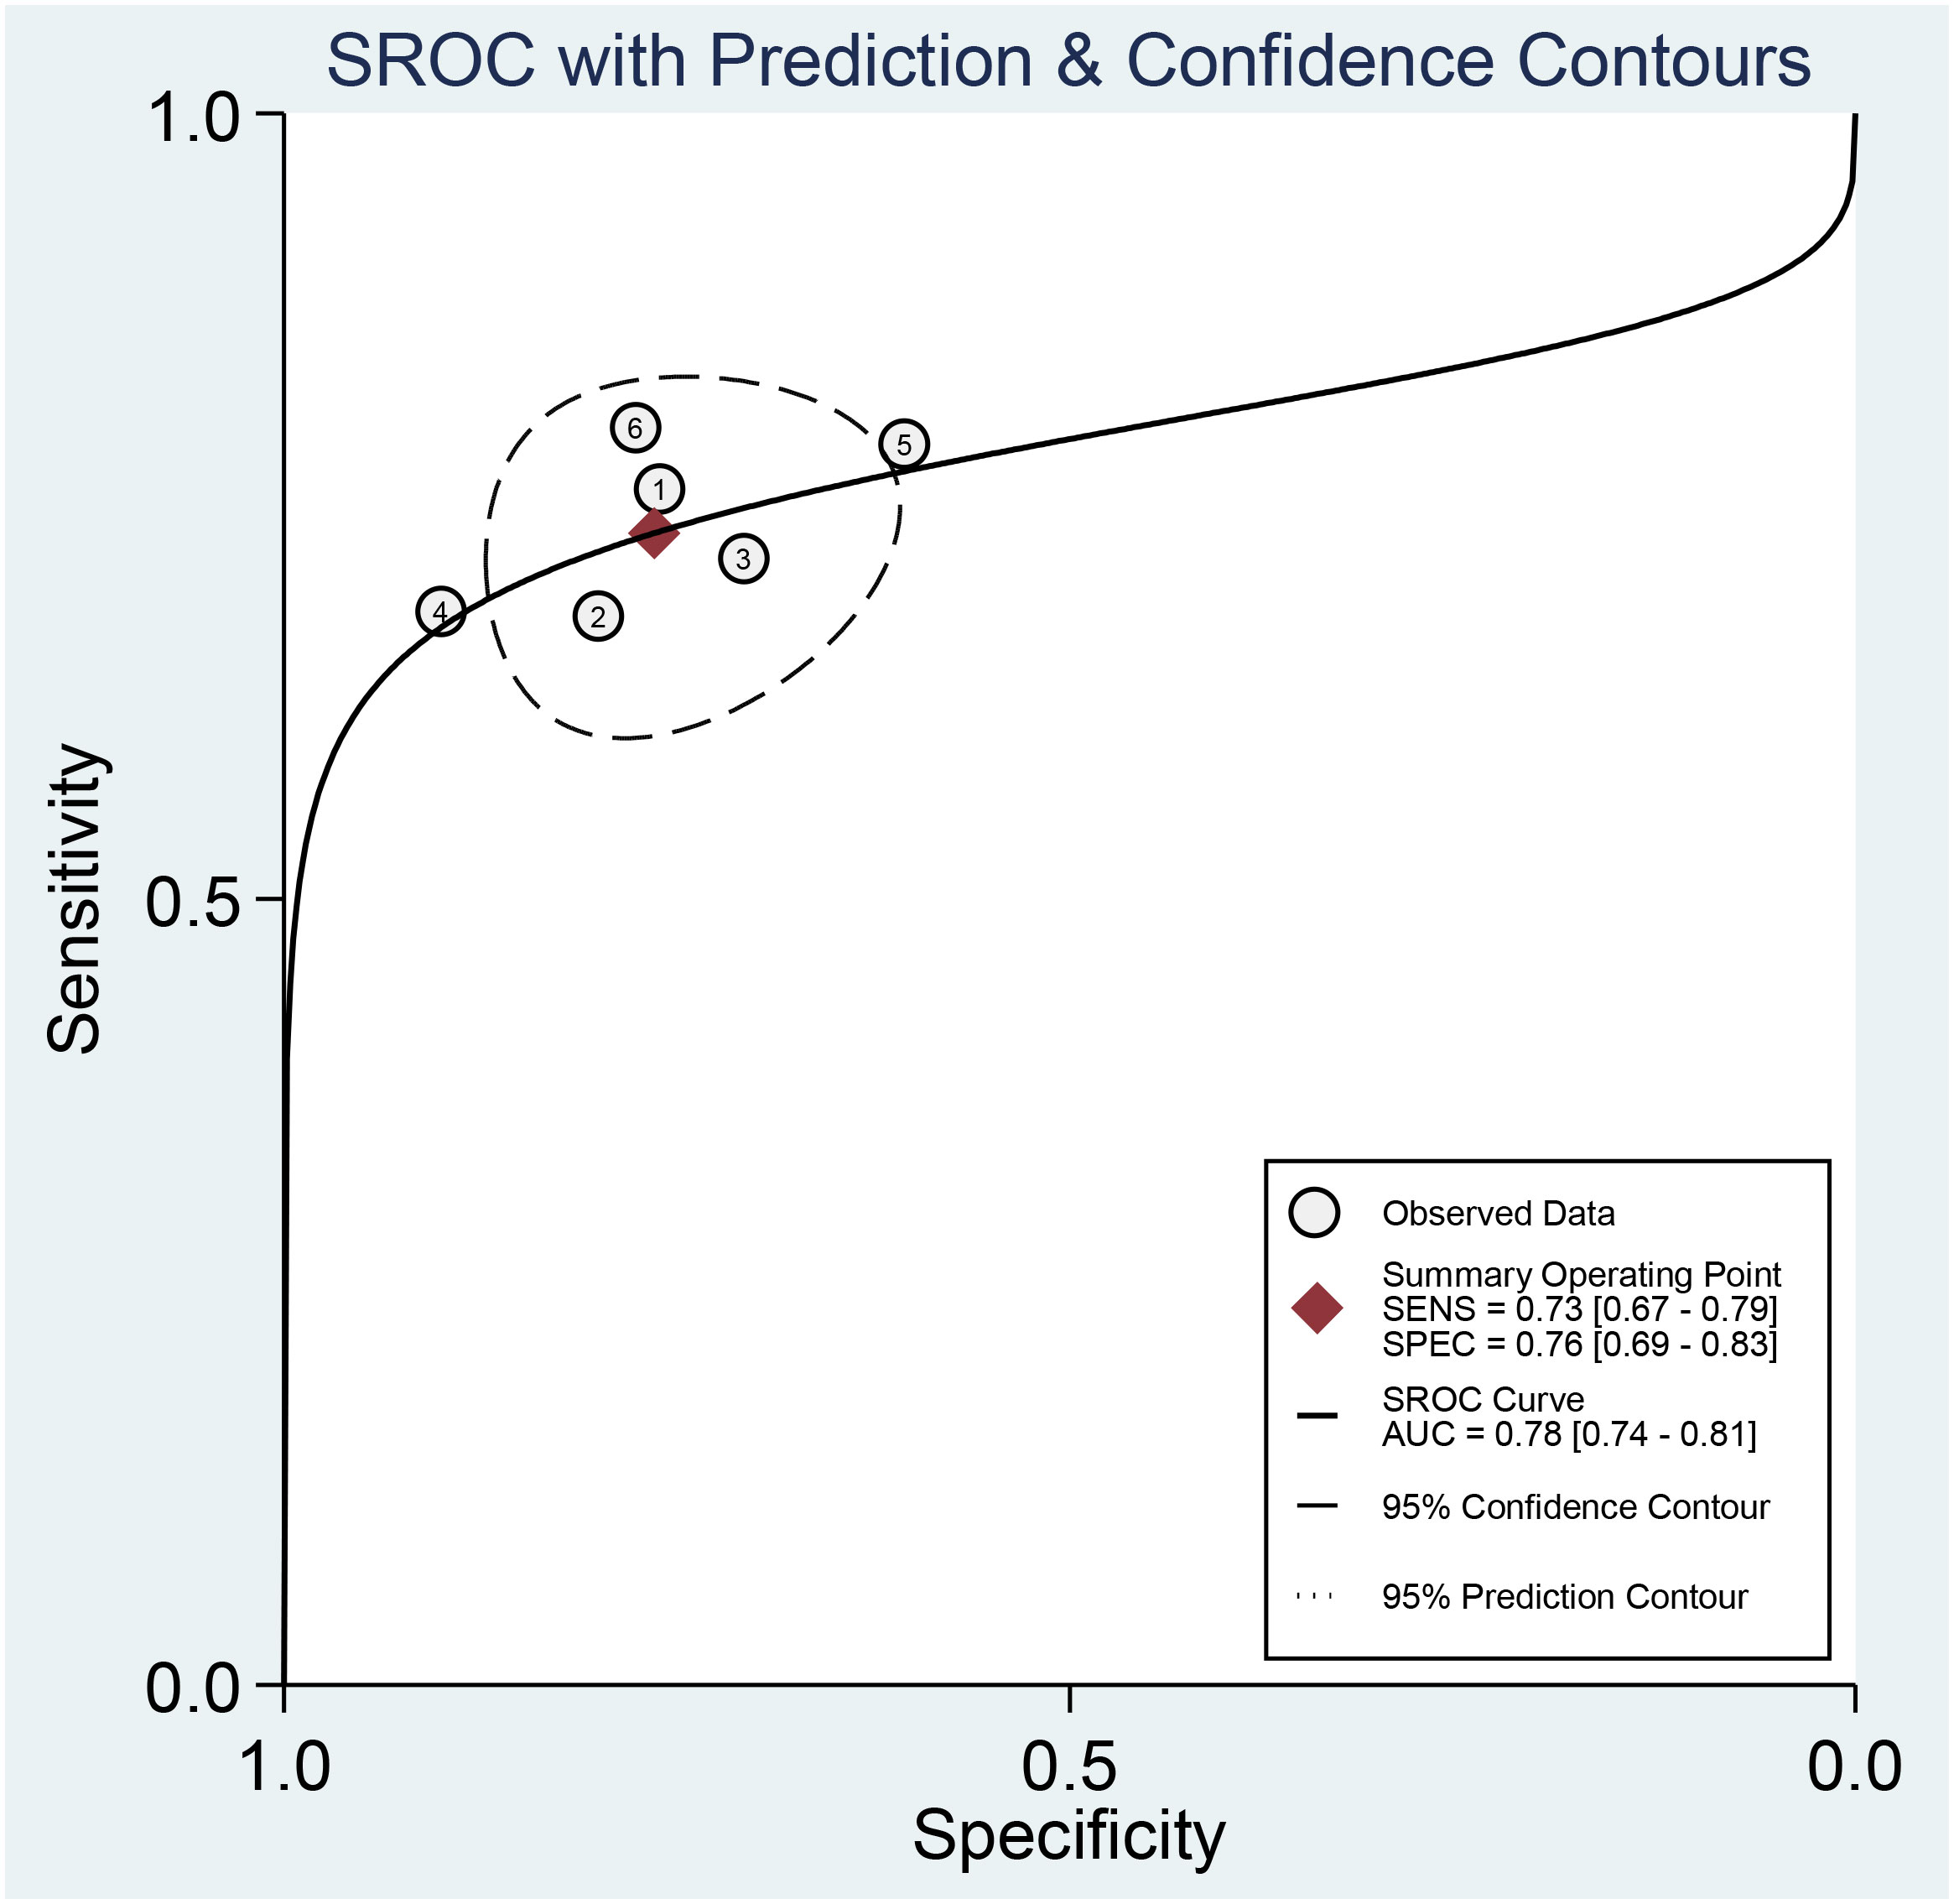
Figure 5 Summary receiver operating characteristic curves (SROC) based on radiomics for predicting LNM in esophageal carcinoma.
Figure 4 presents the forest plot, which indicates no significant heterogeneity among the studies included in the research when considering sensitivity (P=0.85; I2 = 0). However, specificity exhibited a significant heterogeneity (P=0.07) with a moderate level of heterogeneity indicated by an I2 value of 51.56% (95% CI, 6.97%-96.14%). The Spearman’s correlation coefficient was 0.543, with a non-significant P-value of 0.266, suggesting the absence of a threshold effect.
The sources of heterogeneity were identified through the application of univariate meta-regression analysis. Table 2 presents the results of both subgroup analysis and univariate meta-regression, revealing that several categories, including tumor type, LNM ratio, feature selection method, and algorithms, significantly contributed to the heterogeneity observed in the pooled sensitivity (P < 0.05). Moreover, the sample size and CT-scan phases used were identified as contributors to the heterogeneity in specificity analysis (P < 0.05). The forest plot is presented in Supplementary Figure S1.
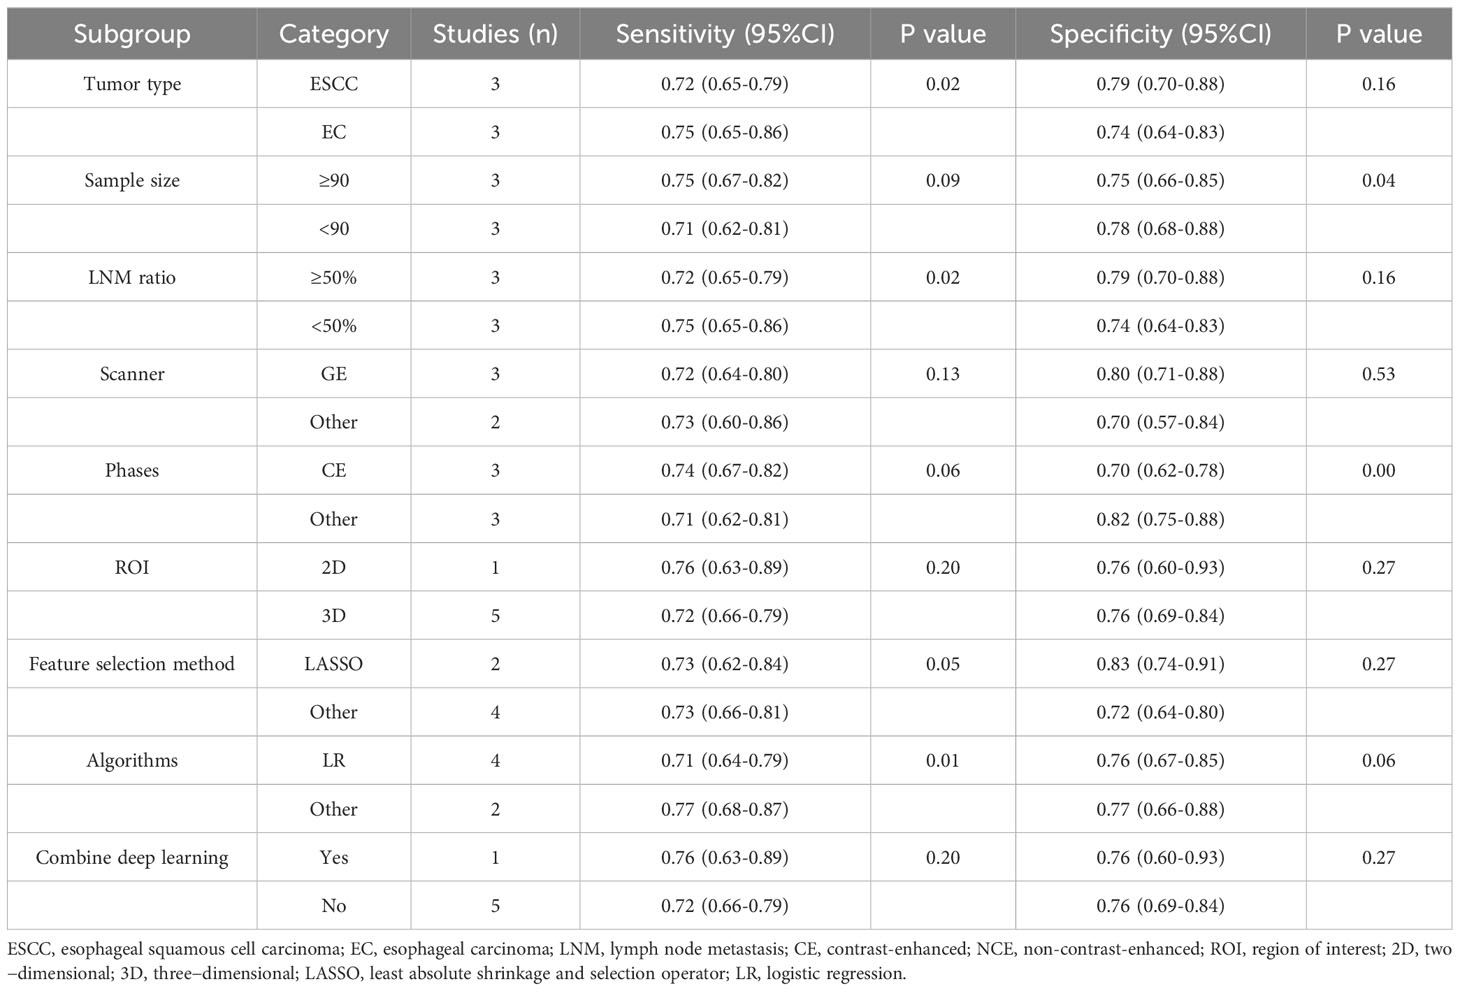
Table 2 Results of univariate meta-regression and subgroup analyses.
Studies on esophageal squamous cell carcinoma (n=3) demonstrated equivalent sensitivity (72%, 95% CI, 65-79 vs. 75%; 95% CI, 65-86) and higher specificity (79%, 95% CI, 70-88 vs. 74%; 95% CI, 64-83) compared to studies on esophageal carcinoma (n=3). Studies with ≥90 patients (n=3) showed equivalent sensitivity (75%, 95% CI 67-82 vs. 71%, 95% CI 62-81) and specificity (75%, 95% CI 66-85 vs. 78%, 95% CI 68-88) compared to studies with <90 patients (n=3). Studies with an LNM ratio ≥50% (n=3) had equivalent sensitivity (72%, 95% CI, 65-79 vs. 75%; 95% CI, 65-86) and higher specificity (79%, 95% CI, 70-88 vs. 74%; 95% CI, 64-83) when compared to studies with an LNM ratio of <50% (n=3).
Three studies using only General Electric(GE) equipment showed similar sensitivity (72%, 95% CI, 64-80 vs. 73%, 95% CI, 60-86) and higher specificity (80%, 95% CI, 71-88 vs. 70%, 95% CI, 57-84) to two studies using other equipment. Three studies using contrast-enhanced CT only had equivalent sensitivity (74%, 95% CI, 67-82 vs. 71%; 95% CI, 62-81) and lower specificity (70%, 95% CI, 62-78 vs. 82%; 95% CI, 75-88) than three studies using other methods. In terms of ROI selection, only one study using the 2D method showed similar sensitivity (76%, 95% CI, 63-89 vs. 72%, 95% CI, 66-79) and specificity (76%, 95% CI, 60-93 vs. 76%, 95% CI, 69-84) compared to five studies that employed the 3D method. Two studies using the LASSO method had similar sensitivity (73%, 95% CI, 62-84 vs. 73%, 95% CI, 66-81) and higher specificity (83%, 95% CI, 74-91 vs. 72%, 95% CI, 64-80) compared to four other studies using different methods. Studies (n=4) utilizing LR for their model had lower sensitivity (71%, 95% CI, 64-79 vs. 77%, 95% CI, 68-87) and equivalent specificity (76%, 95% CI, 67-85 vs. 77%, 95% CI, 66-88) compared to studies (n=2) using different algorithms. A study that combined deep learning features (n=1) showed similar sensitivity (76%, 95% CI, 63-89 vs. 72%, 95% CI, 66-79) and specificity (76%, 95% CI, 60-93 vs. 76%, 95% CI, 69-84), when compared to studies solely utilizing radiomics (n=5).
Supplementary Table S1 lists the sensitivity analysis results for each of the six chosen studies. Our findings demonstrated the robustness of results as no significant changes were observed when excluding each study individually; this suggested that any particular study did not significantly influence the overall outcome.
A CT-based radiomics model can substantially increase the P-post from 20% to 44% with a PLR of 3 for positive pre-tests. Conversely, it can decrease the P-post to 8% with an NLR of 0.35 for negative pre-tests (Figure 6). This section may be divided by subheadings. It should provide a concise and precise description of the experimental results, their interpretation, as well as the experimental conclusions that can be drawn.
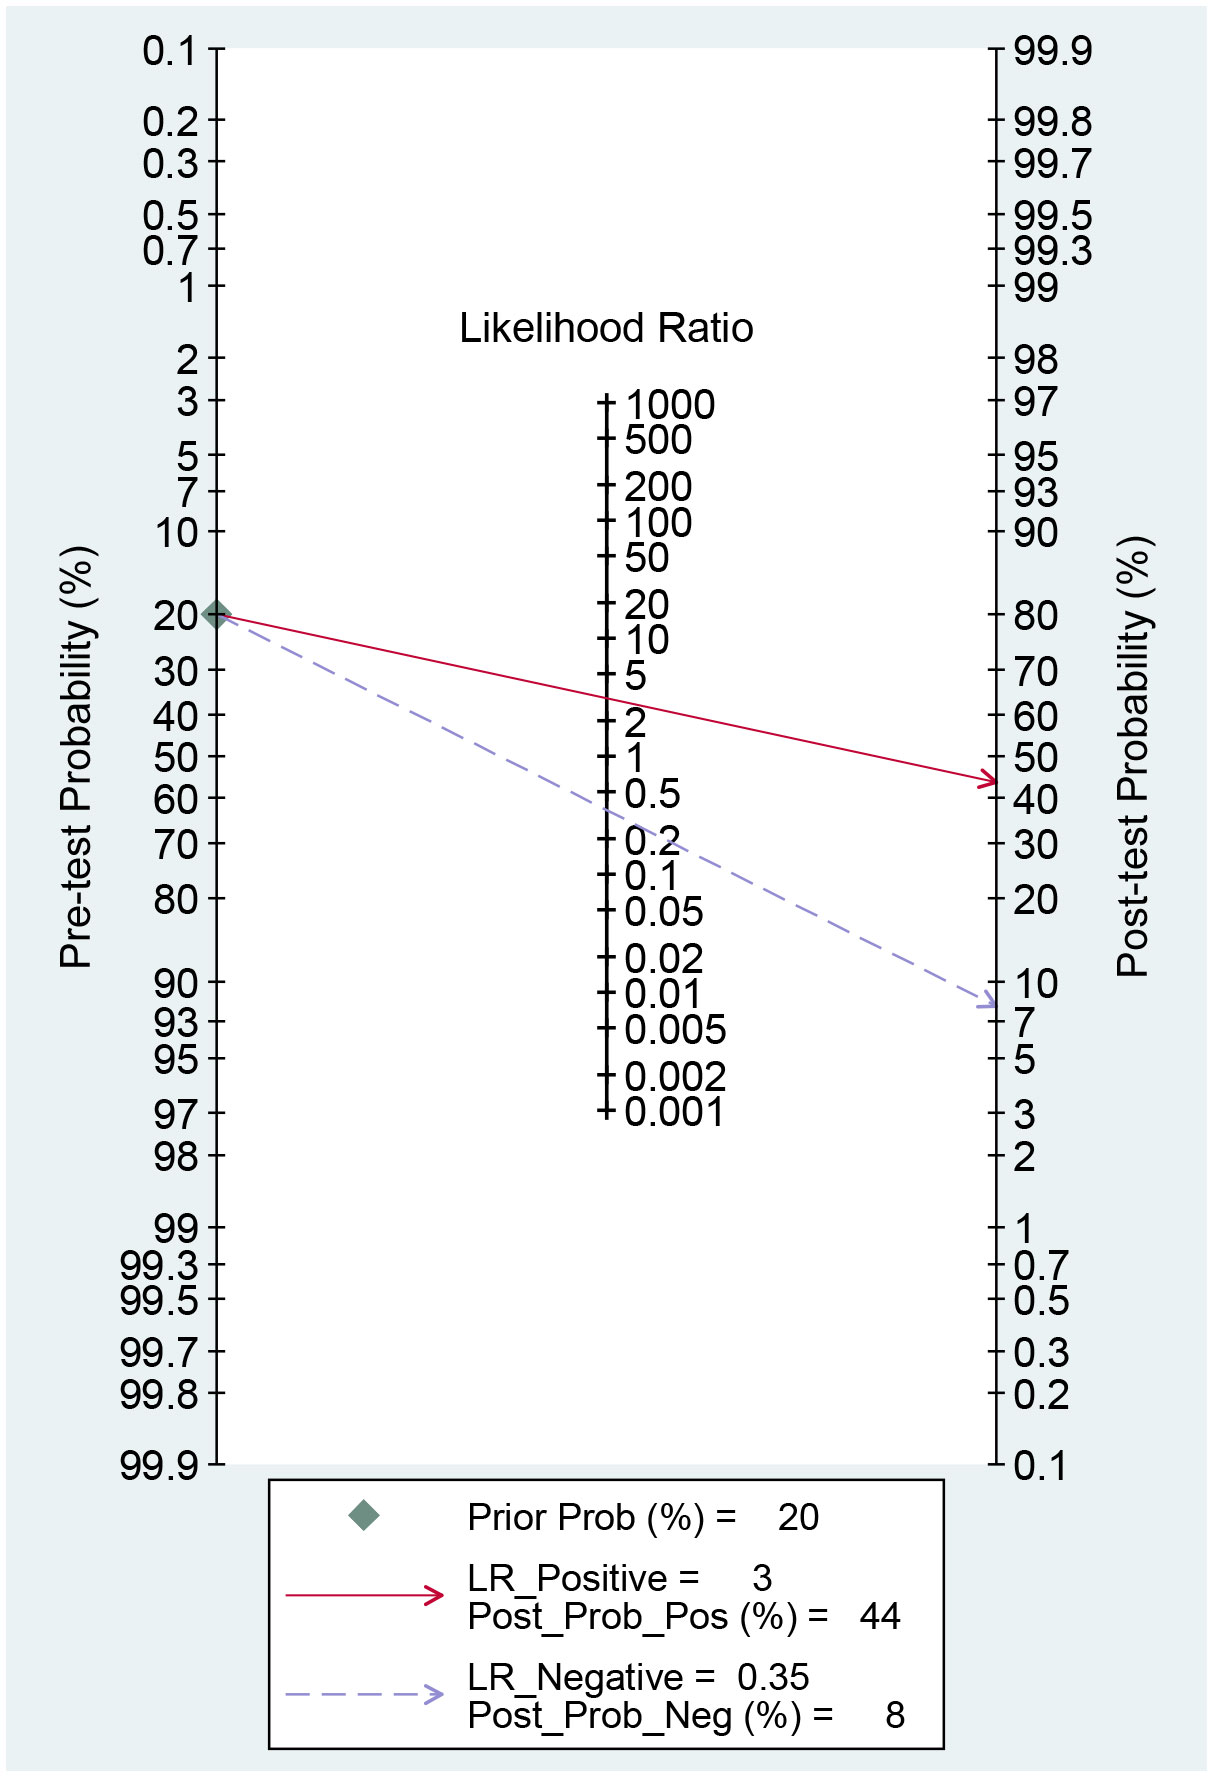
Figure 6 Fagan plots for assessing clinical utility.
According to our current awareness, this study represented the first systematic review and meta-analysis investigating the efficacy of CT-based radiomics in assessing LNM among patients diagnosed with EC. Our findings demonstrated that the pooled sensitivity, specificity, and AUC for CT-based radiomics were 0.73 (95% CI, 0.67-0.79), 0.76 (95% CI, 0.69-0.83), and 0.78 (95% CI, 0.74-0.81), respectively, showcasing its significantly effective performance. The good sensitivity was crucial for accurately identifying most patients with LNM, thus reducing the chances of missed diagnoses. Furthermore, the high specificity was key in lowering false-positive rates, offering a reliable way to rule out LNM in patients and helping clinicians avoid unnecessary treatments and their potential complications. The inclusion of positive and negative likelihood ratios (PLR and NLR) of 3.1 and 0.35, respectively, further improved the diagnostic utility of CT-based radiomics. A PLR of 3.1 meant that patients with LNM were over three times more likely to have a positive test result than those without, greatly increasing the accuracy of identifying affected individuals. On the other hand, an NLR of 0.35 indicated that a negative result significantly reduced the chance of LNM by 65%, lowering the risk of false negatives. These ratios adjusted the post-test probability based on the initial probability, with a positive test increasing the probability from 20% to 44%, and a negative test decreasing it to about 8%. Such adjustments significantly changed how test results were interpreted clinically, boosting the predictive accuracy. Therefore, our study validated the precision and effectiveness of CT-based radiomics in predicting LNM in EC, facilitating personalized treatment plans. By precisely detecting LNM and improving cancer staging, it facilitated more personalized care, optimizing treatment for high-risk patients while avoiding unnecessary interventions for others.
A moderate degree of heterogeneity in terms of specificity was indicated by the meta-analysis of the studies included, which is worth noting. To determine the possible sources of heterogeneity, a univariate meta-regression analysis and subgroup analysis were conducted, as the Spearman’s correlation coefficient test revealed that heterogeneity was not associated with threshold effects. The results suggested that the heterogeneity in specificity could be attributed to the utilization of different CT scan phases and variations in sample size. However, upon conducting a subgroup analysis, it was observed that the sensitivity and specificity were not significantly affected by these factors. It is important to acknowledge that due to the variations in methodologies employed among the included studies, it was challenging to identify all the factors contributing to the observed heterogeneity. Interestingly, while there was no heterogeneity in the pooled sensitivity across all studies, several subgroups showed significant results (P < 0.05) in the univariate meta-regression analysis. Therefore, further research with methodological standardization is necessary to improve accuracy, eliminate heterogeneity, and provide more robust evidence for using CT-based radiomics in predicting LNM in patients with EC.
LASSO regression is widely used for feature selection and dimensionality reduction, aiming to reduce the number of features and eliminate irrelevant ones (36, 37). In the subgroup analysis of this study, using LASSO alone for dimensionality reduction resulted in slightly higher specificity than combining it with other methods. This observation may be attributed to the distribution of data features and the division of subgroups. Most studies on radiomics diagnostic models used LR due to the binary nature of LNM status. Nevertheless, studies utilizing other algorithms, including SVM and RF, showed higher sensitivity rates than those using LR. Additionally, previous studies have shown that neural network models or RF based on clinical features could more effectively predict LNM than traditional LR, exhibiting higher AUC, specificity, positive predictive value, and accuracy (38, 39). Regrettably, owing to limited available literature, only one article each for SVM and RF was retrieved, making it difficult to draw reliable conclusions regarding the comparison between SVM or RF and LR.
Image segmentation is a pivotal element of radiomic analysis, incorporating manual delineation using 2D or 3D images, as well as semi-automatic and fully automatic techniques. However, a universally accepted standard for tumor segmentation remains elusive (40). Although manual segmentation offers high precision, it is labor-intensive, subjective, and lacks standardization, leading to limited reproducibility and elevated time and labor expenses. Semi-automatic segmentation necessitates manual refinement, whereas automatic segmentation employs sophisticated computer algorithms for efficient and reproducible lesion boundary identification (41, 42). However, it’s crucial to mention that the studies incorporated in this research exclusively used manual delineation for image segmentation. Moreover, only one study in this meta-analysis employed the 2D method, and the subgroup analysis did not reveal a significant difference in sensitivity and specificity between the 2D and 3D methods. Nonetheless, the majority of previous studies have recognized that radiomics-based 3D imaging traits offer a wider and more diverse range of specific information, covering the entire tumor volume and providing a more comprehensive and accurate representation of its shape, size, and texture. Furthermore, 3D segmentation enhances reproducibility by reducing interobserver variability and offers a standardized approach to tumor delineation (43, 44). Hence, future research could concentrate on investigating the advantages and limitations of manual, semi-automatic, and fully automatic delineation in both 2D and 3D methods in radiomics-based imaging analysis, with the goal of determining the most suitable imaging technique for specific clinical situations and enhancing the accuracy and reproducibility of radiomics-based tumor characterization.
Previous studies have highlighted the potential impact of variations in manufacturers and devices on the reproducibility of radiomics features, which could affect the precision of image diagnosis (13, 45). Similarly, the subgroup analysis results of this study revealed that radiomics features derived from distinct CT devices had an impact on the pooled specificity. Nonetheless, it is important to interpret these results cautiously, considering the limited number of studies included in the meta-analysis and the potential for bias due to the small sample size. Multicenter studies can validate the generalization ability of radiomics models by overcoming data differences across regions and devices, thereby improving the stability and reliability of the model (46). However, it is worth noting that all the studies included in this analysis were conducted in the same geographical region, China, which introduces a potential geographical bias. To gain a deeper understanding of the value of radiomics in diagnosing LNM in EC, further analysis is required through more prospective, multi-regional, and high-quality studies.
To assess the robustness of our study, we conducted a sensitivity analysis by sequentially removing one literature source at a time. The results showed no significant changes in the combined DOR after each exclusion, indicating that individual studies did not significantly influence our meta-analysis and that the conclusions were stable and reliable. Moreover, the lack of publication bias, as evidenced by Deeks’ funnel plot, further supports the credibility of our findings.
To bolster the robustness and reproducibility of radiomics methodologies, Lambin et al. introduced the RQS guidelines in 2017 (13), aiming to establish a benchmark for quality in radiomics research. However, the absence of standardized quality thresholds remained a notable gap. In response, Wesdorp et al. (47) suggested adopting a 30% cut-off score to enhance clarity and consistency across studies. Despite the RQS percentage of included studies in this meta-analysis ranging from 38.9% to 44.4%, surpassing the 30% threshold, and the pooled diagnostic efficacy demonstrating commendable performance in detecting LNM, the methodological quality of included studies remained a concern. This was because none of the studies utilized phantoms to assess robustness against inter-scansner discrepancies and vendor-specific characteristics. Additionally, comprehensive cost-effectiveness analysis, discussions on potential biological correlations, and a prospective study design were lacking in these studies. Therefore, caution is advised when interpreting the study outcomes.
Several constraints should be considered in the meta-analysis. Firstly, a constrained number of studies met our selection criteria. Secondly, the exclusively retrospective studies analyzed, all conducted in China and solely encompassing English-language publications, may have introduced selection biases and affected quality assessment, thereby potentially constraining the generalizability of our findings. Thirdly, despite conducting various analyses, heterogeneity persisted, emphasizing the need for cautious interpretation of the pooled quantitative results. During data extraction, the highest diagnostic performance model was chosen among multiple models, potentially leading to overestimating the radiomics diagnostic accuracy. Lastly, radiomics could be influenced by factors such as imaging equipment technology and protocols, contributing to heterogeneity. Therefore, establishing standardized presentation protocols in future radiomics research papers is necessary.
Our findings indicated that the CT-based radiomics demonstrated good diagnostic accuracy in predicting LNM in EC, with commendable sensitivity and specificity levels. However, considering the suboptimal RQS and observed heterogeneity among the included studies, it is essential to conduct additional high-quality, multicenter, and large-scale prospective trials to establish more robust and conclusive evidence for the findings presented in this research.
The original contributions presented in the study are included in the article/Supplementary Materials, further inquiries can be directed to the corresponding author/s.
LL: Conceptualization, Data curation, Funding acquisition, Investigation, Methodology, Writing – original draft, Writing – review & editing, Project administration. HL: Data curation, Formal analysis, Investigation, Methodology, Validation, Writing – original draft, Writing – review & editing. YZ: Data curation, Methodology, Software, Writing – original draft, Writing – review & editing. JY: Formal analysis, Writing – original draft, Writing – review & editing. CW: Methodology, Visualization, Writing – original draft, Writing – review & editing. LD: Methodology, Writing – original draft, Writing – review & editing. PX: Software, Writing – original draft, Writing – review & editing. WW: Supervision, Visualization, Writing – review & editing. MX: Supervision, Visualization, Writing – review & editing. DS: Conceptualization, Funding acquisition, Project administration, Supervision, Visualization, Writing – review & editing.
The author(s) declare financial support was received for the research, authorship, and/or publication of this article. This research was supported by the Guangxi Clinical Research Center for Medical Imaging Construction (Grant No. Guike AD20238096), Guangxi Key Clinical Specialty (Medical Imaging Department), Dominant Cultivation Discipline of Guangxi Medical University Cancer Hospital (Medical Imaging Department), and self-financing research of the Health Department of Guangxi Autonomous Region (Grant No. Z-A20231142).
The authors declare that the research was conducted in the absence of any commercial or financial relationships that could be construed as a potential conflict of interest.
All claims expressed in this article are solely those of the authors and do not necessarily represent those of their affiliated organizations, or those of the publisher, the editors and the reviewers. Any product that may be evaluated in this article, or claim that may be made by its manufacturer, is not guaranteed or endorsed by the publisher.
The Supplementary Material for this article can be found online at: https://www.frontiersin.org/articles/10.3389/fonc.2024.1267596/full#supplementary-material
1. Sung H, Ferlay J, Siegel RL, Laversanne M, Soerjomataram I, Jemal A, et al. Global cancer statistics 2020: globocan estimates of incidence and mortality worldwide for 36 cancers in 185 countries. CA Cancer J Clin. (2021) 71:209–49. doi: 10.3322/caac.21660
2. Jin X, Zheng X, Chen D, Jin J, Zhu G, Deng X, et al. Prediction of response after chemoradiation for esophageal cancer using a combination of dosimetry and CT radiomics. Eur Radiol. (2019) 29:6080–8. doi: 10.1007/s00330-019-06193-w
3. Li X, Zhao J, Liu M, Zhai F, Zhu Z, Yu F, et al. Determination of radiotherapeutic target zones for thoracic esophageal squamous cell cancer with lower cervical lymph node metastasis according to CT-images. Oncotarget. (2016) 7:35865–73. doi: 10.18632/oncotarget.9094
4. Smyth EC, Lagergren J, Fitzgerald RC, Lordick F, Shah MA, Lagergren P, et al. Oesophageal cancer. Nat Rev Dis Primers. (2017) 3:17048. doi: 10.1038/nrdp.2017.48
5. Ding M, Cui H, Li B, Zou B, Fan B, Ma L, et al. Integrating preoperative computed tomography and clinical factors for lymph node metastasis prediction in esophageal squamous cell carcinoma by feature-wise attentional graph neural network. Int J Radiat Oncol Biol Phys. (2023) 116:676–89. doi: 10.1016/j.ijrobp.2022.12.050
6. Qu J, Shen C, Qin J, Wang Z, Liu Z, Guo J, et al. The mr radiomic signature can predict preoperative lymph node metastasis in patients with esophageal cancer. Eur Radiol. (2019) 29:906–14. doi: 10.1007/s00330-018-5583-z
7. Ji X, Cai J, Chen Y, Chen LQ. Lymphatic spreading and lymphadenectomy for esophageal carcinoma. World J Gastrointest Surg. (2016) 8:90–4. doi: 10.4240/wjgs.v8.i1.90
8. Chen M, Li X, Chen Y, Liu P, Chen Z, Shen M, et al. Proposed revision of the 8th edition ajcc clinical staging system for esophageal squamous cell cancer treated with definitive chemo-imrt based on CT imaging. Radiat Oncol. (2019) 14:54. doi: 10.1186/s13014-019-1258-4
9. D'Journo XB. Clinical implication of the innovations of the 8(Th) edition of the tnm classification for esophageal and esophago-gastric cancer. J Thorac Dis. (2018) 10:S2671–S81. doi: 10.21037/jtd.2018.03.182
10. Huang YL, Yan C, Lin X, Chen ZP, Lin F, Feng ZP, et al. The development of a nomogram model for predicting left recurrent laryngeal nerve lymph node metastasis in esophageal cancer based on radiomics and clinical factors. Ann Transl Med. (2022) 10:1282. doi: 10.21037/atm-22-5628
11. Zhao B, Zhu HT, Li XT, Shi YJ, Cao K, Sun YS. Predicting lymph node metastasis using computed tomography radiomics analysis in patients with resectable esophageal squamous cell carcinoma. J Comput Assist Tomogr. (2021) 45:323–9. doi: 10.1097/RCT.0000000000001125
12. Liu J, Wang Z, Shao H, Qu D, Liu J, Yao L. Improving CT detection sensitivity for nodal metastases in oesophageal cancer with combination of smaller size and lymph node axial ratio. Eur Radiol. (2018) 28:188–95. doi: 10.1007/s00330-017-4935-4
13. Lambin P, Leijenaar RTH, Deist TM, Peerlings J, de Jong EEC, van Timmeren J, et al. Radiomics: the bridge between medical imaging and personalized medicine. Nat Rev Clin Oncol. (2017) 14:749–62. doi: 10.1038/nrclinonc.2017.141
14. Gillies RJ, Kinahan PE, Hricak H. Radiomics: images are more than pictures, they are data. Radiology. (2016) 278:563–77. doi: 10.1148/radiol.2015151169
15. Le VH, Kha QH, Minh TNT, Nguyen VH, Le VL, Le NQK. Development and validation of CT-based radiomics signature for overall survival prediction in multi-organ cancer. J Digit Imaging. (2023) 36:911–22. doi: 10.1007/s10278-023-00778-0
16. Shi YJ, Zhu HT, Yan S, Li XT, Zhang XY, Sun YS. A CT-based radiomics nomogram model for differentiating primary Malignant melanoma of the esophagus from esophageal squamous cell carcinoma. BioMed Res Int. (2023) 2023:6057196. doi: 10.1155/2023/6057196
17. Takahashi N, Tanaka S, Umezawa R, Takanami K, Takeda K, Yamamoto T, et al. Development and validation of an [(18)F]Fdg-pet/CT radiomic model for predicting progression-free survival for patients with stage ii - iii thoracic esophageal squamous cell carcinoma who are treated with definitive chemoradiotherapy. Acta Oncol. (2023) 62:159–65. doi: 10.1080/0284186X.2023.2178859
18. Du KP, Huang WP, Liu SY, Chen YJ, Li LM, Liu XN, et al. Application of computed tomography-based radiomics in differential diagnosis of adenocarcinoma and squamous cell carcinoma at the esophagogastric junction. World J Gastroenterol. (2022) 28:4363–75. doi: 10.3748/wjg.v28.i31.4363
19. Wang J, Yu X, Zeng J, Li H, Qin P. Radiomics model for preoperative prediction of 3-year survival-based CT image biomarkers in esophageal cancer. Eur Arch Otorhinolaryngol. (2022) 279:5433–43. doi: 10.1007/s00405-022-07510-8
20. Xie C-Y, Pang C-L, Chan B, Wong EY-Y, Dou Q, Vardhanabhuti V. Machine learning and radiomics applications in esophageal cancers using non-invasive imaging methods-a critical review of literature. Cancers. (2021) 13(10):2469. doi: 10.3390/cancers13102469
21. Chen L, Ouyang Y, Liu S, Lin J, Chen C, Zheng C, et al. Radiomics analysis of lymph nodes with esophageal squamous cell carcinoma based on deep learning. J Oncol. (2022) 2022:8534262. doi: 10.1155/2022/8534262
22. Lee HN, Kim JI, Shin SY, Kim DH, Kim C, Hong IK. Combined CT texture analysis and nodal axial ratio for detection of nodal metastasis in esophageal cancer. Br J Radiol. (2020) 93:20190827. doi: 10.1259/bjr.20190827
23. Tan X, Ma Z, Yan L, Ye W, Liu Z, Liang C. Radiomics nomogram outperforms size criteria in discriminating lymph node metastasis in resectable esophageal squamous cell carcinoma. Eur Radiol. (2019) 29:392–400. doi: 10.1007/s00330-018-5581-1
24. McInnes MDF, Moher D, Thombs BD, McGrath TA, Bossuyt PM, Clifford T, et al. Preferred reporting items for a systematic review and meta-analysis of diagnostic test accuracy studies: the prisma-dta statement. JAMA. (2018) 319:388–96. doi: 10.1001/jama.2017.19163
25. Whiting PF, Rutjes AW, Westwood ME, Mallett S, Deeks JJ, Reitsma JB, et al. Quadas-2: A revised tool for the quality assessment of diagnostic accuracy studies. Ann Intern Med. (2011) 155:529–36. doi: 10.7326/0003-4819-155-8-201110180-00009
26. Schober P, Mascha EJ, Vetter TR. Statistics from a (Agreement) to Z (Z score): A guide to interpreting common measures of association, agreement, diagnostic accuracy, effect size, heterogeneity, and reliability in medical research. Anesth Analg. (2021) 133:1633–41. doi: 10.1213/ANE.0000000000005773
27. Deantonio L, Garo ML, Paone G, Valli MC, Cappio S, La Regina D, et al. 18f-fdg pet radiomics as predictor of treatment response in oesophageal cancer: A systematic review and meta-analysis. Front Oncol. (2022) 12:861638. doi: 10.3389/fonc.2022.861638
28. Higgins JP, Thompson SG, Deeks JJ, Altman DG. Measuring inconsistency in meta-analyses. BMJ. (2003) 327:557–60. doi: 10.1136/bmj.327.7414.557
29. Deeks JJ, Macaskill P, Irwig L. The performance of tests of publication bias and other sample size effects in systematic reviews of diagnostic test accuracy was assessed. J Clin Epidemiol. (2005) 58:882–93. doi: 10.1016/j.jclinepi.2005.01.016
30. Hellmich M, Lehmacher W. A ruler for interpreting diagnostic test results. Methods Inf Med. (2005) 44:124–6. doi: 10.1055/s-0038-1633930
31. Li X, Liu Q, Hu B, Xu J, Huang C, Liu F. A computed tomography-based clinical-radiomics model for prediction of lymph node metastasis in esophageal carcinoma. J Cancer Res Ther. (2021) 17:1665–71. doi: 10.4103/jcrt.jcrt_1755_21
32. Ou J, Wu L, Li R, Wu CQ, Liu J, Chen TW, et al. CT radiomics features to predict lymph node metastasis in advanced esophageal squamous cell carcinoma and to discriminate between regional and non-regional lymph node metastasis: A case control study. Quant Imaging Med Surg. (2021) 11:628–40. doi: 10.21037/qims-20-241
33. Peng G, Zhan Y, Wu Y, Zeng C, Wang S, Guo L, et al. Radiomics models based on CT at different phases predicting lymph node metastasis of esophageal squamous cell carcinoma (Gasto-1089). Front Oncol. (2022) 12:988859. doi: 10.3389/fonc.2022.988859
34. Shen C, Liu Z, Wang Z, Guo J, Zhang H, Wang Y, et al. Building CT radiomics based nomogram for preoperative esophageal cancer patients lymph node metastasis prediction. Transl Oncol. (2018) 11:815–24. doi: 10.1016/j.tranon.2018.04.005
35. Yu L, Huang L, Yuan Z, Zhao Q, Yin H, Yu P, et al. Radiomics model based on plain CT for predicting lymph node metastasis of esophageal cancer. Chin J Med Imaging Technol. (2021) 37:1333–7. doi: 10.13929/j.issn.1003-3289.2021.09.014
36. Shao B, Bjaanæs MM, Helland Å, Schütte C, Conrad T. Emt network-based feature selection improves prognosis prediction in lung adenocarcinoma. PloS One. (2019) 14:e0204186. doi: 10.1371/journal.pone.0204186
37. Fonti V, Belitser E. Feature Selection Using Lasso. VU Amsterdam research paper in business analytics, Vol. 30. (2017). pp. 1–25. Available at: https://api.semanticscholar.org/CorpusID:41727607.
38. Chen H, Zhou X, Tang X, Li S, Zhang G. Prediction of lymph node metastasis in superficial esophageal cancer using a pattern recognition neural network. Cancer Manag Res. (2020) 12:12249–58. doi: 10.2147/CMAR.S270316
39. Gao M, Huang S, Pan X, Liao X, Yang R, Liu J. Machine learning-based radiomics predicting tumor grades and expression of multiple pathologic biomarkers in gliomas. Front Oncol. (2020) 10:1676. doi: 10.3389/fonc.2020.01676
40. Kumar V, Gu Y, Basu S, Berglund A, Eschrich SA, Schabath MB, et al. Radiomics: the process and the challenges. Magnetic resonance Imaging. (2012) 30:1234–48. doi: 10.1016/j.mri.2012.06.010
41. Liu Z, Wang S, Dong D, Wei J, Fang C, Zhou X, et al. The applications of radiomics in precision diagnosis and treatment of oncology: opportunities and challenges. Theranostics. (2019) 9:1303–22. doi: 10.7150/thno.30309
42. Le NQK. Hematoma expansion prediction: still navigating the intersection of deep learning and radiomics. Eur Radiol. (2024) 22. doi: 10.1007/s00330-024-10586-x
43. Watzenboeck ML, Heidinger BH, Rainer J, Schmidbauer V, Ulm B, Rubesova E, et al. Reproducibility of 2d versus 3d radiomics for quantitative assessment of fetal lung development: A retrospective fetal mri study. Insights Imaging. (2023) 14:31. doi: 10.1186/s13244-023-01376-y
44. Adelsmayr G, Janisch M, Kaufmann-Bühler AK, Holter M, Talakic E, Janek E, et al. CT texture analysis reliability in pulmonary lesions: the influence of 3d vs. 2d lesion segmentation and volume definition by a hounsfield-unit threshold. Eur Radiol. (2023) 33:3064–71. doi: 10.1007/s00330-023-09500-8
45. Traverso A, Wee L, Dekker A, Gillies R. Repeatability and reproducibility of radiomic features: A systematic review. Int J Radiat Oncol Biol Phys. (2018) 102:1143–58. doi: 10.1016/j.ijrobp.2018.05.053
46. Dou Q, So TY, Jiang M, Liu Q, Vardhanabhuti V, Kaissis G, et al. Federated deep learning for detecting covid-19 lung abnormalities in CT: A privacy-preserving multinational validation study. NPJ Digit Med. (2021) 4:60. doi: 10.1038/s41746-021-00431-6
47. Wesdorp NJ, Hellingman T, Jansma EP, van Waesberghe JTM, Boellaard R, Punt CJA, et al. Advanced analytics and artificial intelligence in gastrointestinal cancer: A systematic review of radiomics predicting response to treatment. Eur J Nucl Med Mol Imaging. (2021) 48:1785–94. doi: 10.1007/s00259-020-05142-w
Keywords: esophageal cancer, lymph node metastasis, computerized tomography, radiomics, diagnosis, meta-analysis
Citation: Liu L, Liao H, Zhao Y, Yin J, Wang C, Duan L, Xie P, Wei W, Xu M and Su D (2024) CT-based radiomics for predicting lymph node metastasis in esophageal cancer: a systematic review and meta-analysis. Front. Oncol. 14:1267596. doi: 10.3389/fonc.2024.1267596
Received: 03 November 2023; Accepted: 07 March 2024;
Published: 19 March 2024.
Edited by:
Li Chen, Huazhong University of Science and Technology, ChinaReviewed by:
Chen Li, King’s College London, United KingdomCopyright © 2024 Liu, Liao, Zhao, Yin, Wang, Duan, Xie, Wei, Xu and Su. This is an open-access article distributed under the terms of the Creative Commons Attribution License (CC BY). The use, distribution or reproduction in other forums is permitted, provided the original author(s) and the copyright owner(s) are credited and that the original publication in this journal is cited, in accordance with accepted academic practice. No use, distribution or reproduction is permitted which does not comply with these terms.
*Correspondence: Danke Su, c3VkYW5rZTMzQHNpbmEuY29t
Disclaimer: All claims expressed in this article are solely those of the authors and do not necessarily represent those of their affiliated organizations, or those of the publisher, the editors and the reviewers. Any product that may be evaluated in this article or claim that may be made by its manufacturer is not guaranteed or endorsed by the publisher.
Research integrity at Frontiers
Learn more about the work of our research integrity team to safeguard the quality of each article we publish.