 Mislav Bobić1,2*†‡
 Jeppe B. Christensen3†‡
 Hoyeon Lee2‡
 Evangelia Choulilitsa1,3‡
 Katarzyna Czerska3‡
 Michele Togno3‡
 Sairos Safai3‡Eduardo G. Yukihara3‡Brian A. Winey2‡
 Antony J. Lomax1,3
 Harald Paganetti2‡Francesca Albertini3‡
 Konrad P. Nesteruk2‡
- 1Department of Physics, ETH Zurich, Zurich, Switzerland
- 2Department of Radiation Oncology, Massachusetts General Hospital and Harvard Medical School, Boston, MA, United States
- 3Paul Scherrer Institute, Villigen, Switzerland
Purpose: To demonstrate the suitability of optically stimulated luminescence detectors (OSLDs) for accurate simultaneous measurement of the absolute point dose and dose-weighted linear energy transfer (LETD) in an anthropomorphic phantom for experimental validation of daily adaptive proton therapy.
Methods: A clinically realistic intensity-modulated proton therapy (IMPT) treatment plan was created based on a CT of an anthropomorphic head-and-neck phantom made of tissue-equivalent material. The IMPT plan was optimized with three fields to deliver a uniform dose to the target volume covering the OSLDs. Different scenarios representing inter-fractional anatomical changes were created by modifying the phantom. An online adaptive proton therapy workflow was used to recover the daily dose distribution and account for the applied geometry changes. To validate the adaptive workflow, measurements were performed by irradiating Al2O3:C OSLDs inside the phantom. In addition to the measurements, retrospective Monte Carlo simulations were performed to compare the absolute dose and dose-averaged LET (LETD) delivered to the OSLDs.
Results: The online adaptive proton therapy workflow was shown to recover significant degradation in dose conformity resulting from large anatomical and positioning deviations from the reference plan. The Monte Carlo simulations were in close agreement with the OSLD measurements, with an average relative error of 1.4% for doses and 3.2% for LETD. The use of OSLDs for LET determination allowed for a correction for the ionization quenched response.
Conclusion: The OSLDs appear to be an excellent detector for simultaneously assessing dose and LET distributions in proton irradiation of an anthropomorphic phantom. The OSLDs can be cut to almost any size and shape, making them ideal for in-phantom measurements to probe the radiation quality and dose in a predefined region of interest. Although we have presented the results obtained in the experimental validation of an adaptive proton therapy workflow, the same approach can be generalized and used for a variety of clinical innovations and workflow developments that require accurate assessment of point dose and/or average LET.
1 Introduction
Clinical innovations and translational research in radiotherapy often require precise dose measurements in different phantoms to validate the expected dose distribution and its variation according to different irradiation conditions. In proton therapy, another important parameter is the linear energy transfer (LET). It is considered a surrogate for the relative biological effectiveness (RBE) (1), even though RBE does not necessarily scale linearly with LET (2, 3). Dosimetry, however, is challenged by the elevated LET at the spread-out Bragg peak (SOBP), which limits the use of many dosimeter types due to ionization quenching (4). Therefore, for accurate ion beam dosimetry, a dosimeter subject to quenching must also be able to assess the radiation quality, e.g. through an estimation of the average LET, in order to correct the measured dose for quenching. Besides the capability of assessing both dose and LET distributions simultaneously, the detector should only disturb the radiation field negligibly. One example application is the experimental validation of the dose and LET distributions in an online adaptive proton therapy workflow in an anthropomorphic phantom.
Passive luminescent detectors have been applied for simultaneous dose and LET determination in light ion beams for decades (5, 6). Among the available detector types, particularly the use of optically stimulated luminescence detectors (OSLDs) is attractive for in-phantom measurements due to the possibility of creating ultra-thin detectors (< 100 µm) that can be cut to arbitrary shapes (7). While previous studies have determined the dose and LET with OSLDs in proton beams under reference conditions, we demonstrate for the first time how these quantities can be measured in the mixed particle fields relevant to SOBPs to validate adaptive radiotherapy (8–10). Although the LET can be averaged in different ways, in our work we always refer to the dose-weighted LET (LETD) with contributions from protons only.
Adaptive radiotherapy refers to fractionated treatment delivery that takes into account changes in the patient’s anatomy during treatment. Geometric changes can occur within a fraction (intra-fractional) or between consecutive fractions (inter-fractional). The former is mostly due to respiratory motion, which particularly affects some tumor sites such as the abdomen and thorax. The latter can have various causes, such as weight gain or loss, tumor shrinkage, or even sinus filling. The goal of adaptation is to restore the original coverage of the target while sparing as much healthy tissue as possible. Proton therapy can particularly benefit from adaptation due to its well-defined range and sharp gradients. Daily variations in a patient’s geometry can affect the range of the protons, resulting in under-dosing of the target or over-dosing of organs at risk (OARs). Several adaptive proton therapy workflows have been proposed (11–30).
In this work, we report on the use of OSLDs for experimental testing of the adaptive workflow developed at the Paul Scherrer Institute (PSI) based on daily analytical plan recalculation according to the computed tomography (CT) of the day (21–24). To simulate realistic anatomical and positioning changes, we employed an anthropomorphic head-and-neck phantom previously developed at PSI. Our approach can be generalized and used in other experimental validations of proton therapy developments that require an accurate evaluation of point dose and/or LET.
2 Methods and materials
2.1 Anthropomorphic head-and-neck phantom
Dose delivery and measurements were conducted with PSI’s Gantry 2 (31) using the anthropomorphic head-and-neck phantom. The phantom was developed at PSI in collaboration with CIRS (Computerized Imaging Reference Systems, Inc., Norfolk, USA) and used in a previous study to validate the daily adaptive proton therapy workflow developed at PSI (32). It is constructed from tissue-equivalent material and sliced into five sections along the coronal plane. The nasal cavities can be filled with mucus-equivalent material to mimic the effects of nasal congestion in head-and-neck patients. In addition, a fat layer can be applied to the neck area to simulate weight changes. Further details on the phantom can be found elsewhere (32).
For our study, a reproducible position of the OSLDs in the phantom was required. To accomplish this, we positioned the OSLDs on top of a tissue-equivalent rod (see Figure 1) placed in the cylindrical channel drilled through the phantom. Sliding the rod to the end of the channel ensured consistent positioning across all measured fractions. Seven 3-mm diameter OSLDs were fixed in a circular manner (see section 2.4), with one positioned at the center of the rod as seen in Figure 1B. Figure 1A shows the axial slice of the CT with the OSLD arrangement visible on the scan. To simulate anatomical changes, we applied different configurations of the nasal cavity fillings as well as the 1 cm fat layer around the neck area.
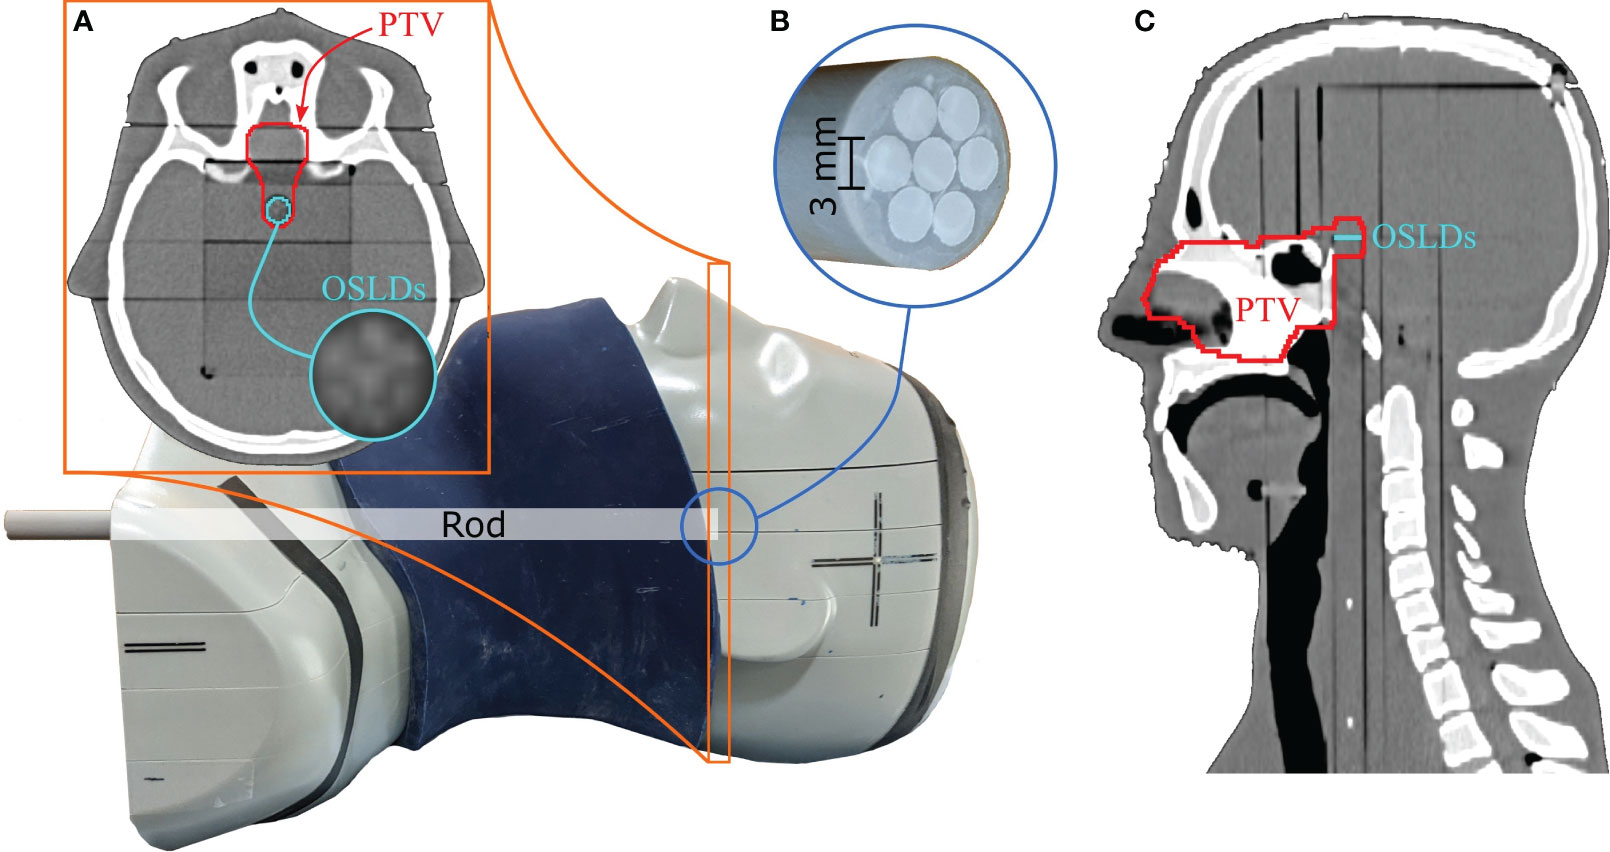
Figure 1 Anthropomorphic head-and-neck phantom used for measurements. The 1 cm fat layer is positioned around the phantom in this figure. The circular OSLD arrangement is visible on the axial CT slice in (A). Seven 3-mm OSLDs are attached to the top of the tissue-equivalent rod, as seen in (B). The PTV is extended posteriorly to include the OSLD contour, as seen in the axial and sagittal CT slices in (A, C).
2.2 Treatment planning and the DAPT workflow
The nominal treatment plan was created on the reference (planning) CT imaged with the PSI Gantry 2 in-room CT scanner (33). We fixed the head-and-neck phantom with a thermoplastic mesh mask and a moulage to ensure consistent positioning between the reference CT and the consequent fraction images. Various regions of interest (ROIs), including OARs and a clinical target volume (CTV), were delineated by an experienced radiation oncologist. In addition, we extended the superior part of the CTV posteriorly to cover the OSLDs, as shown in Figure 1. A planning target volume (PTV) was then created by isotropically expanding the CTV by 2 mm.
Treatment planning was performed using PSI’s in-house treatment planning system, FIonA. The CTV received a prescription of 2.0 Gy(RBE) per fraction, assuming a constant RBE of 1.1 (physical dose = 1.82 Gy). Three anterior fields were introduced to deliver a combined uniform dose to the PTV with the following gantry angles: -20°, 0°, and 20°. The nominal plan was then optimized to the PTV with a range robustness setting of ± 3.0% and additional OAR objectives/constraints to fulfill the QUANTEC guidelines (34). The resulting IMPT plan served as the reference plan for the online plan adaptation.
Online plan adaptation was performed using PSI’s daily adaptive proton therapy (DAPT) workflow (12, 32). The reference plan, created on the reference CT, defines the beam geometries and ROI objectives/constraints to be used for daily dose re-optimization based on the anatomy of the day: first, daily imaging is performed with the same in-room CT scanner as for reference imaging, followed by rigid registration. The resulting vector field is used to propagate contours from the reference CT to the daily image. Once the daily ROIs are defined, the daily plan is created by optimizing the dose using the same set of objectives and constraints as in the reference plan. The daily plan is then delivered after clinical and physical quality assurance. More details on DAPT can be found elsewhere (32).
2.3 Treatment delivery and fractions
Two delivery methods were considered: the non-adaptive (NA) scenario and the daily adaptive (DAPT) scenario. In NA, the reference plan from the nominal/reference CT was delivered to the daily fraction image without any corrections. In DAPT, a daily plan was created and optimized based on the daily image using the DAPT workflow described above.
Table 1 shows an overview of the delivered and measured fractions simulated by applying different combinations of positioning and anatomical changes compared to the reference CT. The nominal treatment plan was designed on the reference CT, which we refer to as the nominal positioning and nominal anatomy composition: no fat layer and nasal cavities filled with the mucus-equivalent material. Fraction 1 was a replication of the nominal/reference conditions, and only the NA scenario was measured for this fraction. For the remaining fractions, both NA and DAPT scenarios were delivered and measured. We used the same in-room CT scanner that was used for the reference CT to image the fractions.
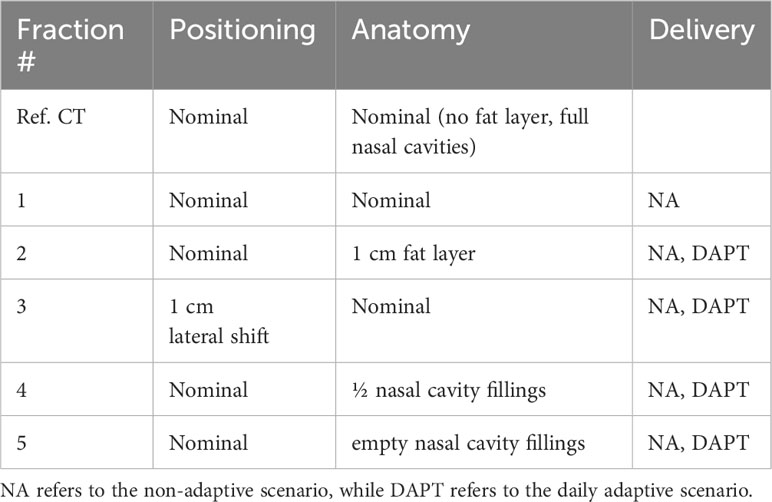
Table 1 Overview of the delivered fractions.
In fraction 2, we applied the 1 cm fat layer in the neck area as previously shown in Figure 1. This also affected the position of the phantom, as the fat layer induced both a spatial offset and an angular deviation compared to the reference. In fraction 3, we removed the fat layer and moved the phantom 1 cm laterally from its nominal position. In fraction 4, the phantom was in its nominal position, and we removed half of the nasal cavity fillings (starting from the most posterior section). In fraction 5, the phantom remained in its nominal position, and we removed the remaining half of the mucus-equivalent material, leaving the nasal cavities empty.
To confirm our positioning reproducibility, a quantitative measure is given in Figure 2. The figure overlays the nominal/reference CT and the CT of fraction 1 in complementary colors, blue and yellow, respectively (both at 50% transparency). The positioning errors can be seen by the blue/yellow shades throughout the image, especially visible at the edges and between the plates of the phantom. In addition, the OSLD contours for both CTs are visible on the axial slice, along with a calculation of the center of mass (COM) relative to the mutual CT origin. The difference between the two calculated COMs yields sub-millimeter accuracy in all three dimensions.
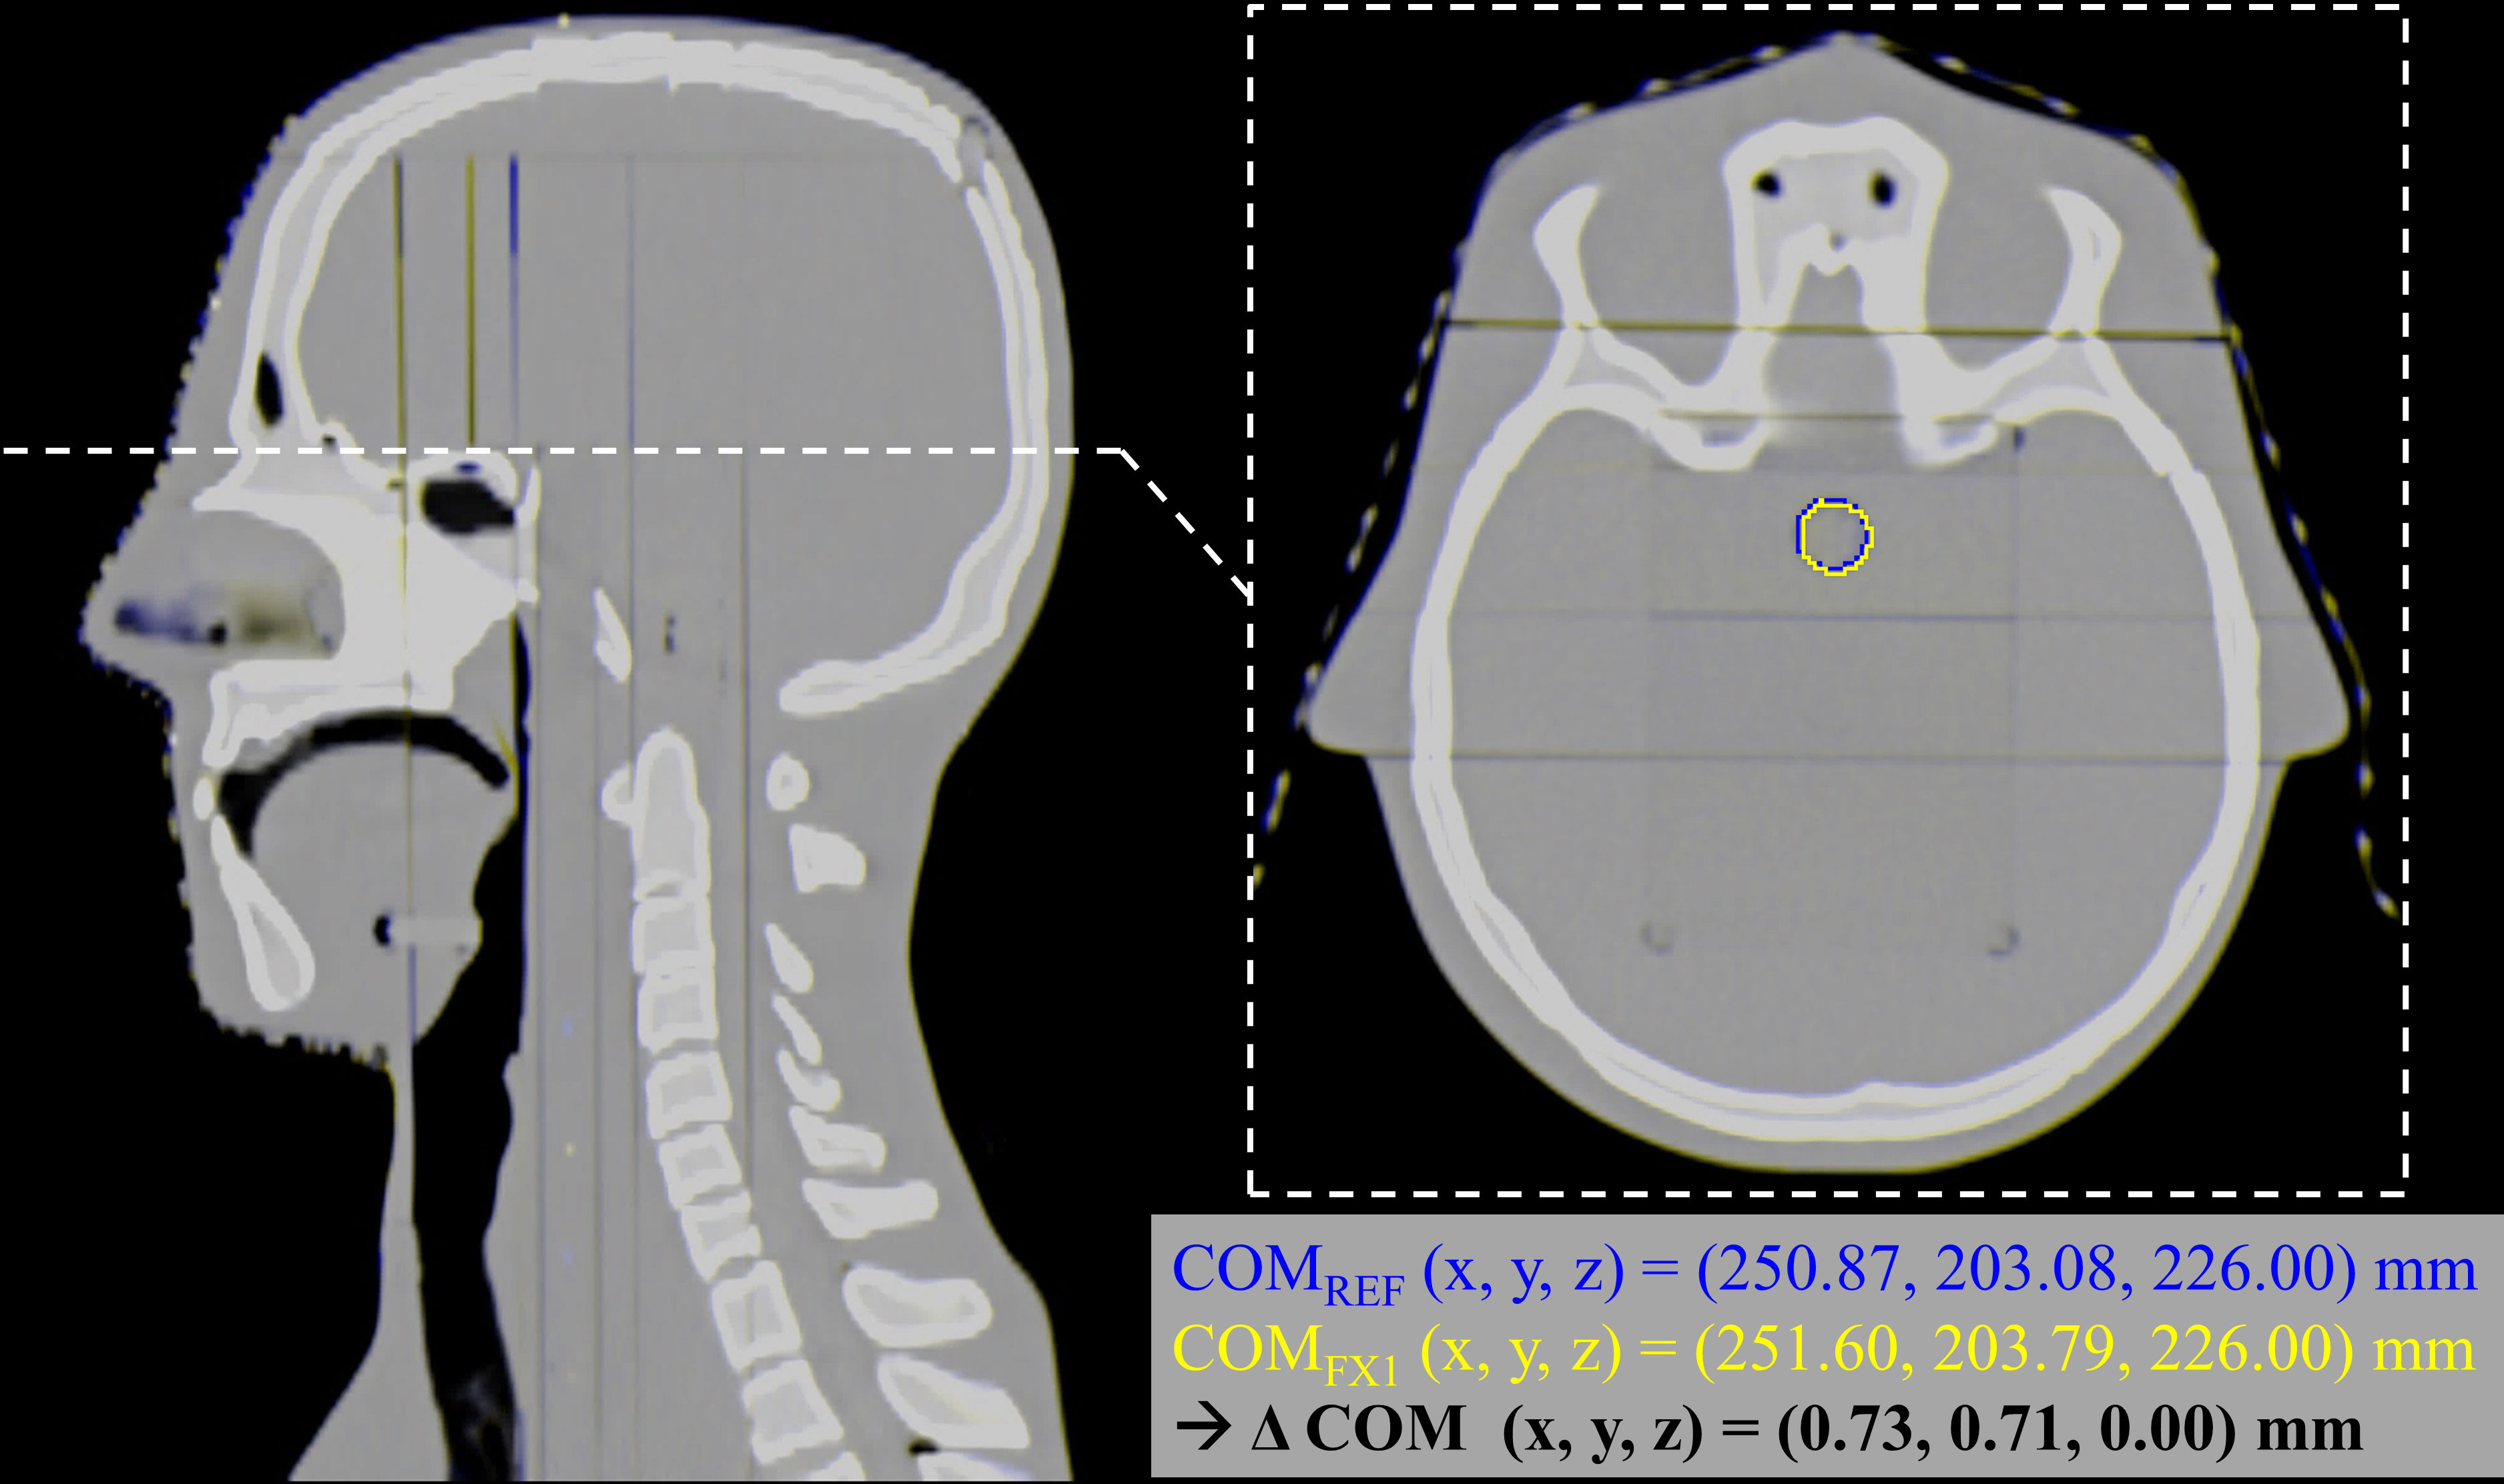
Figure 2 Estimation of the positioning reproducibility of the phantom and the OSLDs. Both the nominal/reference CT and fraction 1 CT are overlayed in complementary colors (blue and yellow, respectively), highlighting the positioning errors between the two images. On the axial slice, the OSLD contour is visible for both images, along with a calculation of the COM relative to the mutual CT origin. The difference between the two calculated COMs yields sub-millimeter accuracy in all three dimensions.
2.4 OSL detector preparation
All measurements were conducted with optically stimulated luminescence (OSL) Al2O3:C detectors. The 3-mm diameter OSLDs were cut from a single film made from < 38 μm Al2O3 grains mixed with a binder and a 75 μm polyester substrate as described in Ref (35). The OSLDs were optically bleached with a green light prior to irradiation. The OSLDs were placed inside the phantom as shown in Figure 1, which also served to shield the OSLDs from ambient light after irradiation. The OSLDs were fixed to the rod using a piece of tape sticking to the polymer side.
2.5 OSL readout and dosimetry
To determine the dose and LET to each Al2O3:C OSLD, the detectors were read out using pulsed stimulation to separate the blue emission band from the UV emission (36). The OSLDs were read out in a commercial reader (Risø TL/OSL-DA-20, DTU Nutech, Denmark) in an automated sequence defined in Ref (37). Only the blue emission band was used for dosimetry through the dose calibration in Figure 3A obtained with 240 MeV protons, due to its dose linearity below 5 Gy relevant to this study along with a low fading-rate and dose-rate independence (37). To improve the dosimetry and reduce the effects of inter-sample differences, the OSLDs were subject to a reference irradiation with a known dose to normalize the signal (7). This enables a standard deviation of the residuals lower than 1% as seen in Figure 3A.
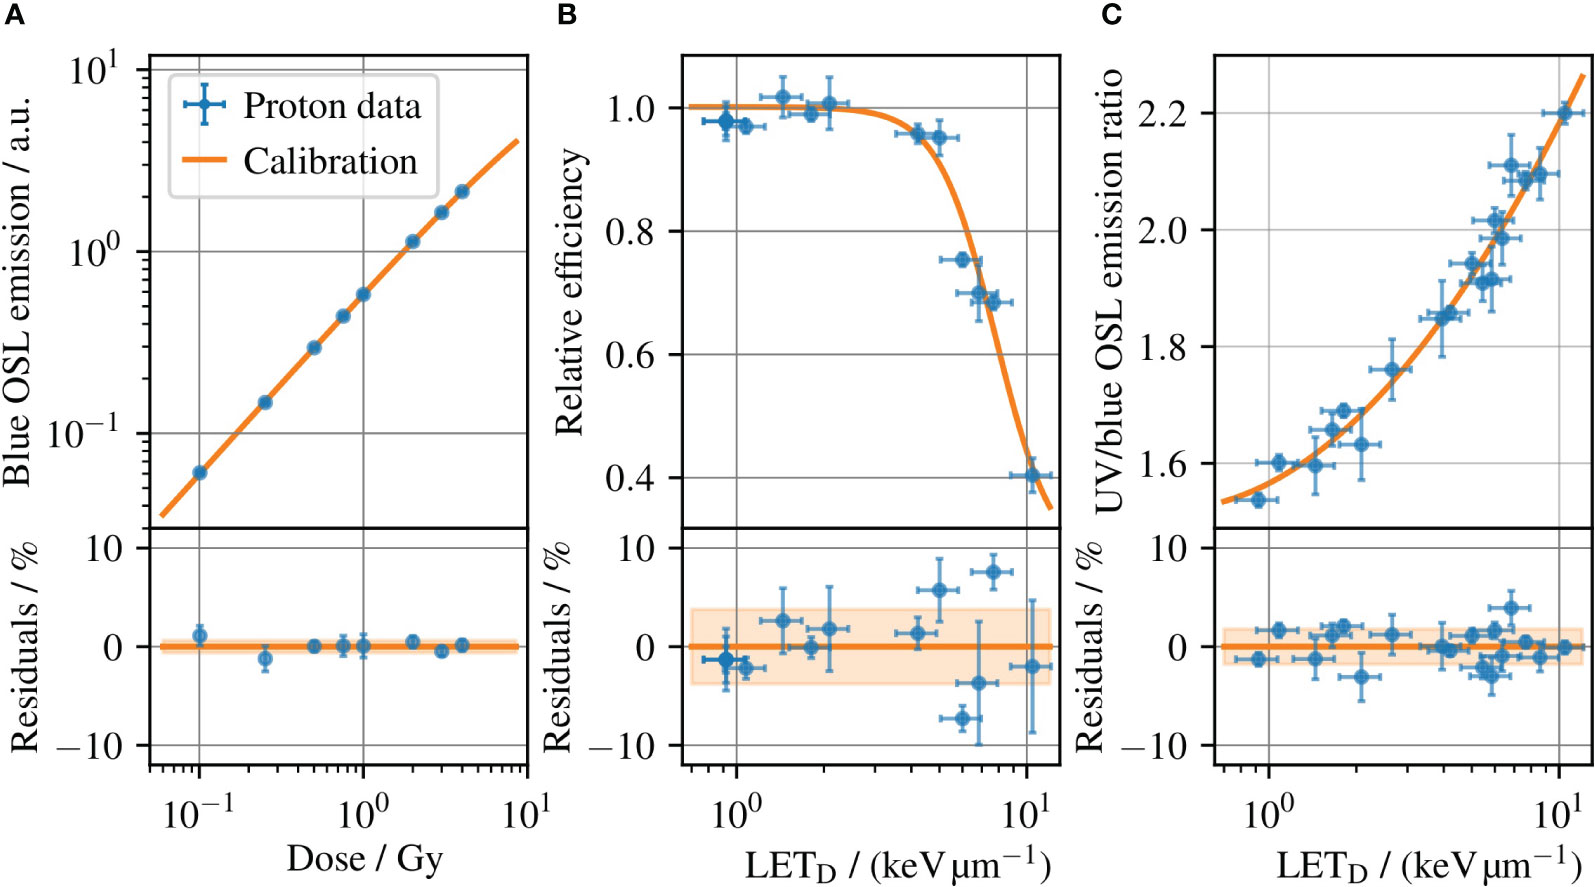
Figure 3 (A) The OSLD dose calibration for 240 MeV protons, which relates the blue OSL emission intensity to the dose measured with an ionization chamber. (B) Relative detector efficiency for the blue OSL emission for protons, where the emission band is subject to ionization quenching increasing with the LET. (c) Ratio of the UV and blue emission bands versus LET at reference conditions, i.e. the LET calibration. Error bars illustrate the (coverage factor k=1) uncertainties. The shaded bands in the residual plots outline the standard deviation of the residuals, which is 0.6%, 3.8%, and 1.8% for (A–C), respectively.
One challenge with OSLD dosimetry in light ion beams is its ionization-quenched response, in line with other solid-state detectors (38–41). The relative detector efficiency for the blue OSL emission band is shown in Figure 3B for protons, where the efficiency decreases with increasing LET. Unless corrected, the quenched response will lead to an underestimated dose for measurements in an SOBP. However, an LET correction can be derived from the OSL response itself through the ratio of the UV and blue emission bands. Figure 3C shows the ratio of the two OSL signals as a function of LETD, where the OSLDs were irradiated at different radiation qualities and the LETD at each position assessed with Monte Carlo simulation methods. A detailed explanation of the data can be found in (7). The relationship between the UV and blue emission band ratios enables a determination of the LETD for each OSLD readout. The use of the OSLD emission band ratio to determine LETD has been demonstrated for protons, helium, and carbon ions up to 41.3 keV/μm in water. For ions heavier than carbon, the dense ionizations cause a signal saturation, and the emission band ratio is difficult to relate to the LET (10). The estimated LETD can in turn be used to look up the relative detector efficiency in Figure 3B to correct ionization quenched dose in the OSLD. Hence, a single OSLD permits to determine the dose and average LET simultaneously (8, 10).
2.6 Monte Carlo dosimetry
In each delivered and measured fraction, both dose and LETD were retrospectively simulated using MOQUI (42), an open-source GPU-based Monte Carlo code. For this purpose, we implemented the PSI Gantry 2 beam model in MOQUI and cross-validated dose calculations in water with the treatment planning system FIonA.
MOQUI scores both dose and LETD distributions on the CT grid separately for each treatment field. dE/dx was calculated by dividing a particle’s energy loss (dE) by the corresponding travel distance (dx). The to each voxel () with the density () is scored as in Ref (43) with a water density of and weighted by the energy deposition:
The above equation calculates distributions for each field F, which are then used together with the field doses DF to calculate the total LETD:
The precision of the Monte Carlo dose calculation is related to the number of particles simulated. We simulated particles on the CT images of the phantom (i.e., based on its density and structures) until a statistical uncertainty threshold of 1% was reached for the dose in the target. The voxel-wise dose and LETD distributions were then averaged over a single-slice OSLD contour created on the axial CT slice to compare the Monte Carlo dosimetry results with the measurements. We contoured this structure to encompass all seven OSLDs on the tissue-equivalent rod (see Figure 1).
3 Results
3.1 OSLD dosimetry and LET determination
The readouts of the seven OSLDs in the DAPT fraction 2 are shown in Figure 4. The integral OSL emissions from each OSLD are shown in Figures 4A, B for the emissions in the blue and UV emission bands, respectively. To improve the OSL signal precision, each of the integral OSL emissions is scaled by the intensity of the reference irradiation as discussed in section 2.5. To determine the average LETD to each OSLD, the ratio of the UV to its blue emission intensity is used to look-up the corresponding LETD value in Figure 3C, where the determined LETD values are shown in Figure 4C. The variation of determined LETD values reflect the variation in the SOBP, where the highest LETD occurs at the distal edge. The dose to each OSLD in Figure 4D is determined by applying the OSL dose calibration in Figure 3A to the blue emission readouts shown in Figure 4A, which are subject to ionization quenching. The determined LETD values in Figure 4C are used to determine individual ionization quenching correction factors for each of the OSLDs in Figure 4D through the relative detector efficiency in Figure 3B.

Figure 4 Example of the seven OSL detectors irradiated during the DAPT fraction 2. Each OSLD is annotated with its position number and the numerical value of the readout with units given in the color bar. (A, B) show the relative blue and UV emission intensities, respectively. Using the ratio of the blue and UV emissions, the LETD to each OSLD in (C) is estimated through the calibration curve in Figure 3C. Finally, the intensity of the blue emissions in (A) is used to determine the dose to the OSLDs shown in (D) through the dose calibration in Figure 3A. Each LET determination in (C) has been used to correct the doses in (D) for ionization quenching through the correction factors derived from Figure 3B.
3.2 Comparison of OSLD measurements and Monte Carlo
The results of the OSLD measurements and Monte Carlo simulations are summarized in Figure 5 for different fractions for dose and LETD in (Figures 5A, B) respectively. For the Monte Carlo results, the bar plots show the mean values obtained by averaging the voxel-wise values over the OSLD contour, whereas the uncertainty bars represent the standard deviation of the same values (coverage factor k=1). For the OSLD results, the bar plots show the same metrics obtained by averaging the measured values for the seven OSL detectors. In addition, the uncertainty bars for the OSLD measurements illustrate the standard deviation of the data. The overlay with circular markers shows the determined dose or LETD from each OSLD measurement. As the LETD varies throughout the delineated volume in the SOBP where the OSLDs are placed, there will be a spread of the experimental data. However, as the relative detector efficiency in Figure 3B varies only little with the LETD for protons. This means that, e.g., a 10% deviation of the determined LETD typically only leads to a 1% deviation of the LETD-derived quenching correction and consequently has a smaller impact on the accuracy of the dosimetry.
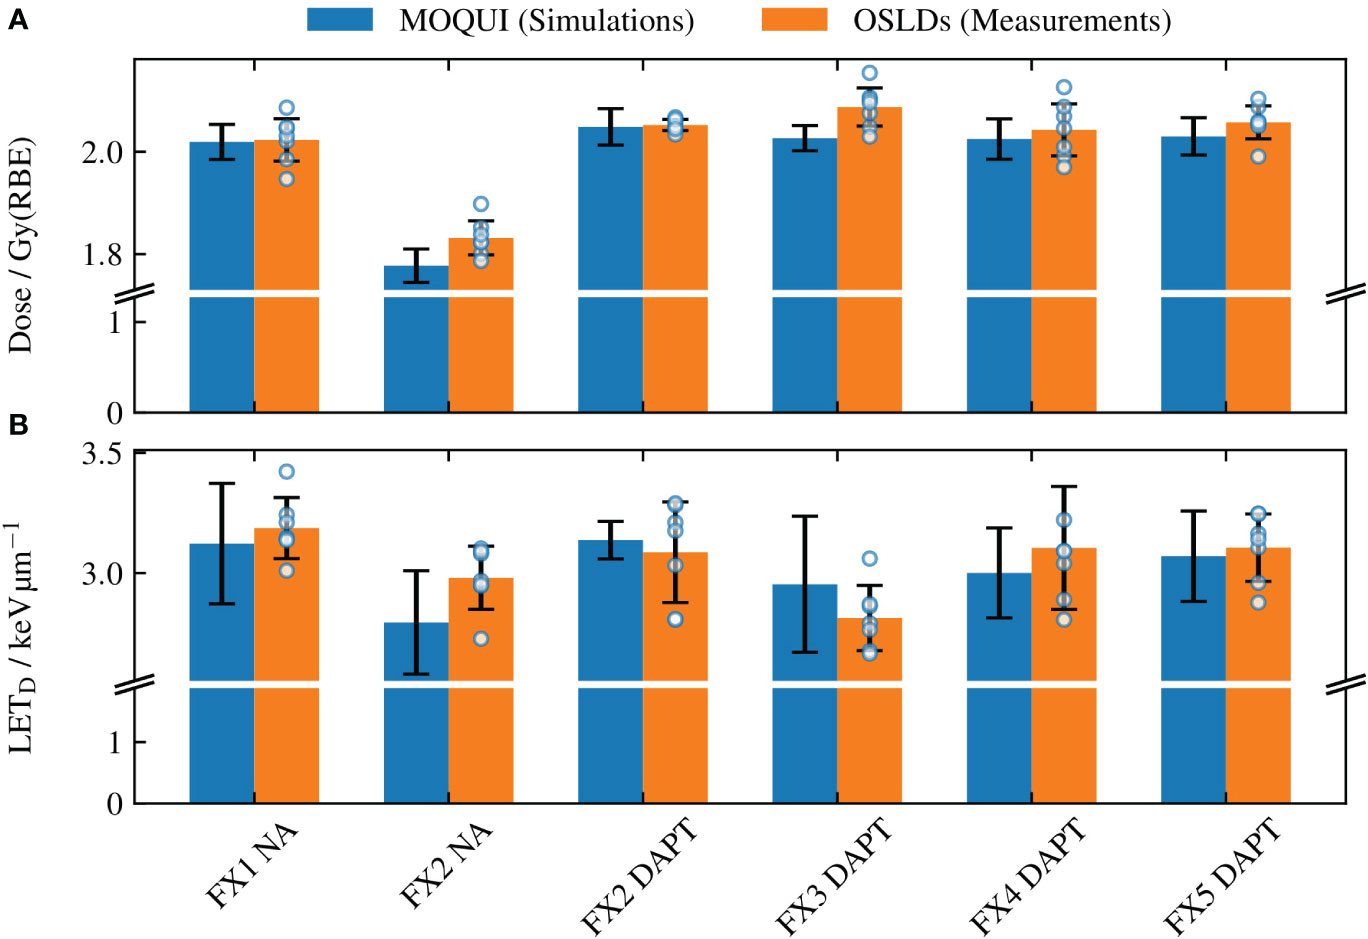
Figure 5 The mean (A) dose and (B) LETD values determined through the Monte Carlo simulations with MOQUI and measurements with the OSLDs. For Monte Carlo, the uncertainty bars represent the standard deviation of the voxel-wise values acquired for each voxel within the OSLD contour. The uncertainty bars for the OSLDs show the standard deviation of the data of the seven OSLDs in each fraction. All uncertainties are given for a coverage factor k=1. The result from each OSLD is illustrated with a circular marker. The larger uncertainty bars in (B) relative to (A) are a result of the variations in LETD throughout the circular OSLD arrangement (see Figure 4). The relative error between the simulated and measured values was 1.4% for the doses and 3.2% for the LETD. A significant loss of target coverage is observed for the NA delivery in fraction 2.
Figure 5 shows the NA delivery of the reference plan to fraction 1 (which replicates the planning CT) and the DAPT-generated daily plans delivered to the subsequent four fractions. In addition, the NA scenario for fraction 2 is shown as a worst-case example of the reference plan delivery among all fractions. For this fraction, the 1 cm fat layer around the phantom neck area caused a large spatial offset and angular deviation compared to the planning CT. The resulting loss of target coverage is further evident in Figure 6.
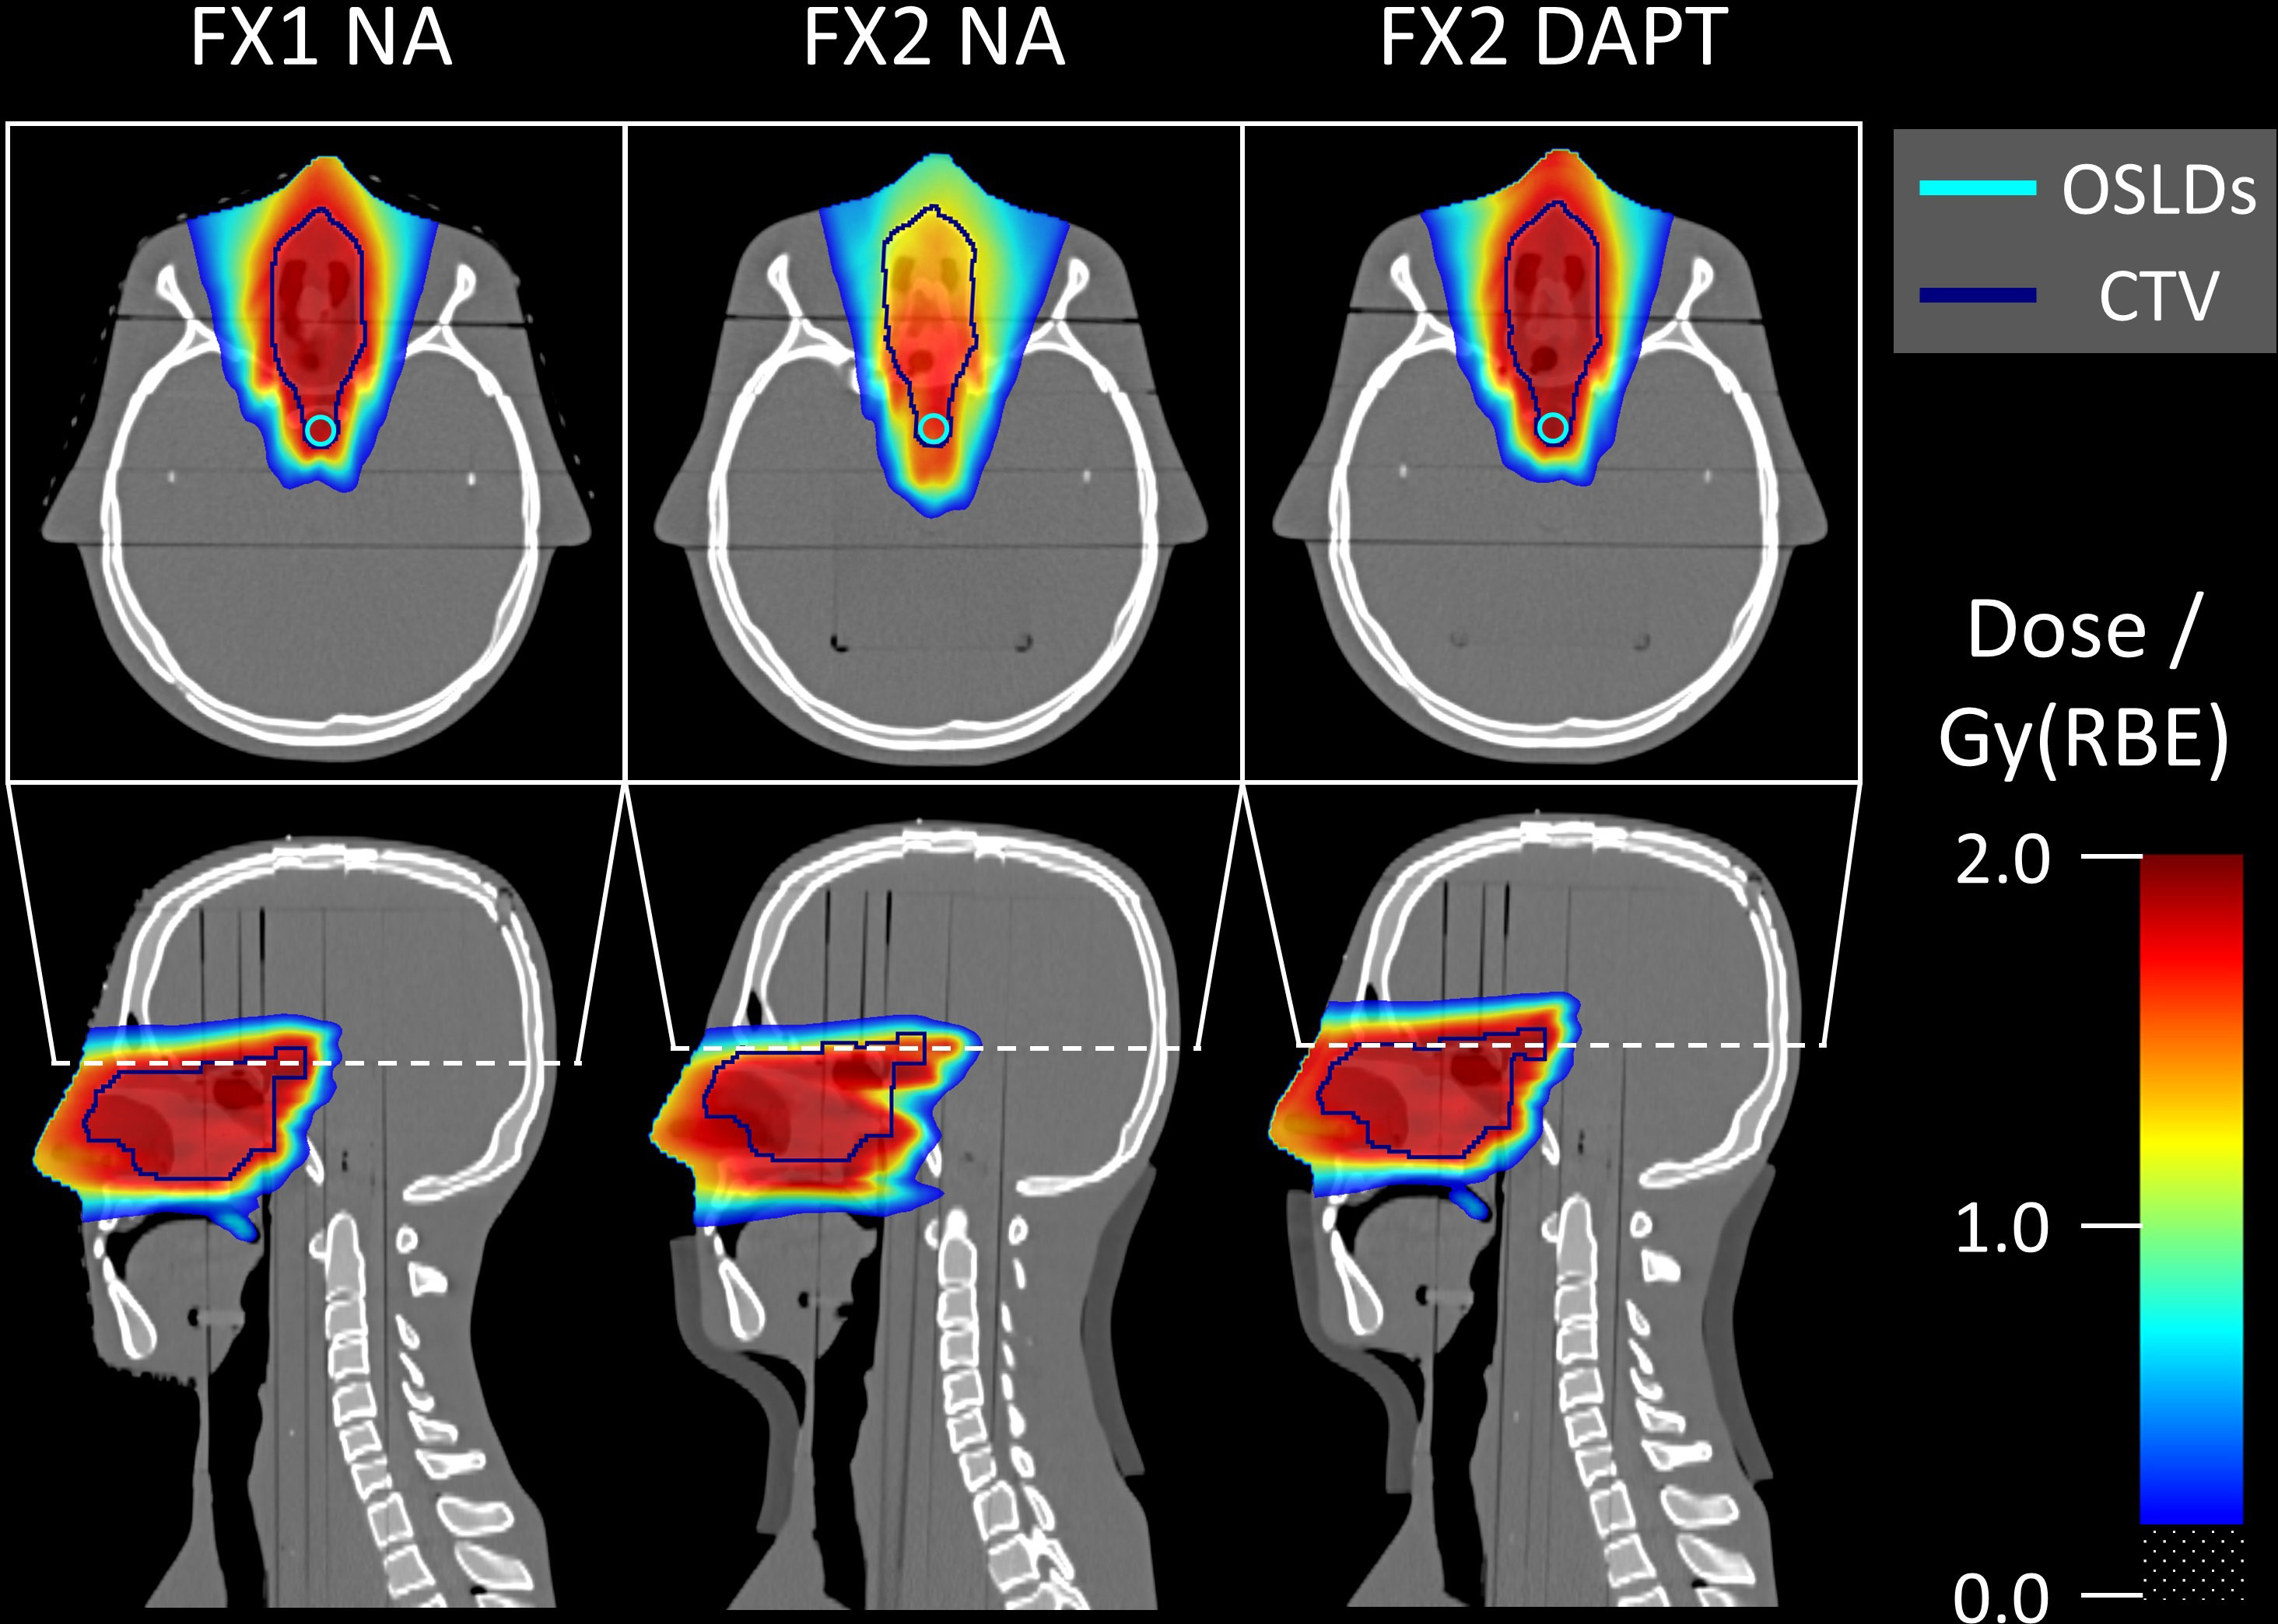
Figure 6 Monte Carlo simulated dose distributions superimposed on the CT scans. The single-slice OSLD contour used for Monte Carlo evaluation is visible on the axial slices. Fraction 1 represents the reference anatomy and positioning, matching the planning CT. Fraction 2 contains an offset and angle deviation caused by the introduced fat layer around the neck area. For fraction 2, DAPT considerably improves the dose conformity over NA. Doses below 0.2 Gy(RBE) are transparent in all slices.
Figure 6 shows the Monte Carlo dose distributions simulated for fractions 1 and 2. The dose distributions are superimposed on the axial and sagittal CT slices. FX1 NA represents the nominal reference plan delivered to the repositioned planning CT, while in FX2 NA the same plan is delivered to the mispositioned phantom (also including anatomical variations with the addition of a fat layer). The simulated underdose is clearly visible in both the axial and sagittal slices. Finally, DAPT restores the nominal dose conformity of FX1 NA by delivering the daily plan to fraction 2. Monte Carlo simulated LETD distributions are shown on the same CT slices in Figure 7. Higher LETD values are observed at the proton beam’s end-of-range. Due to the positioning and anatomical mismatch in fraction 2, these elevated LETD values penetrate more deeply into the spinal cord for the NA delivery scenario.
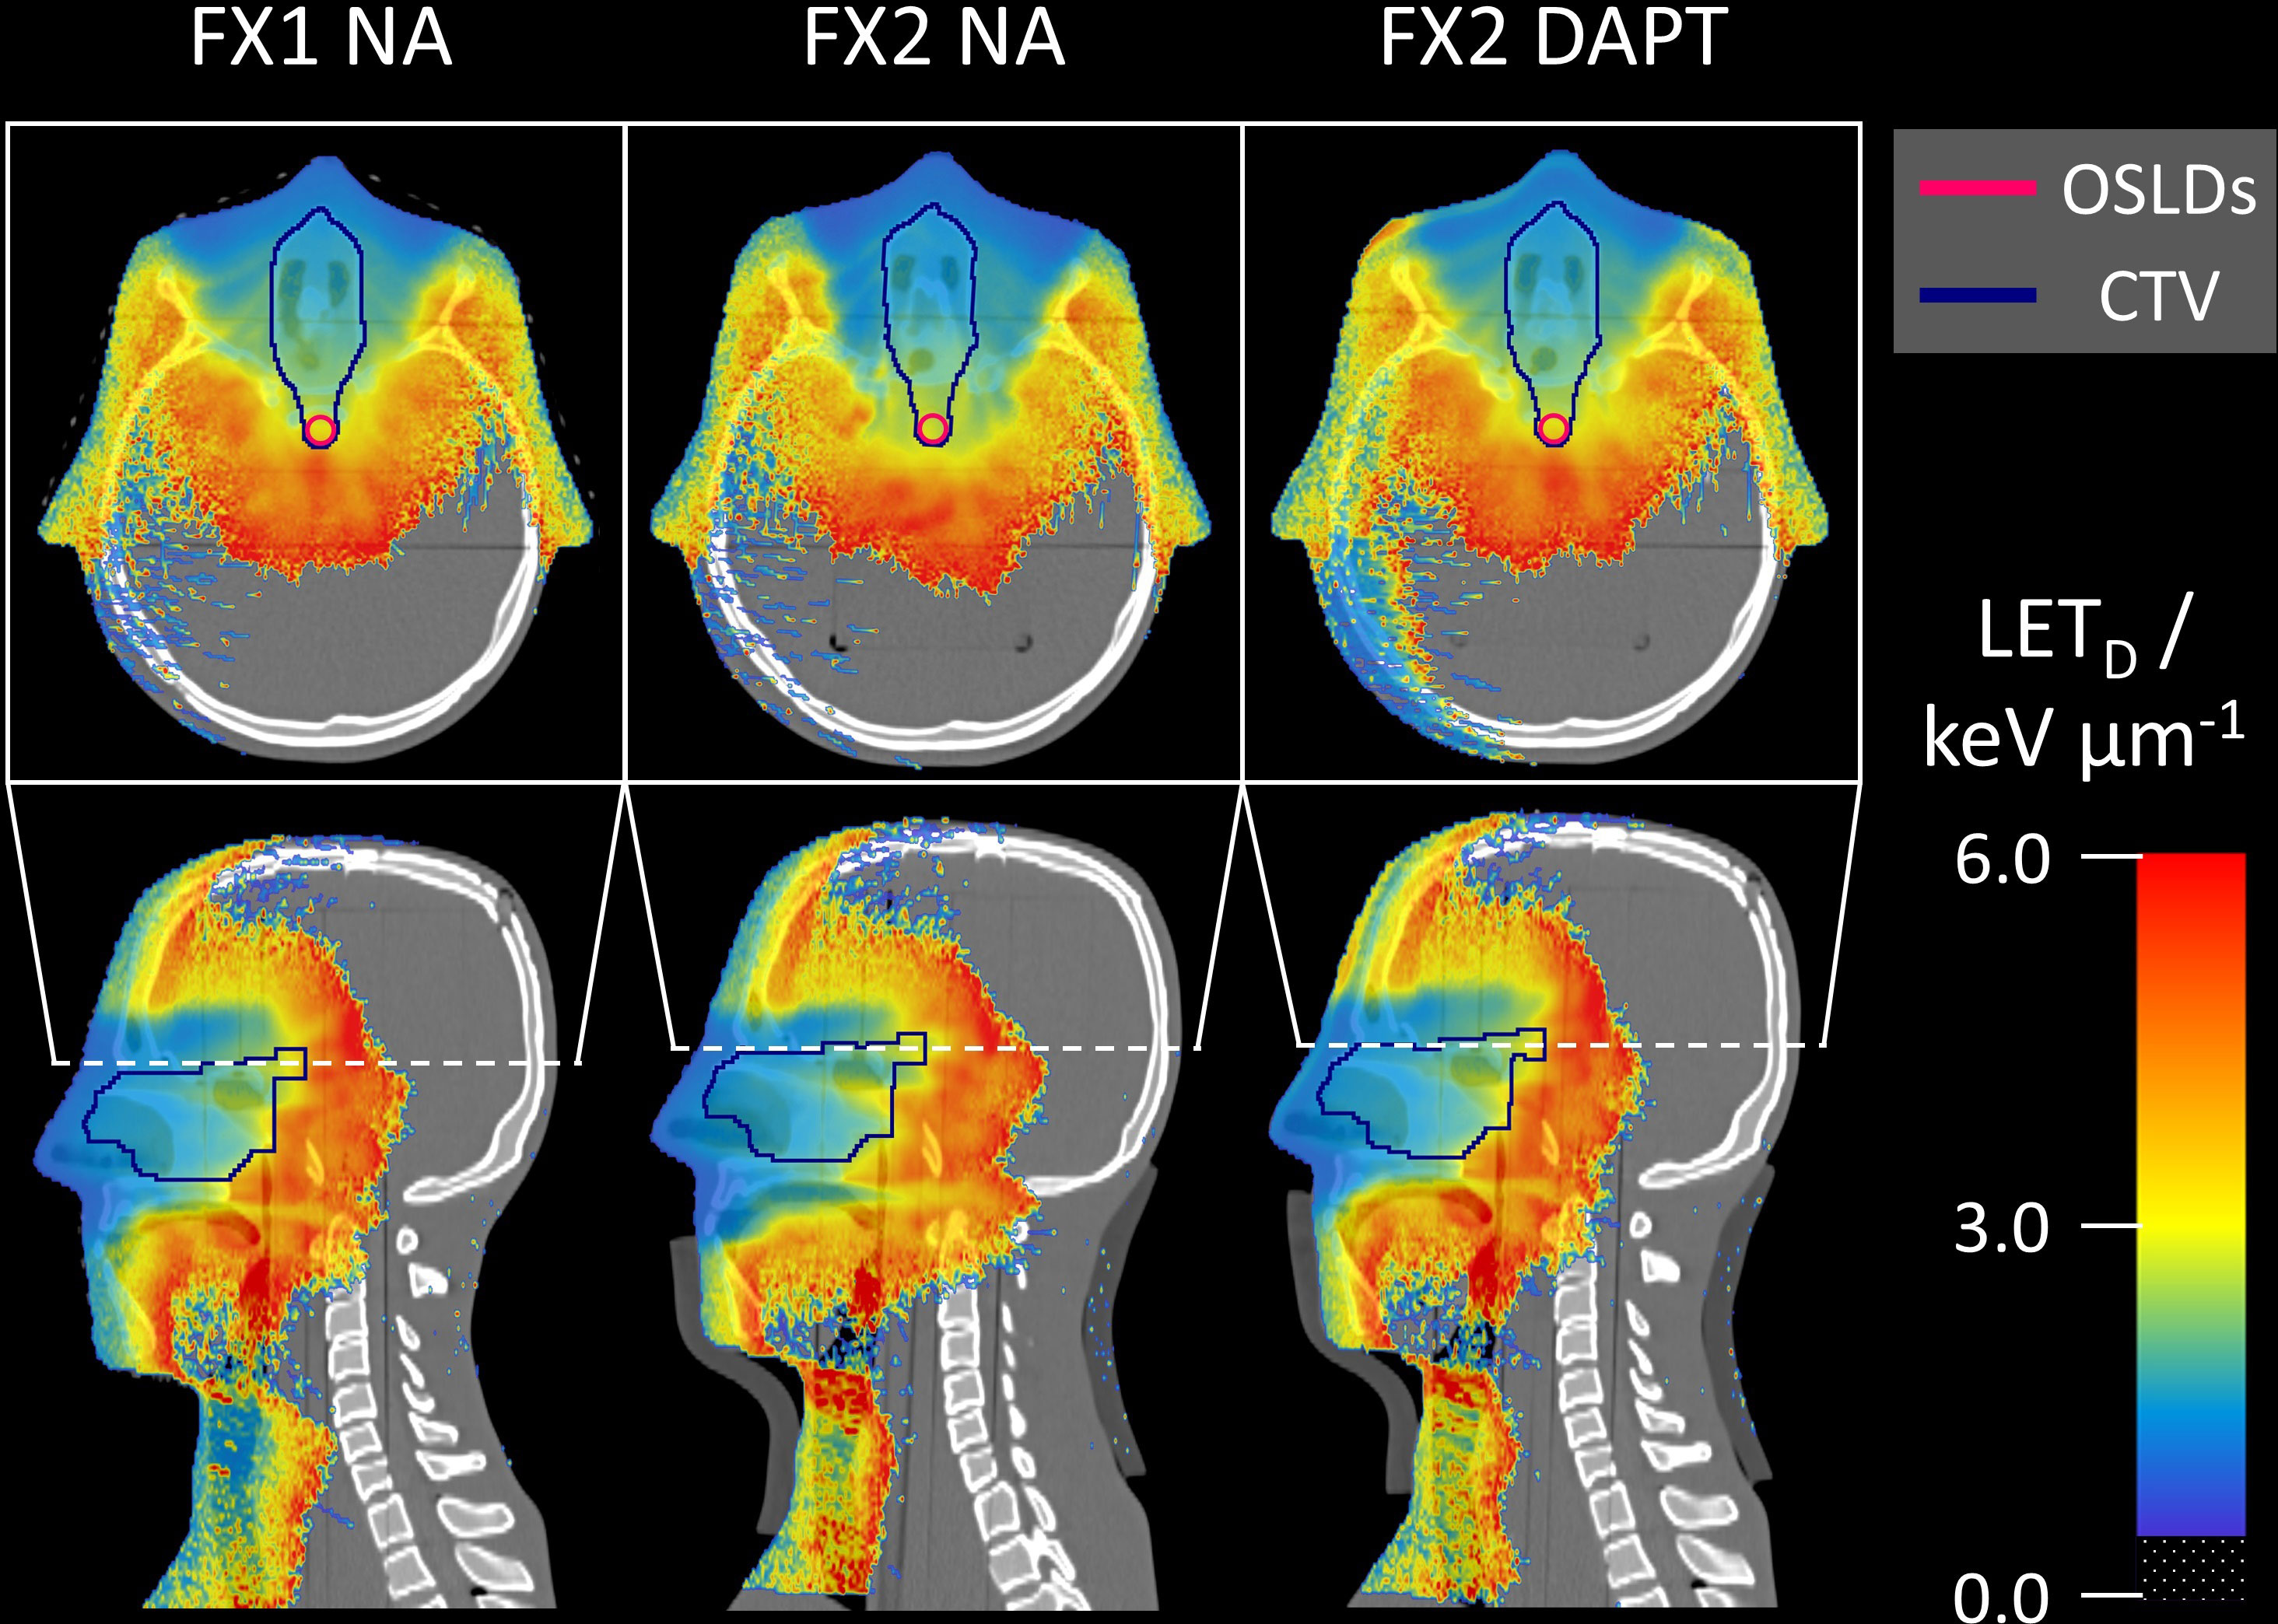
Figure 7 Monte Carlo simulated LETD distributions superimposed on the same CT slices as in Figure 6. For fraction 2, NA shows higher LETD values further downstream compared to DAPT, penetrating into the spinal cord. LETD values below 0.5 keV/μm are transparent in all slices.
4 Discussion
We demonstrated the first use of OSLDs for simultaneous dose and average LET determination in an anthropomorphic phantom for clinically plausible validation of a daily adaptive proton therapy treatment. These measurements allowed the verification of an online adaptive proton therapy workflow in terms of absolute dosimetry. The average LET was in this work only estimated as the LETD for protons to demonstrate an applicability for RBE assessment, but could also have been estimated with respect to e.g. fluence-averaging. We simultaneously measured the point dose and LETD in different geometries by varying the positioning and anatomy of a head-and-neck phantom. The Monte Carlo simulation results were in agreement with the OSLD measured values within uncertainties: The average relative error between the two was 1.4% and 3.2% for the doses and for the LETD, respectively. The good agreement between simulated and measured doses is a result of the high readout precision (< 1%) achievable with OSLDs, and the relatively low quenching correction factors (< 10%) estimated from the determined LETD. This is in contrast to OSLD dosimetry in carbon ion beams, where the quenching correction can exceed 50% and is the main contribution to the dose uncertainty with OSLDs (10).
The slightly larger relative LETD deviation can result from several contributions. The determination of the LETD relies on the UV/blue ratio from each OSLD, which is determined with a precision better than 0.6%, as the ratio of the two emission bands itself cancels out OSL material differences or sensitivity changes (7). Hence, the largest contribution to the LETD determination uncertainty with OSLDs arises from the experimentally determined LETD calibration curve in Figure 3C, where the (k=1) spread of the residuals is 1.8%, which is taken as an estimate of the systematic uncertainty. Due to the non-linearity of the LETD calibration curve, the combined uncertainty depends on the LETD value but is estimated to be around 2% (k=1). To improve the agreement between Monte Carlo simulations and experimental determination of the LETD, a more accurate LETD calibration curve is needed.
Nevertheless, the use of OSLDs to determine the average LET enabled a correction of the ionization quenched response, which would not have been feasible with standard dosimetric methods such as e.g. radiochromic film or other solid-state detectors without an inherent way of estimating the averaged LET. This is particularly relevant in our case since we measured the delivery close to the beam’s end-of-range, as shown in Figure 6. While in the nominal/reference scenario the OSLDs are within the homogeneous region of the SOBP, a positioning error (such as in fraction 2) can lead to a displacement of the detectors into the dose fall-off region, where high dose and/or LETD gradients can affect the measurements.
In addition, the novel experimental approach allowed us to verify underdosage in the target volume for delivery of the non-adapted reference plan to a modified phantom geometry (fraction 2). Applying the DAPT workflow to this fraction effectively restored the initially planned dose distribution, highlighting the efficacy of online adaptive proton therapy. As a result, our study measured and compared both adaptive and non-adaptive deliveries, a distinction from the previous experimental verification of DAPT (32), which measured only the adaptive delivery. Also, in that study, fractional changes were limited to adjustments in the nasal cavity fillings compared to the reference CT. In our study, DAPT was additionally tested for fractions with large offsets from the reference, verifying its applicability to more extreme cases. Another difference from the previous experiment was our use of OSLDs over radiochromic films, which allowed us to measure the absorbed dose rather than just a relative distribution.
While the use of OSLDs allowed for point-like measurements, seven OSLDs were employed to map the dose and LETD in the ROI. For radiation fields with sharp dose or LETD gradients, this presents a challenge due to the averaging of the signal over the 3-mm diameter OSLD surface. In our specific case, this was a greater concern for LETD than for dose measurements due to the high LET gradients within the ROI (Figures 6, 7). For this reason, our circular OSLD arrangement would ideally be replaced by high-resolution measurements with an OSLD film. Further investigations are planned to extend the dose and LETD determination from point to 2D measurements. Furthermore, the OSLD readout protocol used a two-week delay between irradiation and readout to minimize the effect of signal fading. For OSLDs to be used effectively in daily QA, modifications to this readout procedure are essential. For the same reason, real-time use of OSLDs is not feasible during online adaptive proton therapy treatments, where changes in patient anatomy and tumor motion can occur in the time frame of minutes to seconds (12). However, other clinical applications could potentially be envisioned for in vivo patient measurements, such as cases with cardiac devices or pregnant patients.
Limitations of our study include that the implementation of the PSI Gantry 2 beam model in MOQUI was only cross-validated with the treatment planning system and was never independently verified through direct measurements. In addition, there are inherent uncertainties in the delineation of the OSLD ROI contour on the planning CT, as well as image registration uncertainties for the contours propagated from the planning CT to the daily fraction images. Despite these aspects, there was a notable agreement between the Monte Carlo evaluation and both measured values of dose and LETD, highlighting the robustness of our methodology.
In conclusion, we found the OSLDs to be a suitable choice for the simultaneous measurement of the absolute point dose and LETD delivered by multi-field proton irradiation to an anthropomorphic phantom. This innovative approach allowed us to validate the efficacy of an online adaptive proton therapy workflow under clinically relevant conditions. The fact that OSLD detectors can be cut to almost any size and shape makes them perfectly suited for in-phantom measurements within a predefined ROI. While our focus was the experimental validation study of an online adaptive proton therapy workflow, the same approach could be applied to a variety of clinical innovation projects and workflow developments that require accurate measurements of the point dose and LET.
Data availability statement
The raw data supporting the conclusions of this article will be made available by the authors, without undue reservation.
Author contributions
MB: Conceptualization, Data curation, Formal analysis, Investigation, Methodology, Resources, Software, Validation, Visualization, Writing – original draft, Writing – review & editing. JC: Conceptualization, Data curation, Formal analysis, Investigation, Methodology, Resources, Software, Validation, Visualization, Writing – original draft, Writing – review & editing. HL: Methodology, Resources, Software, Validation, Writing – review & editing. EC: Investigation, Methodology, Writing – review & editing. KC: Funding acquisition, Investigation, Methodology, Writing – review & editing. MT: Methodology, Resources, Writing – review & editing. SS: Writing – review & editing, Resources, Software. EY: Funding acquisition, Methodology, Supervision, Writing – review & editing. BW: Methodology, Supervision, Writing – review & editing. AL: Funding acquisition, Methodology, Resources, Supervision, Writing – review & editing. HP: Funding acquisition, Methodology, Supervision, Writing – review & editing. FA: Funding acquisition, Methodology, Resources, Supervision, Writing – review & editing. KN: Conceptualization, Data curation, Formal analysis, Funding acquisition, Methodology, Resources, Supervision, Validation, Writing – original draft, Writing – review & editing.
Funding
The author(s) declare financial support was received for the research, authorship, and/or publication of this article. This work was funded by the National Cancer Institute (NCI), grant number R01 CA229178. KN was supported by the Swiss National Science Foundation (SNSF), grant number 191125. The Risø TL/OSL-DA-20 reader (DTU Nutech, Denmark) was acquired with partial support from the SNSF (R’Equip project 206021_177028). EC and KC have received funding from the European Union’s Horizon 2020 Marie Skłodowska-Curie Actions under Grant Agreement No. 955956. KC has also received funding from the European Union’s Horizon 2020 research and innovation program under the Marie Skłodowska-Curie Grant Agreement No. 884104 (PSI-FELLOW-III-3i) and the Krebsliga grant (KFS-5660-08-2022). The article processing charge was funded by ETH Zurich.
Conflict of interest
The authors declare that the research was conducted in the absence of any commercial or financial relationships that could be construed as a potential conflict of interest.
Publisher’s note
All claims expressed in this article are solely those of the authors and do not necessarily represent those of their affiliated organizations, or those of the publisher, the editors and the reviewers. Any product that may be evaluated in this article, or claim that may be made by its manufacturer, is not guaranteed or endorsed by the publisher.
References
1. Paganetti H, Blakely E, Carabe-Fernandez A, Carlson DJ, Das IJ, Dong L, et al. Report of the AAPM TG-256 on the relative biological effectiveness of proton beams in radiation therapy. Med Phys (2019) 46:e53–78. doi: 10.1002/mp.13390
2. Grün R, Friedrich T, Traneus E, Scholz M. Is the dose-averaged LET a reliable predictor for the relative biological effectiveness? Med Phys (2019) 46:1064–74. doi: 10.1002/mp.13347
3. Underwood TSA, McNamara AL, Appelt A, Haviland JS, Sørensen BS, Troost EGC. A systematic review of clinical studies on variable proton Relative Biological Effectiveness (RBE). Radiotherapy Oncol (2022) 175:79–92. doi: 10.1016/j.radonc.2022.08.014
4. Angellier G, Gautier M, Hérault J. Radiochromic EBT2 film dosimetry for low-energy protontherapy. Med Phys (2011) 38:6171–7. doi: 10.1118/1.3654161
5. Vana N, Schöner W, Fugger M, Akatov Y. Absorbed dose measurement and LET determination with TLDs in space. Radiat Prot Dosimetry (1996) 66:145–52. doi: 10.1093/oxfordjournals.rpd.a031703
6. Sawakuchi GO, Sahoo N, Gasparian P, Rodriguez M, Archambault L, Titt U, et al. Determination of average LET of therapeutic proton beams using Al2O3:C optically stimulated luminescence (OSL) detectors. Phys Med Biol (2010) 55:4963–76. doi: 10.1088/0031-9155/55/17/006
7. Christensen JB, Togno M, Bossin L, Pakari OV, Safai S, Yukihara EG. Improved simultaneous LET and dose measurements in proton therapy. Sci Rep (2022) 12:8262. doi: 10.1038/s41598-022-10575-4
8. Granville D, Sahoo N, Sawakuchi GO. Calibration of the Al2O3:C optically stimulated luminescence (OSL) signal for linear energy transfer (LET) measurements in therapeutic proton beams. Phys Med Biol (2014) 59:4295–310. doi: 10.1088/0031-9155/59/15/4295
9. Yukihara EG, Doull BA, Ahmed M, Brons S, Tessonnier T, Jäkel O, et al. Time-resolved optically stimulated luminescence of Al2O3:C for ion beam therapy dosimetry. Phys Med Biol (2015) 60:6613–38. doi: 10.1088/0031-9155/60/17/6613
10. Christensen JB, Muñoz ID, Bassler N, Stengl C, Bossin L, Togno M, et al. Optically stimulated luminescence detectors for dosimetry and LET measurements in light ion beams. Phys Med Biol (2023) 68:155001–1. doi: 10.1088/1361-6560/acdfb0
11. Paganetti H, Botas P, Sharp GC, Winey BA. Adaptive proton therapy. Phys Med Biol (2021) 66. doi: 10.1088/1361-6560/ac344f
12. Albertini F, Matter M, Nenoff L, Zhang Y, Lomax AJ. Online daily adaptive proton therapy. Br J Radiol (2020) 93:20190594. doi: 10.1259/bjr.20190594.
13. Qiu Z, Olberg S, den Hertog D, Ajdari A, Bortfeld T, Pursley J. Online adaptive planning methods for intensity-modulated radiotherapy. Phys Med Biol (2023) 68:10TR01–1. doi: 10.1088/1361-6560/accdb2
14. Kurz C, Nijhuis R, Reiner M, Ganswindt U, Thieke C, Belka C, et al. Feasibility of automated proton therapy plan adaptation for head and neck tumors using cone beam CT images. Radiat Oncol (2016) 11. doi: 10.1186/s13014-016-0641-7
15. Jagt T, Breedveld S, van de Water S B, Heijmen M. Hoogeman. Near real-time automated dose restoration in IMPT to compensate for daily tissue density variations in prostate cancer. Phys Med Biol (2017) 62:4254–72. doi: 10.1088/1361-6560/aa5c12
16. Moriya S, Tachibana H, Hotta K, Nakamura N, Sakae T, Akimoto T. Range optimization for target and organs at risk in dynamic adaptive passive scattering proton beam therapy – A proof of concept. Physica Med (2018) 56:66–73. doi: 10.1016/j.ejmp.2018.11.010
17. Bernatowicz K, Geets X, Barragan A, Janssens G, Souris K, Sterpin E. Feasibility of online IMPT adaptation using fast, automatic and robust dose restoration. Phys Med Biol (2018) 63:085018. doi: 10.1088/1361-6560/aaba8c
18. Botas P, Kim J, Winey BA, Paganetti H. Online adaption approaches for intensity modulated proton therapy for head and neck patients based on cone beam CTs and Monte Carlo simulations. Phys Med Biol (2018) 64:015004. doi: 10.1088/1361-6560/aaf30b
19. Jagt T, Breedveld S, van Haveren R, Heijmen B, Hoogeman M. An automated planning strategy for near real-time adaptive proton therapy in prostate cancer. Phys Med Biol (2018) 63:135017–7. doi: 10.1088/1361-6560/aacaa7
20. Jagt T, Breedveld S, van Haveren R, Nout RA, Astreinidou E, Heijmen B, et al. Plan-library supported automated replanning for online-adaptive intensity-modulated proton therapy of cervical cancer. Acta Oncol (2019) 58:1440–5. doi: 10.1080/0284186x.2019.1627414
21. Matter M, Nenoff L, Meier G, Weber DC, Lomax AJ, Albertini F. Intensity modulated proton therapy plan generation in under ten seconds. Acta Oncol (2019) 58:1435–9. doi: 10.1080/0284186x.2019.1630753
22. Nenoff L, Matter M, Hedlund Lindmar J, Weber DC, Lomax AJ, Albertini F. Daily adaptive proton therapy – the key to innovative planning approaches for paranasal cancer treatments. Acta Oncol (2019) 58:1423–8. doi: 10.1080/0284186x.2019.1641217
23. Matter M, Nenoff L, Marc L, Weber DC, Lomax AJ, Albertini F. Update on yesterday’s dose—Use of delivery log-files for daily adaptive proton therapy (DAPT). Phys Med Biol (2020) 65:195011. doi: 10.1088/1361-6560/ab9f5e
24. Nenoff L, Matter M, Jarhall AG, Winterhalter C, Gorgisyan J, Josipovic M, et al. Daily adaptive proton therapy: is it appropriate to use analytical dose calculations for plan adaption? Int J Radiat OncologyBiologyPhysics (2020) 107:747–55. doi: 10.1016/j.ijrobp.2020.03.036
25. Bobić M, Lalonde A, Sharp GC, Grassberger C, Verburg JM, Winey BA, et al. Comparison of weekly and daily online adaptation for head and neck intensity-modulated proton therapy. Phys Med Biol (2021) 66:055023. doi: 10.1088/1361-6560/abe050
26. Lalonde A, Bobić M, Winey BA, Verburg JM, Sharp GC, Paganetti H. Anatomic changes in head and neck intensity-modulated proton therapy: Comparison between robust optimization and online adaptation. Radiotherapy Oncol (2021) 159:39–47. doi: 10.1016/j.radonc.2021.03.008
27. Nesteruk KP, Bobić M, Lalonde A, Winey BA, Lomax AJ, Paganetti H. CT-on-Rails versus in-Room CBCT for Online Daily Adaptive Proton Therapy of Head-and-Neck Cancers. Cancers (2021) 13:5991. doi: 10.3390/cancers13235991
28. Nesteruk KP, Bobić M, Sharp GC, Lalonde A, Winey BA, Nenoff L, et al. Low-dose computed tomography scanning protocols for online adaptive proton therapy of head-and-neck cancers. Cancers (2022) 14:5155. doi: 10.3390/cancers14205155
29. Bobić M, Lalonde A, Nesteruk KP, Lee H, Nenoff L, Gorissen BL, et al. Large anatomical changes in head-and-neck cancers – A dosimetric comparison of online and offline adaptive proton therapy. Clin Trans Radiat Oncol (2023) 40:100625–5. doi: 10.1016/j.ctro.2023.100625
30. Lalonde A, Bobić M, Sharp GC, Chamseddine I, Winey BA, Paganetti H. Evaluating the effect of setup uncertainty reduction and adaptation to geometric changes on normal tissue complication probability using online adaptive head and neck intensity modulated proton therapy. Phys Med Biol (2023) 68:115018–8. doi: 10.1088/1361-6560/acd433
31. Pedroni E, Bearpark R, Böhringer T, Coray A, Duppich J, Forss S, et al. The PSI Gantry 2: a second generation proton scanning gantry. Z für Medizinische Physik (2004) 14:25–34. doi: 10.1078/0939-3889-00194
32. Nenoff L, Matter M, Charmillot M, Krier S, Uher K, Weber DC, et al. Experimental validation of daily adaptive proton therapy. Phys Med Biol (2021) 66:205010. doi: 10.1088/1361-6560/ac2b84
33. Safai S, Bula C, Meer D, Pedroni E. Improving the precision and performance of proton pencil beam scanning. Trans Cancer Res (2012) 1:196–206. doi: 10.21037/599
34. Marks LB, Yorke ED, Jackson A, Ten Haken RK, Constine LS, Eisbruch A, et al. The use of normal tissue complication probability (NTCP) models in the clinic. Int J Radiat oncology biology Phys (2010) 76:S10–9. doi: 10.1016/j.ijrobp.2009.07.1754
35. Ahmed MF, Eller SA, Schnell E, Ahmad S, Akselrod MS, Hanson OD, et al. Development of a 2D dosimetry system based on the optically stimulated luminescence of Al2O3. Radiat Measurements (2014) 71:187–92. doi: 10.1016/j.radmeas.2014.01.009
36. Yukihara EG, McKeever SWS. Spectroscopy and optically stimulated luminescence of Al2O3:C using time-resolved measurements. J Appl Phys (2006) 100. doi: 10.1063/1.2357344
37. Christensen JB, Togno M, Nesteruk KP, Psoroulas S, Meer D, Weber DC, et al. Al2O3:C optically stimulated luminescence dosimeters (OSLDs) for ultra-high dose rate proton dosimetry. Phys Med Biol (2021) 66:085003. doi: 10.1088/1361-6560/abe554
38. Yukihara EG, McKeever SWS, Andersen CE, Bos AJJ, Bailiff IK, Yoshimura EM, et al. Luminescence dosimetry. Nat Rev Methods Primers (2022) 2. doi: 10.1038/s43586-022-00102-0
39. Yukihara EG, Christensen JB, Togno M. Demonstration of an optically stimulated luminescence (OSL) material with reduced quenching for proton therapy dosimetry: MgB4O7:Ce,Li. Radiat Measurements (2022) 152:106721. doi: 10.1016/j.radmeas.2022.106721
40. Nascimento LF, Leblans P, van der Heyden B, Akselrod MS, Goossens J, Verellen D, et al. Characterization and quenching correction for a 2D real time radioluminescent system in therapeutic proton and carbon charged beams. Sensors Actuators A: Phys (2022) 345:113781–1. doi: 10.1016/j.sna.2022.113781
41. Gambarini G, Artuso E, Camoni G, Colombo G, Felisi M, Gebbia A, et al. Let quenching correction in solid state dosimeters. Physica Med (2016) 32:245–5. doi: 10.1016/j.ejmp.2016.07.517
42. Lee H, Shin J, Verburg JM, Bobić M, Winey BA, Schuemann J, et al. MOQUI: an open-source GPU-based Monte Carlo code for proton dose calculation with efficient data structure. Phys Med Biol (2022) 67:174001. doi: 10.1088/1361-6560/ac8716
Keywords: OSLD, optically stimulated luminescence, proton therapy dosimetry, LET measurement, adaptive proton therapy, Monte Carlo, head and neck phantom, intensity-modulated proton therapy
Citation: Bobić M, Christensen JB, Lee H, Choulilitsa E, Czerska K, Togno M, Safai S, Yukihara EG, Winey BA, Lomax AJ, Paganetti H, Albertini F and Nesteruk KP (2024) Optically stimulated luminescence dosimeters for simultaneous measurement of point dose and dose-weighted LET in an adaptive proton therapy workflow. Front. Oncol. 13:1333039. doi: 10.3389/fonc.2023.1333039
Received: 04 November 2023; Accepted: 18 December 2023;
Published: 08 January 2024.
Edited by:
Chia-ho Hua, St. Jude Children’s Research Hospital, United StatesReviewed by:
Paige Taylor, University of Texas MD Anderson Cancer Center, United StatesLuana De Freitas Nascimento, Belgian Nuclear Research Centre (SCK CEN), Belgium
Copyright © 2024 Bobić, Christensen, Lee, Choulilitsa, Czerska, Togno, Safai, Yukihara, Winey, Lomax, Paganetti, Albertini and Nesteruk. This is an open-access article distributed under the terms of the Creative Commons Attribution License (CC BY). The use, distribution or reproduction in other forums is permitted, provided the original author(s) and the copyright owner(s) are credited and that the original publication in this journal is cited, in accordance with accepted academic practice. No use, distribution or reproduction is permitted which does not comply with these terms.
*Correspondence: Mislav Bobić, bWlzbGF2LmJvYmljQGFsdW1uaS5ldGh6LmNo; bWJvYmljQG1naC5oYXJ2YXJkLmVkdQ==
†These authors have contributed equally to this work and share first authorship
‡ORCID: Mislav Bobić, orcid.org/0000-0002-9409-8680
Jeppe B. Christensen, orcid.org/0000-0002-6894-381X
Hoyeon Lee, orcid.org/0000-0002-1165-1509
Evangelia Choulilitsa, orcid.org/0009-0004-4940-9680
Katarzyna Czerska, orcid.org/0000-0001-5022-6655
Michele Togno, orcid.org/0000-0001-6840-814X
Sairos Safai, orcid.org/0000-0002-0459-4534
Eduardo G. Yukihara, orcid.org/0000-0002-4615-6698
Brian A. Winey, orcid.org/0000-0002-3894-3755
Harald Paganetti, orcid.org/0000-0002-6257-2413
Francesca Albertini, orcid.org/0000-0002-2547-1269
Konrad P. Nesteruk, orcid.org/0000-0002-7482-2264