 Yinping Leng1
 Shuhao Li
 Yu Wang
 Lianggeng Gong
- 1Department of Radiology, the Second Affiliated Hospital of Nanchang University, Nanchang, China
- 2Clinical and Technical Support, Philips Healthcare, Shanghai, China
Background: Ovarian cancer (OC) is the most lethal tumor within the female reproductive system. Medical imaging plays a significant role in diagnosis and monitoring OC. This study aims to use bibliometric analysis to explore the current research hotspots and collaborative networks in the application of medical imaging in OC from 2000 to 2022.
Methods: A systematica search for medical imaging in OC was conducted on the Web of Science Core Collection on August 9, 2023. All reviews and articles published from January 2000 to December 2022 were downloaded, and an analysis of countries, institutions, journals, keywords, and collaborative networks was perfomed using CiteSpace and VOSviewer.
Results: A total of 5,958 publications were obtained, demonstrating a clear upward trend in annual publications over the study peroid. The USA led in productivity with 1,373 publications, and Harvard University emerged as the most prominent institution with 202 publications. Timmerman D was the most prolific contributor with 100 publications, and Gynecological Oncology led in the number of publications with 296. The top three keywords were “ovarian cancer” (1,256), “ultrasound” (725), and “diagnosis” (712). In addition, “pelvic masses” had the highest burst strength (25.5), followed by “magnetic resonance imaging (MRI)” (21.47). Recent emergent keywords such as “apoptosis”, “nanoparticles”, “features”, “accuracy”, and “human epididymal protein 4 (HE 4)” reflect research trends in this field and may become research hotspots in the future.
Conclusion: This study provides a comprehensive summary of the key contributions of OC imaging to field’s development over the past 23 years. Presently, primary areas of OC imaging research include MRI, targeted therapy of OC, novel biomarker (HE 4), and artificial intelligence. These areas are expected to influence future research endeavors in this field.
Introduction
Ovarian cancer (OC) is the most lethal tumor of the female reproductive system (1). The absence of early clinical manifestations and effective screening techniques contributes to approximately 70% of patients being diagnosed at an advanced stage (2). The primary therapeutic approach for OC involves a combination of cytoreductive surgery and adjuvant chemotherapy (3). Despite notable advancements in chemotherapy and targeted therapy for OC, the prognosis remains unfavorable, with a 5-year overall survival rate ranging from 40% to 45% (4). Medical imaging, such as computed tomography (CT), magnetic resonance imaging (MRI), and positron emission tomography (PET)/CT, has been extensively employed for preoperative diagnosis, staging, treatment guidance, and prognostic assessment of OC (5–7). The utilization of medical imaging holds promise in enhancing the survival rate of OC patients through early detection and intervention (8). Over the past few decades, there has been a notable surge in the volume of scholarly publications pertaining to OC imaging across diverse academic domains (9). However, in the extensive literature database, it is often challenging for researchers to obtain a comprehensive and updated overview of the research trends and hotspots in this field.
Mathematical and statistical techniques are employed in bibliometrics to analyze published research regarding a specific subject area (10). This methodology allows not only the evaluation of research quality but also the identification of developing research trends and the prediction of possible future research directions (11, 12). Previous studies have utilized bibliometric analysis to examine prominent research topics and studies concerning OC (13–15). Duan’s research revealed that platinum-resistant OC is primarily focused on identifying populations that can benefit from immunotherapy alongside the practical implementation of immune checkpoint inhibitors (13). Baghban’s findings indicated an increasing trend in the research of extracellular vesicles and epithelial ovarian cancer (14). Conducting bibliometric analysis of literature pertaining to OC from various perspectives can aid in identifying research priorities within this domain while also presenting academic researchers with opportunities for collaboration (16, 17). However, the current research status, development trends, and future research directions of OC imaging are still unclear.
This study aims to use CiteSpace and VOSviewer for visual analysis, evaluate the current research status and development trends of OC imaging, and determine and summarize future research directions in this field.
Materials and methods
Data sources and search strategy
We conducted a literature search on August 9, 2023, to retrieve published literature from January 2000 to December 2022 from the Science Citation Index-Expanded (SCIE) of the Web of Science Core Collection (WoSCC). To avoid the bias of database updates, all searches were performed on the same day. The search strategy used was as follows: (TS = ((“ovarian neoplasm*”) OR (“ovarian cancer*”) OR (“ovarian carcinoma”) OR (“ovary cancer*”) OR (“ovary tumo*”) OR (“ovary neoplasm*”) OR (“ovary carcinoma”) OR (“ovarian tumo*”) OR (“cancer of ovary”) OR (“ovarian malignan*”) OR (“malignant ovarian*”)) AND TS = ((“CT”) OR (“computed tomography”) OR (“compute tomography”) OR (“magnetic resonance imaging”) OR (“MRI”) OR (“MR”) OR (“positron emission tomography”) OR (“PET”) OR (“single photon emission computed tomography”) OR (“SPECT”) OR (“ultrasonography”) OR (“ultrasound”))) AND FPY=(2000-2022). This study included only “articles” and “reviews” as publication types to ensure representativeness. Moreover, only documents written in English were considered. Two reviewers (YL and XW) independently screened the raw data extracting publications from WoSCC and eliminating duplicate/irrelevant documents. In cases of discrepancies, a third reviewer (LG) independently helped resolve them. The data were saved as a text file with Full Record and Cited References. A total of 5,958 publications were prepared for subsequent visual analysis. The study flowchart is presented in Figure 1. All data in this study were directly obtained from the database, and as no patients were involved, ethical declarations or approvals are not applicable.
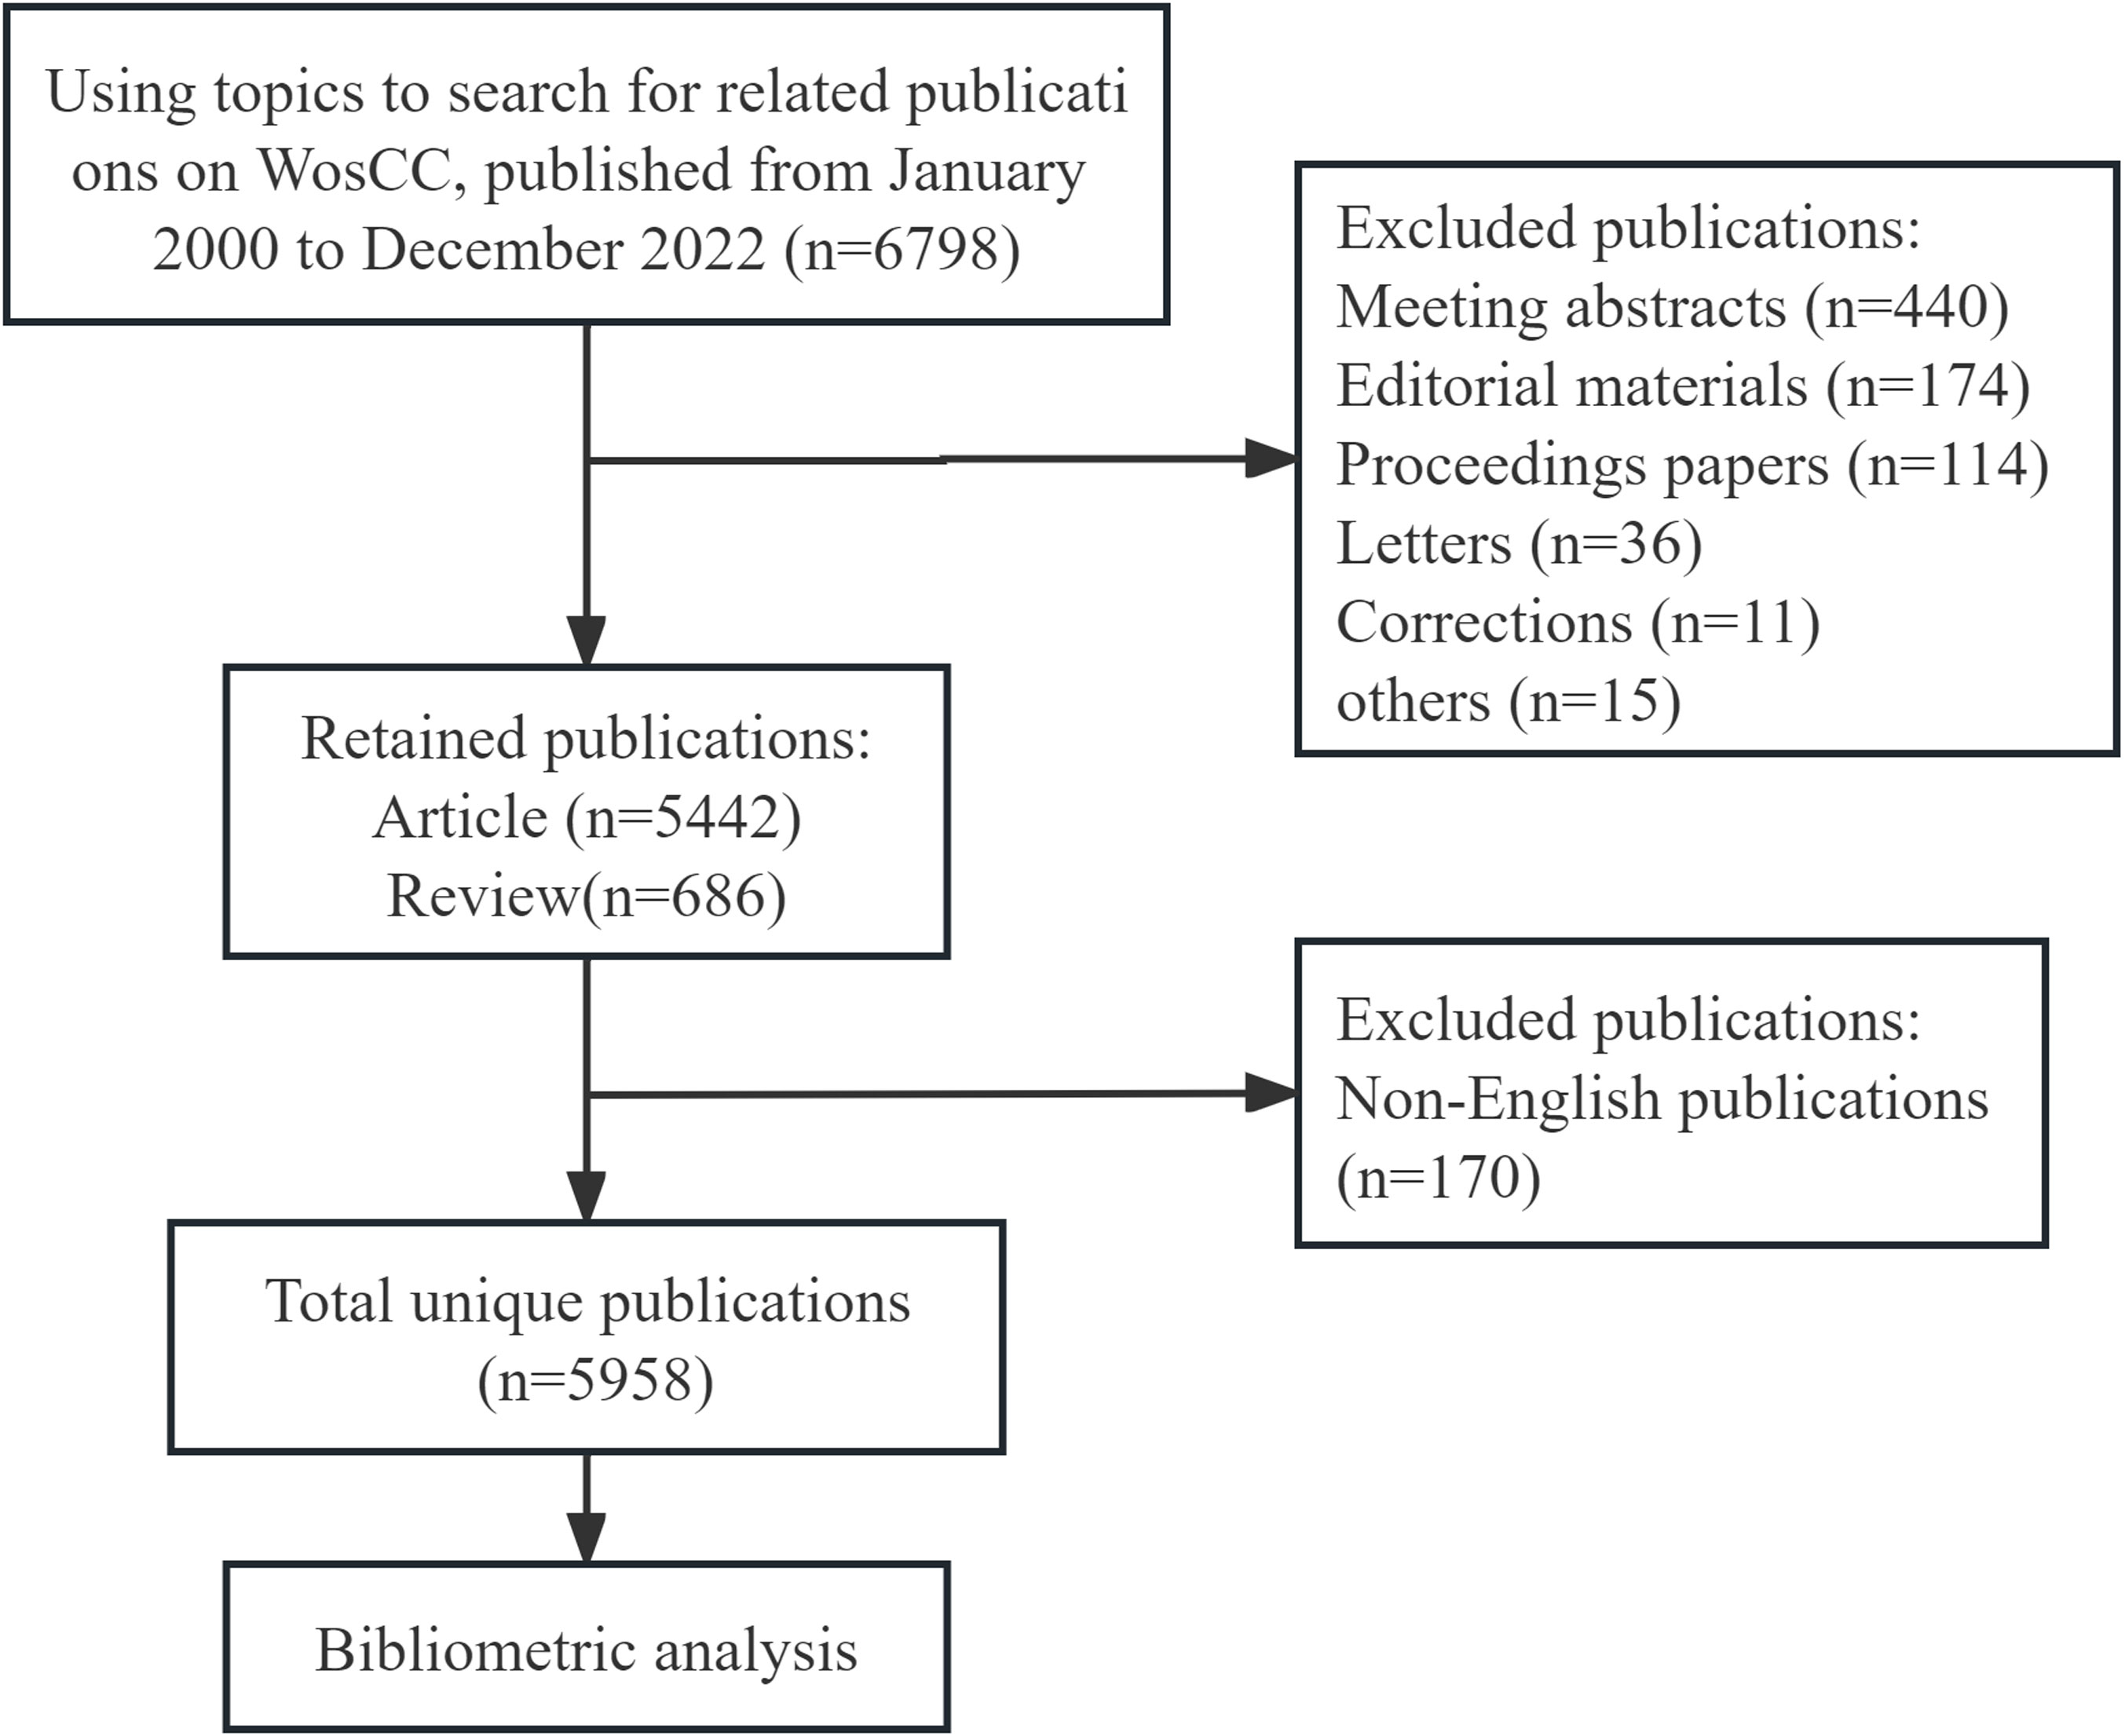
Figure 1 Flow chart of this study.
Data analysis and visualization
The bibliometric indicators included Price’s law, Lotka law, and Bradford’s law. Price’s law, a bibliometric production indicator, measures the productivity of a discipline or a country (18). Lotka uses the number of articles published to describe the frequency distribution of scientific productivity, often referred to as the “inverse square law of scientific production” (19). Bradford’s law, another bibliometric indicator, measures the dispersion of scientific information, illustrating the distribution of scientific literature within specific disciplines (20). Bradford proposed an information density-decreasing concentric zone productivity model.
The number of annual publications was imported into Excel 2019 and further analyzed to identify trends. CiteSpace (version 6.2.R4) was used to create knowledge maps of journals, institution co-authorship, references co-occurrences, and keyword co-occurrences. Time slices were set to 1 year per slice, and the g-index was selected as criteria for selection. The network pruning method was used for pruning. In the visual network maps, the size of nodes reflects the number of publications or the frequency of citations, while the connections between nodes indicate the strength of the connections. To detect emerging trends and sudden changes in research frontiers, the software’s “burst detection” and “betweenness centrality” functions were applied. Betweenness centrality is an index based on tree hole theory that measures the centrality of nodes in a network (21). Using CiteSpace with this index, the importance of relevant literature was measured, and purple circles indicated nodes with centrality greater than 0.1. The analysis of countries, co-cited countries, and co-cited institutions were performed using VOSviewer (version 1.6.19). Nodes and linear connections were present in the visual knowledge graph. Nodes in the graph represent key points, and node size represents the frequency of occurrence and citation.
Results
This study examined 5,958 publications, including 5,299 articles (88.9%) and 659 reviews (11.1%). Our investigation showed that 26,643 authors from 3,958 institutions across 84 countries contributed to the production of 5,958 manuscripts in this study. These works were published in 1,186 journals, citing 126,115 references from 12,959 journals.
Trends in publications
To comprehend the evolution of related research, we examined the annual publication trends. The study period exhibited a discernible upward trajectory in annual publications (Figure 2). Moreover, the analysis indicated an average yearly production was around 259 studies, with 2022 recording the highest number of publications. Figure 2 also illustrates the change in cumulative publications along the trend line, which followed the equation y = 268.49e0.1505x, with a correlation coefficient of 0.970, in accordance with Price’s law of exponential growth. The doubling time was determined to be 4.61 years, and the annual growth rate was 16.24%.
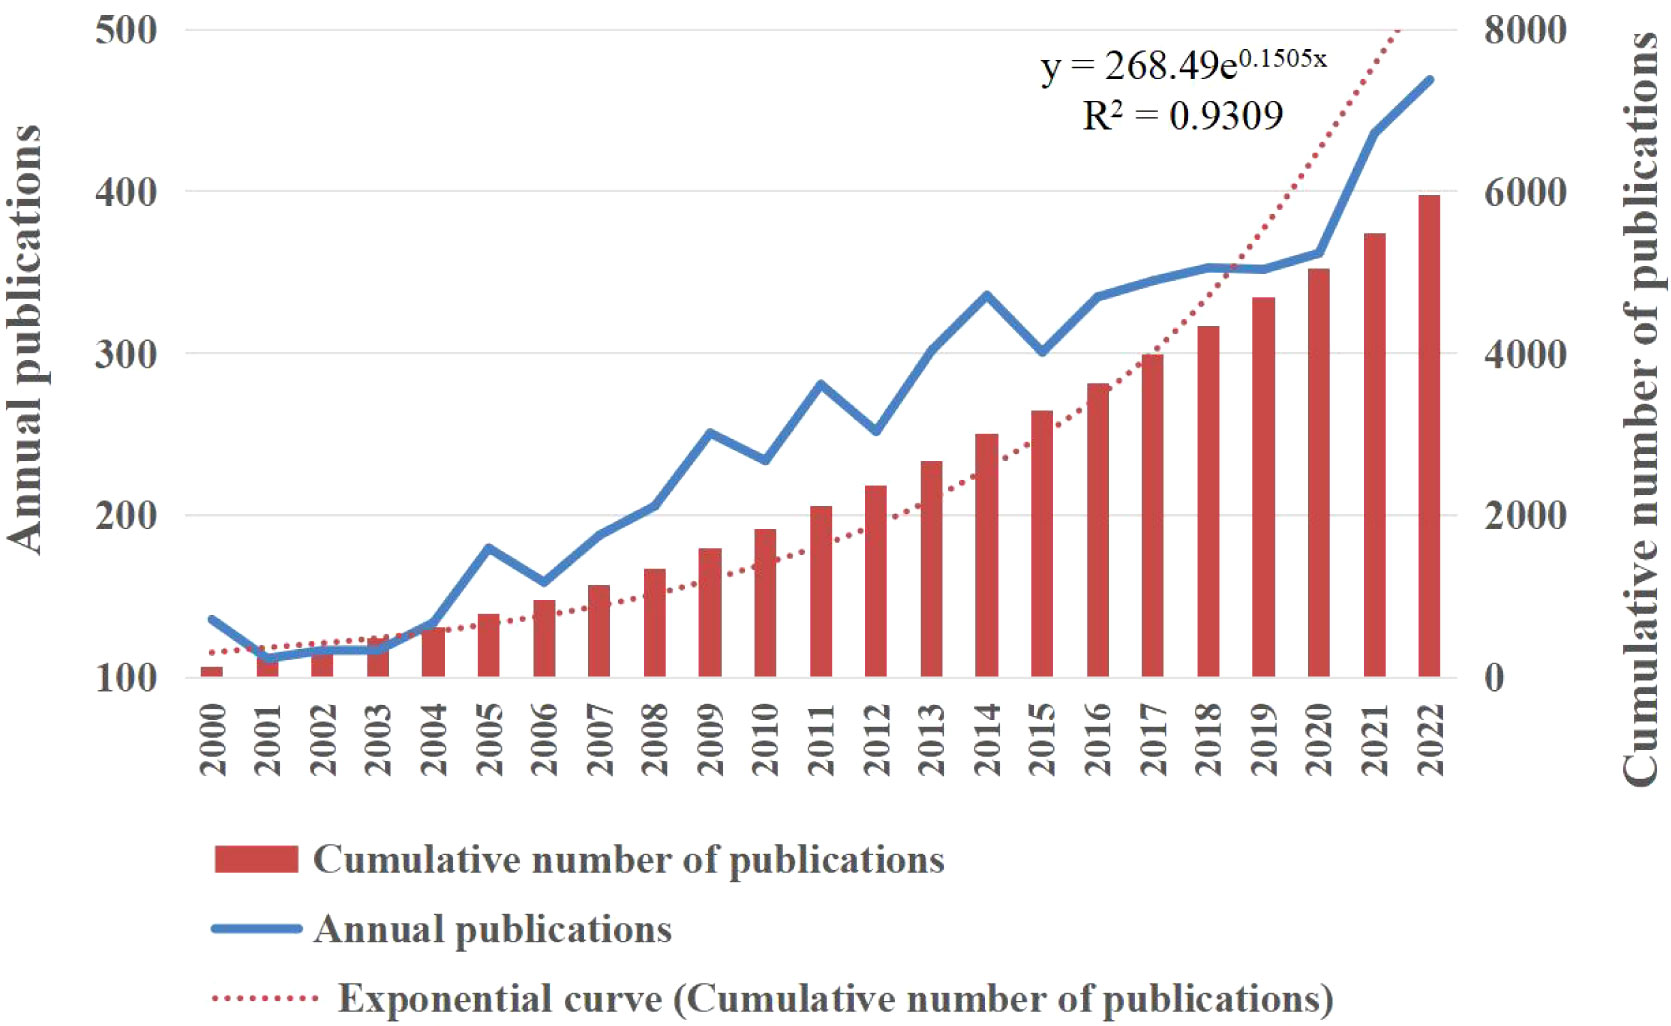
Figure 2 The number of publications and cumulative publications on ovarian cancer imaging from January 2000 to December 2022. Yearly publication count (y=268.49e0.1505x, r=0.970, where y is the cumulative publication number and x is the publication year).
We used Lotka law to analyze the distribution of the authors and found that most of them were small producers, with a high transience index (occasional authors) of 76.5 (Supplementary Table 1). Bradford’s model was applied to assess the distribution of scientific journals publishing papers on OC imaging, as detailed in Supplementary Table 2 delineating the material into Bradford’s zones.
Analysis of countries and institutions
The publications identified came from 84 countries, with the USA leading in the number of studies (1,373 publications), constituting 23.04% of all documents. Subsequent top contributors included China (903 publications), Japan (417 publications), and Italy (402 publications) (Table 1). Among the 1,373 papers published in the USA, 1,116 were solely authored by individuals from the USA, while the remaining 257 papers involved collaborations with other countries. Supplementary Figures 1A and B display the cooperative relationships among countries and cited countries in OC imaging.
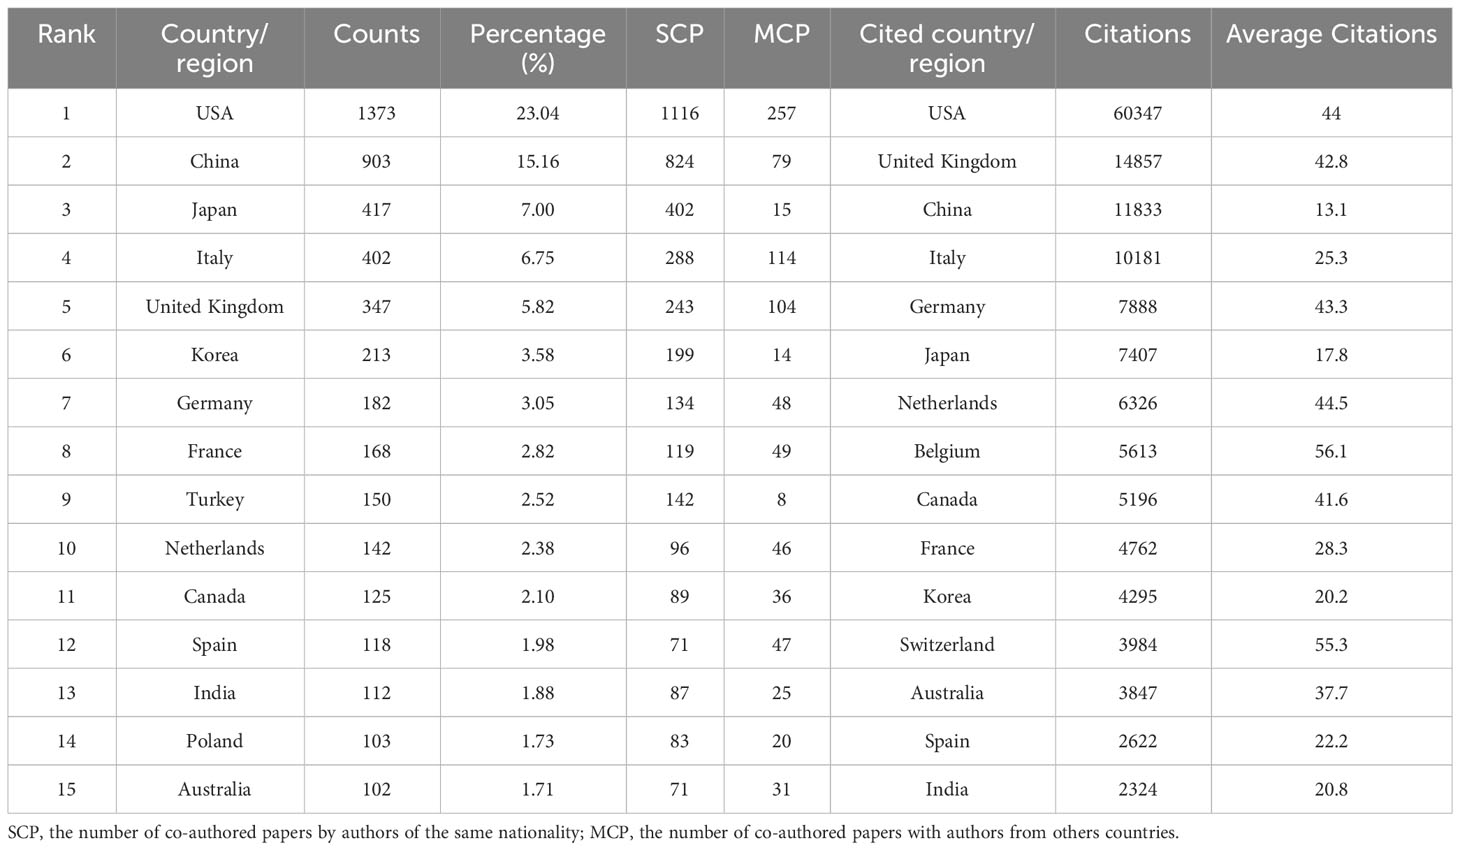
Table 1 Top 15 countries/regions in the ovarian cancer imaging research.
Research in OC imaging involved 3,958 institutions. The three institutions that had the most publications were Harvard University (USA, 202 publications), the University of London (United Kingdom, 190 publications), and the University of Texas System (USA, 168 publications) (Table 2). The institution with the highest centrality was the University of London (0.11), which indicates that this institution plays a crucial bridging role in research in this field. Supplementary Figure 1C shows the cooperative relationships among institutions in OC imaging.
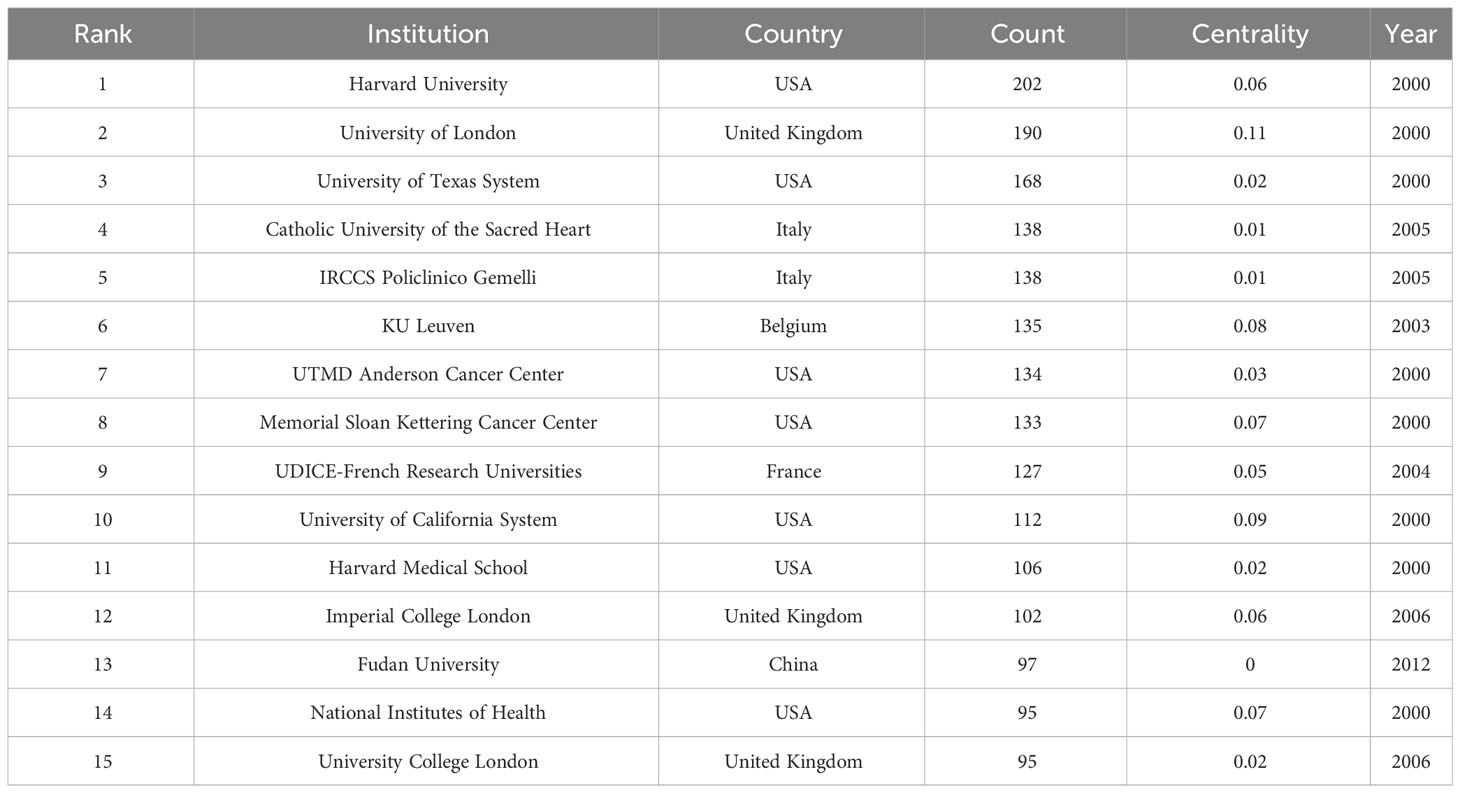
Table 2 Top 15 institutions in the ovarian cancer imaging research.
Analysis of authors and co-cited authors
The total number of authors across 5,958 publications was 26,643, yielding a co-authorship index of 4.47. Table 3 shows the top 15 authors and co-cited authors. Timmerman D led in publications (100), followed by Testa AC (83) and Valentin L (77). Timmerman D also emerged as the most co-cited author (2,650 citations, H_index: 40), followed by Valentin L (2,248 citations, H_index: 36) and Van Holsbeke C (1,547 citations, H_index: 31).
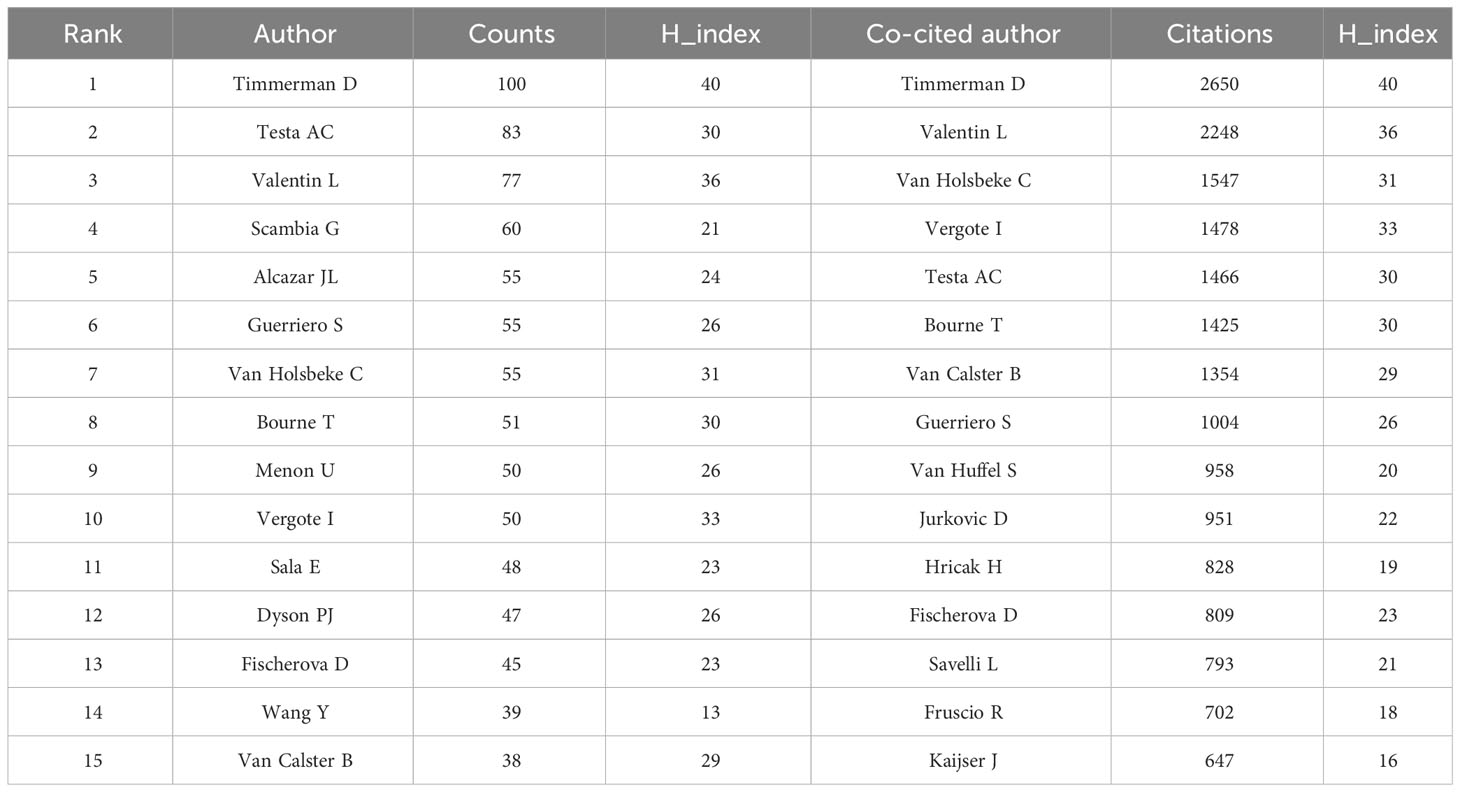
Table 3 Top 15 authors and co-cited authors in the ovarian cancer imaging research.
Analysis of active journals
A total of 1,186 journals contributed to this topic. Table 4 outlines the top 15 journals in OC imaging, with Gynecologic Oncology leading in publications [296 publications, Impact factor (IF): 5.3], trailed by the International Journal of Gynecological Cancer (182 publications, IF: 4.66). Journal of Clinical Oncology claimed the highest IF (50.72). The top 15 cited journals are shown in Table 4. Gynecologic Oncology also had the most citations (12,493 citations), followed by Journal of Clinical Oncology (6,104 citations) and Radiology (5,284 citations). Figure 3 shows a dual-map overlay of the citing and cited journals in OC imaging research. The left labels were the citing journals, and the right labels were the cited journals. These labels represented the disciplines covered by the journals. There are three main citation paths, are highlighted in yellow and green. The yellow path indicated that studies from the molecular, biology, and genetics journals were cited in studies from the molecular, biology, and immunology journals. The two green paths indicated that studies from the molecular/biology/genetics and health/nursing/medicine journals were cited in studies from the medicine/medica/clinical journals.
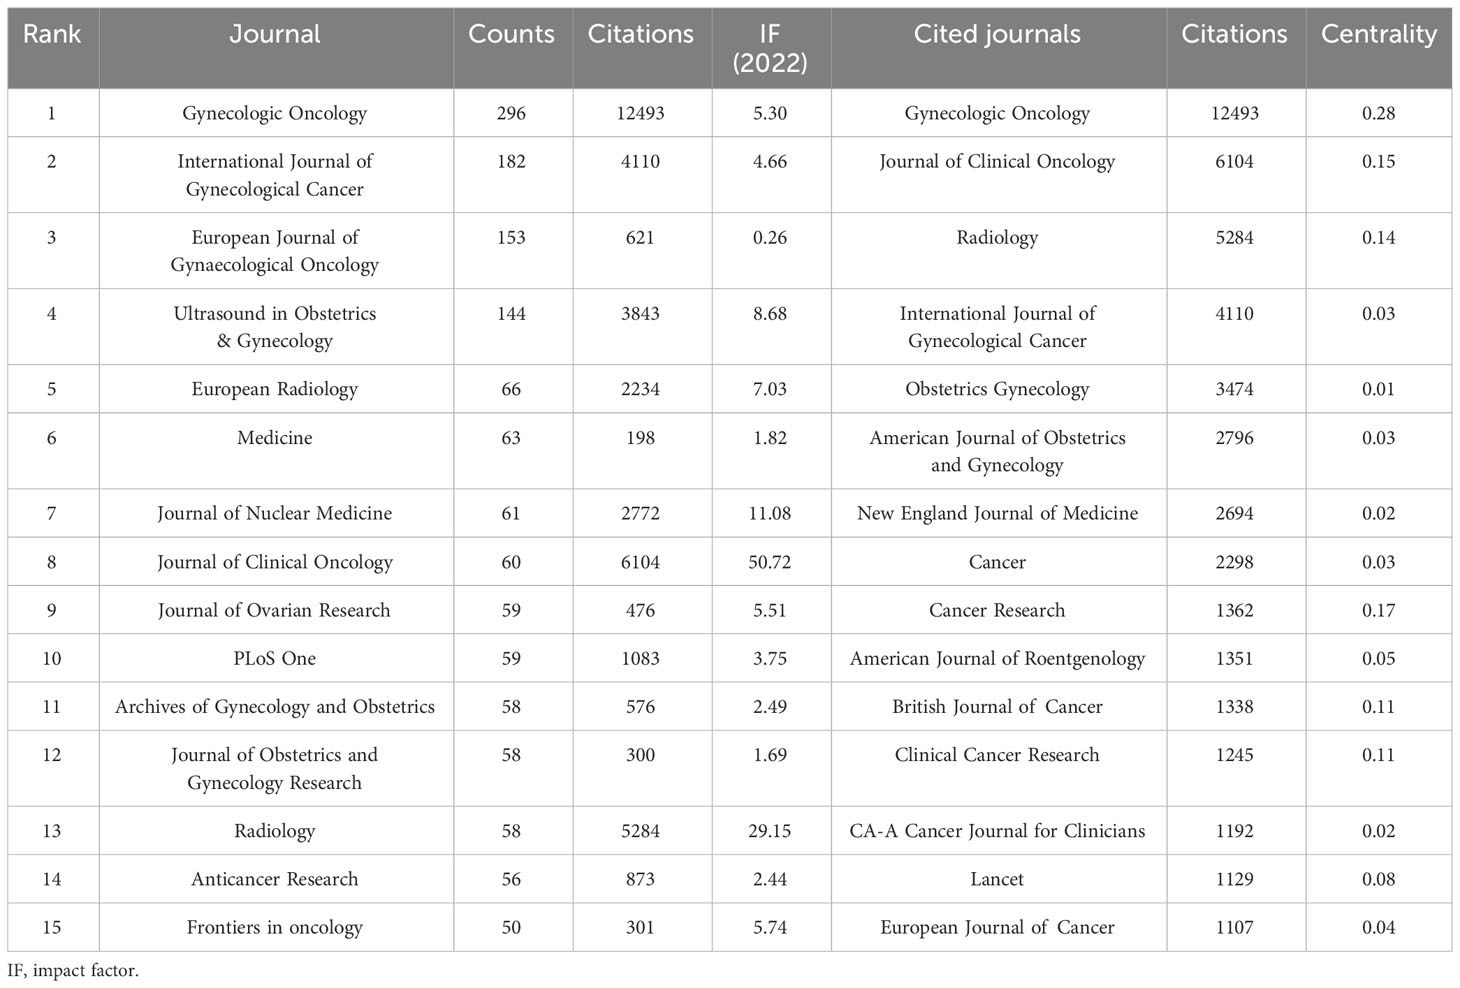
Table 4 The top 15 journals and cited journals related to ovarian cancer imaging.
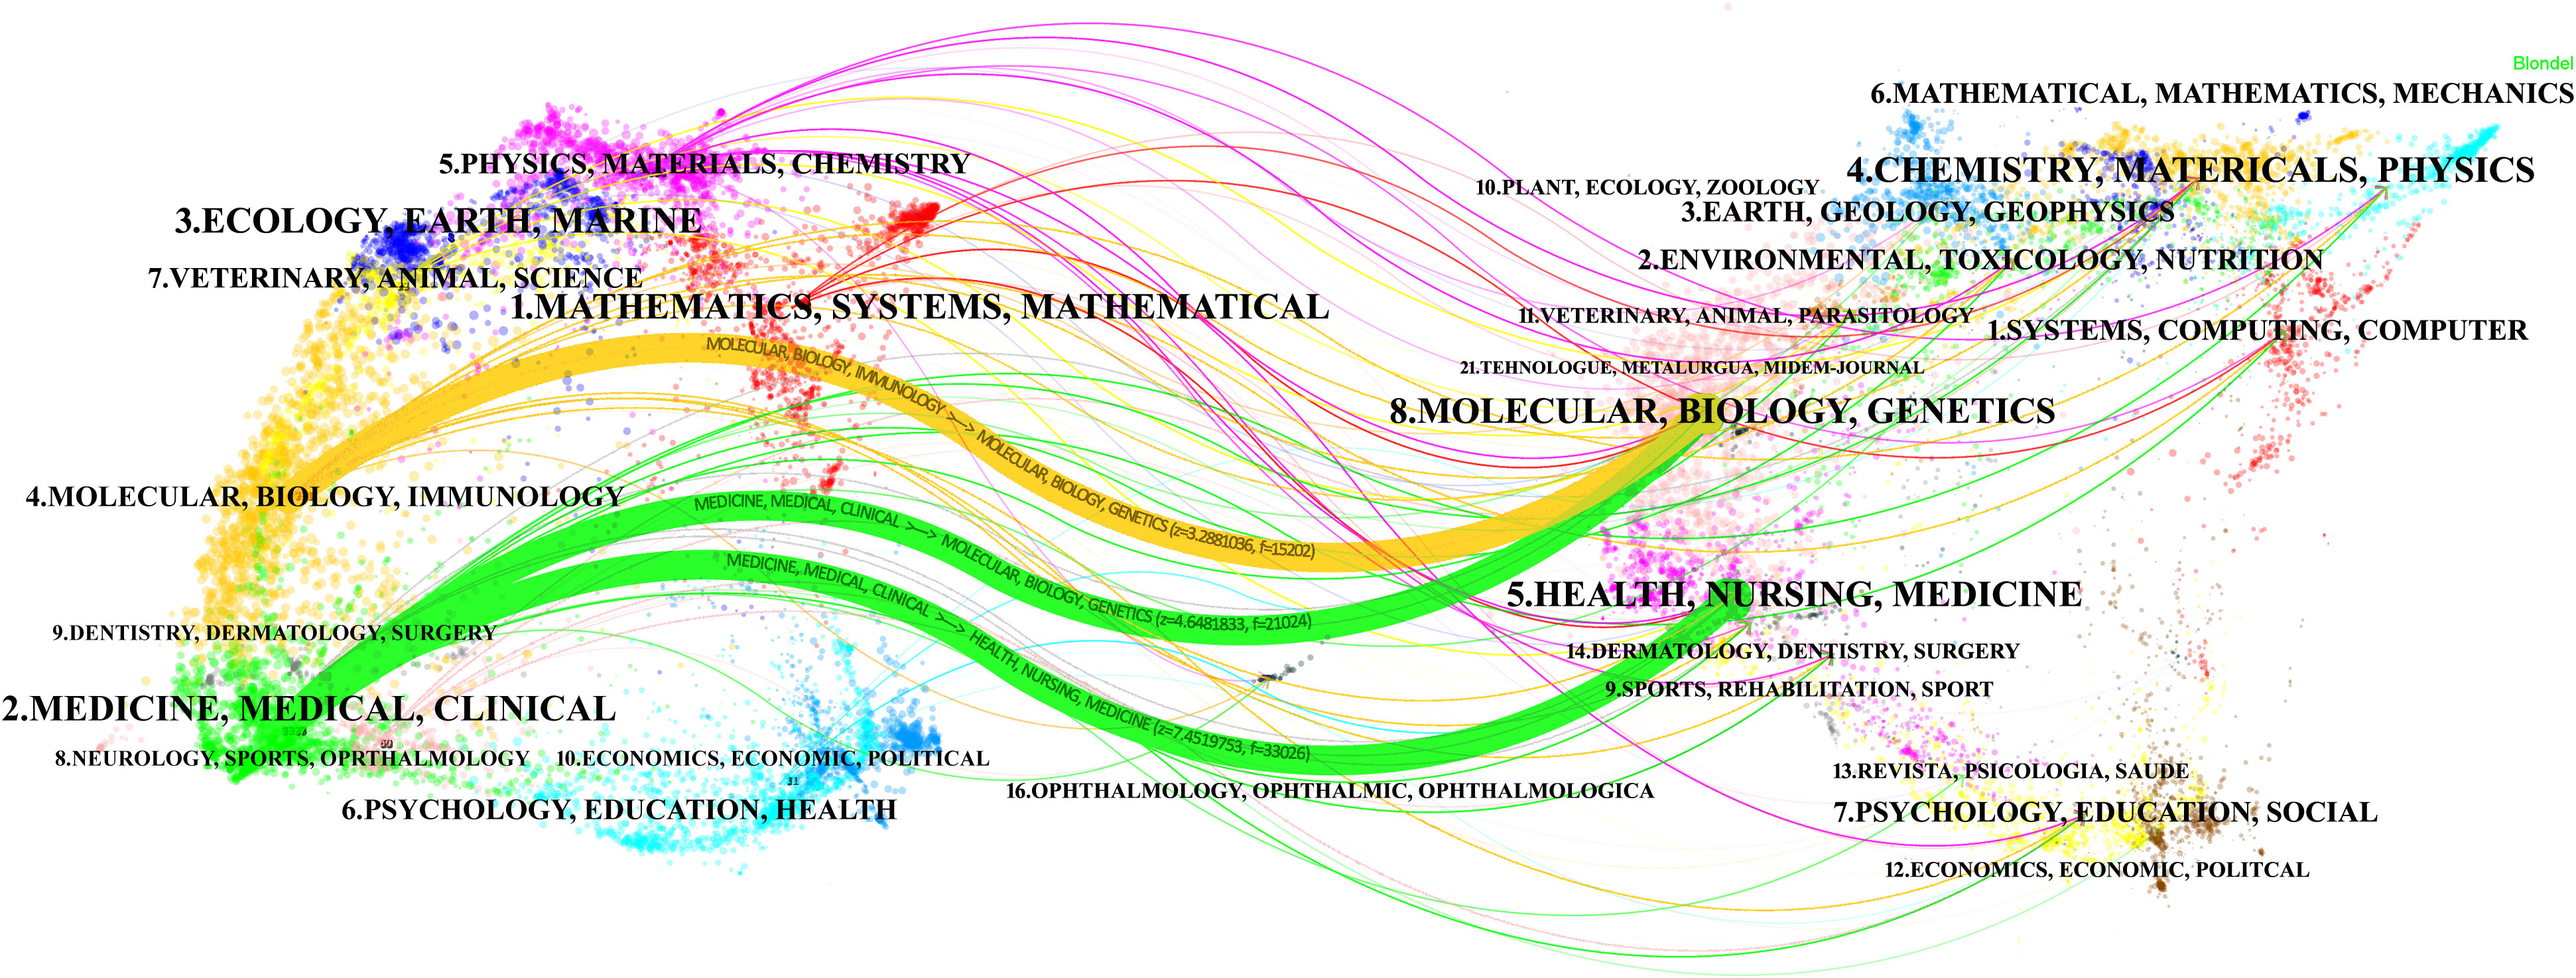
Figure 3 The dual-map overlay of journals related to ovarian cancer imaging research. The left side has the citing journals, and the right has the cited journals. The color of the path indicates the citation relationship. In the citing map, the length of the ellipse’s vertical axis reflects the number of papers published by the journal, and the length of the ellipse’s horizontal axis reflects the number of authors in the journal.
Analysis of cited references
The references with the most citations are often considered foundational to research in a specific field. Table 5 shows the top 15 co-cited references in OC imaging research. As mentioned above, the article “Terms, definitions and measurements to describe the sonographic features of adnexal tumors: a consensus opinion from the International Ovarian Tumor Analysis Group” by Timmerman D published in Ultrasound In Obstetrics & Gynecology, was the most cited reference (298 citations). Figure 4 provides a timeline view of the co-cited references. The largest cluster was “#0 breast cancer”, followed by “#1 clinical practice guideline”, and “#2 advanced high-grade serous ovarian carcinoma”. The timeline shows that “#0 breast cancer” and “#10 rsna refresher courses” constituted the earliest clusters. Additionally, it is noteworthy that “#2 advanced high-grade serous ovarian carcinoma”, “#4 adnexal masses” and “#9 two-sample mendelian randomization study” became the most popular research topics in recent years. Five out of the 13 clusters are still active, suggesting that these research directions remain vibrant and represent ongoing hotspots in OC imaging.
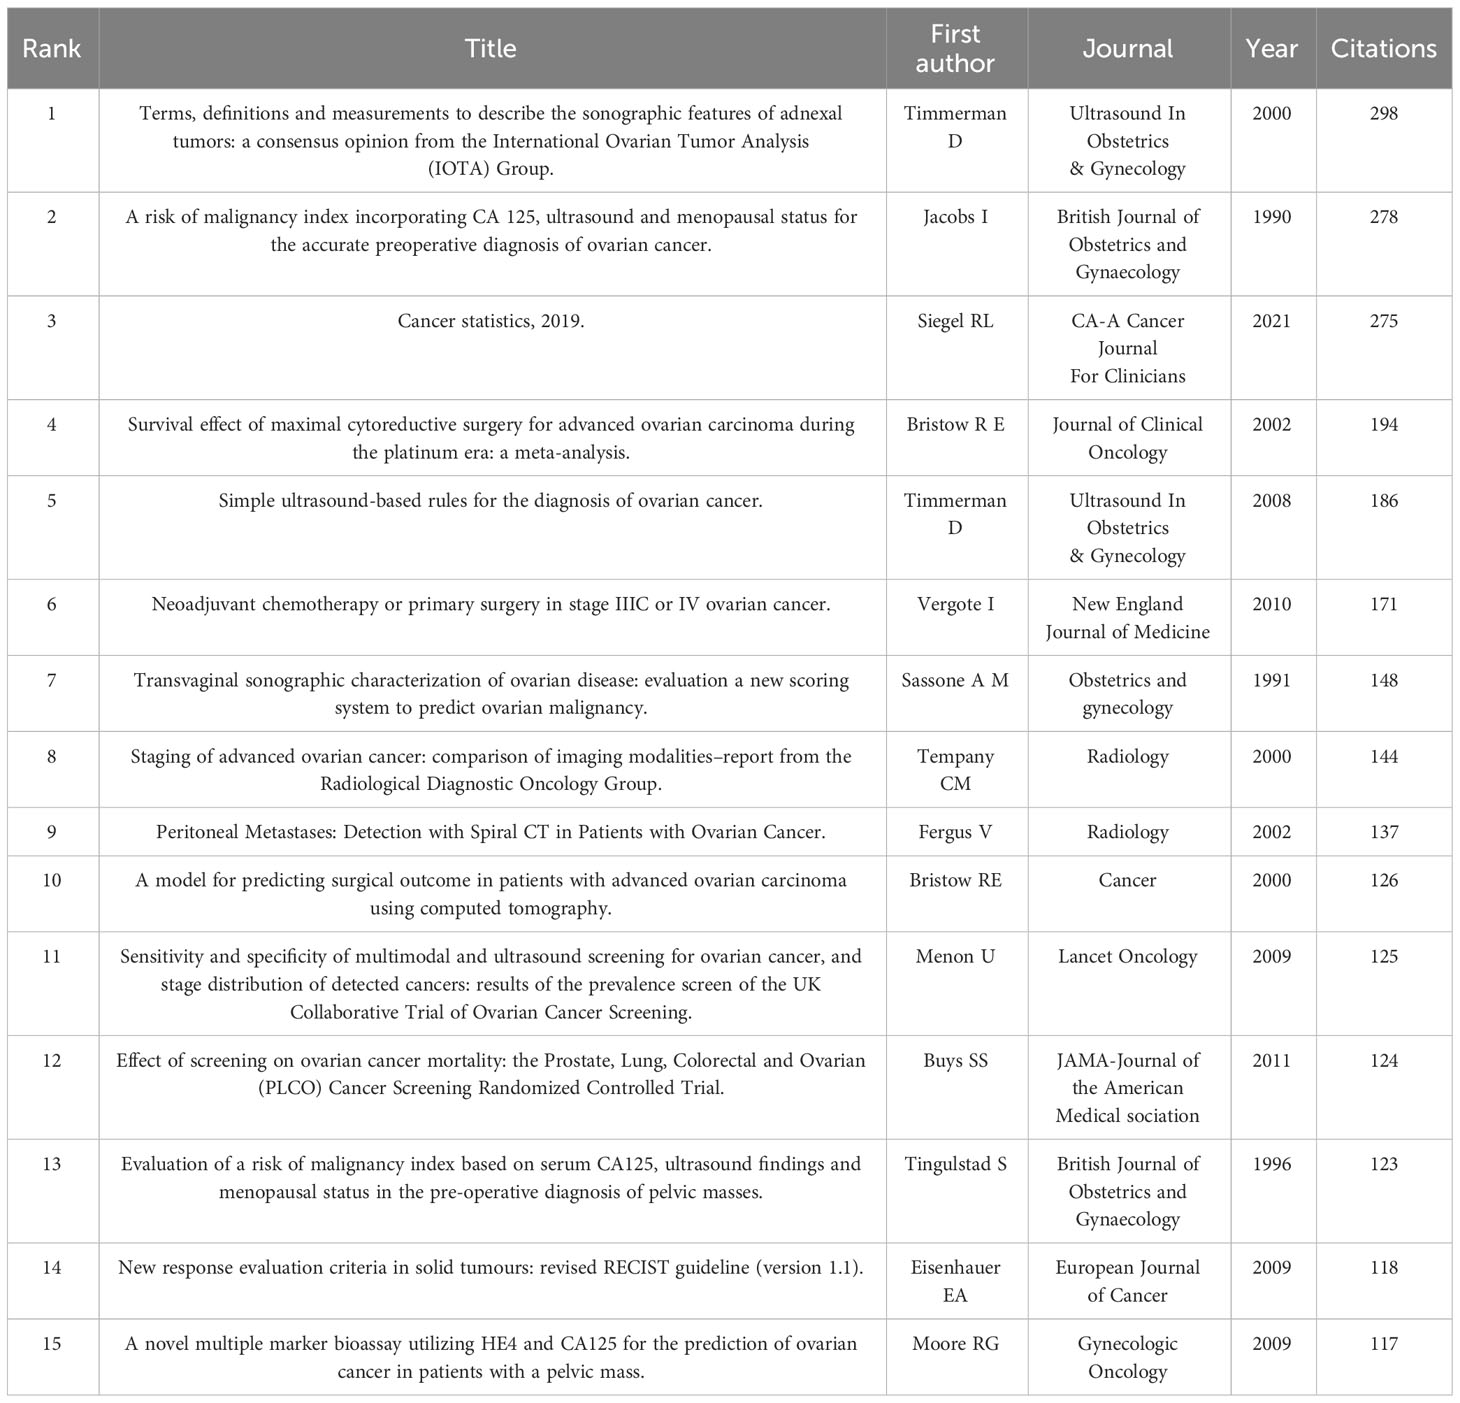
Table 5 The top 15 co-cited references in the ovarian cancer imaging research.
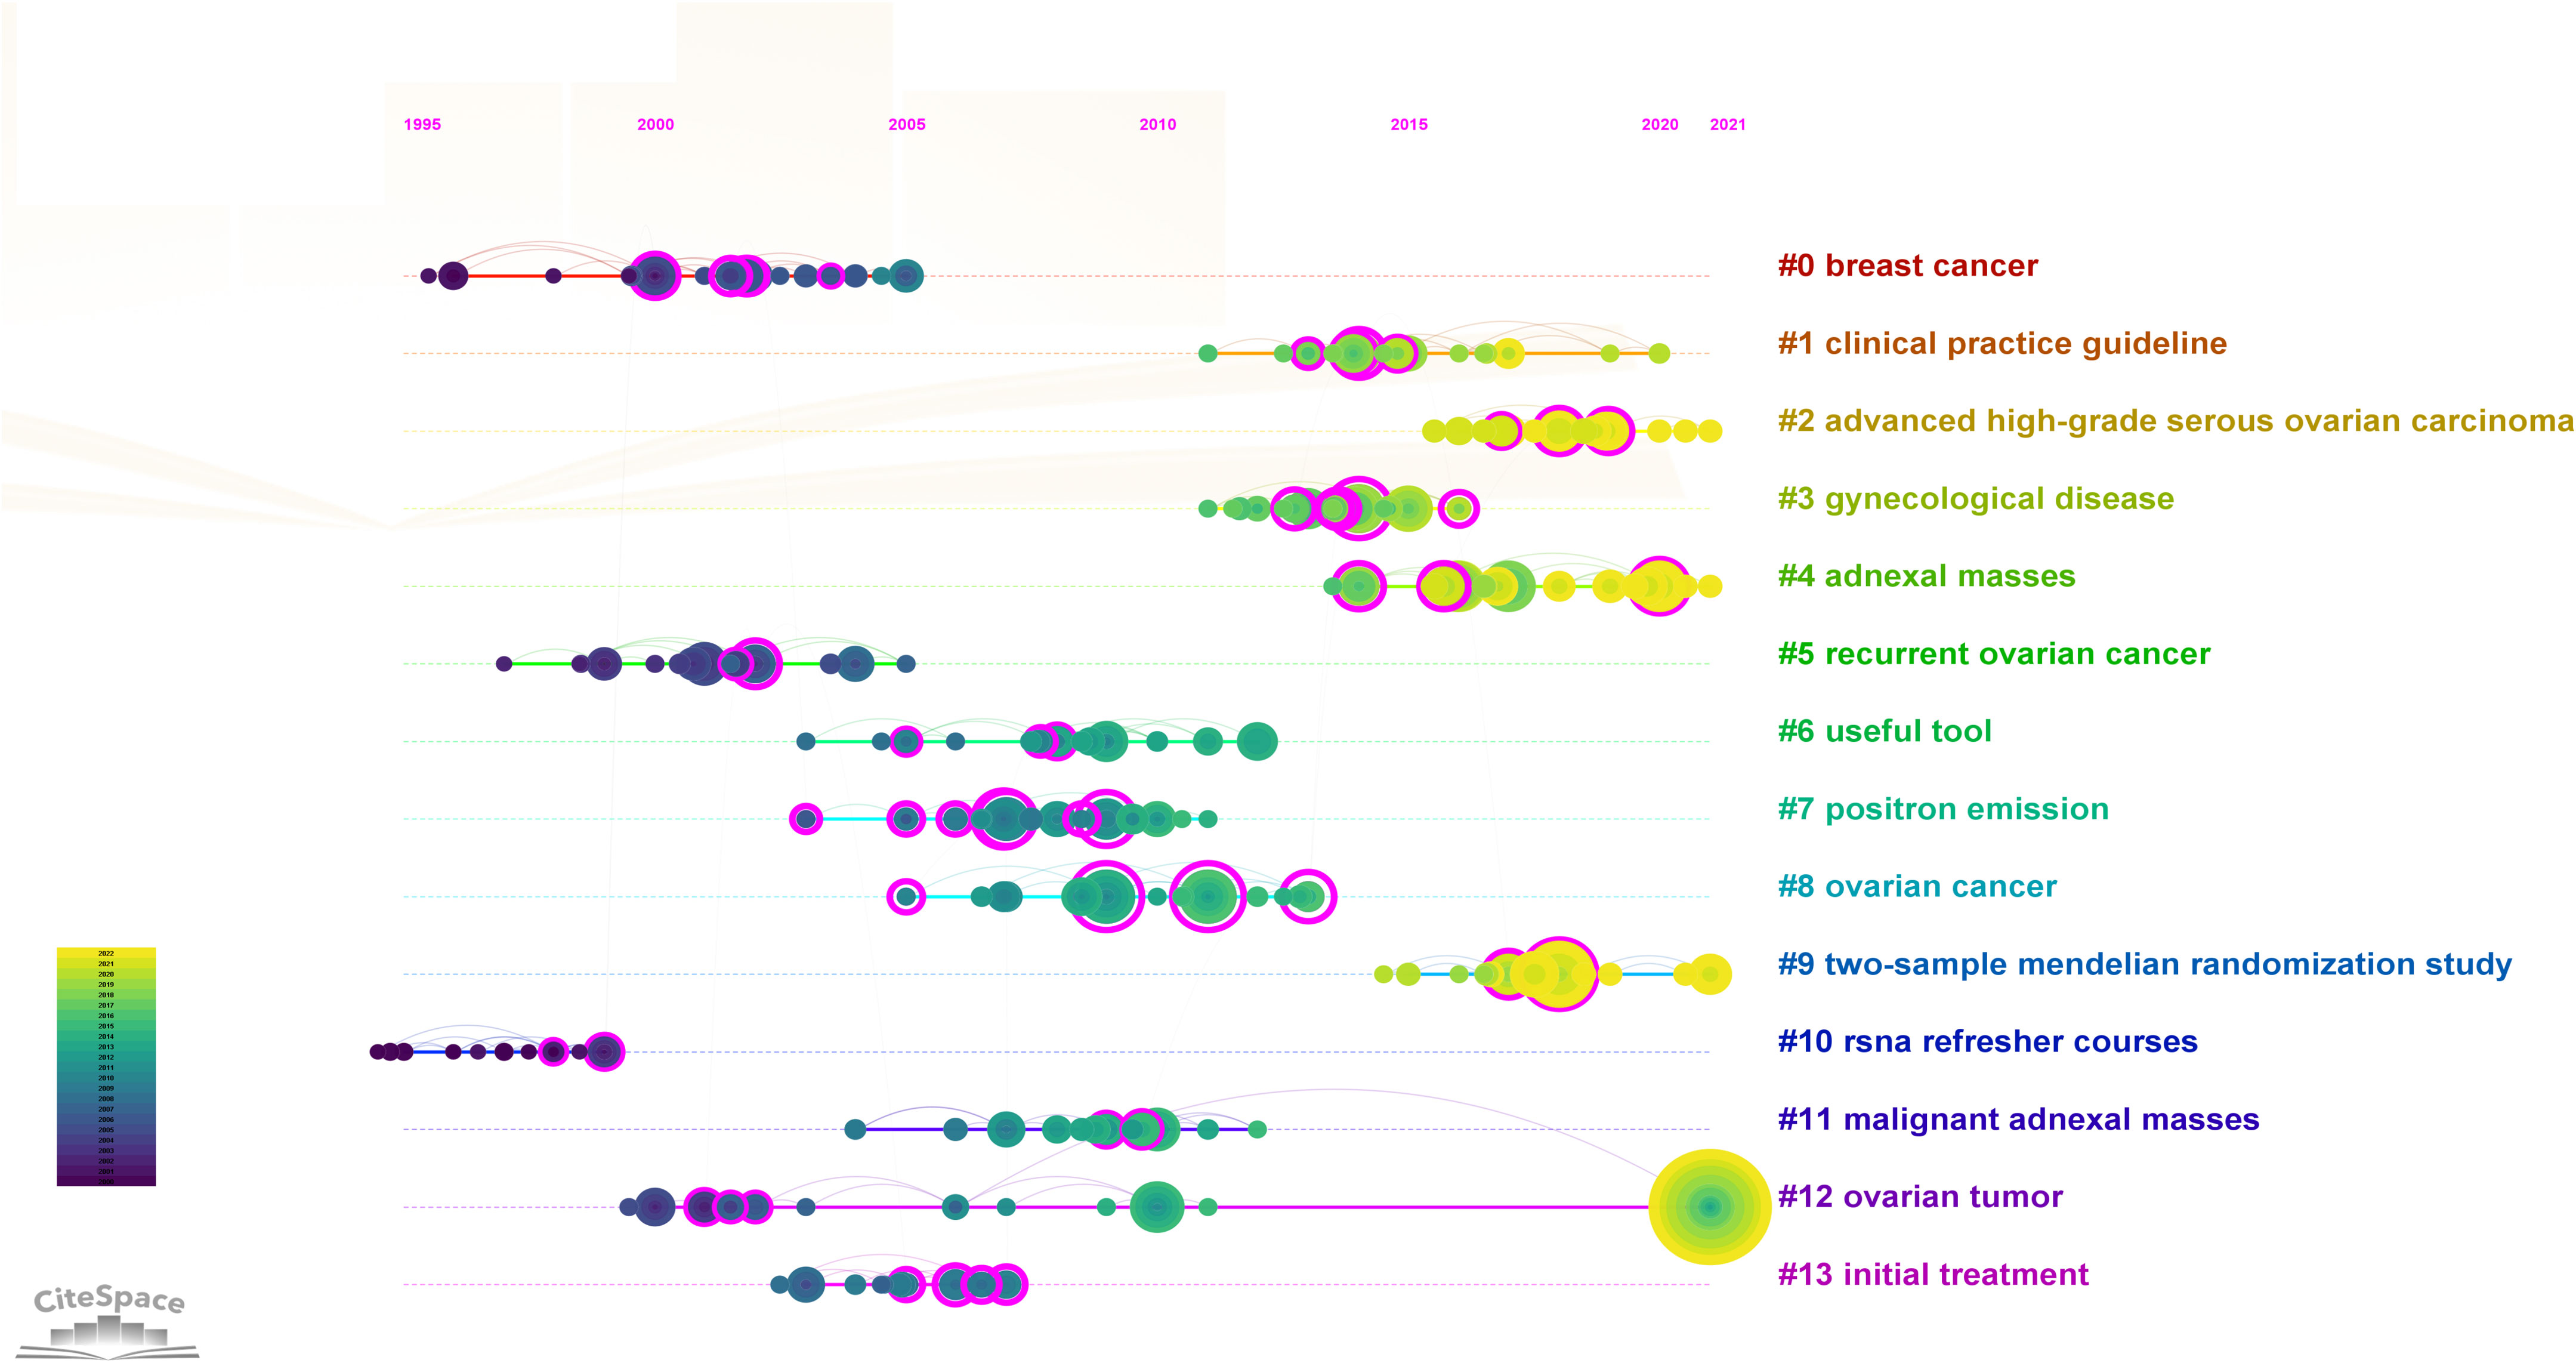
Figure 4 Timeline view of reference. In the timeline view, different colors of nodes on the same line indicate different years. Therefore, the nodes on the left represent older references, while the nodes on the right represent more recent references. A straight line in the same horizontal position indicates the set of all clustered references belonging, and the cluster label is located at the line’s rightmost end. The first cluster label on the knowledge map was “#0 breast cancer” and the second cluster label was “#1 clinical practice guideline”. Node size represents co-citation frequency, and the links between nodes indicate co-citation relationships. The occurrence year of each node indicates the initial co-citation time.
Analysis of keywords
Keywords can summarize the main content of publications and exploring the frontiers of OC imaging research. To enhance the relevance to this study, the selection of keywords excluded “cancer” and “carcinoma”. The top 15 keywords in OC imaging research are shown in Supplementary Table 3. The keyword “ovarian cancer” (1,256), followed by “ultrasound” (725), “diagnosis” (712) with the highest frequency. Figure 5A shows a collaboration network of keywords created by VOSviewer. The research direction grouped the keywords and roughly divided them into 6 categories: the red cluster was the largest one, primarily focused on radiotherapy, chemotherapy, and anticancer treatment of OC. The green cluster was involved with the initial surgical evaluation of epithelial ovarian cancer and the prognostic evaluation of ovarian cancer with CT and PET/CT. The dark-blue cluster involved the risk factors of women suffering from OC and the diagnosis of OC related to breast cancer. The purple cluster was associated with the ovarian cancer risk of malignant index (RMI), and the ultrasound evaluation adnexal quality score. The yellow cluster was mainly related to the diagnosis and differential diagnosis of ovarian cancer. The baby-blue cluster was associated with the radiomics and deep learning research in ovarian cancer. Figure 5B displays the top 25 keywords with the highest burst strength in OC imaging research. “pelvic masses” had the highest burst strength (25.5), followed by “MRI” (21.47), which extends until 2022. “positron emission tomography” had the longest duration, from 2002 to 2011. Human epididymis protein 4 (HE 4) was a new keyword starting in 2020, with an burst strength of 9.51. Recently, popular keywords such as “apoptosis”, “nanoparticles”, “features”, “accuracy”, and “HE 4” reflect research trends in this field and may become research hotspots in the future.
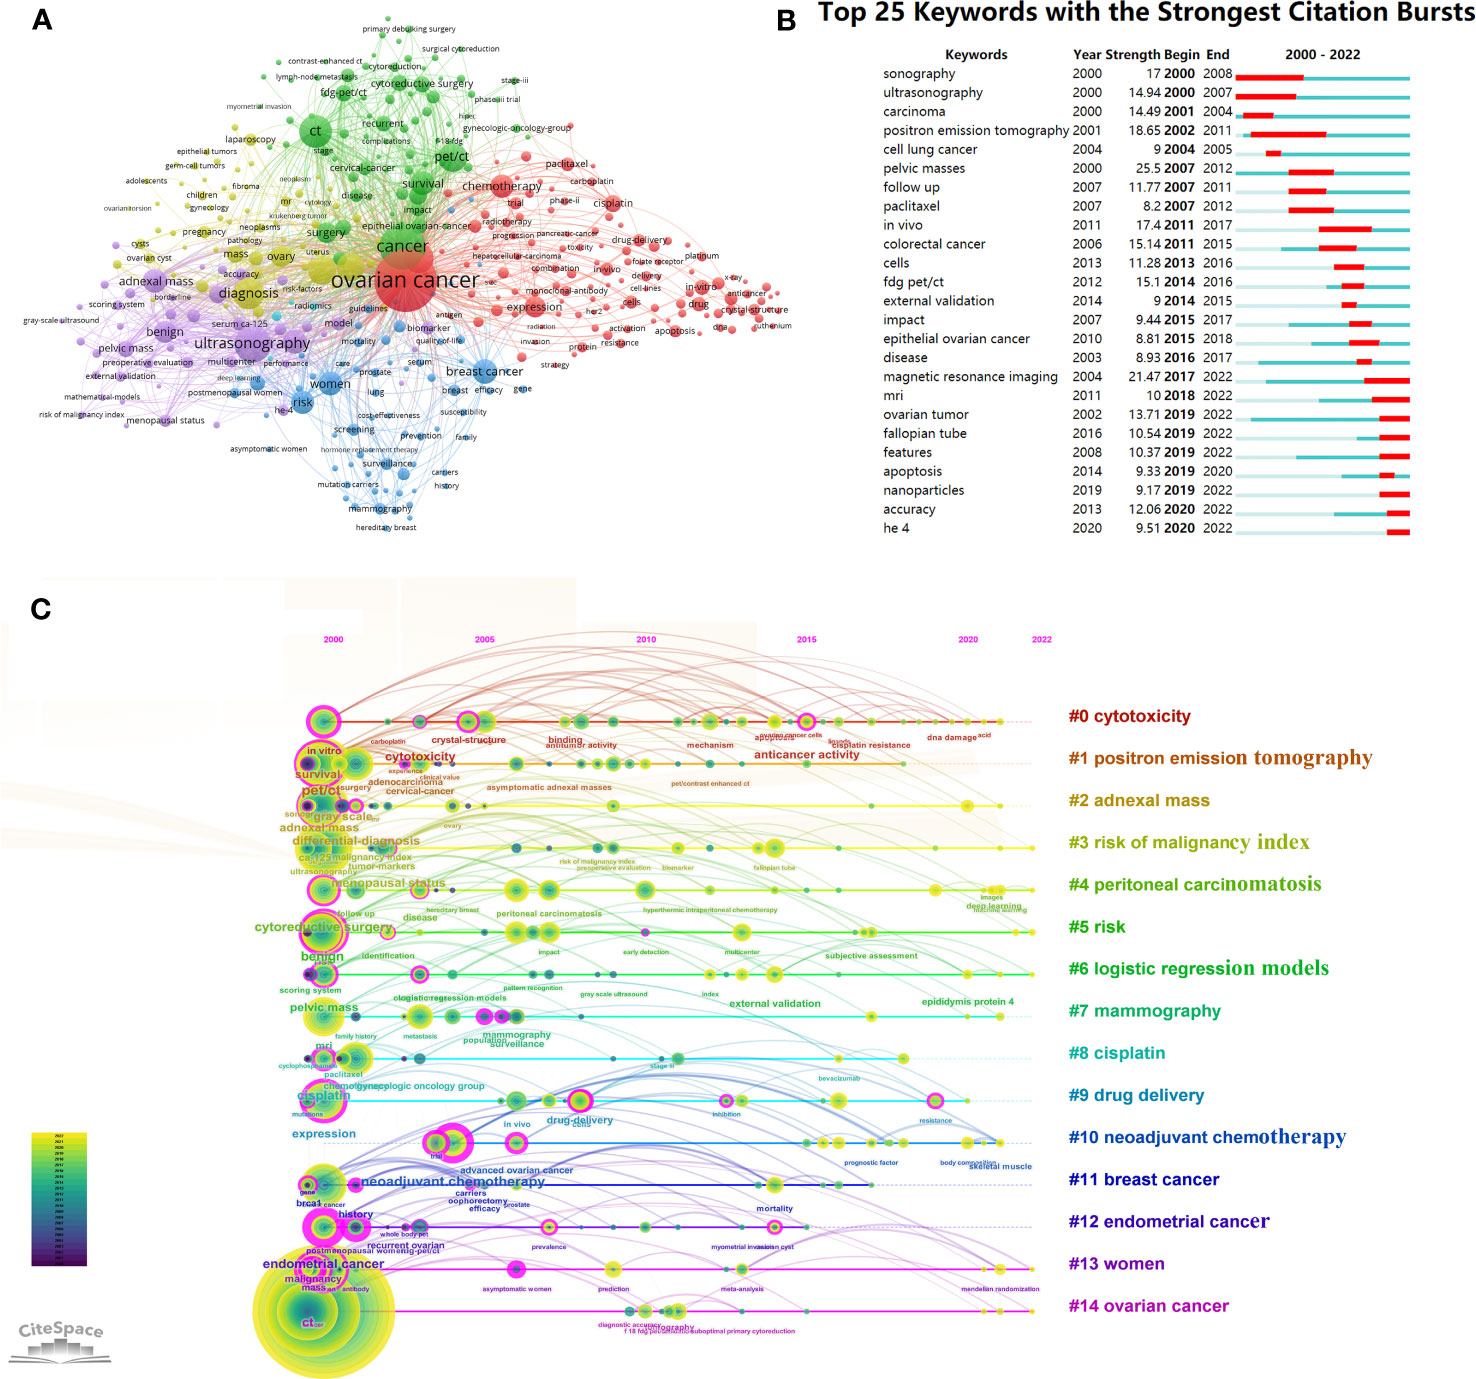
Figure 5 Analysis of ovarian cancer imaging-related keyword. (A) The co-occurrence network of keywords in VOSviewer. The figure displays the keywords that occurred more than 20 times. The nodes with different colors represent the keywords from different clusters, and the size of the nodes reflects their frequency. (B) The 20 keywords with the highest citation bursts in ovarian cancer imaging research. The red bold line indicates the years of citation bursts. (C) Timeline analysis of the keywords related to ovarian cancer imaging. The first cluster label on the knowledge map was “#0 cytotoxicity” and the second cluster label was “#1 positron emission tomography”. Each keyword cluster had its own timeline. Each node represents a keyword, which was marked under the node. The order in which nodes appear indicates the development and evolution process of keywords under clustering.
Using the timeline viewer for keywords analysis reveals evolving hotspots in the field over time. The most common keywords for each group over time were shown by the timeline graph in CiteSpace (Figure 5C). The earliest and largest cluster was “#0 cytotoxicity”. Among the earliest keywords in this field were “carboplatin” and “crystal-structure”, while “DNA damage” and “acid” were the latest research targets in this area. The “#1 positron emission tomography” cluster was another large cluster that emerged earlier. Research frontiers in this field were keywords such as “anticancer activity” and “cisplatin resistance”. In addition, five of the 14 clusters are still active, including, “#3 risk of malignancy index”, “#4 peritoneal carcinomatosis”, “#5 risk”, “#6 logistic regression models”, “#13 women”, and “#14 ovarian cancer”, indicating that relevant research continues to progress in these specific areas.
Discussion
General information
In this study, we conducted a systematic and comprehensive bibliometric analysis of research on OC medical imaging from January 1, 2000 to December 31, 2022. The number of annual publications showed a clear upward trend for OC imaging studies, indicating the sustained and significant attention this field has received in recent years. This study provides an overview of the medical imaging applications of ovarian cancer, helping researchers in understanding the current status, collaborative networks, and primary research hotspots in this field. In addition, our research findings provide a series of suggestions for future investigation.
To promote teamwork and global collaboration in this area, we analyzed the distribution of countries/regions and institutions. Of the 5,958 publications, 23.04% were completed by researchers in the USA. China, as the only developing country in the top five productivity rankings, held the second position in OC imaging research output, following the USA. Moreover, seven of the 15 most productive institutions were in the USA. Harvard University, affiliated with the USA, having the most publications and the highest attention level. Therefore, the USA made a significant contribution to the academic influence and reputation of OC imaging research. While the University of London did not have the highest number of publications, it demonstrated the highest centrality, indicating its important bridging role in inter-country cooperation. Analyzing journals and co-cited journals can assist researchers in choosing suitable journals for their papers. The majority of papers were published in Gynecological Oncology, International Journal of Gynecological Cancer, and European Journal of Gynecological Oncology, all belonging to the gynecological and oncology fields. Meanwhile, Gynecological Oncology and Journal of Clinical Oncology stood out as the most cited journals.
The degree of correlation between studies can be measured by references cited by other publications together. Co-citation analysis can help researchers identify the common knowledge bases shared by multiple studies efficiently and conveniently (22, 23). Analyzing the most co-cited references, reveals that advanced high-grade serous ovarian cancer and adnexal masses are important research foundations for OC imaging. Belgian researcher Timmerman D played a pivotal role by first standardizing the terminology, definitions, and measurements for describing sonographic features of adnexal masses (24). Several scholars have investigated the combination of ultrasound and cancer antigen 125 (CA125) to evaluate the malignancy risk index of advanced OC, which has yielded positive outcomes (25, 26). Subsequently, researchers explored the treatment of advanced OC (27, 28). During the platinum era, maximal cytoreductive surgery emerged as one of the most important determinants of survival in stage III or IV OC patients (27). Among them, Vergote I’s article, which was published in the journal New England Journal of Medicine, reported that the survival time of interval debulking surgery following neoadjuvant chemotherapy was not inferior to that of chemotherapy after maximal cytoreductive surgery in patients with stage IIIC or IV OC (28).
Current research status of imaging in OC
CT is the recommended imaging technique for staging OC. The overall accuracy of CT for diagnosis of malignant ovarian masses is reported to be as high as 89%. However, the sensitivity and specificity of CT in diagnosing malignant abdominal lymph nodes were 41% and 89% (29). A recent meta-analysis showed that CT’s sensitivity, specificity, and diagnostic advantage rate in detecting peritoneal metastasis were 68%, 88%, and 15.9%, respectively (30). But CT appears to be relatively accurate in predicting the involvement of the diaphragm and omentum. Additionally, CT has been employed to predict primary cytoreductive outcomes for advanced OC. Axtell et al. demonstrated that the sensitivity and specificity of CT prediction for optimal suboptimal surgical outcome in patients with advanced OC were 79% and 75%, respectively (31).
PET/CT has limitations in characterizing ovarian masses, but proves valuable for OC staging and detecting recurrent diseases. Due to limited spatial resolution, PET/CT may struggle to identify peritoneal tumor deposits smaller than 1 cm. Another indication for PET/CT is to detect recurrent diseases. A meta-analysis showed that compared with CT and MRI, PET/CT was relatively accurate in detecting recurrence, with sensitivity and specificity of 91% and 88%, respectively (32).
MRI provides excellent tissue differentiation and serve as a problem-solving tool to characterize uncertain lesions observed on CT or ultrasound. In a recent meta-analysis showed that the sensitivity and specificity of MRI in diagnosing OC were 91% and 85%, respectively, surpassing CT and PET/CT in OC detection (33). In a meta-analysis, CT, PET/CT, and MRI were compared for detecting peritoneal metastasis, and MRI showed the highest combined regional sensitivity and specificity, with 92% and 84%, respectively (30).
Ultrasound plays an important role in the initial evaluation of adnexal masses and high-risk patients screening. It is recommended to use a vaginal ultrasound morphological scoring system to distinguish between benign and malignant ovarian lesions. The sensitivity and specificity of this system were 100% and 83%, respectively (26). Although ultrasound can be used for diagnose OC, it is not the preferred imaging method for staging OC. In patients with advanced OC, the sensitivity of ultrasound in detecting peritoneal metastasis is relatively low (69%) (34).
Research hotspots and frontiers
Keyword analysis provides valuable insights into the main research hotspots and directions in the field of OC imaging from 2000 to 2022. Ultrasound emerges as a pivotal focus in OC imaging research, particularly in the initial assessment of adnexal masses and screening individuals with a high risk of OC. RMI based on ultrasonography, menopausal status, and serum CA125 levels can quantitatively assess the risk of malignancy for accurate preoperative diagnosis of OC (25). Analyzing keyword bursts can help researchers in identifying the frontier or future trends in specific fields (35). The keyword with the highest burst intensity is pelvic masses, spanning from 2007 to 2012. During this period, research on pelvic masses mainly focused on evaluating the efficacy of paclitaxel in OC treatment and subsequent follow-up outcomes. Additionally, PET has historically been a prominent avenue in OC imaging with PET/CT proving advantageous in staging, prognostic prediction, response evaluation, and restaging of OC patients (36). MRI has emerged as a research hotspot in the field of OC imaging. MRI has high soft tissue resolution and can be used as a problem-solving tool to characterize uncertain lesions observed on CT or ultrasound (37). MRI not only reduces unnecessary surgical interventions for benign lesions but also minimizes surgeries in inoperable cases, facilitating the initiation of initial chemotherapy treatments for patients and enhancing their overall treatment experience.
In recent times, the research community has shown growing interest in keywords such as “HE 4”, “features”, “accuracy”, “apoptosis” and “nanoparticles”, which are indicative of emerging research trends in this particular field and have the potential to become significant areas of investigation in the future.
Notably, HE 4 has emerged as a novel biomarker for ovarian cancer. Mi’s research indicates that serum HE4 levels can contribute to diagnosing, evaluating treatment responses, and predicting recurrence in patients with advanced ovarian cancer, fallopian tube cancer, and peritoneal cancer (38). Zhao used CA125 and HE 4 to detect OC, found that the sensitivity of CA125 was higher than that of HE 4 (88.2% vs. 54.7%), while the specificity of HE 4 was higher than that of CA125 (97.9% vs. 67.4%) (39). A prospective multicenter study shown that the risk of ovarian malignancy algorithm based on the CA125 and HE 4 levels can be used to evaluate the risk of epithelial ovarian cancer in premenopausal and postmenopausal women with pelvic masses (40).
The term “apoptosis” and “nanoparticles” refers primarily to the targeted therapy associated with OC. In recent years, nanomedicines have been widely used in multiple therapeutic fields, especially in the field of cancer. The use of nanomedicines has greatly improved the safety and efficacy of common anticancer drugs. Nanodrugs have targeted and sustained-release properties. At present, liposomal doxorubicin has been applied in clinical treatment of recurrent platinum resistant OC patients (41). Nanoparticle albumin-bound paclitaxel demonstrated therapeutic efficacy in the treatment of OC, with minimal toxic side effects and improved patient acceptance and compliance (42).
The analysis of the keyword timeline, reveals that advancements in imaging and computer technology have significantly enhanced the precision of investigating OC. Furthermore, the evolution of computer science has propelled the growth of artificial intelligence (AI), with radiomics and deep learning emerging as a subfield of AI. Radiomics in OC relies on imaging data for predicting pathological diagnosis, recurrence risk, and treatment prognosis (43, 44). However, the current research on deep learning in OC is still in its preliminary stages (44, 45). Consequently, AI in the domain of OC imaging holds potential as a future development trend.
This study has some limitations. First, the search was limited to the WoSCC SCIE database due to software compatibility constraints, potentially resulting in the omission of relevant research findings. Second, the bibliometric analysis conducted using CiteSpace and VOSviewer focused primarily on principal conclusions rather than providing a comprehensive examination of the entire text, limiting the capacity for a systematic review. Third, it is important to note that CiteSpace software does not distinguish between the first author and the corresponding author. Additionally, the presence of multiple authorship identities for the same author may introduce biases in the results related to affiliated institutions.
Conclusions
The number of publications in OC imaging is gradually increasing with the USA and China being the primary contributors to OC imaging research. Among the authors, Timmerman D from Belgium stands out as the most prolific and highly cited. Gynecologic Oncology is the journal with the highest number of publications and citations in this area. Currently, the main areas of focus in OC imaging research encompass MRI, targeted therapy for OC, novel biomarker (such as HE4), and AI. These areas are expected to shape future research endeavors in the field of OC imaging.
Data availability statement
The raw data supporting the conclusions of this article will be made available by the authors, without undue reservation.
Author contributions
YL: Data curation, Formal Analysis, Writing – original draft. SL: Conceptualization, Investigation, Writing – review & editing. JZ: Methodology, Software, Writing – original draft. XW: Data curation, Methodology, Writing – original draft. FL: Formal Analysis, Methodology, Software, Writing – original draft. YW: Investigation, Writing – review & editing. LG: Supervision, Writing – review & editing, Formal Analysis.
Funding
The author(s) declare that no financial support was received for the research, authorship, and/or publication of this article.
Conflict of interest
Author YW is employed by the company Philips Healthcare.
The remaining authors declare that the research was conducted in the absence of any commercial or financial relationships that could be construed as a potential conflict of interest.
Publisher’s note
All claims expressed in this article are solely those of the authors and do not necessarily represent those of their affiliated organizations, or those of the publisher, the editors and the reviewers. Any product that may be evaluated in this article, or claim that may be made by its manufacturer, is not guaranteed or endorsed by the publisher.
Supplementary material
The Supplementary Material for this article can be found online at: https://www.frontiersin.org/articles/10.3389/fonc.2023.1326297/full#supplementary-material
Abbreviations
OC, Ovarian cancer; CT, Computed tomography; MRI, Magnetic resonance imaging; PET, Positron emission tomography; SCIE, Science Citation Index-Expanded; WoSCC, Web of Science Core Collection; IF, Impact factor; RMI, Risk of malignant index; HE 4, Humane pididymis protein 4; CA125, Cancer antigen 125; AI, Artificial intelligence.
References
1. Siegel RL, Miller KD, Fuchs HE, Jemal A. Cancer statistics, 2021. CA Cancer J Clin (2021) 71(1):7–33. doi: 10.3322/caac.21654
2. Jelovac D, Armstrong DK. Recent progress in the diagnosis and treatment of ovarian cancer. CA Cancer J Clin (2011) 61(3):183–203. doi: 10.3322/caac.20113
3. Kurnit KC, Fleming GF, Lengyel E. Updates and new options in advanced epithelial ovarian cancer treatment. Obstet Gynecol (2021) 137(1):108–21. doi: 10.1097/AOG.0000000000004173
4. Verhaak RGW, Tamayo P, Yang J-Y, Hubbard D, Zhang H, Creighton CJ, et al. Prognostically relevant gene signatures of high-grade serous ovarian carcinoma. J Clin Invest (2012) 123(1):517–25. doi: 10.1172/jci65833
5. Kang SK, Reinhold C, Atri M, Benson CB, Bhosale PR, Jhingran A, et al. ACR appropriateness criteria ® Staging and follow-up of ovarian cancer. J Am Coll Radiol (2018) 15(5):S198–207. doi: 10.1016/j.jacr.2018.03.015
6. Forstner R. Radiological staging of ovarian cancer: imaging findings and contribution of CT and MRI. Eur Radiol (2007) 17(12):3223–35. doi: 10.1007/s00330-007-0736-5
7. Iyer V, Lee S. MRI, CT, and PET/CT for ovarian cancer detection and adnexal lesion characterization. AJR Am J Roentgenol (2010) 194(2):311–21. doi: 10.2214/ajr.09.3522
8. Fischerova D, Burgetova A. Imaging techniques for the evaluation of ovarian cancer. Best Pract Res Clin Obstet Gynaecol (2014) 28(5):697–720. doi: 10.1016/j.bpobgyn.2014.04.006
9. Virarkar M, Ganeshan D, Gulati AT, Palmquist S, Iyer R, Bhosale P. Diagnostic performance of PET/CT and PET/MR in the management of ovarian carcinoma—a literature review. Abdominal Radiol (2021) 46(6):2323–49. doi: 10.1007/s00261-020-02847-2
10. Wen R, Zhang M, Xu R, Gao Y, Liu L, Chen H, et al. COVID-19 imaging, where do we go from here? Bibliometric analysis of medical imaging in COVID-19. Eur Radiol (2023) 33(5):3133–43. doi: 10.1007/s00330-023-09498-z
11. Han Y, Wennersten SA, Lam MPY. Working the literature harder: what can text mining and bibliometric analysis reveal? Expert Rev Proteomics (2019) 16(11-12):871–3. doi: 10.1080/14789450.2019.1703678
12. Donthu N, Kumar S, Mukherjee D, Pandey N, Lim WM. How to conduct a bibliometric analysis: An overview and guidelines. J Business Res (2021) 133:285–96. doi: 10.1016/j.jbusres.2021.04.070
13. Duan Y, Zhang P, Zhang T, Zhou L, Yin R. Characterization of global research trends and prospects on platinum-resistant ovarian cancer: a bibliometric analysis. Front Oncol (2023) 13:1151871. doi: 10.3389/fonc.2023.1151871
14. Baghban N, Ullah M, Nabipour I. The current trend of exosome in epithelial ovarian cancer studies: A bibliometric review. Front Pharmacol (2023) 14:1082066. doi: 10.3389/fphar.2023.1082066
15. El Bairi K, Al Jarroudi O, Afqir S. Tracing ovarian cancer research in Morocco: A bibliometric analysis. Gynecol Oncol Rep (2021) 37:100777. doi: 10.1016/j.gore.2021.100777
16. Liu Y, Liu Q, Jiang X. Bibliometric analysis of hotspots and frontiers in cancer-related fatigue among ovarian cancer survivors. PloS One (2022) 17(9):e0274802. doi: 10.1371/journal.pone.0274802
17. Liu J, Ma J, Zhang J, Li C, Yu B, Choe HC, et al. Bibliometric and visualized analysis of drug resistance in ovarian cancer from 2013 to 2022. Front Oncol (2023) 13:1173863. doi: 10.3389/fonc.2023.1173863
19. Lotka AJ. The frecuency distribution of scientific productivity. J Wash Acad Sci; (1926) 26:317–23.
21. Assenov Y, Ramírez F, Schelhorn S-E, Lengauer T, Albrecht M. Computing topological parameters of biological networks. Bioinformatics (2007) 24(2):282–4. doi: 10.1093/bioinformatics/btm554
22. Chen C, Dubin R, Kim M. Emerging trends and new developments in regenerative medicine: a scientometric update (2000 - 2014). Expert Opin Biol Ther (2014) 14(9):1295–317. doi: 10.1517/14712598.2014.920813
23. Chen C. Science mapping: A systematic review of the literature. J Data Inf Sci (2017) 2(2):1–40. doi: 10.1515/jdis-2017-0006
24. Timmerman D, Valentin L, Bourne TH, Collins WP, Verrelst H, Vergote I. Terms, definitions and measurements to describe the sonographic features of adnexal tumors: a consensus opinion from the International Ovarian Tumor Analysis (IOTA) group. Ultrasound Obstet Gynecol (2000) 16(5):500–5. doi: 10.1046/j.1469-0705.2000.00287.x
25. Jacobs I, Oram D, Fairbanks J, Turner J, Frost C, Grudzinskas J. A risk of Malignancy index incorporating CA 125, ultrasound and menopausal status for the accurate preoperativediagnosis of ovarian cancer. Br J Obstet Gynaecol (1990) 97(10):922–9. doi: 10.1111/j.1471-0528.1990.tb02448.x
26. Sassone AM, Timor-Tritsch IE, Artner A, Westhoff C, Warren WB. Transvaginal sonographic characterization of ovarian disease: evaluation of a new scoring system to predict ovarian Malignancy. Obstet Gynecol (1991) 78:70–6.
27. Bristow RE, Tomacruz RS, Armstrong DK, Trimble EL, Montz FJ. Survival effect of maximal cytoreductive surgery for advanced ovarian carcinoma during the platinum era: a meta-analysis. J Clin Oncol (2002) 20:1248–59. doi: 10.1200/JCO.2002.20.5.1248
28. Vergote I, Tropé C, Amant F, Kristensen G, Ehlen T, Johnson N, et al. Neoadjuvant chemotherapy or primary surgery in stage IIIC or IV ovarian cancer. New Engl J Med (2010) 363(10):943–53. doi: 10.1056/NEJMoa0908806
29. Widschwendter P, Blersch A, Friedl TWP, Janni W, Kloth C, de Gregorio A, et al. CT scan in the prediction of lymph node involvement in ovarian cancer-a retrospective analysis of a tertiary gyneco-oncological unit. Geburtshilfe Frauenheilkd (2020) 80:518–25. doi: 10.1055/a-1079-5158
30. van 't Sant I, Engbersen MP, Bhairosing PA, Lambregts DMJ, Beets-Tan RGH, van Driel WJ, et al. Diagnostic performance of imaging for the detection of peritoneal metastases: a metaanalysis. Eur Radiol (2020) 30:3101–12. doi: 10.1007/s00330-019-06524-x
31. Axtell AE, Lee MH, Bristow RE, Dowdy SC, Cliby WA, Raman S, et al. Multi-Institutional reciprocal validation study of computed tomography predictors of suboptimal primary cytoreduction in patients with advanced ovarian cancer. J Clin Oncol (2007) 25:384–9. doi: 10.1200/JCO.2006.07.7800
32. Gu P, LL P, Wu S-Q, Sun L, Huang G. Ca 125, PET alone, PETCT, CT and MRI in diagnosing recurrent ovarian carcinoma: a systematic review and meta-analysis. Eur J Radiol (2009) 71:164–74. doi: 10.1016/j.ejrad.2008.02.019
33. Dai G, Liang K, Xiao Z, Yang Q, Yang S. A meta-analysis on the diagnostic value of diffusion-weighted imaging on ovarian cancer. J BUON (2019) 24:2333–40.
34. Tempany CM, Zou KH, Silverman SG, Brown DL, Kurtz AB, McNeil BJ. Staging of advanced ovarian cancer: comparison of imaging modali-ties-report from the Radiological Diagnostic Oncology Group. Radiology (2000) 215:761–7. doi: 10.1148/radiology.215.3.r00jn25761
35. He T, Zou J, Sun K, Yang J, Lei T, Xu L, et al. Global research status and frontiers on microvascular invasion of hepatocellular carcinoma: A bibliometric and visualized analysis. Front Oncol (2022) 12:1037145. doi: 10.3389/fonc.2022.1037145
36. Khiewvan B, Torigian DA, Emamzadehfard S, Paydary K, Salavati A, Houshmand S, et al. An update on the role of PET/CT and PET/MRI in ovarian cancer. Eur J Nucl Med Mol Imaging (2017) 44:1079–91. doi: 10.1007/s00259-017-3638-z
37. Moyle P, Addley H, Sala E. Radiological staging of ovarian carcinoma. Semin Ultrasound CT MR (2010) 31(5):388–98. doi: 10.1053/j.sult.2010.07.003
38. Mi D, Zhang Y. Prognostic value of serum HE4 in patients with advanced ovarian, fallopian tube, and peritoneal carcinoma. Arch Gynecol Obstet (2020) 301:779–85. doi: 10.1007/s00404-020-05447-z
39. Zhao T, Hu W. CA125 and HE4: measurement tools for ovarian cancer. Gynecol Obstet Invest (2016) 81:430–5. doi: 10.1159/000442288
40. Moore RG, Miller MC, Disilvestro P, Landrum LM, Gajewski W, Ball JJ, et al. Evaluation of the diagnostic accuracy of the risk of ovarian Malignancy algorithm in women with a pelvic mass. Obstet Gynecol (2011) 118:280–8. doi: 10.1097/AOG.0b013e318224fce2
41. Gordon AN, Tonda M, Sun S, Rackoff W. Long-term survival advantage for women treated with pegylated liposomal doxorubicin compared with topotecan in a phase 3 randomized study of recurrent and refractory epithelial ovarian cancer. Gynecol Oncol (2004) 95:1–8. doi: 10.1016/j.ygyno.2004.07.011
42. Yang X, Fu C. The potential feasibility of nab-paclitaxel as the first-line chemotherapy for ovarian cancer: clinical development and future perspectives. Arch Gynecol Obstet (2022) 306(5):1417–29. doi: 10.1007/s00404-022-06425-3
43. Zhang H, Mao Y, Chen X, Wu G, Liu X, Zhang P, et al. Magnetic resonance imaging radiomics in categorizing ovarian masses and predicting clinical outcome: a preliminary study. Eur Radiol (2019) 29(7):3358–71. doi: 10.1007/s00330-019-06124-9
44. Akazawa M, Hashimoto K. Artificial intelligence in gynecologic cancers: Current status and future challenges - A systematic review. Artif Intell Med (2021) 120:102164. doi: 10.1016/j.artmed.2021.102164
Keywords: ovarian cancer, medical imaging, bibliometric analysis, collaborative network, Citespace
Citation: Leng Y, Li S, Zhu J, Wang X, Luo F, Wang Y and Gong L (2023) Application of medical imaging in ovarian cancer: a bibliometric analysis from 2000 to 2022. Front. Oncol. 13:1326297. doi: 10.3389/fonc.2023.1326297
Received: 23 October 2023; Accepted: 14 November 2023;
Published: 04 December 2023.
Edited by:
Zhongzhi Wu, University of Tennessee Health Science Center (UTHSC), United StatesReviewed by:
Yang Xie, University of Tennessee Health Science Center (UTHSC), United StatesRuida Hou, St. Jude Children’s Research Hospital, United States
Copyright © 2023 Leng, Li, Zhu, Wang, Luo, Wang and Gong. This is an open-access article distributed under the terms of the Creative Commons Attribution License (CC BY). The use, distribution or reproduction in other forums is permitted, provided the original author(s) and the copyright owner(s) are credited and that the original publication in this journal is cited, in accordance with accepted academic practice. No use, distribution or reproduction is permitted which does not comply with these terms.
*Correspondence: Lianggeng Gong, Z29uZzExMTk5OUAxMjYuY29t