 Shunmin Qiu1
 Zhemin Zhuang
- 1Department of Ultrasound, First Affiliated Hospital of Shantou University Medical College, Shantou, Guangdong, China
- 2School of Biomedical Engineering, Sun Yat-sen University, Shenzhen, Guangdong, China
- 3Product Development Department, Shantou Institute of Ultrasonic Instruments, Shantou, Guangdong, China
- 4Department of Ultrasound, Shantou Chaonan Minsheng Hospital, Shantou, Guangdong, China
- 5Engineering College, Shantou University, Shantou, Guangdong, China
Introduction: AI-assisted ultrasound diagnosis is considered a fast and accurate new method that can reduce the subjective and experience-dependent nature of handheld ultrasound. In order to meet clinical diagnostic needs better, we first proposed a breast lesions AI classification model based on ultrasound dynamic videos and ACR BI-RADS characteristics (hereafter, Auto BI-RADS). In this study, we prospectively verify its performance.
Methods: In this study, the model development was based on retrospective data including 480 ultrasound dynamic videos equivalent to 18122 static images of pathologically proven breast lesions from 420 patients. A total of 292 breast lesions ultrasound dynamic videos from the internal and external hospital were prospectively tested by Auto BI-RADS. The performance of Auto BI-RADS was compared with both experienced and junior radiologists using the DeLong method, Kappa test, and McNemar test.
Results: The Auto BI-RADS achieved an accuracy, sensitivity, and specificity of 0.87, 0.93, and 0.81, respectively. The consistency of the BI-RADS category between Auto BI-RADS and the experienced group (Kappa:0.82) was higher than that of the juniors (Kappa:0.60). The consistency rates between Auto BI-RADS and the experienced group were higher than those between Auto BI-RADS and the junior group for shape (93% vs. 80%; P = .01), orientation (90% vs. 84%; P = .02), margin (84% vs. 71%; P = .01), echo pattern (69% vs. 56%; P = .001) and posterior features (76% vs. 71%; P = .0046), While the difference of calcification was not significantly different.
Discussion: In this study, we aimed to prospectively verify a novel AI tool based on ultrasound dynamic videos and ACR BI-RADS characteristics. The prospective assessment suggested that the AI tool not only meets the clinical needs better but also reaches the diagnostic efficiency of experienced radiologists.
1 Introduction
According to the latest statistics on cancer incidence and mortality from the International Agency for Research on Cancer (GRIBOCAN) in 2020, breast cancer incidence has risen to the top and become the first cause of death among women worldwide (1). Early screening for breast cancer is crucial to reducing death rates. National guidelines for breast cancer screening vary from country to country. Due to the high proportion of dense breasts in Chinese women and the low sensitivity of mammography, the National Cancer Centre of China proposes that the ultrasound (US) should be the preferred method for breast cancer screening in Chinese women and recommends that women over 45 years old should be screened by ultrasound alone every 1-2 years (2). China has a large population which brings the heavy workload of breast cancer ultrasound screening. Therefore, it is necessary to develop a clinical application AI tool that can assist in diagnosis quickly and efficiently.
In clinical practice, to improve the accuracy of diagnosis, standardize ultrasound description, and communicate effectively with the physician, worldwide radiologists generally use the American College of Radiology Breast Imaging Reporting and Data System (ACR BI-RADS) lexicon for breast US (3). The radiologist scans the whole breast with handheld ultrasound and gives BI-RADS category. However, since handheld ultrasound depends on the operators and experience, different radiologists have different opinions on the interpretation of BI-RADS characteristics, resulting in a high inter-observer variability, poor repeatability and low work efficiency (4–6).
To the best of our knowledge, AI is the most likely tool to improve diagnostic effectiveness and reduce the subjective and experience-dependent nature of handheld ultrasound. In recent years, with the continuous application of AI in clinics, deep learning has been favored by human experts due to its strong capacity for autonomous feature extraction and expression (7). Several studies applied deep learning to classify US images of breast lesions and have reported that it could achieve a high diagnostic performance similar to or better than that of experienced radiologists. Becker et al. (8) used a deep neural network to identify malignant lesions in 637 breast lesions. Han et al. (9) used the GoogLeNet convolutional neural network to classify benign and malignant ultrasound images of 7408 breast lesions. However, these studies are all based on a keyframe image which was not in accord with the actual situation of the clinical ultrasound dynamic scan. Moreover, a single static image cannot contain all the information about the entire breast lesion. In addition, studies (10, 11) showed that one person may also have other diagnoses within videos and static images for one lesion. Youk et al. (12) showed that in radiologists’ interpretation of BI-RADS characteristics, videos had a higher diagnostic performance than static images. What’s more, the above studies all belong to the benign and malignant dichotomy, which is of little clinical guiding significance compared with the multi-classification of BI-RADS. Ciritsis et al. (13) and Qian et al. (14) tried to use deep learning to conduct multi-classification studies of BI-RADS on breast lesions. However, they all merged BI-RADS 4a, 4b, and 4c into category 4, which was not in line with clinical practice, and at the same time, they still failed to overcome the limitations of using static images.
To overcome the above limitations, we first proposed an approach to scan the breast lesions and record their ultrasound dynamic videos per unified criteria, obtaining ACR BI-RADS morphological characteristics, and realizing the BI-RADS category. Compared to traditional methods based on single-frame static images, it not only captures comprehensive and complete breast lesion information, avoiding missing lesion features in static images but also better suits clinical diagnostic scenarios. In this approach, we introduce an AI diagnostic model (hereafter, Auto BI-RADS), which includes a YOLOV5 network with improved attention mechanism and morphological image processing algorithms. Based on effectively screening, localizing, and capturing tumor lesions in breast ultrasound dynamic videos, Auto BI-RADS can obtain BI-RADS morphological characteristics, achieve BI-RADS category and make a benign or malignant prediction. In this study, we prospectively verified its performance through a comparative test.
2 Materials and methods
2.1 Study sample
The institutional review board approved this study, and the requirement to obtain informed consent was waived (approval number: B-2022-182). In the development of Auto BI-RADS, we include retrospective data from the First Affiliated Hospital of Shantou University Medical College (Guangdong, China) with a total of 480 pathologically proven lesions. Figure 1 presents the inclusion and exclusion criteria. A total of 480 ultrasound dynamic videos equivalent to 18122 static images comprised the training and validation sets at 3:1 (mean age, 45 years; range, 18–82 years, May 2019 to June 2022). In the testing study, the dataset was screened with the same criteria and included two hospitals: internal test set (mean age 45 years, range,19-76 years, First Ultrasound Department, First Affiliated Hospital of Shantou University Medical College[Hospital 1], July 2022 to March 2023, n = 228); and external test set (Mean age: 50 years old; range,26-73 years old; Ultrasound Department, Shantou Chaonan Mingsheng Hospital [Hospital 2], July 2022 to March 2023, n = 64). A flowchart describing the research process is shown in Figure 1. Baseline clinical pathologic data, including age, sex, pathologic findings, and US diagnosis reports, were derived from the medical records. US video data were recorded by two experienced radiologists per the criteria below (SM.Q., with 7-8 years of experience, Hospital 1; JH.W., with 11-12 years of experience, Hospital 2).
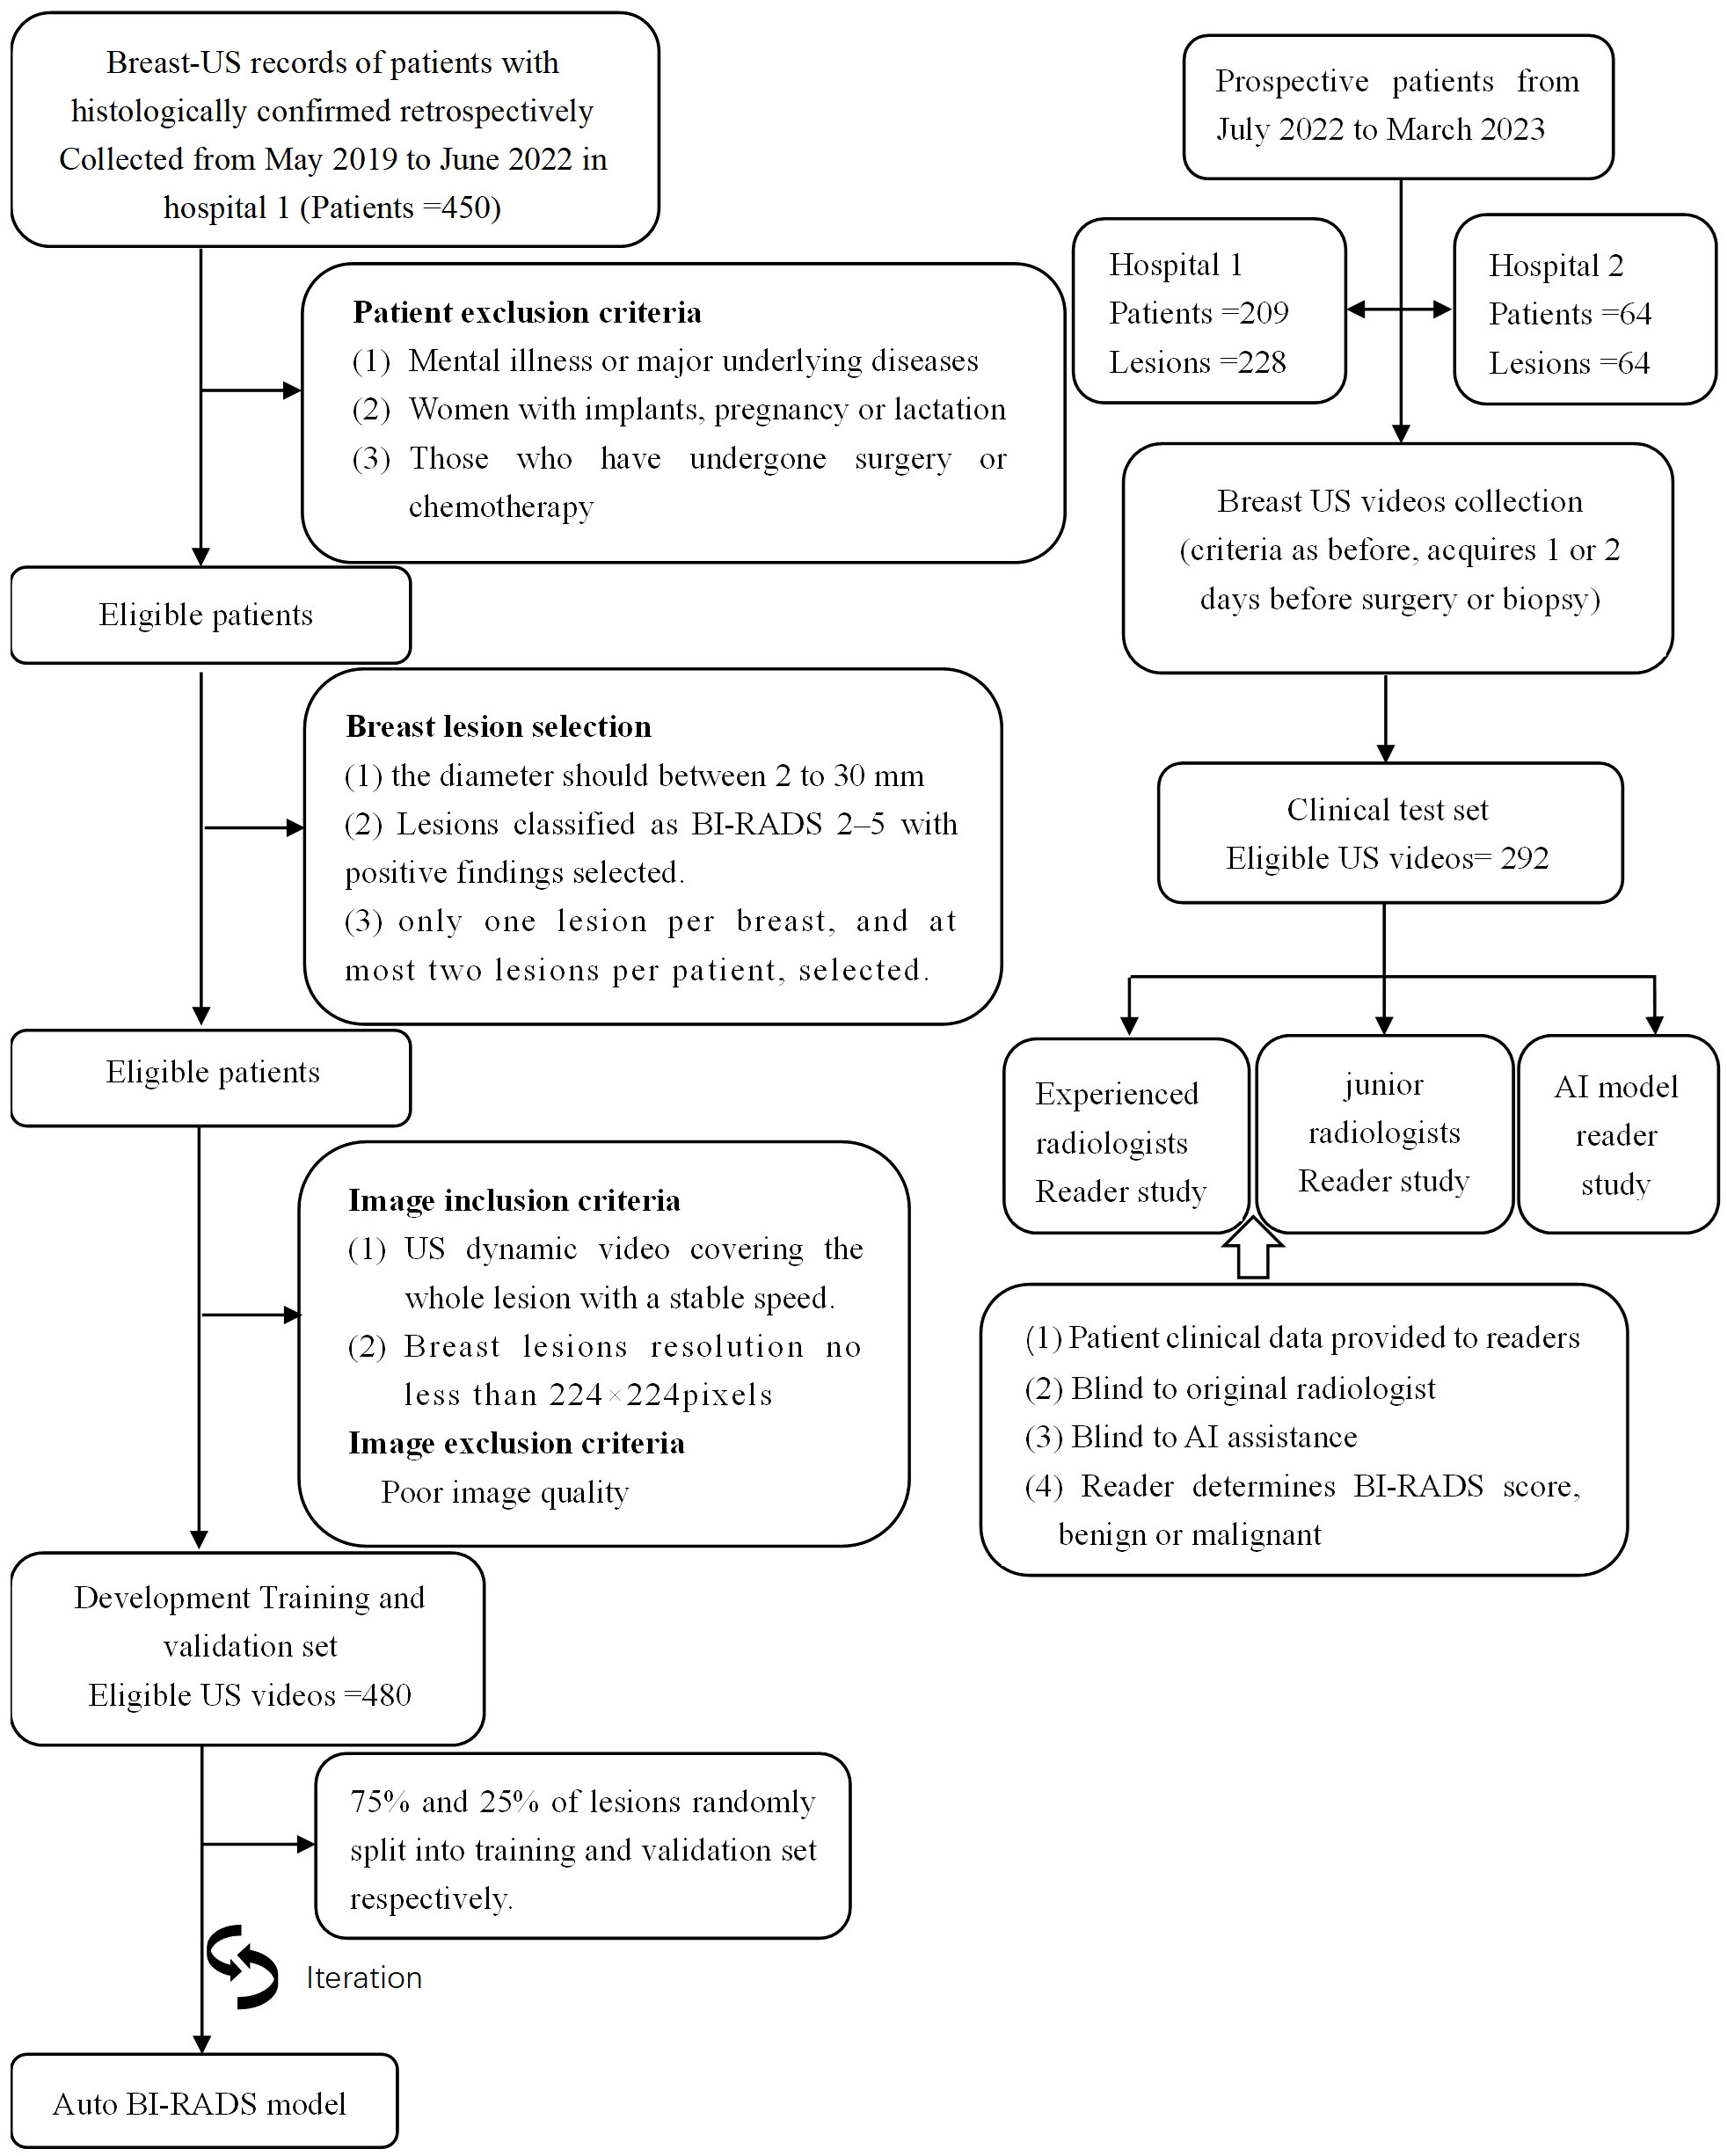
Figure 1 Overview of the retrospective and prospective workflow. It should be pointed out that all BI-RADS categories in this study were determined on 2D US videos exclusively.
2.2 US examination
US examinations were performed with linear array transducers of real-time US systems. All patients in hospital 1 were examined with the following US scanners: Canon Toshiba (Japan, Aplio I800, L9-18 MHz), SIUI (China, Apogee 6800, L8-12 MHz), and Siemens (Germany, Acuson S3000, L9-12MHz). Patients in hospital 2 were examined with Siemens (Germany, Acuson Sequoia, L4-10MHz).
US video acquisition: The patients held the supine position and raised their hands to fully expose their axilla and breast. We selected the maximum transverse diameter section of breast lesions and used the body mark showing the position; adjusted the depth to place the lesions in the center of the screen and the focus at the bottom of them; activated the storage function; kept the transducer at a constant speed to scan the lesions until some normal breast tissues appear, and pressed the storage key to acquire the video.
2.3 US image analysis
The six lexicon categories of BI-RADS were labeled as identifying features (shape, orientation, margin, echo pattern, posterior acoustic features, and calcification). The shape was a binary classification feature: regular or irregular; orientation was also binary: parallel or not parallel; the margin was another binary feature: circumscribed or not circumscribed. The echo pattern was mapped to three binary classification features: Anechoic, homogeneous echo (including homogeneous low, equal, and high echoes), heterogeneous echo (including heterogeneous solid and cystic-solid echoes); Posterior acoustic features are also classified into three classification features: no change, enhancement, or shadowing. Calcification is the last category, classified into three classification features: no calcification, coarse calcification, and punctate calcification (Figure 2).
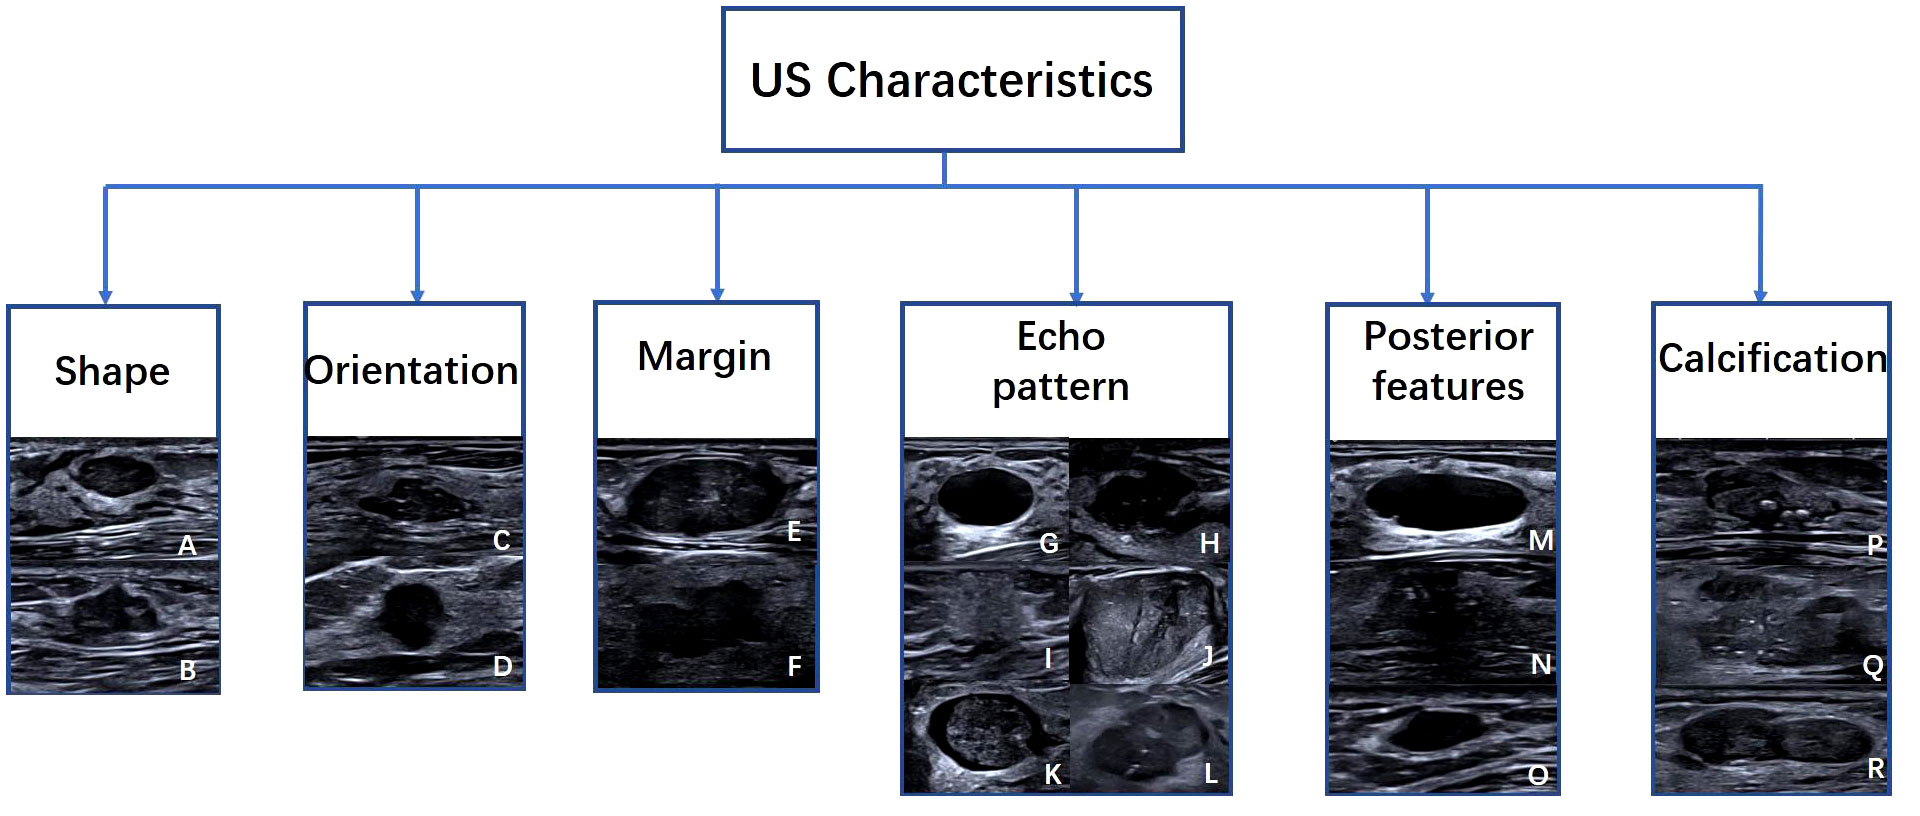
Figure 2 Examples of US images with Six American College of Radiology Breast Imaging Reporting and Data System characteristics. Characteristics include (A) regular, (B) irregular, (C) parallel, (D) not parallel, (E) circumscribed, (F) not circumscribed, (G) Anechoic, (H) hypoechoic, (I) hyperechoic, (J) Isoechoic, (K) complex cystic and solid, (L) heterogeneous, (M) enhancement, (N) shadowing, (O) no posterior features, (P) macrocalcifications, (Q) punctate echogenic foci, (R) no calcification.
In the training set, two experienced radiologists (DP.L. and XX.C, both with 10 years of US experience) were blinded to histopathologic results and independently manually labeled masks for each breast lesion video. Image classification was then performed based on the fifteen features of the six main BI-RADS lexicon. Groups would make a discussion to reach a consensus. In the validation dataset, the initial performance of Auto BI-RADS was evaluated by those two radiologists.
For the test data set, four radiologists blinded to histopathologic results were split into two groups: experienced radiologists (BQ.Z. and XY.L., with 30 and 28 years of ultrasound work experience, respectively) and junior radiologists (ZY.L. and X.C., with 3 and 4 years of ultrasound work experience, respectively). Each radiologist independently evaluated the features of breast lesions in dynamic videos and determined the benign or malignant nature of the mass. When the evaluation results were inconsistent, a group consensus was reached through discussion.
2.4 AI model development
2.4.1 The establishment of Auto BI-RADS diagnosis model
The diagnostic AI model of Auto BI-RADS consists of three parts (Figure 3). The first part is based on the YOLOV 5 attention and segment network for object detection and segmentation. This model first converts the input breast lesions US video into sequence frames and selects frames containing lesions, then extracts and segments the regions of interest and their corresponding masks (15–18). In order to improve the detection performance of the network, we added the simple attention mechanism (Sim AM) to the model, which enhances the recognition effect of the small breast tumor target. We also combined the binary cross entropy loss (BCE loss) function, focal loss (FL loss) function, and Complete-Intersection-Over-Union (CIOU) loss function to optimize the network (19, 20). The second part focuses on extracting features of breast lesions using image processing algorithms. In this part, tumor regions of interest and their corresponding masks are obtained. These regions of interest and masks undergo equalization processing and data augmentation (21). After that, morphological image processing algorithms are used to extract features such as shape, orientation, margin, echo pattern, posterior acoustic features, and calcification from these tumor slices. The third part involves a feature score fusion algorithm based on weighted thresholds. Because multiple and unevenly distributed features may present in the breast lesions ultrasound video sequences, we establish threshold values based on the proportion of frames in which different features appear. Then, we merge the scores of all detected features and use a rank threshold score table to divide the tumor into its BI-RADS category and distinguish its benign or malignant nature.
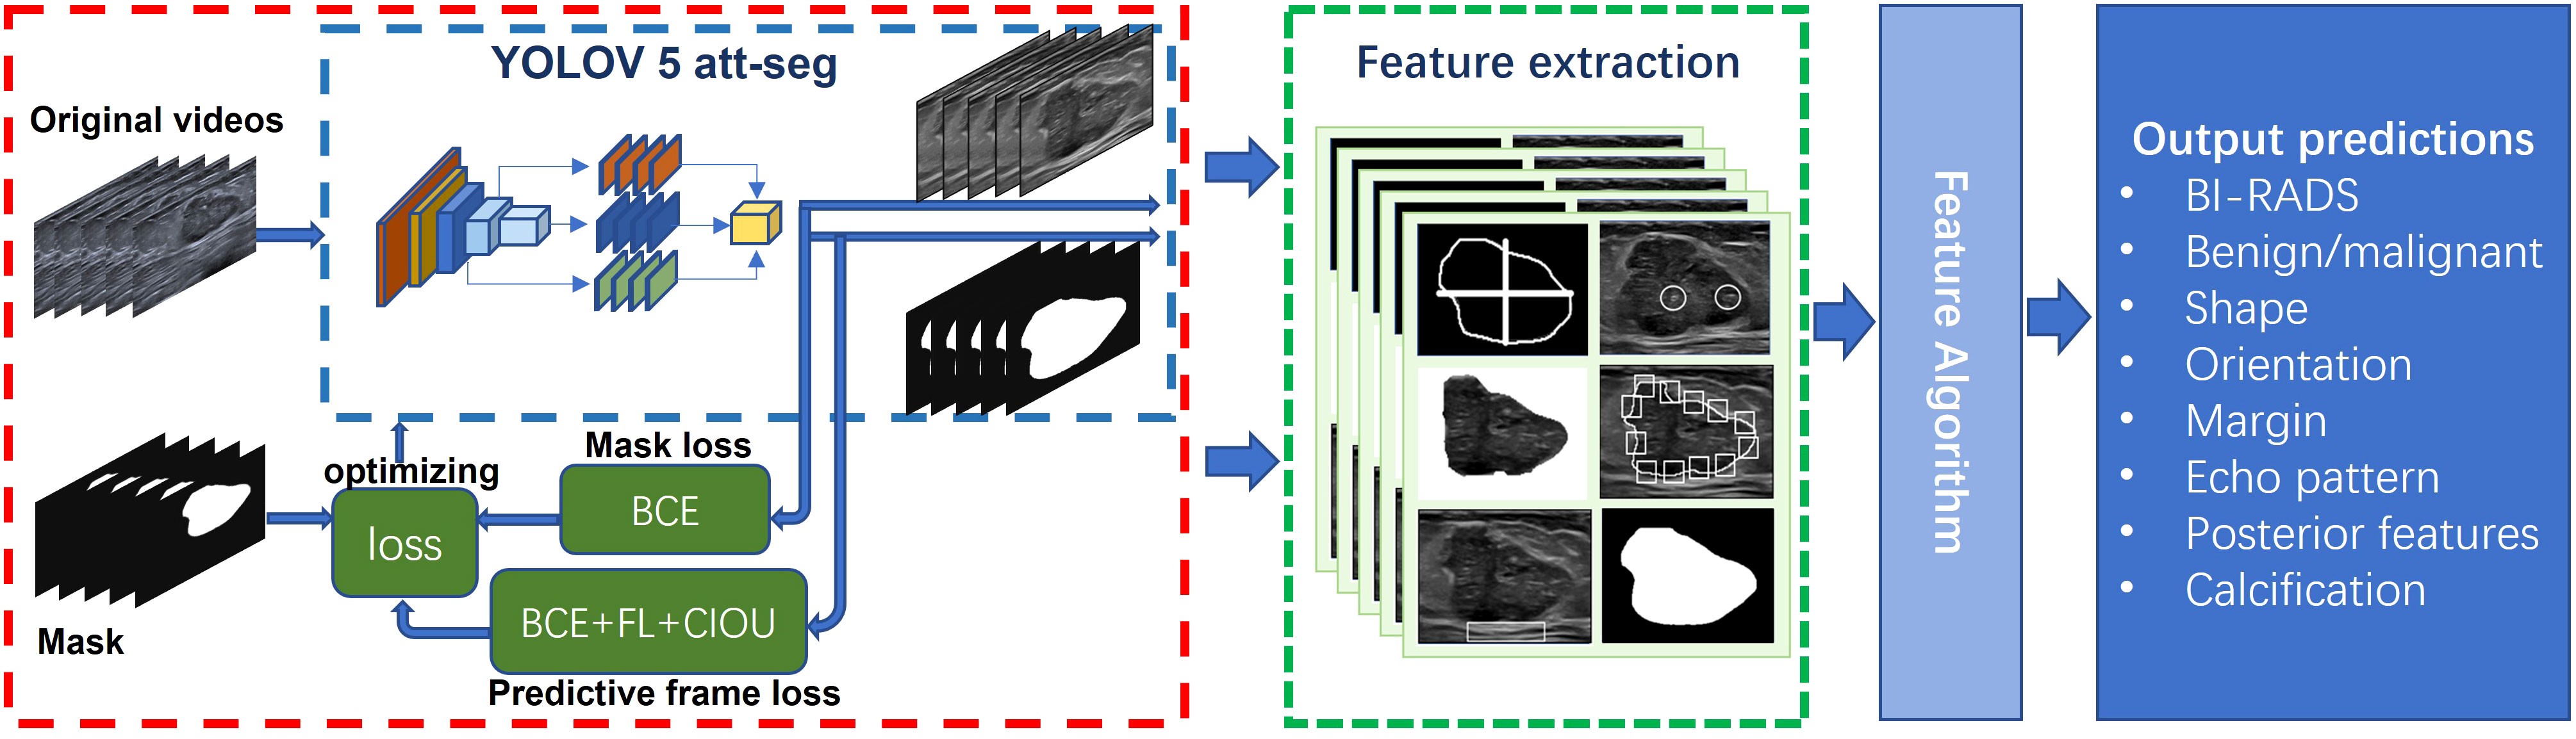
Figure 3 Proposed network scheme of the Auto BI-RADS model for breast lesions diagnosis based on American College of Radiology Breast Imaging Reporting and Data System US characteristics.
The predictive results of the Auto BI-RADS include the BI-RADS category, benign or malignant, and the assessment results of six significant features for each nodule. Figure 4 shows the prediction results of the Auto BI-RADS model in a case, compared with the interpretation results of experienced and junior radiologists.
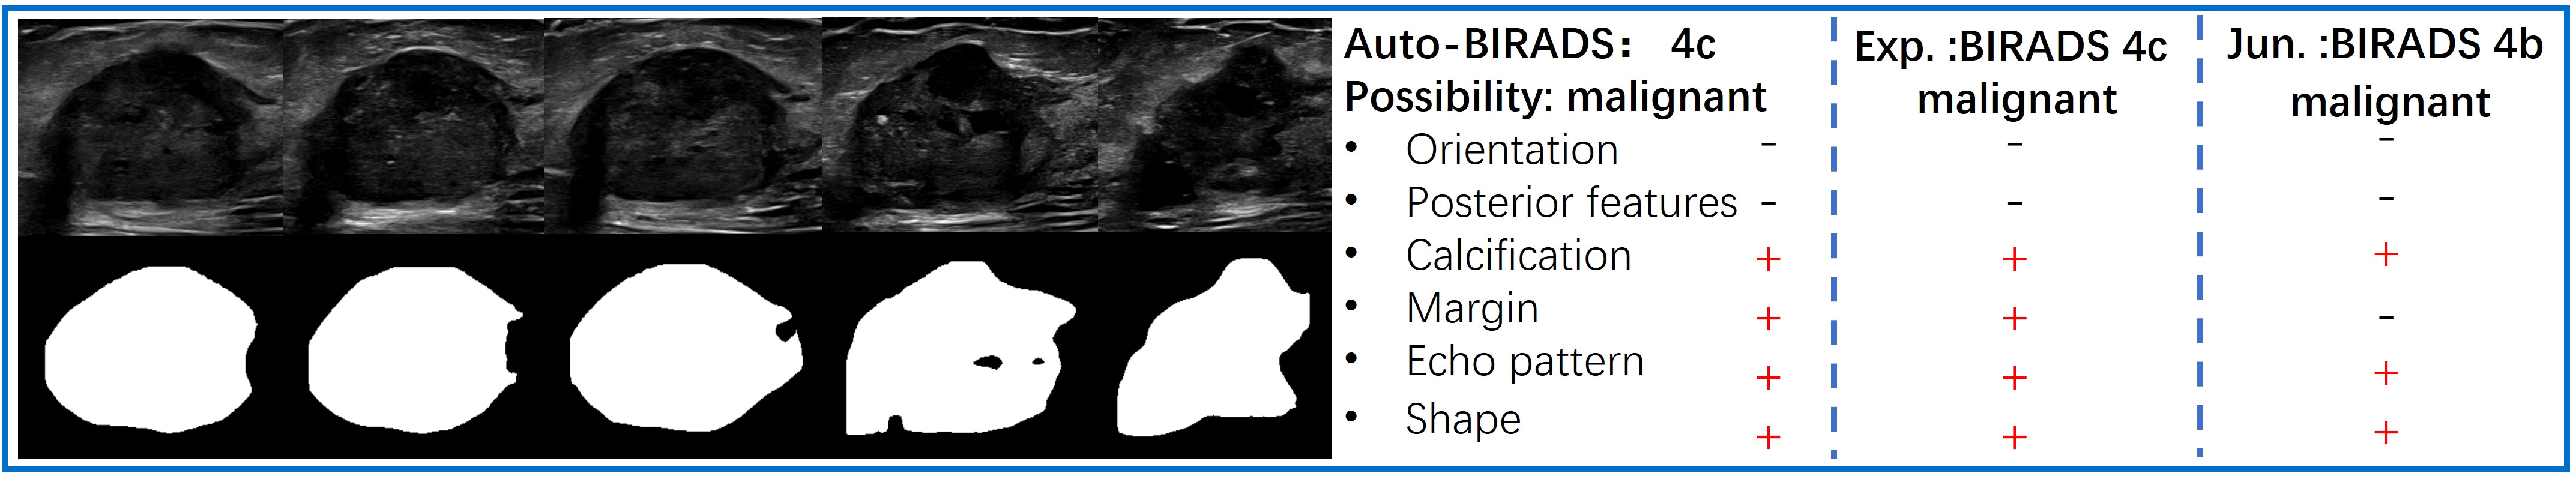
Figure 4 The left side displays a series of key frames extracted from an ultrasound dynamic video of a breast lesion that was pathologically proven as malignant. The right side shows the predictive results of the Auto BI-RADS model for the lesion based on ACR BI-RADS, as well as the interpretation results of the experienced (Exp.) and junior (Jun.) radiologists.
2.4.2 The design of the YOLOV5 att-seg network based on the Sim AM
The deep learning model in this study is the YOLOV5 network based on the Sim AM. Hereafter we call it the YOLOV5 Attention Segmentation model (YOLOV5 att-seg).
The YOLOV5 network model consists of feature extraction and feature processing. The feature extraction part includes a Cross Stage Partial Network (CSP Net) (21) and a Path Aggregation Network (PA Net) (16) (Figure 5).
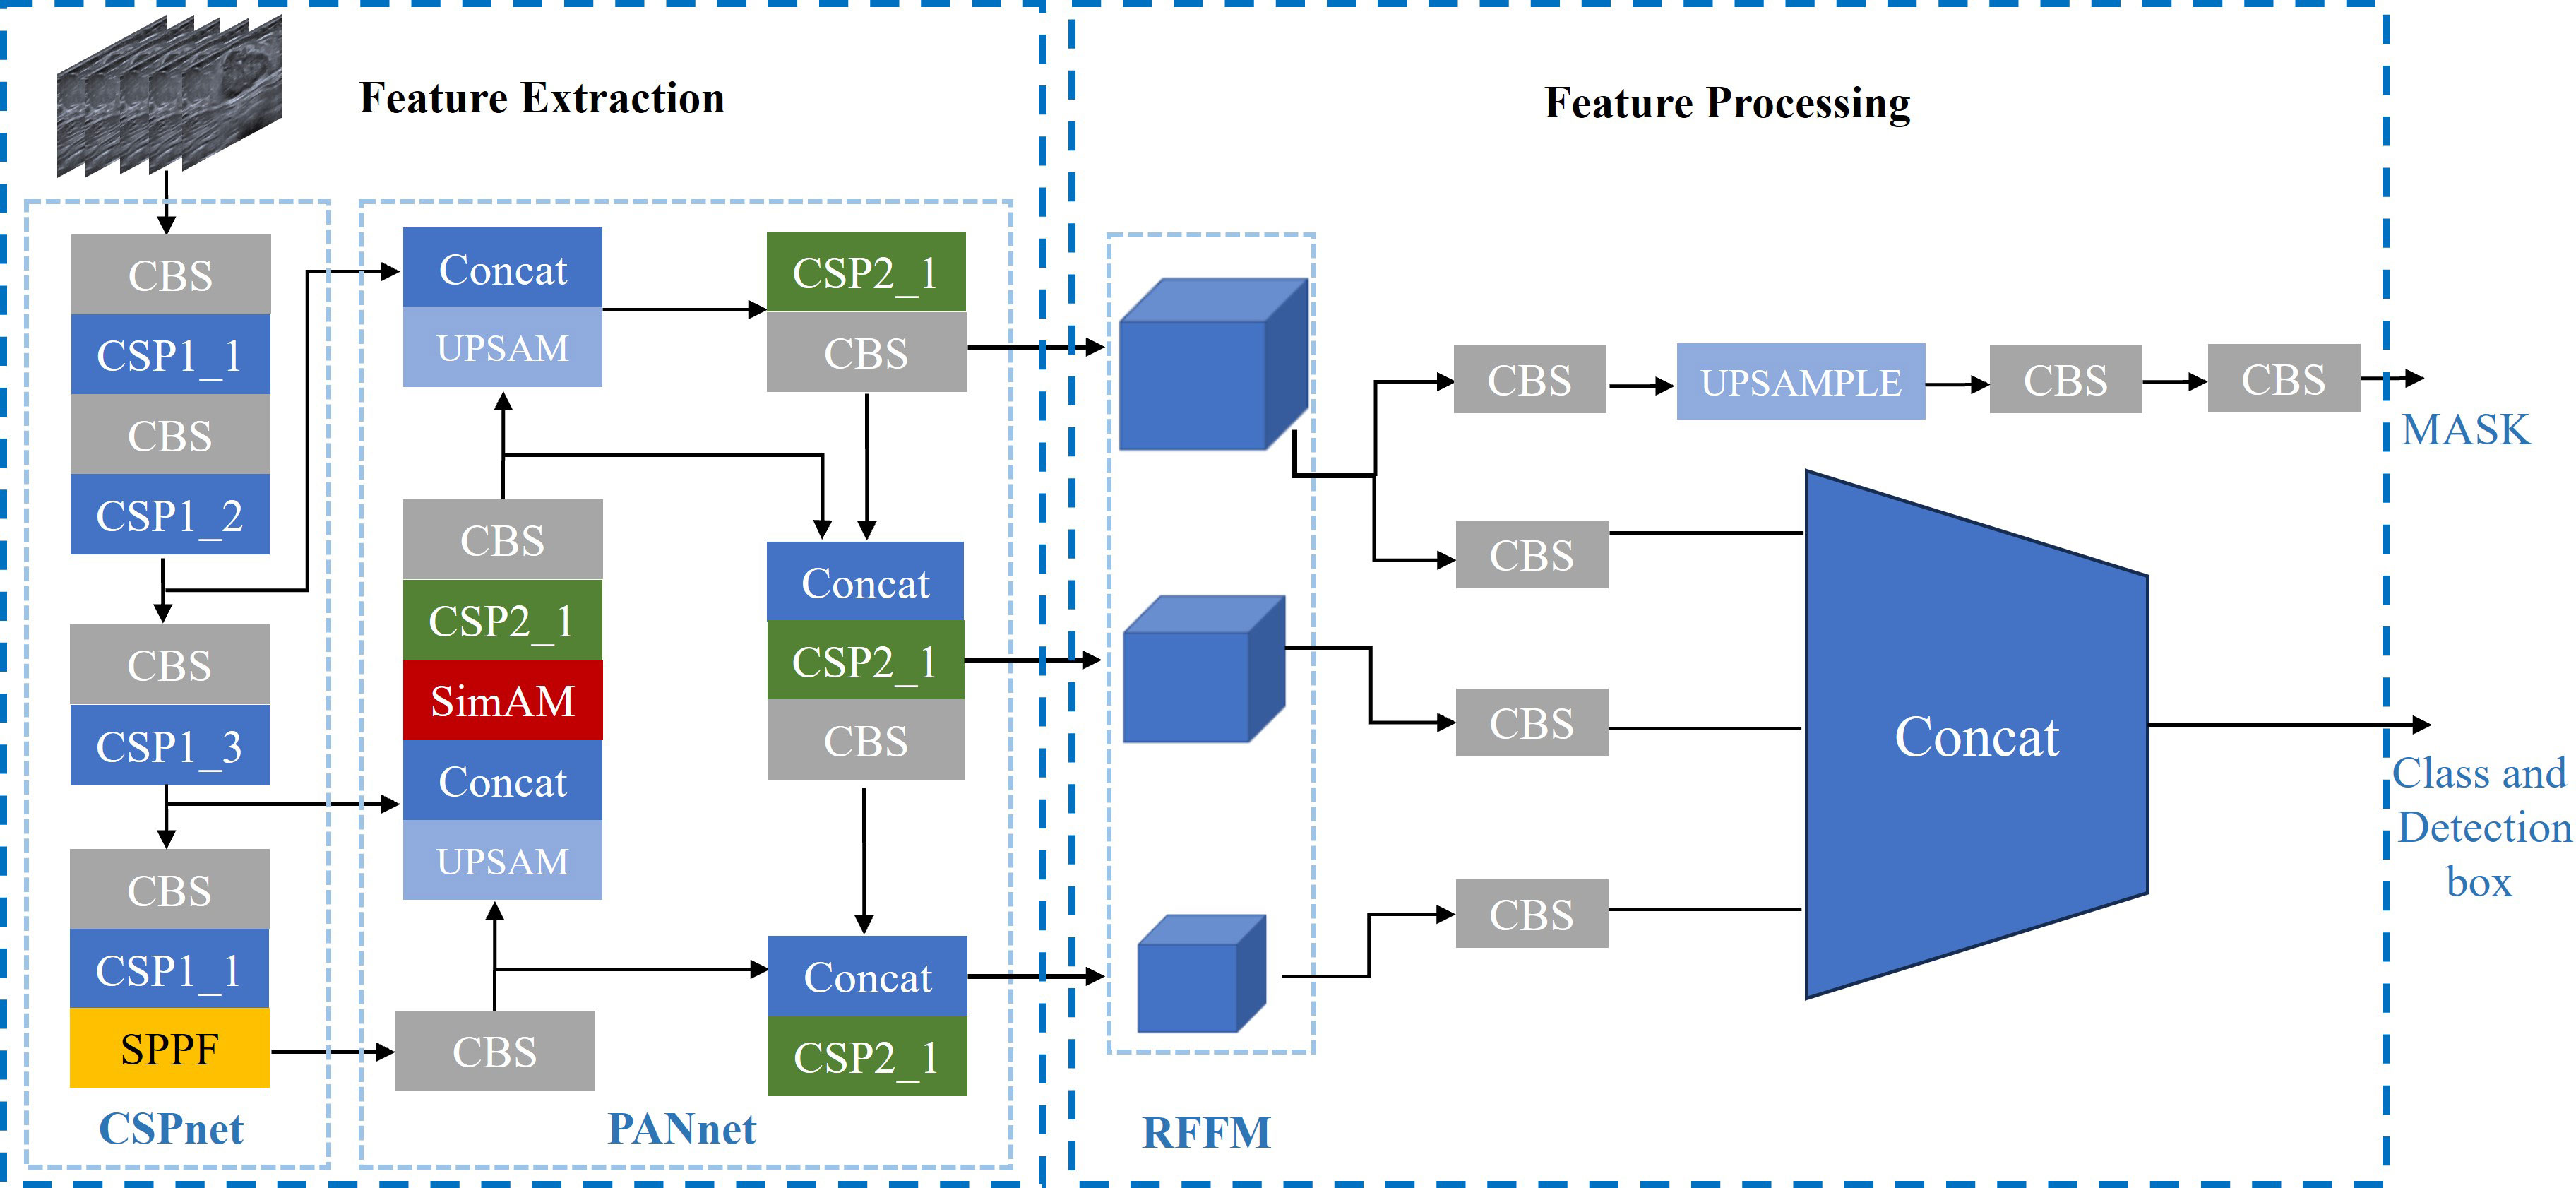
Figure 5 YOLOV5 att-seg Architecture.
The CSP net is primarily composed of multiple Conv+BatchNorm+SiLU (CBS) modules, Cross Stage Partial modules 1(CSP1), and spatial pyramid pooling fast (SPPF) modules. This network extensively utilizes residual structures and convolutional modules for refining image features and reducing feature map dimensions through downsampling. Additionally, it preserves feature maps at different depths within the network, allowing subsequent parts of the PA Net network to further integrate features from different levels.
The PA Net Network is primarily used for generating feature pyramids to enhance the model’s detection of objects at different scales. It is an improvement based on the Feature Pyramid Network (FPN) architecture. The network consists of CBS modules, CSP2 modules, and Sim AM modules. Since CSP Net already captures sufficiently deep-level feature information, a non-residual module called CSP2 is used in the PA Net section to accelerate training and inference speed. The inclusion of Sim AM aims to further enhance the network’s detection performance for small lesions. Sim AM is a parameter-free attention mechanism module based on the theory of neural energy functions (17). It calculates the neural energy of the input image and performs Hadamard multiplication with the input image to spontaneously enhance or suppress the neural pathways. (Figure 6) shows that YOLOV5 without Sim AM failed to identify tumor targets in some small breast tumor slices. However, the YOLOV5 att-seg model, which incorporates the Sim AM, exhibited improved detection performance for small tumor targets.
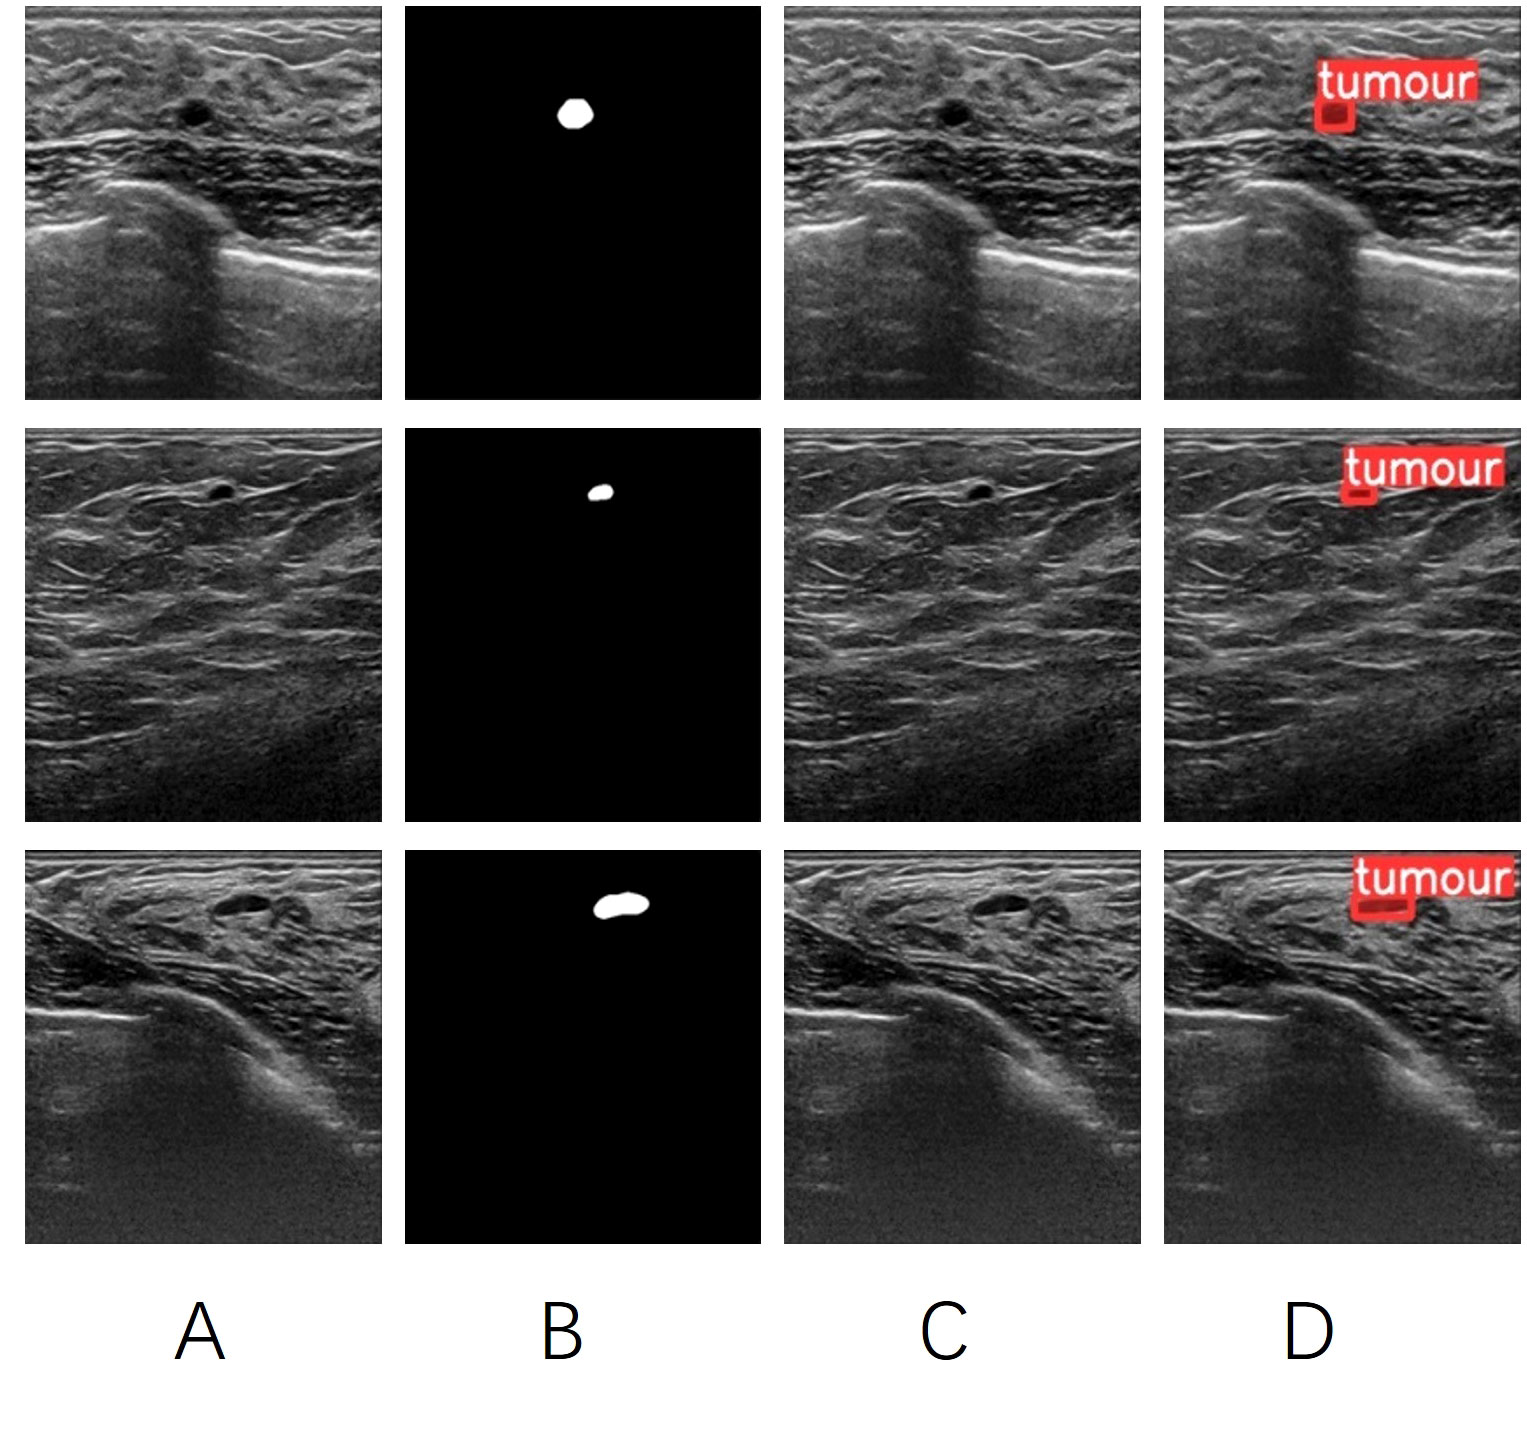
Figure 6 (A) the original image of a breast tumor. (B) the manually annotated ground truth by experienced physicians. (C) the detection results of YOLOV5 seg. (D) the detection results of YOLOV5 att-seg.
The second part is the feature processing section. It mainly involves processing the feature information obtained from the feature extraction section. The previous CSP Net and PA Net have effectively refined and aggregated the image features. Therefore, this part of the work is divided into two branches: mask segmentation and tumor target detection. One branch utilizes upsampling layers and CBS modules to further refine the edge information of the features, thereby obtaining better details of the mask edges. The other takes the three different-sized receptive field feature maps (RFFM) output by the PA Net network, adjusts them to the same dimension using CBS modules, and fuses them with the Concat function to enhance the network’s detection of objects of different sizes. Finally, the network outputs the categories and detection boxes (22).
2.4.3 Performance validation of the YOLOV5 att-seg network model
The YOLOV5 att-seg network in this study was trained using 18122 static images extracted from 480 ultrasound dynamic videos. The detection box data was obtained by extracting the bounding rectangles from the masks. 75% of the samples were used for network training. The network was trained for 300 epochs, and the results are shown in (Figure 7).

Figure 7 The box loss, segmentation loss, and target category loss of YOLOV5 att-seg achieve 0.0097, 0.0109, and 0.0034, respectively. It indicates that the network has achieved a good fit to the overall data.
In the remaining 25% samples for validation, we compared the detection performance of YOLOV5 att-seg with YOLOV5, Vgg-16 and Resnet50 networks. We also compared the segmentation performance of YOLOV5 att-seg with YOLOV5, Unet and Fcn-16s networks. The result is shown in Table 1.
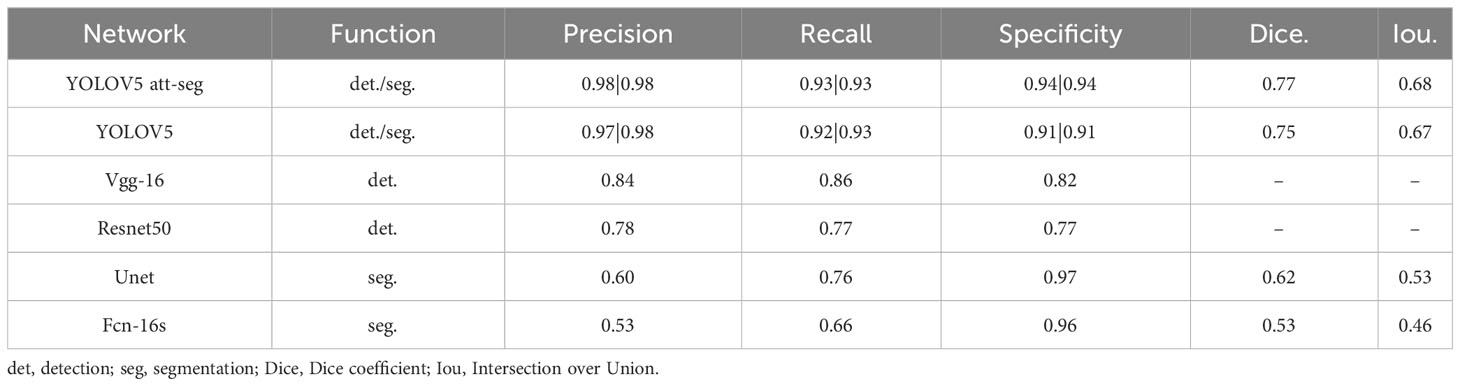
Table 1 Comparison of performance metrics for object detection and segmentation in validation set.
The detection result shows that YOLOV5 att-seg has an improved performance in detecting smaller tumors in ultrasound images. In comparison, YOLOV5 att-seg vs. YOLOV5 vs. Vgg-16 vs. Resnet50, the precision, recall, and specificity are (0.98, 0.93, 0.94, vs. 0.97, 0.92, 0.9, vs. 0.84, 0.86, 0.82, vs. 0.78, 0.77, 0.77), respectively.
The segmentation result shows that YOLOV5 att-seg has an improved performance in precision, recall, Dice. and Iou. comparing with YOLOV5, Unet and Fcn-16s (0.98, 0.93, 0.77,0.68, vs. 0.98, 0.93, 0.75,0.67, vs. 0.60, 0.76, 0.62,0.53, vs. 0.53, 0.66, 0.53,0.46, respectively). However, the specificity of YOLOV5 att-seg (0.94) was slightly lower than that of Unet (0.97) and Fcn-16s (0.96). This indicates that the YOLOV5 att-seg model used in this study achieves a more balanced performance compared to Unet and Fcn-16s. Unet and Fcn-16s tend to have overly conservative segmentation contours for ultrasound tumor targets, resulting in abnormally high specificity values. On the other hand, the enhancement in small target detection of YOLOV5 att-seg leads to improved segmentation performance compared to YOLOV5.
In terms of network running speed, YOLOV5 att-seg achieves significant improvement by using a single network to extract image features and obtain detection boxes and segmentation masks for tumor targets. This network demonstrates much faster speed compared to the traditional approach using separate networks for detection and segmentation.
2.5 Statistical analysis
The areas under the receiver operating characteristic curves (AUCs) with 95% confidence intervals (CI) were compared using the DeLong test (23) for Auto BI-RADS and two groups of radiologists. The threshold of Auto BI-RADS was established using validation sets. Performance metrics (sensitivity, specificity, positive predictive value, and negative predictive value) of Auto BI-RADS and the two groups of radiologists were evaluated. The Kappa test was used to compare the consistency of the breast lesion BI-RADS category between Auto BI-RADS and the two groups of radiologists. The McNemar test was used to compare the consistency rate of breast lesion characteristics recognition among Auto BI-RADS, the experienced group, and the junior group. Data were analyzed with SPSS, version 26.0 (IBM), and MedCalc, version 20.2 (MedCalc Software). P<0.05 was considered indicative of a statistically significant difference.
3 Results
3.1 Patient characteristics and clinical features of breast lesions
A total of 698 patients were included in this study. In model development, 420 patients (480 pathologically confirmed lesions: 284[60%] benign and 196 [40%)] malignant) from Hospital 1 were collected for training and validation in a 3:1 ratio. In the test data set, there were 278 patients (292 pathologically confirmed lesions: 168 [58%] benign and 124 [42%] malignant) from Hospitals 1 and 2. Figure 2 shows the workflow of patient inclusion and exclusion for model development and independent test. The specific pathological composition and distribution of the lesions are shown in Table 2.
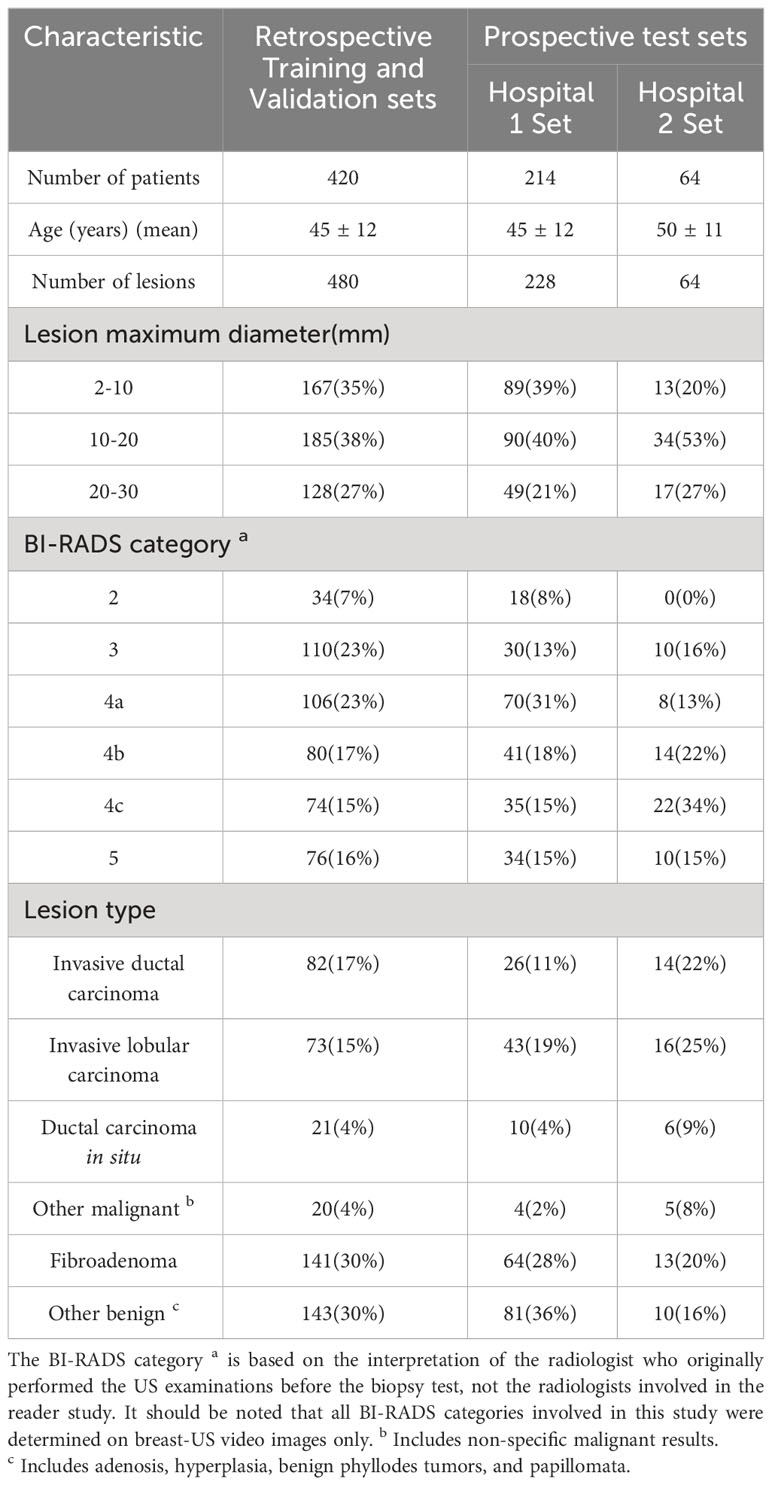
Table 2 Patient demographics data and breast lesion characteristics.
3.2 Performance of Auto BI-RADS experienced radiologists and junior radiologists for diagnosing benign and malignant breast lesions
In the test set, the AUC value was slightly lower than that of the experienced group but significantly higher than that of the junior group as shown in Figure 8.
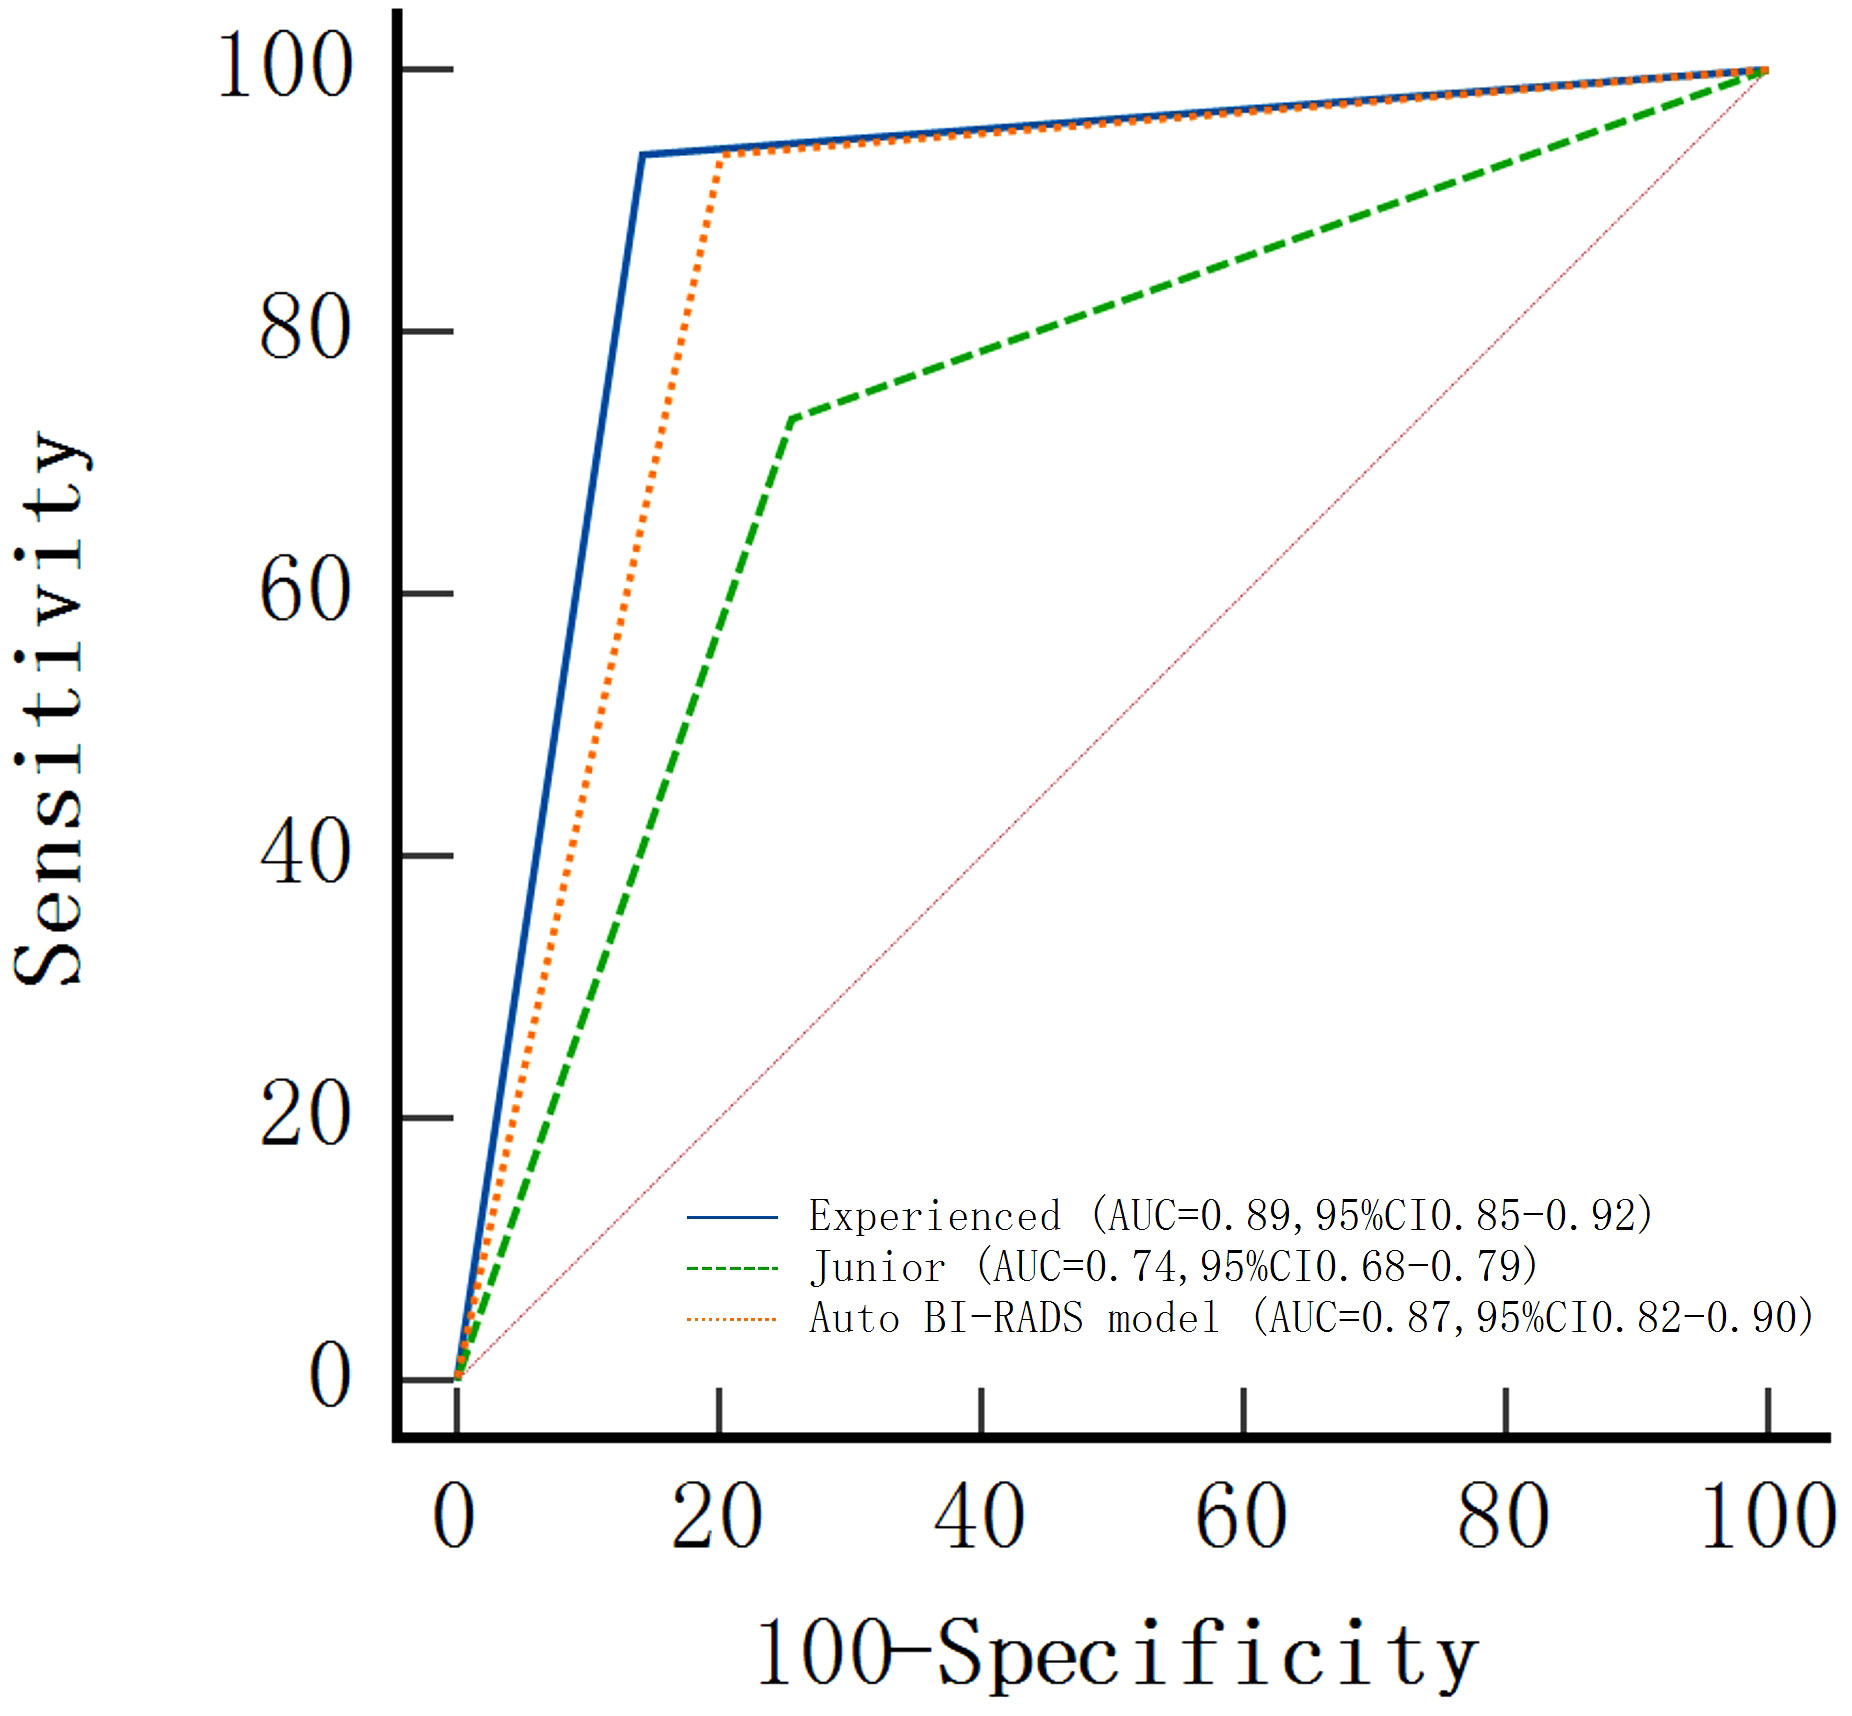
Figure 8 Areas under the receiver operating characteristic curves (AUCs) of the Auto BI-RADS model for breast lesions based on the American College of Radiology Breast Imaging Reporting and Data System and two radiologist groups with different experience levels who used BI-RADS.
The AUC, sensitivity, specificity, positive predictive value, and negative predictive value of Auto BI-RADS were 0.87 (95%CI: 0.82, 0.90), 93% (116 out of 124 lesions), 81% (136 out of 168 lesions), 78% (116 out of 148 lesions), and 94% (136 out of 144 lesions), respectively. The false positive of the Auto BI-RADS is 6%, as much as the experienced group. We found no evidence of a statistical difference between the Auto BI-RADS model and the experienced group for AUC (P = 0.06), but there were statistically significant differences compared to the junior group (P < 0.001) (Table 3).
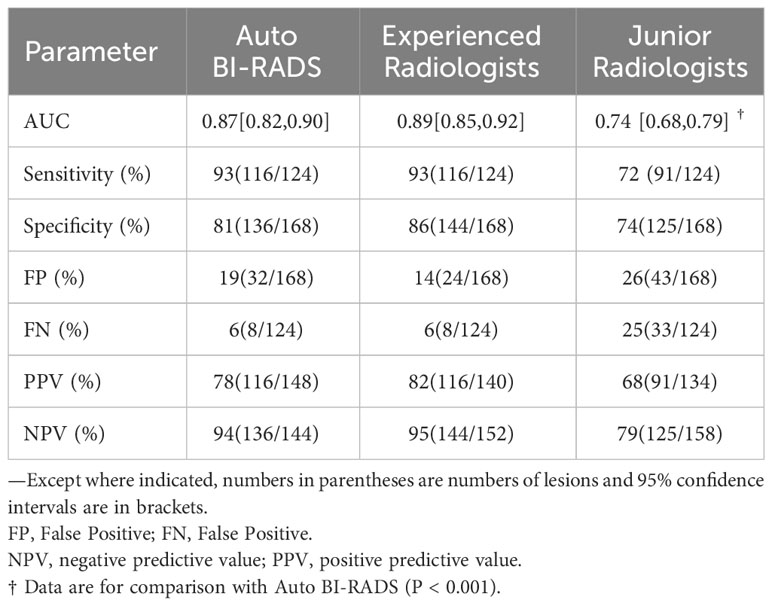
Table 3 Performance of Auto BI-RADS and two groups of radiologists for diagnosis of benign and malignant breast lesions in test set.
3.3 Comparison of consistency among Auto BI-RADS, experienced radiologists, and junior radiologists in the BI-RADS category in the test set
In the test set of 292 breast lesions, the consistency between the Auto BI-RADS model and the experienced radiologists in the BI-RADS category was higher than that of the junior radiologists, with kappa values of 0.82 and 0.60, respectively (Table 4).
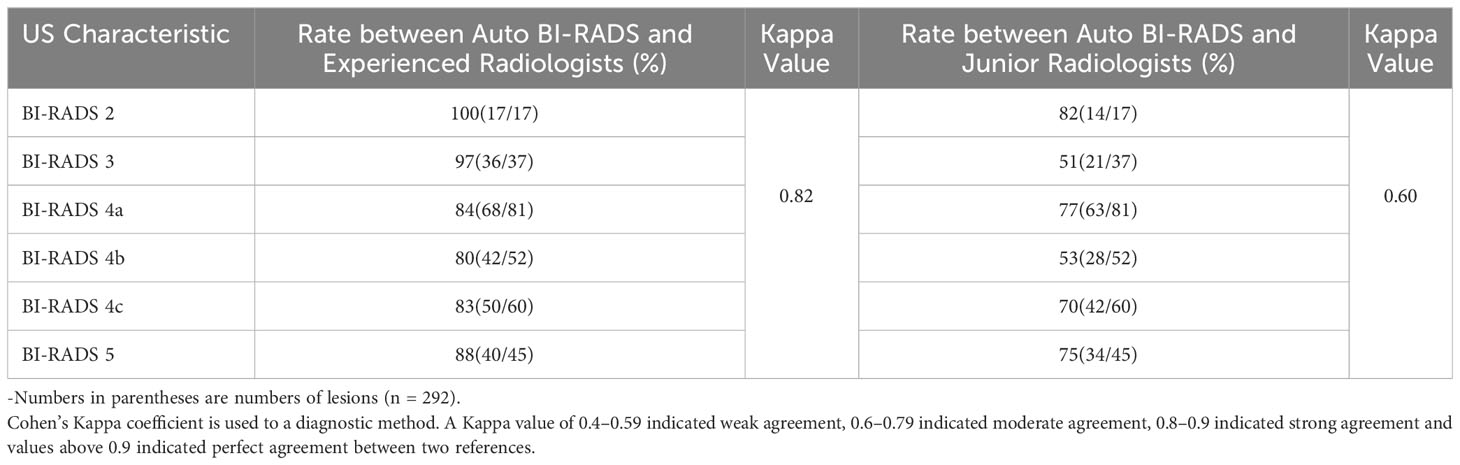
Table 4 Consistency rates between Auto BI-RADS model and two radiologist groups for classification of BI-RADS in test set.
3.4 Comparison of consistency rates among Auto BI-RADS, experienced radiologists, and junior radiologists in the identification of breast lesions characteristics in the test set
In the test set of 292 lesions, the consistency rate between Auto BI-RADS and experienced radiologists was higher than that between Auto BI-RADS and junior radiologists in the identification of morphology, orientation, margin, internal echo, posterior echo with respective values for morphology (93% [n = 271] vs. 80% [n = 234]; P = 0.01), orientation (90% [n = 265] vs. 84% [n = 247]; P = 0.02), margin (84% [n = 246] vs. 71% [n = 209]; P = 0.01), internal echo (69% [n = 202] vs. 56% [n = 163]; P = 0.01) and posterior echo (76% [n = 221] vs. 71% [n = 207]; P = 0.046). In the identification of calcification, there was no statistically significant difference in the consistency rates between Auto BI-RADS and experienced radiologists or junior radiologists (P = 0.4) (Table 5).
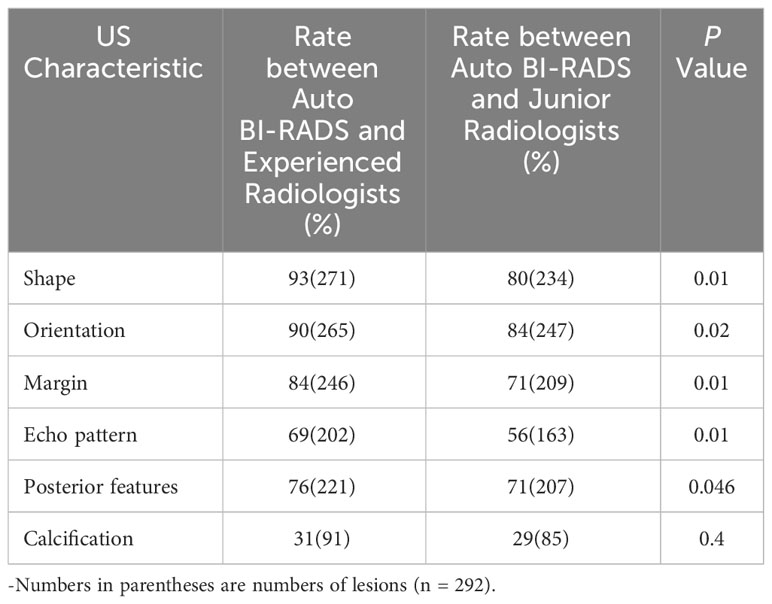
Table 5 Consistency rates between Auto BI-RADS Model and two radiologist groups for identification of breast lesions characteristics in test set.
4 Discussion
In this study, we first developed a breast lesions AI classification model. By identifying the BI-RADS characteristics within the ultrasound dynamic videos, it can automatically evaluate the lesions’ BI-RADS category and predict their benign or malignant nature.
The development of the Auto BI-RADS model was based on 480 breast lesions ultrasound videos equivalent to 18122 static images from Hospital 1, with a 3:1 ratio for training and validation. To verify the stability and efficiency of the model, we made an independent test in this study in 292 breast lesions testing sets from Hospital 1 and Hospital 2. Compared with those of experienced and junior radiologists, it showed that Auto BI-RADS achieved high performance in distinguishing between benign and malignant breast lesions (AUC: 0.87, sensitivity: 93%, specificity: 0.81), which was close to the experienced radiologists (AUC: 0.89, sensitivity: 93%, specificity: 86%), and significantly better than juniors (AUC: 0.74, sensitivity: 72%, specificity: 74%). Tracing back to the previous studies, Han et al. (9) first used an end-to-end deep learning framework to classify regions of interest selected by radiologists in a dataset of 7,408 static ultrasound breast lesions. They reported a sensitivity of 0.86, specificity of 0.93, and AUC >0.9. Ciritsis et al. (13) used a deep learning model that mimicked human decision-making to detect and classify ultrasound breast lesions in a dataset of 1,019 static images. In an external test dataset, they reported a sensitivity of 0.894, specificity of 1.0, and AUC of 0.967. Qian et al. (14) developed a neural network model that combined ultrasound B-mode and color Doppler to classify static ultrasound images of the breast in a larger dataset. Their bimodal model reported an AUC of 0.982, specificity of 88.7%, and sensitivity of 97%. Although the diagnostic performance indicators reported in those studies may appear higher than our study, they are not directly comparable. Firstly, the above studies were based on keyframes that can reflect the main BI-RADS characteristics of breast lesions. However, in clinical practice, not all radiologists were able to select the most critical frames. Secondly, a single static image cannot reflect all the morphological features of one breast lesion. Therefore, the results of those studies may have significant bias and low reproducibility, with limited clinical applicability. Additionally, none of the above studies conducted independent testing, raising questions about the stability of the models. In contrast, we used ultrasound dynamic videos for independent testing, which could improve its clinical generalizability with more objective and reproducible consequences.
In addition, we also compared the consistency among Auto BI-RADS, experienced radiologists, and junior radiologists in the BI-RADS category (the Kappa values were 0.82 and 0.60, respectively). The results showed that Auto BI-RADS were highly consistent with experienced radiologists. Finally, we compared the identification of breast lesions’ BI-RADS characteristics. The results showed that Auto BI-RADS had a higher consistency rate with experienced radiologists in morphology, orientation, margin, internal echo, and posterior echo. This indicates that the model conforms to the visual judgment of experienced human experts. These comparative studies have not been mentioned in previous studies. As for the recognition of calcification, there was no difference among the Auto BI-RADS model, experienced and junior radiologists. We speculate that this is because the characteristics of calcification are more complex, and their distribution in terms of location, size, and shape varies greatly. The image algorithm identifies different grayscale thresholds to determine whether calcification exists, and it will fail when there are only show slight changes in grayscale. It was also found that some tumors with high echogenic envelopes were mistakenly identified as calcifications. Chen et al. (24) had similar explanations in their identification of thyroid calcification. Later, we will increase the calcification samples and improve the algorithm to enhance the identification of calcification.
To meet the practical application, we first developed the Auto BI-RADS model based on ultrasound dynamic videos combining deep learning and image processing algorithms. There have been no similar reports previously. In the first step, we employed a YOLOV5 deep convolutional neural network to track and segment the targets. Then, we utilized image processing algorithms to extract BI-RADS features. Finally, we performed feature algorithm fusion to obtain target classification. For video tracking and segmentation, Yap et al. (25) have compared multiple types of deep learning neural networks, demonstrating their powerful capabilities in object tracking and segmentation. Relevant studies (26–28) have also indicated that deep learning exhibits uncertainty and a lack of interpretability in lesion feature recognition. Continuous learning required large sample sizes for the identification of each specific feature (29). However, machine learning has unique advantages in extracting breast lesion features. Hamyoo et al. (30) used machine learning alone to extract 13 features from lesions using the BI-RADS lexicon in a multi-center study (1288 static ultrasound images from three countries: Malaysia, Iran, and Turkey) and obtained an AUC value of 0.88, demonstrating the strong feature recognition capabilities of machine learning through comparison with human expert readings. Herein, our study constructed an Auto BI-RADS model based on deep learning and image processing algorithms to achieve the identification and classification of breast lesions in ultrasound dynamic videos. The prospective assessment indicates that the Auto BI-RADS model demonstrates good diagnostic performance and has significant potential.
Reviewing other imaging for breast cancer screening, mammography is considered a recommended method for reducing breast cancer-related mortality, but it involves radiation and is less sensitive to dense breasts, making it unsuitable for all countries (31). MRI is always used as a supplementary means (31). On the other hand, the US is recommended by Asia medical experts due to its low cost, non-radiation, and suitability for Asian women (31). The limitations of ultrasound have always been operator dependence and observer variability. Although many studies have focused on developing artificial intelligence models to address these limitations, they have not fully taken into account the practical clinical applications. Considering the above problems, we propose to develop a novel AI model simulating the clinical practice conducted by dynamic videos and BI-RADS characteristic identification. This approach allows for more objective, realistic, and reliable diagnostic results with high repeatability. The application of Auto BI-RADS offers great practical significance and provides better references for clinical practitioners with less experience.
Our study has several limitations. Firstly, the sample size for the prospective evaluation of the model is not large enough, and it does not include all categories of BIRADS, especially category 1 which indicates no lesion. Afterward, to improve the adaptability and stability of the model, we will include more external hospitals to increase the samples and species. By strengthening the model’s training, we increase the model’s robustness. Furthermore, it should be noted that the breast lesions ultrasound videos used in this study may still exhibit variability due to handheld ultrasound. In the future, if an Automated Breast Ultrasound System (ABUS) or robotic arms can be used to record the videos, it would provide more convincing results. Additionally, the latest fifth edition ACR BI-RADS guidelines have added color Doppler and elastography to evaluate breast lesions (32). It means that multimodal ultrasound has become part of breast cancer assessment. Therefore, for further improvement, this study can incorporate multiple ultrasound modalities such as color Doppler, elastography, contrast-enhanced ultrasound, etc., to develop a multimodal AI ultrasound diagnostic model.
5 Conclusion
In conclusion, we first propose a novel method for breast tumor AI diagnosis based on breast lesions ultrasound dynamic videos to obtain ACR BI-RADS morphological characteristics, realize the BI-RADS category, and predict benign or malignant lesions. In the AI model development, we combined an improved attention mechanism YOLOV5 network with image processing algorithms to achieve it. This novel method not only avoids the problem of missing and incomplete lesion features caused by traditional single-frame static images but also better suits clinical diagnostic scenarios, providing a fast and effective approach for breast cancer screening.
Data availability statement
The original contributions presented in the study are included in the article/supplementary material. Further inquiries can be directed to the corresponding authors.
Ethics statement
The studies involving humans were approved by the Institutional Review Board of First Affiliated Hospital of Shantou University Medical College(approval number: B-2022-182). The studies were conducted in accordance with the local legislation and institutional requirements. The ethics committee/institutional review board waived the requirement of written informed consent for participation from the participants or the participants’ legal guardians/next of kin because the data are anonymous.
Author contributions
ZZ: Conceptualization, Funding acquisition, Methodology, Resources, Supervision, Writing – original draft, Writing – review & editing. SQ: Conceptualization, Data curation, Formal Analysis, Investigation, Methodology, Resources, Writing – original draft. SZ: Methodology, Project administration, Software, Validation, Visualization, Writing – review & editing. BL: Investigation, Software, Validation, Writing – review & editing. JW: Data curation, Formal Analysis, Investigation, Writing – review & editing.
Funding
The author(s) declare financial support was received for the research, authorship, and/or publication of this article. This work was supported by the National Natural Science Foundation of China under Grant (No. 82071992) and the Basic and Applied Basic Research Foundation of Guangdong Province (No. 2020B1515120061).
Acknowledgments
We thank Baoqun Zheng, MS, Xueying Li, BS, Xiaoxia, Chen, MS, Danpin Liu, MS, Xiao Chen, MS, Zeyin Lin, MS, Wenbin Rao, MS, Xinyu Lu, MS, Jingfeng Guo, MS, for their help throughout the study.
Conflict of interest
The authors declare that the research was conducted in the absence of any commercial or financial relationships that could be construed as a potential conflict of interest.
Publisher’s note
All claims expressed in this article are solely those of the authors and do not necessarily represent those of their affiliated organizations, or those of the publisher, the editors and the reviewers. Any product that may be evaluated in this article, or claim that may be made by its manufacturer, is not guaranteed or endorsed by the publisher.
References
1. Sung H, Ferlay J, Siegel RL, Laversanne M, Soerjomataram I, Jemal A, et al. Global cancer statistics 2020: GLOBOCAN estimates of incidence and mortality worldwide for 36 cancers in 185 countries. CA Cancer J Clin (2021) 71(3):209–49. doi: 10.3322/caac.21660
2. Ren W, Chen M, Qiao Y, Zhao F. Global guidelines for breast cancer screening: A systematic review. Breast (2022) 64:85–99. doi: 10.1016/j.breast.2022.04.003
3. Mendelson E, Böhm-Vélez M, Berg W, Whitman G, Feldman M, Madjar H. Ultrasound in ACR BI-RADS® Atlas, Breast Imaging Reporting and Data System. Reston, VA: American College of Radiology (2013). p. 334.
4. Liu J, Zhou Y, Wu J, Li P, Liang X, Duan H, et al. Diagnostic performance of combined use of automated breast volume scanning & hand-held ultrasound for breast lesions. Indian J Med Res (2021) 154(2):347–54. doi: 10.4103/ijmr.IJMR_836_19
5. Brunetti N, Calabrese M, Martinoli C, Tagliafico AS. Artificial intelligence in breast ultrasound: from diagnosis to prognosis-A rapid review. Diagn. (Basel) (2022) 13(1):1–17. doi: 10.3390/diagnostics13010058
6. Ibraheem SA, Mahmud R, Mohamad Saini S, Abu Hassan H, Keiteb AS, Dirie AM. Evaluation of diagnostic performance of automatic breast volume scanner compared to handheld ultrasound on different breast lesions: A systematic review. Diagn. (Basel) (2022) 12(2):541. doi: 10.3390/diagnostics12020541
7. Lee YJ, Choi SY, Kim KS, Yang PS. Variability in observer performance between faculty members and residents using breast imaging reporting and data system (BI-RADS)-ultrasound, fifth edition, (2013). Iran J Radiol (2016) 13(3):e28281. doi: 10.5812/iranjradiol.28281
8. Becker AS, Mueller M, Stoffel E, Marcon M, Ghafoor S, Boss A. Classification of breast cancer in ultrasound imaging using ageneric deep learning analysis software: a pilot study. Br J Radiol (2018) 91:20170576. doi: 10.1259/bjr.20170576
9. Han S, Kang HK, Jeong JY, Park MH, Kim W, Bang WC, et al. A deep learning framework for supporting the classification of breast lesions in ultrasound images. Phys Med Biol (2017) 62(19):7714–28. doi: 10.5812/iranjradiol.28281
10. Lee HJ, Kima EK, Kima MJ, Youk JH, Lee JY, Kang DR, et al. Observer variability of Breast Imaging Reporting and Data System (BI-RADS) for breast ultrasound. Eur J Radiol (2008) 65(2):293–8. doi: 10.1016/j.ejrad.2007.04.008
11. Abdullah N, Mesurolle B, El-Khoury M, Kao E. Breast Imaging Reporting and Data System lexicon for US: interobserver agreement for assessment of breast masses. Radiology (2009) 252:665–72. doi: 10.1148/radiol.2523080670
12. Youk JH, Jung I, Yoon JH, Kim SH, Kim YM, Lee EH, et al. Comparison of inter-observer variability and diagnostic performance of the fifth edition of BI-RADS for breast ultrasound of static versus video images. Ultrasound Med Biol (2016) 42(9):2083–8. doi: 10.1088/1361-6560/aa82ec
13. Ciritsis A, Rossi C, Eberhard M, Marcon M, Becker AS, Boss A. Automatic classification of ultrasound breast lesions using a deep convolutional neural network mimicking human decision-making. Eur Radiol (2019) 29(10):5458–68. doi: 10.1007/s00330-019-06118-7
14. Qian X, Zhang B, Liu S, Wang Y, Chen X, Liu J, et al. A combined ultrasonic B-mode and color Doppler system for the classification of breast masses using neural network. Eur Radiol (2020) 30(5):3023–33. doi: 10.1007/s00330-019-06610-0
15. Redmon J, Divvala S, Girshick R, Farhadi A. (2016). You only look once: Unified, real-time object detection. IEEE conference on computer vision and pattern recognition (CVPR), Las Vegas, NV, USA, 779–88. doi: 10.1109/CVPR.2016.91
16. Wang K, Liew JH, Zou Y, Zhou DQ, Feng JS. (2019). Panet: Few-shot image semantic segmentation with prototype alignment. IEEE/CVF international conference on computer vision (ICCV), Seoul, Korea (South) 9197–205. doi: 10.1109/ICCV.2019.00929
17. Yang L, Zhang RY, Li L, Xie XH. (2021). Simam: A simple, parameter-free attention module for convolutional neural networks. Proceedings of machine learning research (PMLR) 139:11863–74.
18. Huang R, Ying Q, Lin Z, Zheng Z, Tan L, Tang G, et al. Extracting keyframes of breast ultrasound video using deep reinforcement learning. Med Image Anal (2022) 80:102490. doi: 10.1016/j.media.2022.102490
19. Lin TY, Goyal P, Girshick R, He K, Dollar P. (2020). Focal loss for dense object detection. IEEE transactions on pattern analysis and machine intelligence 42(2):318–27. doi: 10.1109/TPAMI.2018.2858826
20. Zheng ZH, Wang P, Liu W, Li J, Ye R, Ren D. (2020). Distance-IoU loss: Faster and better learning for bounding box regression. Proceedings of the AAAI conference on artificial intelligence 34(07):12993–3000. doi: 10.1609/aaai.v34i07.6999
21. Wang CY, Liao HYM, Wu YH, Chen PY, Hsieh JW, Yeh I-H. (2020). CSPNet: A new backbone that can enhance learning capability of CNN. IEEE/CVF conference on computer vision and pattern recognition workshops (CVPRW). Seattle, WA, USA. 1571–80. doi: 10.1109/CVPRW50498.2020.00203
22. Bodla N, Singh B, Chellappa R. (2017). Soft-NMS–improving object detection with one line of code. IEEE international conference on computer vision (ICCV) 5562–70. doi: 10.1109/ICCV.2017.593
23. DeLong ER, DeLong DM, Clarke-Pearson DL. Comparing the areas under two or more correlated receiver operating characteristic curves: a nonparametric approach. Biometrics (1988) 44(3):837–45. doi: 10.2307/2531595
24. Chen Y, Gao Z, He Y, Mai W, Li J, Zhou M, et al. An artificial intelligence model based on ACR TI-RADS characteristics for US diagnosis of thyroid nodules. Radiology (2022) 303(3):613–9. doi: 10.1148/radiol.211455
25. Yap MH, Pons G, Marti J, Ganau S, Sentis M, Zwiggelaar R, et al. Automated breast ultrasound lesions detection using convolutional neural networks. IEEE J BioMed Health Inform (2018) 22(4):1218–26. doi: 10.1109/JBHI.2017.2731873
26. McBee MP, Awan OA, Colucci AT, Ghobadi CW, Kadom N, Kansagra AP, et al. Deep learning in radiology. Acad Radiol (2018) 25(11):1472–80. doi: 10.1016/j.acra.2018.02.018
27. Stead WW. Clinical implications and challenges of artificial intelligence and deep learning. JAMA (2018) 320(11):1107–8. doi: 10.1001/jama.2018.11029
28. Chan HP, Samala RK, Hadjiiski LM, Zhou C. Deep learning in medical image analysis challenges and applications. Adv Exp Med Biol (2020) 1213:3–21. doi: 10.1007/978-3-030-33128-3
29. Tanaka H, Chiu SW, Watanabe T, Kaoku S, Yamaguchi T. Computer-aided diagnosis system for breast ultrasound images using deep learning. Phys Med Biol (2019) 64(23):235013. doi: 10.1088/1361-6560/ab5093
30. Hamyoon H, Yee Chan W, Mohammadi A, Yusuf Kuzan T, Mirza-Aghazadeh-Attari M, Leong WL, et al. Artificial intelligence, BI-RADS evaluation and morphometry: A novel combination to diagnose breast cancer using ultrasonography, results from multi-center cohorts. Eur J Radiol (2022) 157:110591. doi: 10.1016/j.ejrad.2022.110591
31. Mann RM, Hooley R, Barr RG, Moy L. Novel approaches to screening for breast cancer. Radiology (2020) 297(2):266–85. doi: 10.1148/radiol.2020200172
Keywords: artificial intelligence, diagnosis, ultrasound video, BI-RADS, breast
Citation: Qiu S, Zhuang S, Li B, Wang J and Zhuang Z (2023) Prospective assessment of breast lesions AI classification model based on ultrasound dynamic videos and ACR BI-RADS characteristics. Front. Oncol. 13:1274557. doi: 10.3389/fonc.2023.1274557
Received: 10 August 2023; Accepted: 16 October 2023;
Published: 03 November 2023.
Edited by:
Luca Nicosia, European Institute of Oncology (IEO), ItalyCopyright © 2023 Qiu, Zhuang, Li, Wang and Zhuang. This is an open-access article distributed under the terms of the Creative Commons Attribution License (CC BY). The use, distribution or reproduction in other forums is permitted, provided the original author(s) and the copyright owner(s) are credited and that the original publication in this journal is cited, in accordance with accepted academic practice. No use, distribution or reproduction is permitted which does not comply with these terms.
*Correspondence: Zhemin Zhuang, em16aHVhbmdAc3R1LmVkdS5jbg==; Shuxin Zhuang, emh1YW5nc2h4M0BtYWlsMi5zeXN1LmVkdS5jbg==
†Present address: Shuxin Zhuang, School of Biomedical Engineering, Sun Yat-sen University, Shenzhen, Guangdong, China