 Seohyun Kim1†Gyuri Kim2†So Hyun Cho2
 Rosa Oh2
 Ji Yoon Kim2You-Bin Lee2Sang-Man Jin2
 Kyu Yeon Hur2
 Jae Hyeon Kim1,2*
- 1Department of Clinical Research Design and Evaluation, Samsung Advanced Institute for Health Sciences and Technology, Sungkyunkwan University, Seoul, Republic of Korea
- 2Division of Endocrinology and Metabolism, Department of Medicine, Samsung Medical Center, Sungkyunkwan University School of Medicine, Seoul, Republic of Korea
Aim: We investigated the association between total cholesterol (TC), low-density lipoprotein (LDL) cholesterol, high-density lipoprotein (HDL) cholesterol, and triglyceride (TG) variability and cancer patient mortality risk.
Methods: We retrospectively analyzed 42,539 cancer patients who were not receiving lipid-lowering agents and who had at least three TC measurements within 2 years of their initial cancer diagnosis. Using a multivariable Cox regression model, the risk of mortality was evaluated.
Results: In multivariable analysis, Q2 (adjusted hazard ratio [aHR]: 1.32, 95% confidence interval (CI): 1.24–1.41), Q3 (aHR: 1.66, 95% CI: 1.56–1.76), and Q4 (aHR: 1.96, 95% CI: 1.84–2.08) of coefficient of variation (CV) in TC were significantly associated with mortality risk compared to Q1, showing a linear association between higher TC variability and mortality (P for trend<0.001). Q2 (aHR: 1.34, 95% CI: 1.06–1.77), Q3 (aHR: 1.40, 95% CI: 1.06–1.85), and Q4 (aHR: 1.50, 95% CI: 1.14–1.97) were all significantly associated with a higher risk of death compared to Q1 in multivariable Cox regression for the association between CV in LDL and all-cause mortality (P for trend=0.005).
Conclusion: In cancer patients who do not receive lipid-lowering agents, high variability in total cholesterol and LDL cholesterol levels was found to pose significant role in mortality risk.
1 Introduction
In 2015, cancer was the second-leading cause of death globally after cardiovascular diseases, accounting for approximately 8.7 million deaths (1). In 20 regions of the world, 18.1 million new cancer cases (excluding non-melanoma skin cancer) and 9.6 million cancer-related deaths (9.5 million excluding non-melanoma skin cancer) were anticipated in 2018 (2). In addition to physicians’ efforts to stratify risk factors for cancer treatment based on the TNM staging system, new prognostic biomarkers that may help stratify cancer risk and modify risk have been identified (3). Cancer patients had significant associations between total cholesterol (TC) and high-density lipoprotein cholesterol (HDL-C) levels and overall survival, according to a systematic review and meta-analysis (4).
In the Framingham Heart Study, cholesterol variability was associated with mortality. This relationship has also been observed in recent studies of general populations and people with type 2 diabetes mellitus (DM) (5–8). Coronary atheroma progression, endothelial dysfunction, and the effect of many drugs on cholesterol levels were among the possible mechanisms of the effect of cholesterol variability on poor outcomes (6, 7, 9–11). Previous studies reported no significant association between intra-individual variability in TC levels stratified by quartile and cancer mortality (12). However, significant associations were found in all-cause and cardiovascular disease mortality (12).
To the best of our knowledge, although the association between cholesterol variability and mortality risk in cancer patients was evaluated in subgroup analysis in a previous study, no study examined the association between lipid variability and mortality risk in cancer patients who did not receive lipid-lowering agents in a large cohort. Therefore, we aimed to investigate the association between TC variability and mortality in newly diagnosed cancer patients not receiving lipid-lowering agents at the time of cancer diagnosis. Furthermore, we investigated the association between variability in low-density lipoprotein cholesterol (LDL-C), high-density lipoprotein cholesterol (HDL-C), and triglyceride (TG) and death in cancer patients not receiving lipid-lowering agents at the time of cancer diagnosis.
2 Materials and methods
2.1 Study design and population
The study’s participants were newly diagnosed cancer patients older than 20 who visited the Samsung Medical Center (SMC) in Seoul, Republic of Korea, between January 2008 and December 2019. The study included 140,133 individuals diagnosed with cancer for the first time (International Classification of Disease, 10th revision (ICD-10), C code) and had medical records, including the TNM stage. We included cancer patients without metastasis who had at least three TC measurements within 2 years of their initial diagnosis (N=51,771). We excluded patients whose body mass index (BMI), laboratory measurements, medical history of hypertension (HTN), smoking status, and alcohol consumption variables were missing (N=3,411) and who had a history of prescriptions for lipid-lowering agents within a year from the index date (n=7,099). The LDL-C, HDL-C, and TG analysis datasets were created in the same process described previously. The workflow of the study is summarized at Figure 1. Finally, 42,539, 3,018, 2,956, and 3,368 participants were analyzed in the TC cohort, LDL-C cohort, HDL-C cohort, and TG cohort, respectively. All data were extracted from SMC’s clinical data warehouse (CDW), DARWIN-C.
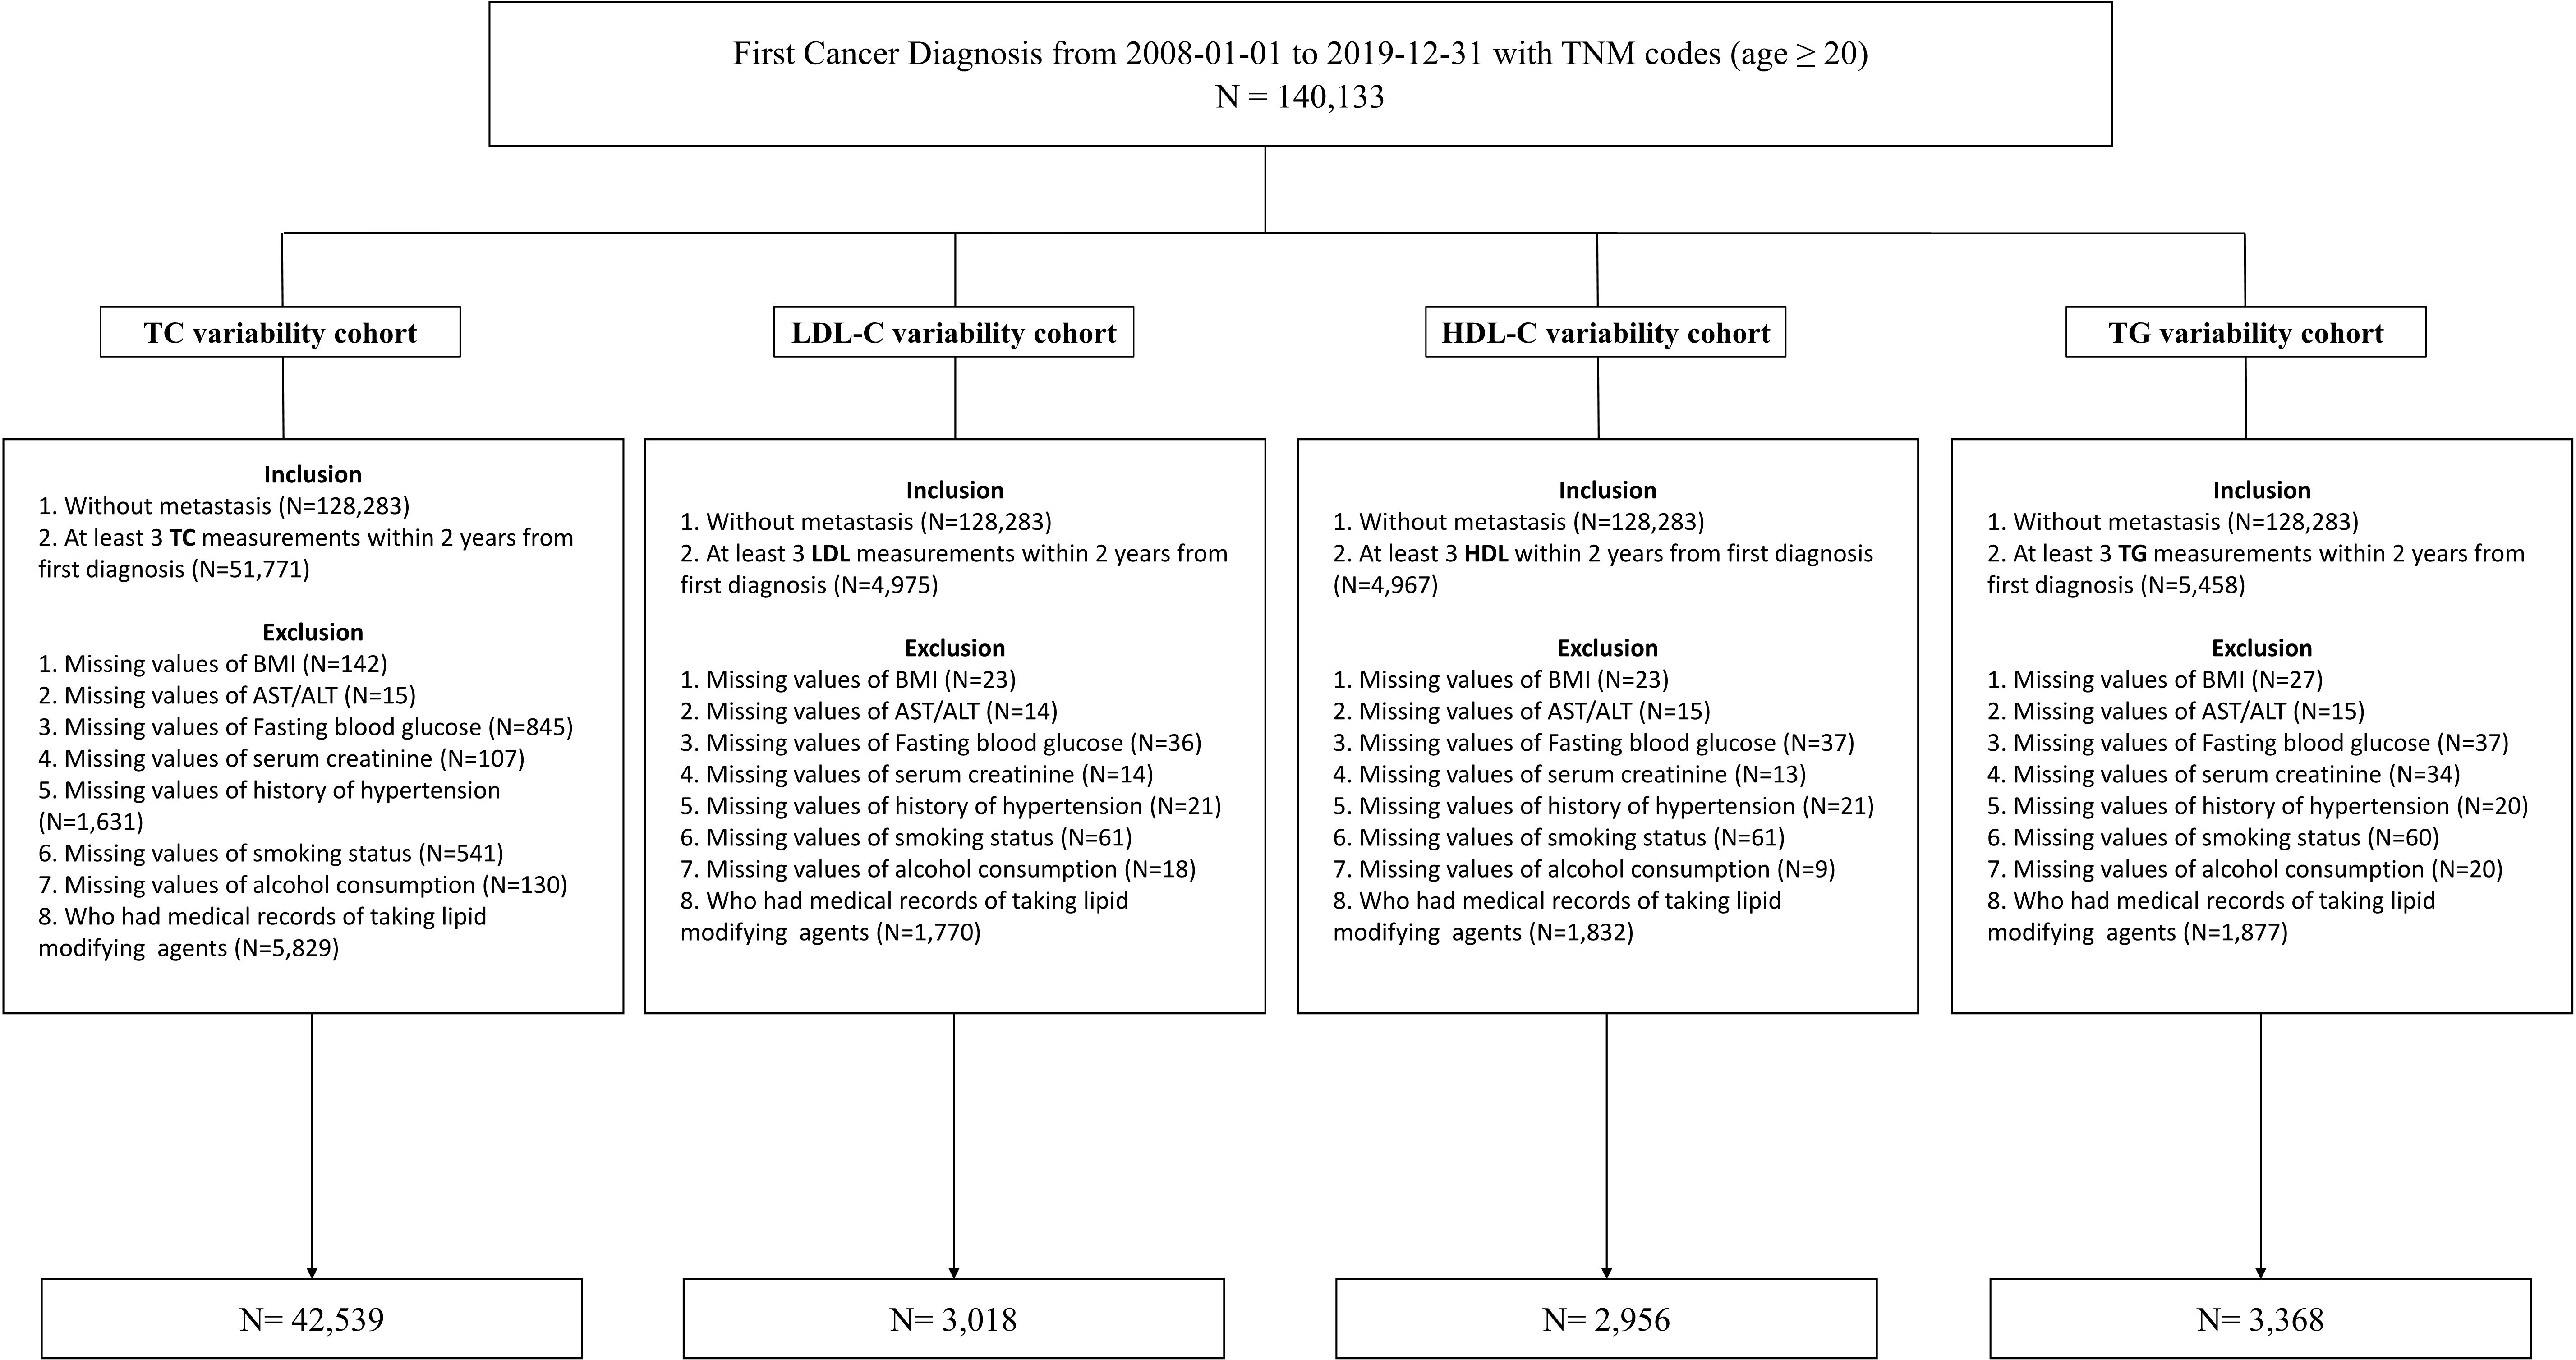
Figure 1 Flow chart of the study.
2.2 Definition of exposure
After an overnight fast, laboratory measurements of the TC, LDL-C, HDL-C, and TG measured repeatedly from the patient’s first cancer diagnosis for two years were collected longitudinally. Mean and standard deviation (SD) values were calculated from blood lipid levels measured at least thrice within 2 years of the initial diagnosis for each cancer patient. We calculated the mean value and standard deviation from repeatedly measured cholesterol levels, and the coefficient of variation (CV) in TC, LDL-C, HDL-C, and TG was defined as the ratio of the SD to the mean in each patient. And the CV is divided by the quartile, and the CV increases from the first quartile to the fourth quartile. Each cancer patient’s last blood lipid measurement date was defined as the index date.
2.3 Definition of covariates
Electrical medical records and a self-administered questionnaire were used to examine the personal medical history, including DM, HTN, smoking history, alcohol intake, and medications. The demographic, anthropometric, and laboratory data of all participants were collected. ICD-10 codes E11–14, a self-reported history of DM, records of anti-diabetic drug prescriptions, an HbA1c of 6.5% or above, or a fasting glucose level of 126 mg/dL or higher were used to identify DM. The chronic kidney disease epidemiology collaboration 2021 (CKD-EPI 2021) formula was used to calculate the value of the estimated glomerular filtration rate (eGFR) (13). We defined chronic kidney disease (CKD) as eGFR<60 mL/min/1.73 m2 at the index date (14). BMI was calculated by dividing body weight (kg) by height squared (m2). Information on alcohol intake and smoking status was collected by a self-reported questionnaire and classified as never, previous, or current. A history of HTN was indicated by the presence of I10–15 in ICD-10 codes, records of prescriptions for anti-hypertensive medications, a self-reported history of HTN, or systolic or diastolic blood pressure readings of >140 mmHg or >90 mmHg, respectively, measured at least three times. Medical history of all HMG-CoA reductase inhibitors, fenofibrate, bezafibrate, omega-3 acids, and self-report of medication use were all included in the lipid-lowering medications. All cancers were divided into 24 common categories based on the primary site of the disease and then reclassified into eight cancer types, including gastrointestinal (colon, rectum, stomach, esophagus, and small intestine), urologic (bladder, prostate, testis, and ureter), gynecologic (endometrial, cervix uteri, corpus uteri, and ovary), breast, hepato-pancreatobiliary (liver and intrahepatic bile duct, gallbladder and other parts of the biliary tract, and pancreas), lung, thyroid cancer, and other cancers (15–17).
2.4 Definition of outcomes
All participants were followed from the index date until the conclusion of the research (December 2020) or until their death (collected from the death records of SMC CDW linked to Statistics Korea).
2.5 Statistical analysis
All categorical variables were presented as percentages, while all continuous variables were shown as the mean and standard deviation (SD). The analysis of variance (ANOVA) for continuous variables and the chi-square test for categorical values were utilized to evaluate the characteristics of patients according to the CV quartile in lipid measurements. Kaplan–Meier’s method was used to examine survival curves, and the results were compared with the log-rank test. We estimated hazard ratios (HRs) with a 95% confidence interval (CI) for all-cause mortality using Cox proportional hazard regression models. We fitted three models to examine the association between variability in lipid measurements and death in cancer patients not receiving lipid-lowering agents. Model 1 was a crude model. Model 2 was adjusted for age, sex, BMI, and mean lipid measurements. Model 3 was further adjusted for CKD, DM, HTN, smoking status, alcohol consumption, and cancer type. We conducted a sensitivity analysis according to no-evidence-of-disease (NED) status and the administration of lipid-lowering agents during the follow-up study period. In sensitivity analyses, cancer patients were censored at the date of initiating NED status rather than continuing follow-up until the end of the study when they attained NED status, which the oncologists decided throughout follow-up (18). Furthermore, if lipid-lowering agents were administered during the study period, the follow-up was limited to the observation date. We performed subgroup analysis by age, sex, presence of DM and HTN, smoking status, alcohol consumption, and cancer type, and the highest quartile (Q4) group’s HR (95% CI) of CV in TC was compared with the lowest three quartiles (Q1–3) as a reference group. Additionally, we conducted an additional analysis to evaluate the association between the longitudinal absolute changes in TC from baseline and mortality using generalized estimating equation (GEE) models. R version 2.1.3 was used to perform all analyses, and P<0.05 was considered statistically significant.
3 Results
3.1 Baseline characteristics of the study population
Table 1 shows all baseline characteristics stratified by the CV quartile in TC. Patients in higher quartiles of TC variability were older, more likely to be female, tended to have a lower BMI, and had a higher prevalence of DM and HTN. The CV values of TC in Q1, Q2, Q3, and Q4 were 5.7 ± 1.8, 10.0 ± 1.0, 13.9 ± 1.3, and 21.6 ± 4.8, respectively. The mean lipid values were highest in Q1 and lowest in Q4. The median frequency of total cholesterol measurement per patients is six times (25%tile: four times, 75%tile: nine times), while the median frequency of LDL-C, HDL-C, and TG is four times (25%tile: three times, 75%tile: five times). The median time interval for repeat TC measurement is 21 days (25%tile: four days, 75%tile: 68 days), while the median time interval for LDL-C, HDL-C, and TG is 91 days (25%tile: 35 days, 75%tile: 175 days).
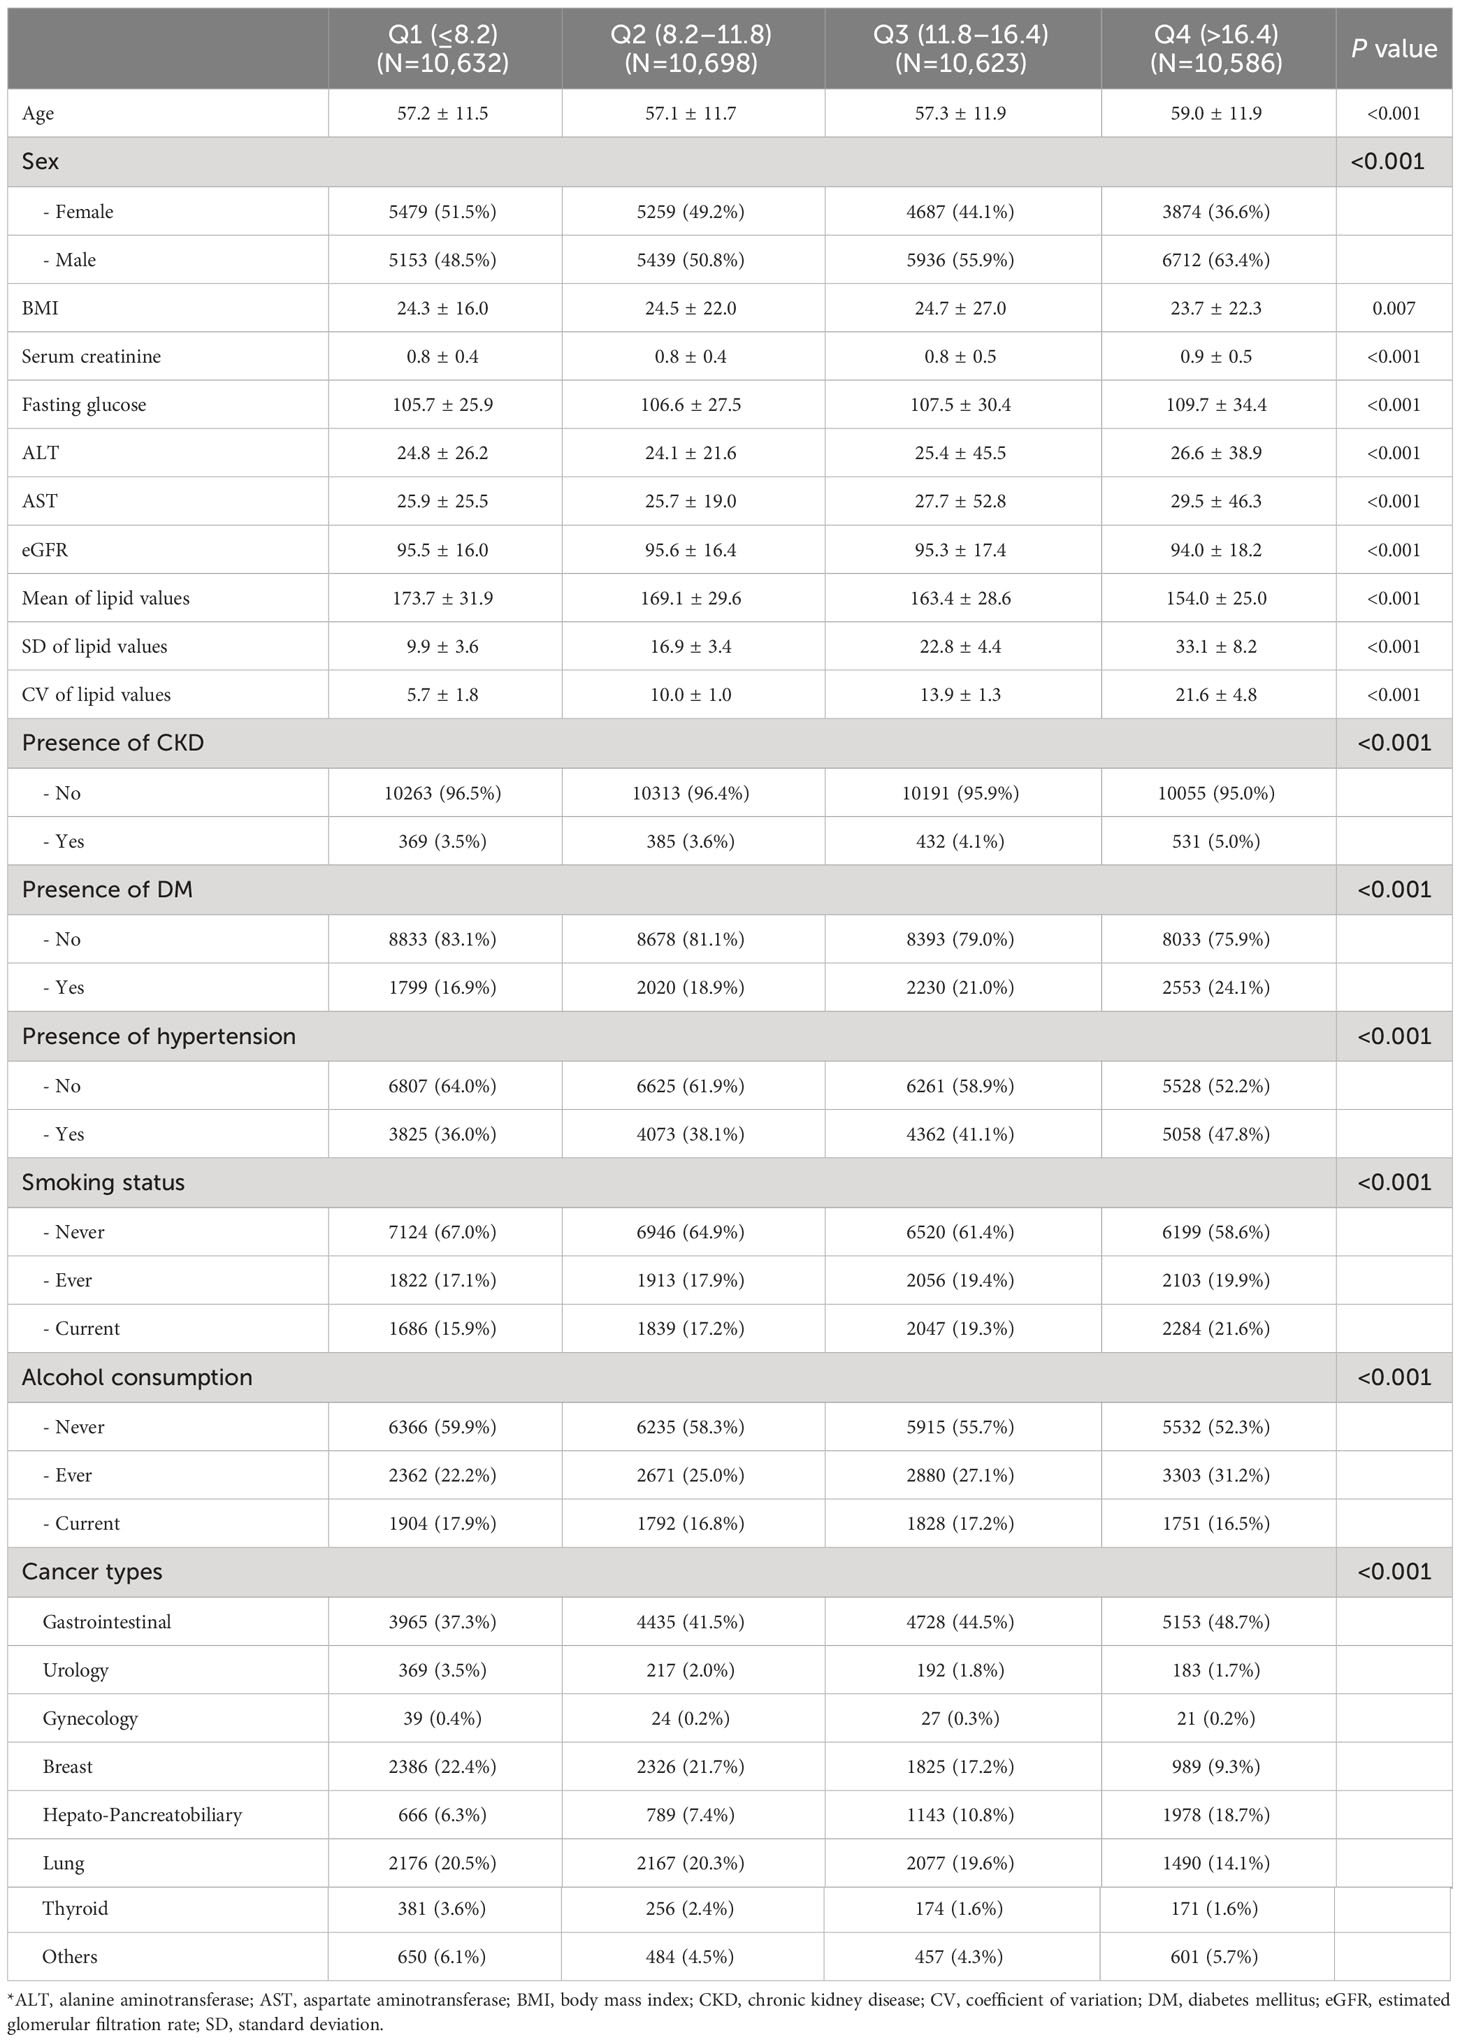
Table 1 Baseline characteristics of the study participants according to the total cholesterol variability.
3.2 Multivariable Cox regression of all-cause mortality
The median follow-up duration of all participants was 4.74 years (25%tile: 2.02 years, 75%tile: 7.64 years). Of the 10,239 deaths and 213,223 person-years, the incidence rate (per 10,000 person-years) for participants in Q1, Q2, Q3, and Q4 was 288.4, 394.9, 534.9, and 723.3, respectively. Table 2 shows the result of a multivariable Cox regression of all-cause mortality with incidence rate. The unadjusted HRs for all-cause mortality in cancer patients with Q2, Q3, and Q4 of CV in TC were 1.38 (95% CI: 1.29–1.47), 1.86 (95% CI: 1.75–1.98), and 2.52 (95% CI: 2.37–2.67), compared to Q1 (Figure 2). In model 3 of multivariable analysis, Q2 (adjusted HR [aHR]: 1.32, 95% CI: 1.24–1.41), Q3 (aHR: 1.66, 95% CI: 1.56–1.76), and Q4 (aHR: 1.96, 95% CI: 1.84–2.08) were significantly associated with an increased risk of mortality compared to Q1 (P for trend<0.001). Q2 (aHR: 1.34, 95% CI: 1.06–1.77), Q3 (aHR: 1.40, 95% CI: 1.06–1.85), and Q4 (aHR: 1.50, 95% CI: 1.14–1.97) were all significantly associated with a higher risk of death compared to Q1 in multivariable Cox regression for the association between CV in LDL and all-cause mortality (P for trend=0.005). Only Q4 (aHR: 2.38, 95% CI: 1.78–3.18) was significantly associated with an increased risk of death relative to Q1 in multivariable Cox regression for the relationship between CV in HDL and all-cause mortality, but not Q2 or Q3 (P for trend<0.001). No association was observed between CV in TG and the risk of death (P for trend=0.722).
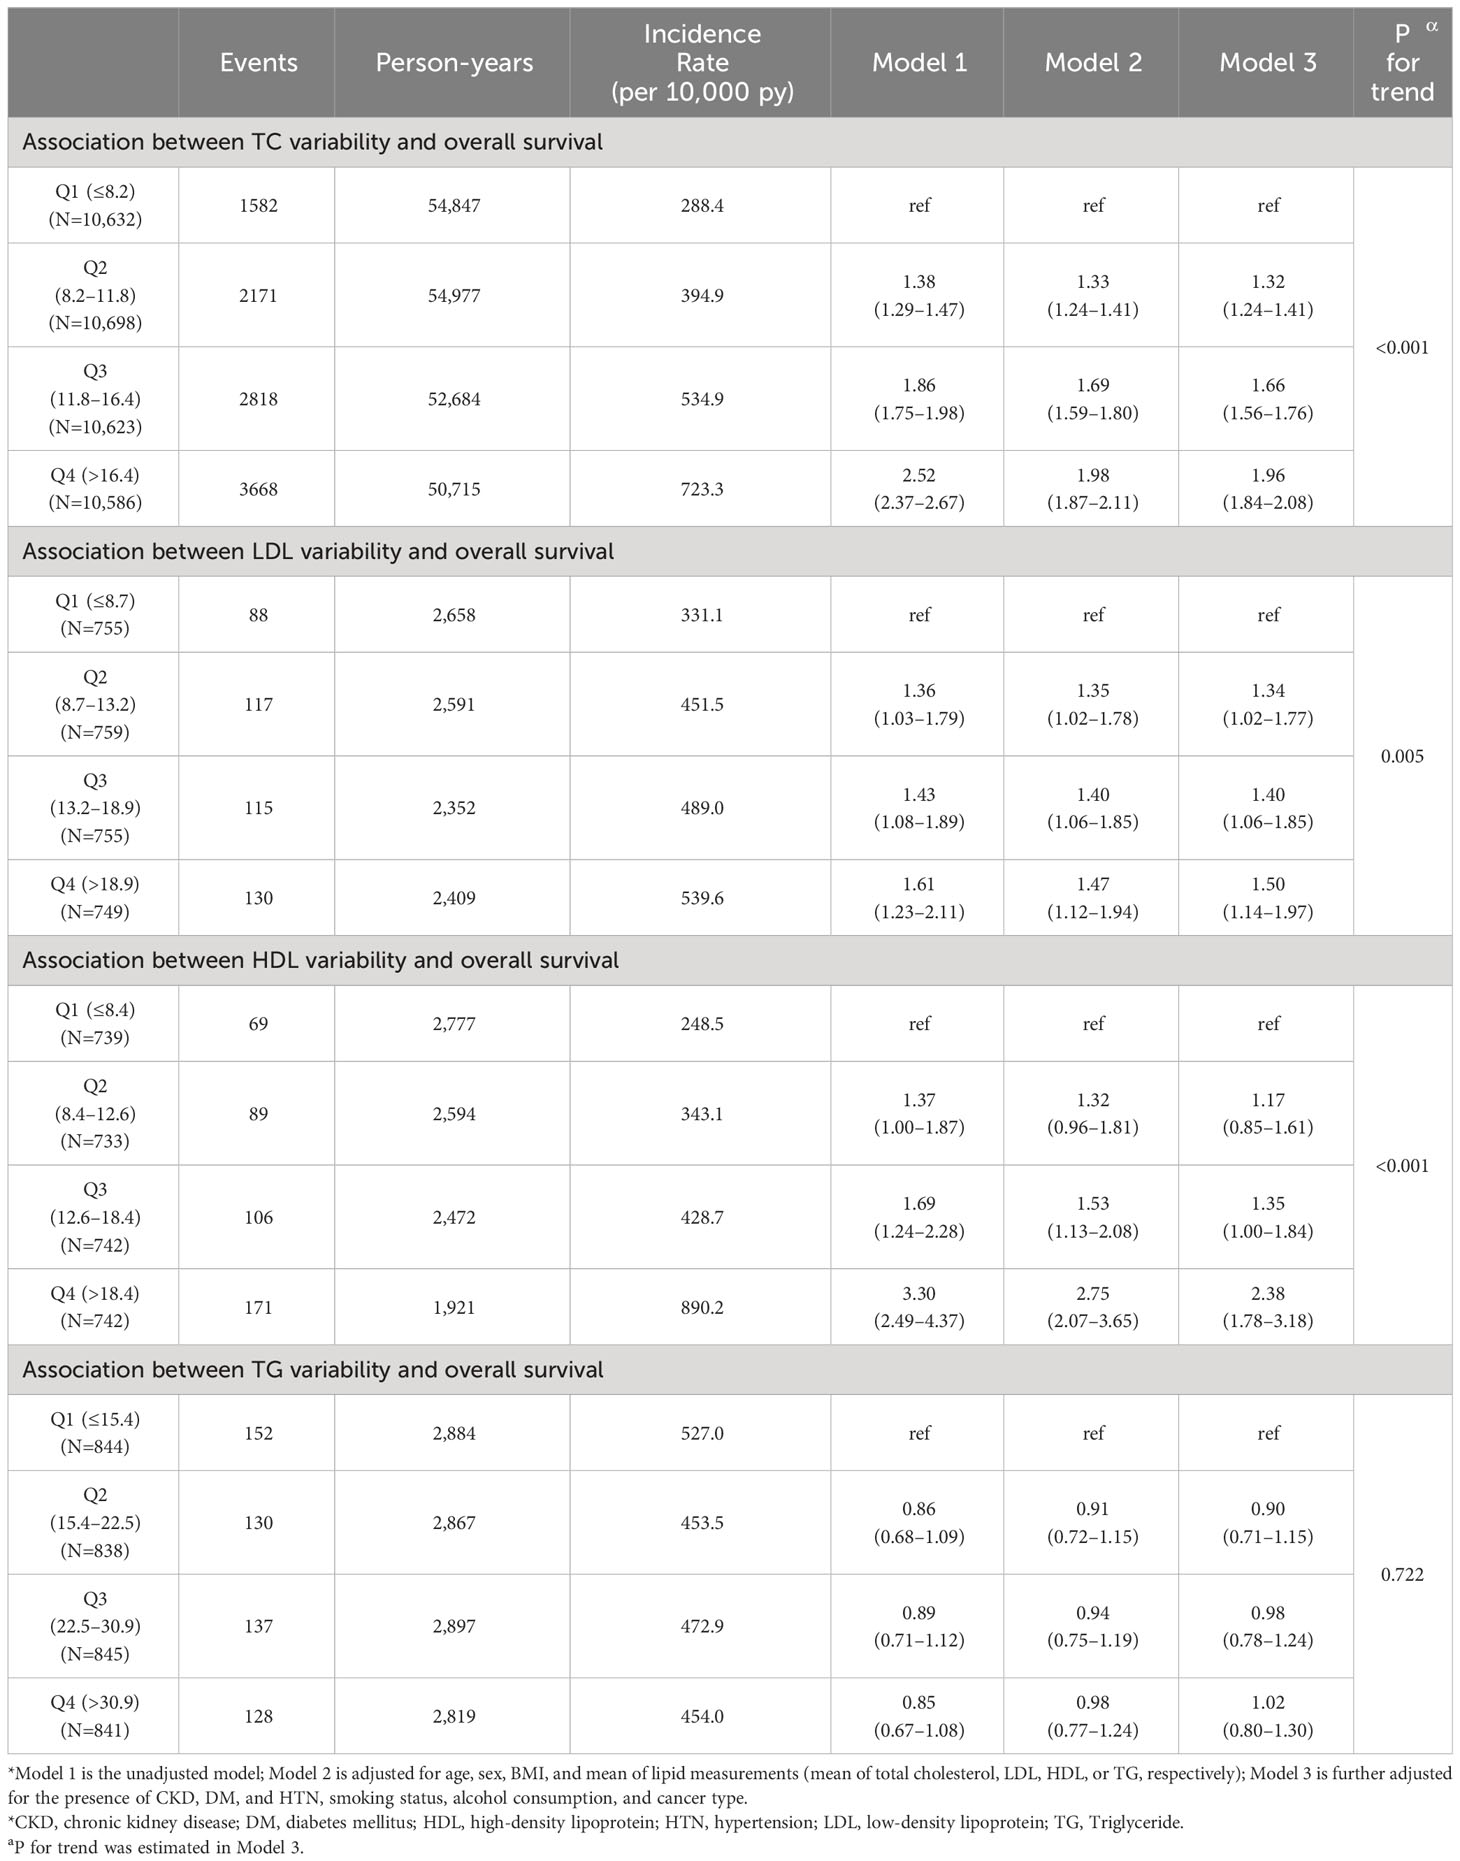
Table 2 Multivariable Cox regression for mortality by quartile of total cholesterol, LDL-C, HDL-C, and TG.
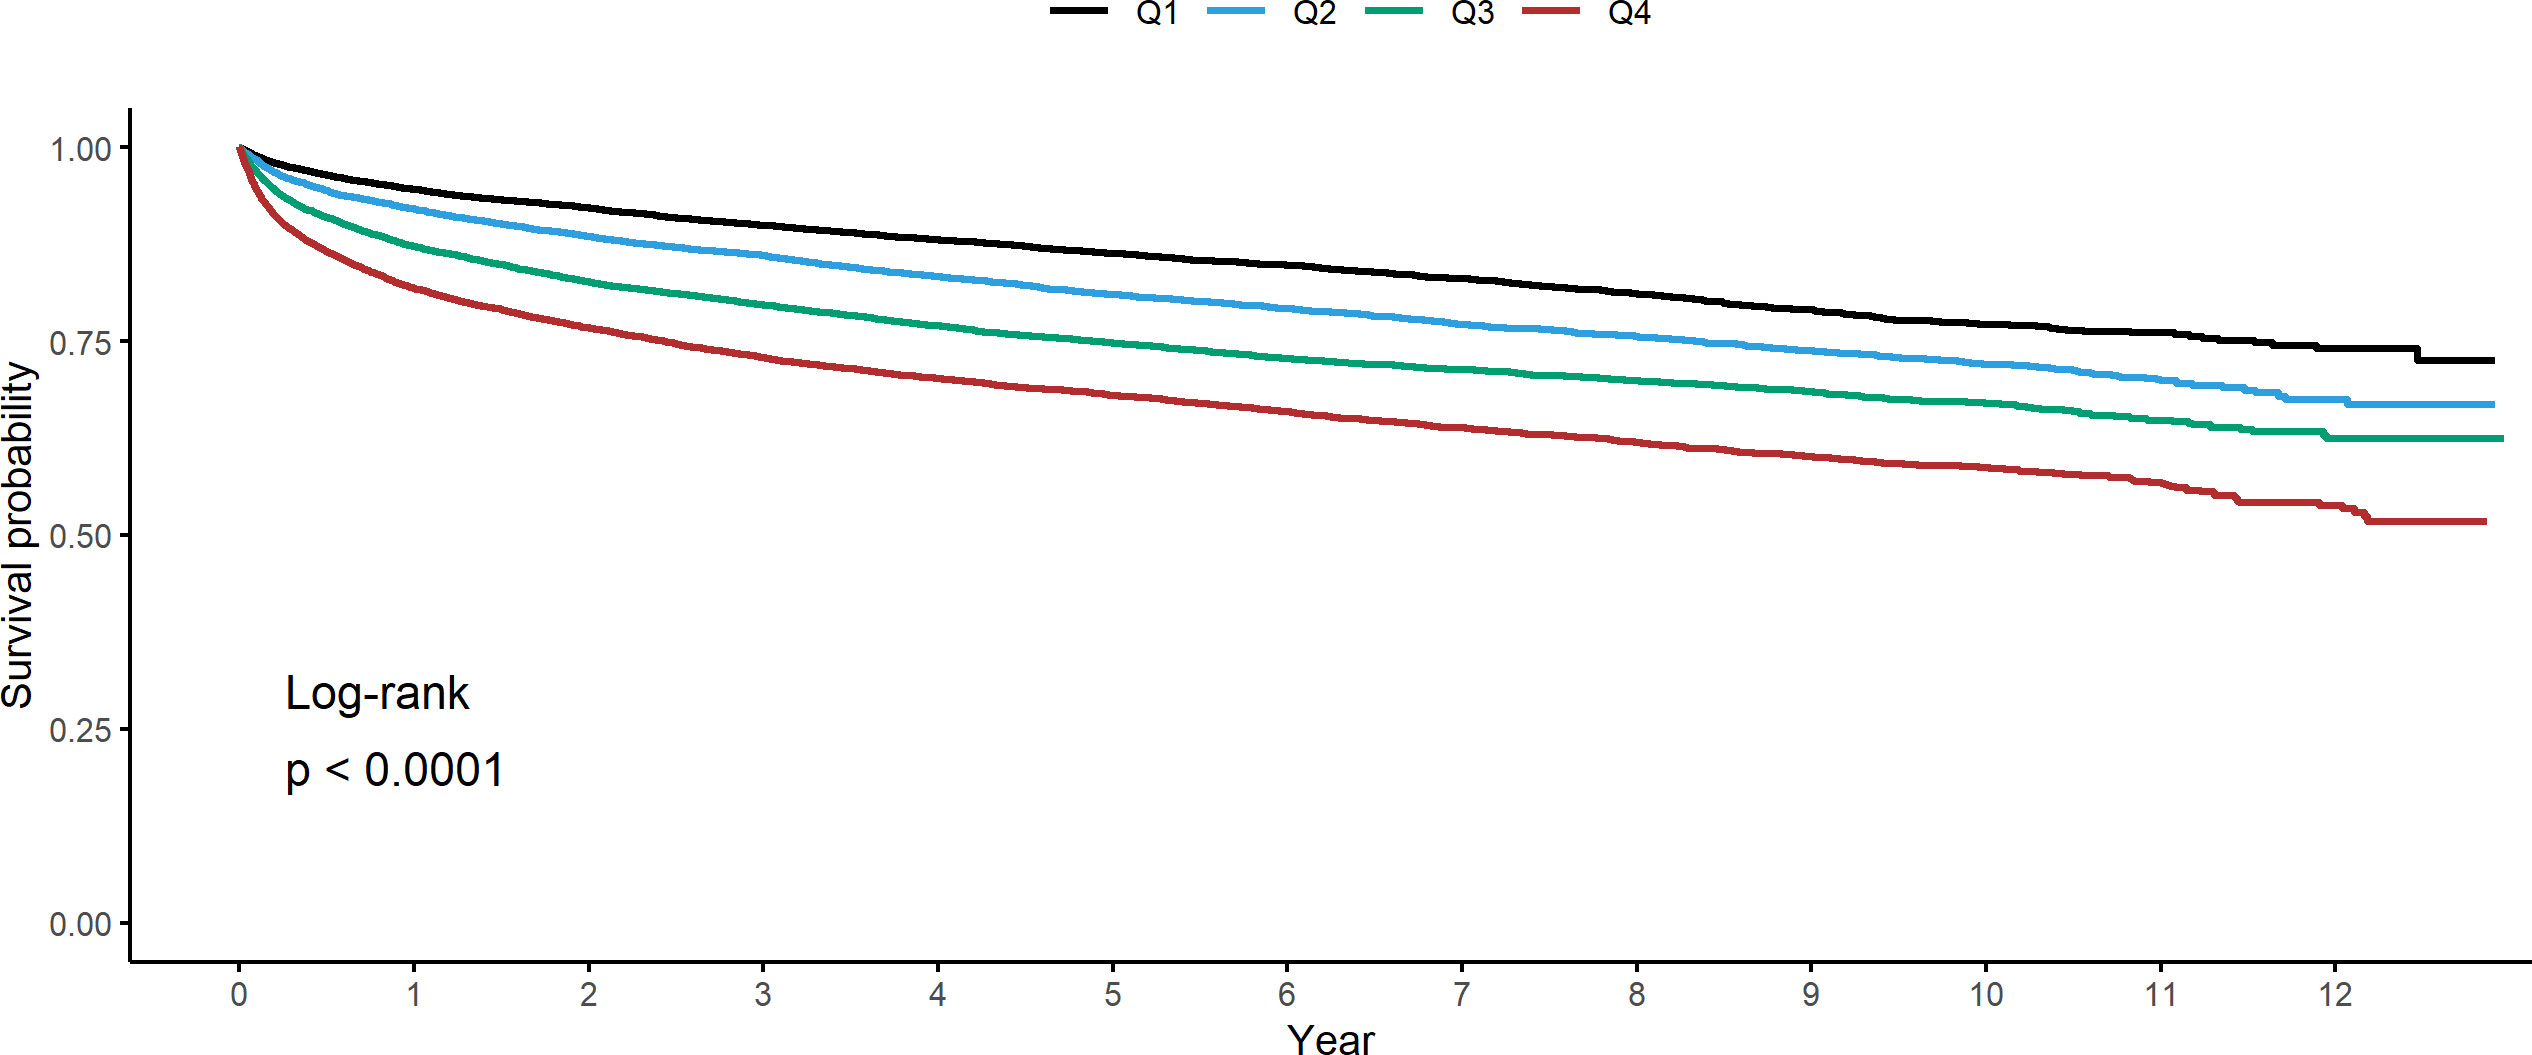
Figure 2 Kaplan-Meier estimates for all-cause mortality in cancer patients stratified by quartile of coefficient of variation in total cholesterol.
3.3 Sensitivity analysis and subgroup analysis
We conducted a sensitivity analysis for cancer patients who achieved NED during the study period to be censored at NED status. As shown in Table 3, Q2 (aHR: 1.38, 95% CI: 1.28–1.49), Q3 (aHR: 1.77, 95% CI: 1.64–1.9), and Q4 (aHR: 2.09, 95% CI: 1.95–2.25) of CV in TC were significantly associated with an increased risk of mortality compared to Q1 (Table 3). Furthermore, when the use of lipid-lowering agents was censored considering patients who received lipid-lowering agents during the study period, Q2 (aHR: 1.32, 95% CI: 1.23–1.41), Q3 (aHR: 1.67, 95% CI: 1.57–1.78), and Q4 (aHR: 1.97, 95% CI: 1.85–2.1) of CV in TC were all significantly linked with a higher risk of death compared to Q1 (Table 4). Furthermore, in subgroup analyses, heterogeneity was not observed in age, sex, presence or absence of DM and HTN, smoking status, or alcohol consumption, except for cancer type (Supplementary Table 1). Using GEE models, after controlling covariates, an increase of 1 mg/dL in absolute changes of total cholesterol from baseline was found to significantly increase mortality risk by 0.4%. (Supplementary Table 2).
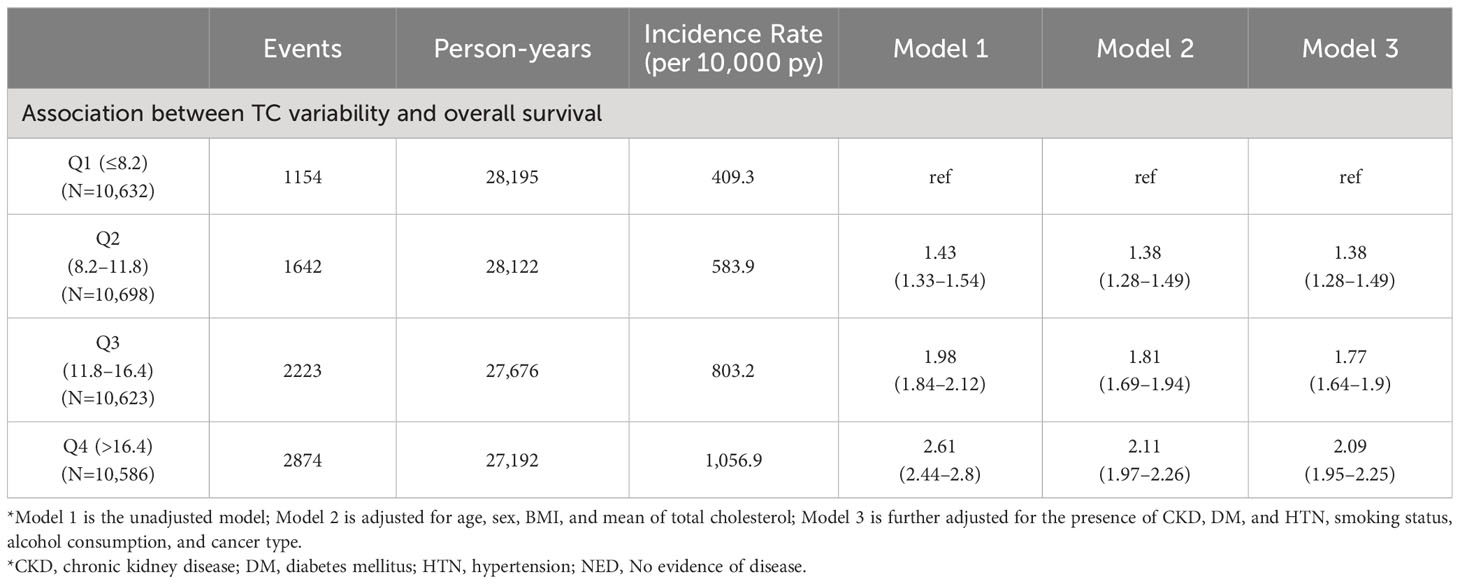
Table 3 Sensitivity analysis according to NED status.
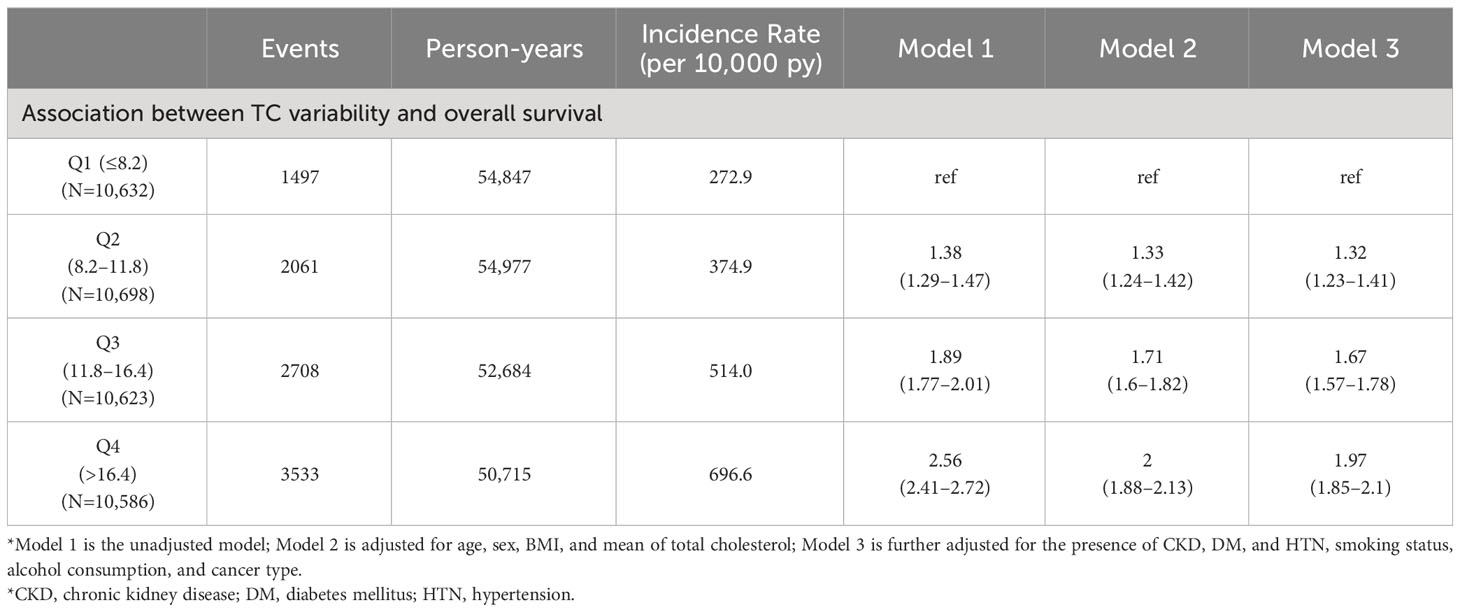
Table 4 Sensitivity analysis according to the administration of lipid-lowering agents during the follow-up study period.
4 Discussion
In this large-scale longitudinal study comprising 213,223 person-years, we found that a high CV quartile in TC was significantly associated with all-cause mortality after considering potential confounding variables. Despite considering NED status and the administration of lipid-lowering medications during the follow-up study period, our study’s findings were consistent. Additionally, we investigated the relationships between the CV quartiles of LDL-C, HDL-C, and TG and mortality risk. We found a significant relationship between the high CV quartiles of LDL-C and HDL-C and mortality risk, but not TG. We demonstrated the comprehensive prognostic role of lipid variability on mortality risk in cancer patients not receiving lipid-lowering medication.
In a systematic review and meta-analysis of the association of lipid variability with all-cause mortality, a high CV of TC, LDL-C, and HDL-C was significantly associated with all-cause mortality (6, 19). In our study, the association between the CV quartiles of TC, LDL, and HDL and mortality risk was significant but not for TG. In the two previous studies that examined the effect of the CV quartile of TC on all-cause mortality, the adjusted hazard ratio in Q4 was 1.26 (95% CI: 1.24–1.28) and 1.21 (95% CI: 1.05–1.40) compared to Q1 (7, 12). Two previous studies evaluated the effect of cholesterol fluctuations on mortality regardless of the administration of lipid-lowering agents. However, our large cohort study evaluated the effect in cancer patients who did not receive lipid-lowering agents, considering the possible effect of lipid-lowering agents on cholesterol fluctuations. Although previous studies have been conducted in different populations and settings from ours, our study found that the aHR in Q4 was 1.96 (95% CI: 1.84–2.08) compared to Q1 in cancer patients not receiving lipid-lowering medications. One previous study estimated that the aHR for all-cause mortality was 1.41 (95% CI: 1.36–1.45) for the low-mean/high variability of HDL-C compared with the high-mean/low-variability (8). In our study, the aHR of the highest variability of HDL (Q4) compared with the lowest variability (Q1) was 2.38 (95% CI: 1.78–3.18). In subgroup analysis, it was estimated that the HR of CV from TC to death was different for each cancer type (P for interaction<0.001). In subsequent studies, a larger sample size may be required to determine which cancer species are more vulnerable.
Several possible mechanisms have been implicated in the pathophysiology underlying the effect of lipid variability on the mortality risk of cancer patients not receiving lipid-lowering agents. High lipid variability may exacerbate the fluctuation of atherosclerotic plaque components, resulting in recurrent cholesterol crystallization and dissolution within the restricted region, compromising plaque stability and causing plaque rupture (10, 19, 20). Additionally, variations in cholesterol levels may lead to endothelial dysfunction (21–23). In a mouse study, endothelial inflammation increased endothelial permeability, and alteration of the glycocalyx was significant in early cancer metastatic events (24). Furthermore, dysfunctionally activated endothelial cells induced both the spontaneous metastasis of lung cancers in mice and pro-inflammatory signaling (25). In addition, dysregulated cholesterol homeostasis may affect cancer pathogenesis and metastasis by favoring cells resistant to ferroptotic cell death (26). Previous studies found that people with arteriosclerosis were twice as likely to develop cancer and die than those without arteriosclerosis and cancer patients were roughly twice as likely to die from arteriosclerosis than the general population (27, 28). Also, increased mortality risk is associated with high HDL-C variability, which may be a consequence of impaired cholesterol efflux from macrophages and peripheral organs, systemic diseases, and overall frailty (8, 29–31). Higher LDL-C variability has been associated with higher urine protein-to-creatinine ratio in chronic kidney disease patients and increased risk of atrial fibrillation (6, 32, 33). Additionally, higher LDL-C variability was associated with reduced cerebral blood flow and increased white matter hyperintensity burden (34, 35). Reduced cognitive function is linked to a slightly higher probability of death from cancer, along with a much higher risk of death from any cause (36).
The strength of our study is that it is the first to evaluate the association between the variability of lipid measurement and all-cause mortality with long-term follow-up in a large sample size of newly diagnosed cancer patients not receiving lipid-lowering agents. Second, we evaluated the effect of TC variability and LDL-C, TG, and HDL-C fluctuation on all-cause mortality. We conducted the study by limiting it to patients who did not take lipid-lowering agents to exclude the possible effects of lipid-lowering agents on lipid fluctuations. Third, we conducted two sensitivity analyses considering NED status and taking lipid-lowering agents during the study follow-up. Consequently, the main result of our study is consistent with sensitivity analysis. Finally, the results of the study may have clinical implications. Laboratory blood tests commonly conducted for cancer patients allow for easy measurement of lipid variability. Monitoring lipid variability when cancer is first diagnosed may help to lower mortality rates. In addition, if cancer patients exhibit high lipid variability in TC, LDL-C, and HDL-C, physicians can educate them about the importance of controlling and maintaining cholesterol levels through lifestyle modifications or medication to prevent fluctuations. However, our study has several limitations. First, since the study relies on a sample of Korean people in a single center, our findings cannot be extrapolated to people of different ethnicities. In addition, because only those with at least three lipid measurements performed at the hospital within 2 years of their cancer diagnosis were included in the study, there may be a selection and surveillance bias in that those who visited the hospital more frequently were included in the study. Additionally, unmeasured, or residual confounding, such as cancer therapy, eating habits, physical activity, or specific cancer treatment details could not be completely eliminated, although the multivariable analysis considered many confounders. Third, while our study explored association between cholesterol fluctuations and mortality in cancer patients, a subsequent study is necessary to study the biological mechanisms related to specific cancer types, alterations in endothelial function, or inflammation. Finally, since our hospital’s medical electronic records and self-questionnaires were used when another hospital prescribed the drug, it could be missed in the analysis. In this large-scale longitudinal investigation, we found that after controlling for any potential confounding variables, the high CV quartile in TC was significantly associated with all-cause death in newly diagnosed cancer patients.
5 Conclusions
Increasing mortality risk was significantly associated with high CV quartiles of LDL-C and HDL-C but not TG. These findings suggest that lipid fluctuation can be a comprehensive prognostic marker of mortality risk in cancer patients not receiving lipid-lowering drugs.
Data availability statement
The original contributions presented in the study are included in the article/Supplementary Material. Further inquiries can be directed to the corresponding author.
Ethics statement
The studies involving humans were approved by The Institutional Review Board (IRB) of Samsung Medical Center approved this study (approval no. SMC 2023-01-085). An informed consent exemption was granted by the IRB because all data provided by the CDW of SMC to researchers were de-identified. The studies were conducted in accordance with the local legislation and institutional requirements. The ethics committee/institutional review board waived the requirement of written informed consent for participation from the participants or the participants’ legal guardians/next of kin because The Institutional Review Board (IRB) of Samsung Medical Center approved this study (approval no. SMC 2023-01-085). An informed consent exemption was granted by the IRB because all data provided by the CDW of SMC to researchers were de-identified.
Author contributions
SK: Conceptualization, Data curation, Investigation, Software, Writing – original draft. GK: Conceptualization, Writing – original draft, Writing – review & editing. SC: Writing – review & editing. RO: Writing – review & editing. JYK: Writing – review & editing. YBL: Writing – review & editing. S-MJ: Writing – review & editing. KH: Writing – review & editing. JHK: Conceptualization, Investigation, Methodology, Project administration, Supervision, Writing – review & editing, Writing – original draft.
Conflict of interest
The authors declare that the research was conducted in the absence of any commercial or financial relationships that could be construed as a potential conflict of interest.
Publisher’s note
All claims expressed in this article are solely those of the authors and do not necessarily represent those of their affiliated organizations, or those of the publisher, the editors and the reviewers. Any product that may be evaluated in this article, or claim that may be made by its manufacturer, is not guaranteed or endorsed by the publisher.
Supplementary material
The Supplementary Material for this article can be found online at: https://www.frontiersin.org/articles/10.3389/fonc.2023.1254339/full#supplementary-material
Abbreviations
aHR, adjusted hazard ratio; ANOVA, analysis of variance; BMI, body mass index; CDW, clinical data warehouse; CI, confidence interval; CKD-EPI 2021, chronic kidney disease epidemiology collaboration 2021; CV, coefficient of variation; DM, diabetes mellitus; HDL, high-density lipoprotein; HTN, hypertension; ICD-10, International Classification of Disease, 10th revision; LDL, low-density lipoprotein; NED, no-evidence-of-disease; SD, standard deviation; SMC, Samsung Medical Center; TC, total cholesterol; TG, triglyceride.
References
1. Wang H, Naghavi M, Allen C, Barber RM, Bhutta ZA, Carter A, et al. Global, regional, and national life expectancy, all-cause mortality, and cause-specific mortality for 249 causes of death, 1980-2015: a systematic analysis for the Global Burden of Disease Study 2015. Lancet (London England) (2016) 388(10053):1459–544. doi: 10.1016/S0140-6736(16)31012-1
2. Bray F, Ferlay J, Soerjomataram I, Siegel RL, Torre LA, Jemal A. Global cancer statistics 2018: GLOBOCAN estimates of incidence and mortality worldwide for 36 cancers in 185 countries. CA Cancer J Clin (2018) 68(6):394–424. doi: 10.3322/caac.21492
3. Amin MB, Greene FL, Edge SB, Compton CC, Gershenwald JE, Brookland RK, et al. The Eighth Edition AJCC Cancer Staging Manual: Continuing to build a bridge from a population-based to a more "personalized" approach to cancer staging. CA Cancer J Clin (2017) 67(2):93–9. doi: 10.3322/caac.21388
4. Zhou P, Li B, Liu B, Chen T, Xiao J. Prognostic role of serum total cholesterol and high-density lipoprotein cholesterol in cancer survivors: A systematic review and meta-analysis. Clinica chimica acta; Int J Clin Chem (2018) 477:94–104. doi: 10.1016/j.cca.2017.11.039
5. Kreger BE, Odell PM, D'Agostino RB, Wilson PF. Long-term intraindividual cholesterol variability: natural course and adverse impact on morbidity and mortality–the Framingham Study. Am Heart J (1994) 127(6):1607–14. doi: 10.1016/0002-8703(94)90393-X
6. Wang MC, Li CI, Liu CS, Lin CH, Yang SY, Li TC, et al. Effect of blood lipid variability on mortality in patients with type 2 diabetes: a large single-center cohort study. Cardiovasc Diabetol (2021) 20(1):228. doi: 10.1186/s12933-021-01421-4
7. Kim MK, Han K, Kim HS, Park YM, Kwon HS, Yoon KH, et al. Cholesterol variability and the risk of mortality, myocardial infarction, and stroke: a nationwide population-based study. Eur Heart J (2017) 38(48):3560–6. doi: 10.1093/eurheartj/ehx585
8. Han BH, Han K, Yoon KH, Kim MK, Lee SH. Impact of mean and variability of high-density lipoprotein-cholesterol on the risk of myocardial infarction, stroke, and mortality in the general population. J Am Heart Assoc (2020) 9(7):e015493. doi: 10.1161/JAHA.119.015493
9. Mantel-Teeuwisse AK, Kloosterman JM, Maitland-van der Zee AH, Klungel OH, Porsius AJ, de Boer A. Drug-Induced lipid changes: a review of the unintended effects of some commonly used drugs on serum lipid levels. Drug Saf (2001) 24(6):443–56. doi: 10.2165/00002018-200124060-00003
10. Clark D 3rd, Nicholls SJ, St John J, Elshazly MB, Kapadia SR, Tuzcu EM, et al. Visit-to-visit cholesterol variability correlates with coronary atheroma progression and clinical outcomes. Eur Heart J (2018) 39(27):2551–8. doi: 10.1093/eurheartj/ehy209
11. Park MJ, Choi KM. Association between variability of metabolic risk factors and cardiometabolic outcomes. Diabetes Metab J (2022) 46(1):49–62. doi: 10.4093/dmj.2021.0316
12. Zhu Y, Lu JM, Yu ZB, Li D, Wu MY, Shen P, et al. Intra-individual variability of total cholesterol is associated with cardiovascular disease mortality: A cohort study. Nutrition metabolism Cardiovasc Dis NMCD (2019) 29(11):1205–13. doi: 10.1016/j.numecd.2019.07.007
13. Inker LA, Eneanya ND, Coresh J, Tighiouart H, Wang D, Sang Y, et al. New creatinine- and cystatin C-based equations to estimate GFR without race. N Engl J Med (2021) 385(19):1737–49. doi: 10.1056/NEJMoa2102953
14. Levey AS, Coresh J, Balk E, Kausz AT, Levin A, Steffes MW, et al. K/DOQI clinical practice guidelines for chronic kidney disease: evaluation, classification, and stratification. Am J Kidney Dis Off J Natl Kidney Foundation (2002) 39(2 Suppl 1):S1–266.
15. Jung KW, Won YJ, Kong HJ, Lee ES. Prediction of cancer incidence and mortality in korea, 2018. Cancer Res Treat (2018) 50(2):317–23. doi: 10.4143/crt.2018.142
16. Na SY, Sung JY, Chang JH, Kim S, Lee HH, Park YH, et al. Chronic kidney disease in cancer patients: an independent predictor of cancer-specific mortality. Am J nephrology. (2011) 33(2):121–30. doi: 10.1159/000323740
17. Ishii T, Fujimaru T, Nakano E, Takahashi O, Nakayama M, Yamauchi T, et al. Association between chronic kidney disease and mortality in stage IV cancer. Int J Clin Oncol (2020) 25(9):1587–95. doi: 10.1007/s10147-020-01715-9
18. Bishop AJ, Ensor J, Moulder SL, Shaitelman SF, Edson MA, Whitman GJ, et al. Prognosis for patients with metastatic breast cancer who achieve a no-evidence-of-disease status after systemic or local therapy. Cancer (2015) 121(24):4324–32. doi: 10.1002/cncr.29681
19. Li S, Hou L, Zhu S, Yi Q, Liu W, Zhao Y, et al. Lipid variability and risk of cardiovascular diseases and all-cause mortality: A systematic review and meta-analysis of cohort studies. Nutrients (2022) 14(12). doi: 10.3390/nu14122450
20. Lee SH, Kim MK, Rhee EJ. Effects of cardiovascular risk factor variability on health outcomes. Endocrinol Metab (Seoul Korea) (2020) 35(2):217–26. doi: 10.3803/EnM.2020.35.2.217
21. Chen H, Ren JY, Xing Y, Zhang WL, Liu X, Wu P, et al. Short-term withdrawal of simvastatin induces endothelial dysfunction in patients with coronary artery disease: a dose-response effect dependent on endothelial nitric oxide synthase. Int J Cardiol (2009) 131(3):313–20. doi: 10.1016/j.ijcard.2007.10.044
22. Davignon J. Beneficial cardiovascular pleiotropic effects of statins. Circulation (2004) 109(23 Suppl 1):Iii39–43. doi: 10.1161/01.CIR.0000131517.20177.5a
23. Grover-Páez F, Zavalza-Gómez AB. Endothelial dysfunction and cardiovascular risk factors. Diabetes Res Clin Practice (2009) 84(1):1–10. doi: 10.1016/j.diabres.2008.12.013
24. Suraj J, Kurpińska A, Zakrzewska A, Sternak M, Stojak M, Jasztal A, et al. Early and late endothelial response in breast cancer metastasis in mice: simultaneous quantification of endothelial biomarkers using a mass spectrometry-based method. Dis Models Mech (2019) 12(3). doi: 10.1242/dmm.036269
25. Franses JW, Drosu NC, Gibson WJ, Chitalia VC, Edelman ER. Dysfunctional endothelial cells directly stimulate cancer inflammation and metastasis. Int J cancer. (2013) 133(6):1334–44. doi: 10.1002/ijc.28146
26. Liu W, Chakraborty B, Safi R, Kazmin D, Chang CY, McDonnell DP. Dysregulated cholesterol homeostasis results in resistance to ferroptosis increasing tumorigenicity and metastasis in cancer. Nat Commun (2021) 12(1):5103. doi: 10.1038/s41467-021-25354-4
27. Sturgeon KM, Deng L, Bluethmann SM, Zhou S, Trifiletti DM, Jiang C, et al. A population-based study of cardiovascular disease mortality risk in US cancer patients. Eur Heart J (2019) 40(48):3889–97. doi: 10.1093/eurheartj/ehz766
28. Suzuki M, Tomoike H, Sumiyoshi T, Nagatomo Y, Hosoda T, Nagayama M, et al. Incidence of cancers in patients with atherosclerotic cardiovascular diseases. Int J Cardiol Heart Vasc (2017) 17:11–6. doi: 10.1016/j.ijcha.2017.08.004
29. Lee EY, Yang Y, Kim HS, Cho JH, Yoon KH, Chung WS, et al. HDL-, and non-HDL-cholesterol variability on mortality and cardiovascular outcomes after percutaneous coronary intervention. Atherosclerosis (2018) 279:1–9. doi: 10.1016/j.atherosclerosis.2018.10.012
30. Kim MK, Han K, Park YM, Kwon HS, Kang G, Yoon KH, et al. Associations of variability in blood pressure, glucose and cholesterol concentrations, and body mass index with mortality and cardiovascular outcomes in the general population. Circulation (2018) 138(23):2627–37. doi: 10.1161/CIRCULATIONAHA.118.034978
31. Bangalore S, Fayyad R, Messerli FH, Laskey R, DeMicco DA, Kastelein JJ, et al. Relation of variability of low-density lipoprotein cholesterol and blood pressure to events in patients with previous myocardial infarction from the IDEAL trial. Am J Cardiol (2017) 119(3):379–87. doi: 10.1016/j.amjcard.2016.10.037
32. Lee HJ, Lee SR, Choi EK, Han KD, Oh S. Low lipid levels and high variability are associated with the risk of new-onset atrial fibrillation. J Am Heart Assoc (2019) 8(23):e012771. doi: 10.1161/JAHA.119.012771
33. Lin YH, Huang JC, Wu PY, Chen SC, Chiu YW, Chang JM, et al. Greater low-density lipoprotein cholesterol variability is associated with increased progression to dialysis in patients with chronic kidney disease stage 3. Oncotarget (2018) 9(3):3242–53. doi: 10.18632/oncotarget.23228
34. Smit RA, Trompet S, Sabayan B, le Cessie S, van der Grond J, van Buchem MA, et al. Higher visit-to-visit low-density lipoprotein cholesterol variability is associated with lower cognitive performance, lower cerebral blood flow, and greater white matter hyperintensity load in older subjects. Circulation (2016) 134(3):212–21. doi: 10.1161/CIRCULATIONAHA.115.020627
35. Hoth KF, Tate DF, Poppas A, Forman DE, Gunstad J, Moser DJ, et al. Endothelial function and white matter hyperintensities in older adults with cardiovascular disease. Stroke (2007) 38(2):308–12. doi: 10.1161/01.STR.0000254517.04275.3f
36. Rostamian S, le Cessie S, Marijt KA, Jukema JW, Mooijaart SP, van Buchem MA, et al. Association of cognitive function with increased risk of cancer death and all-cause mortality: Longitudinal analysis, systematic review, and meta-analysis of prospective observational studies. PLoS One (2022) 17(1):e0261826. doi: 10.1371/journal.pone.0261826
Keywords: total cholesterol, LDL cholesterol, variability, mortality, cancer
Citation: Kim S, Kim G, Cho SH, Oh R, Kim JY, Lee Y-B, Jin S-M, Hur KY and Kim JH (2023) Association between lipid variability and the risk of mortality in cancer patients not receiving lipid-lowering agents. Front. Oncol. 13:1254339. doi: 10.3389/fonc.2023.1254339
Received: 07 July 2023; Accepted: 04 September 2023;
Published: 05 October 2023.
Edited by:
Miguel Martin-Perez, Institute for Research in Biomedicine, SpainReviewed by:
Yanshuo Han, Dalian University of Technology, ChinaDaniel Gideon, Bishop Heber College, India
Om Prakash, Council of Scientific and Industrial Research (CSIR), India
Copyright © 2023 Kim, Kim, Cho, Oh, Kim, Lee, Jin, Hur and Kim. This is an open-access article distributed under the terms of the Creative Commons Attribution License (CC BY). The use, distribution or reproduction in other forums is permitted, provided the original author(s) and the copyright owner(s) are credited and that the original publication in this journal is cited, in accordance with accepted academic practice. No use, distribution or reproduction is permitted which does not comply with these terms.
*Correspondence: Jae Hyeon Kim, amFlaHllb25raW0yNkBnbWFpbC5jb20=
†These authors have contributed equally to this work