
95% of researchers rate our articles as excellent or good
Learn more about the work of our research integrity team to safeguard the quality of each article we publish.
Find out more
ORIGINAL RESEARCH article
Front. Oncol. , 18 January 2024
Sec. Genitourinary Oncology
Volume 13 - 2023 | https://doi.org/10.3389/fonc.2023.1244585
This article is part of the Research Topic Radiomics and AI for clinical and translational medicine View all 7 articles
 Xiaoli Zhai1†
 Penghui Sun1*†
 Xianbo Yu2Shuangkun Wang1Xue Li3Weiqian Sun4Xin Liu1Tian Tian1Bowen Zhang1
Objectives: To develop a CT-based radiomics model and a combined model for preoperatively discriminating infiltrative renal cell carcinoma (RCC) and pyelocaliceal upper urinary tract urothelial carcinoma (UTUC), which invades the renal parenchyma.
Materials and methods: Eighty patients (37 pathologically proven infiltrative RCCs and 43 pathologically proven pyelocaliceal UTUCs) were retrospectively enrolled and randomly divided into a training set (n = 56) and a testing set (n = 24) at a ratio of 7:3. Traditional CT imaging characteristics in the portal venous phase were collected by two radiologists (SPH and ZXL, who have 4 and 30 years of experience in abdominal radiology, respectively). Patient demographics and traditional CT imaging characteristics were used to construct the clinical model. The radiomics score was calculated based on the radiomics features extracted from the portal venous CT images and the random forest (RF) algorithm to construct the radiomics model. The combined model was constructed using the radiomics score and significant clinical factors according to the multivariate logistic regression. The diagnostic efficacy of the models was evaluated using receiver operating characteristic (ROC) curve analysis and the area under the curve (AUC).
Results: The RF score based on the eight validated features extracted from the portal venous CT images was used to build the radiomics model. Painless hematuria as an independent risk factor was used to build the clinical model. The combined model was constructed using the RF score and the selected clinical factor. Both the radiomics model and combined model showed higher efficacy in differentiating infiltrative RCC and pyelocaliceal UTUC in the training and testing cohorts with AUC values of 0.95 and 0.90, respectively, for the radiomics model and 0.99 and 0.90, respectively, for the combined model. The decision curves of the combined model as well as the radiomics model indicated an overall net benefit over the clinical model. Both the radiomics model and the combined model achieved a notable reduction in false-positive and false-negativerates, resulting in significantly higher accuracy compared to the visual assessments in both the training and testing cohorts.
Conclusion: The radiomics model and combined model had the potential to accurately differentiate infiltrative RCC and pyelocaliceal UTUC, which invades the renal parenchyma, and provide a new potentially non-invasive method to guide surgery strategies.
Urothelial cancers of the renal pelvis and collecting system constitute approximately 10%–15% of all renal tumors (1). Early pyelocaliceal upper urinary tract urothelial carcinoma (UTUC) is centered on the renal pelvis and calyces and grows in a centripetal direction. Most pyelocaliceal UTUCs can be diagnosed by their characteristic location. Open radical nephroureterectomy with bladder cuff excision is the standard treatment when pyelocaliceal UTUC invades the renal parenchyma (2). However, some infiltrative renal cell carcinomas (RCCs) can also grow into the renal sinus and invade the renal pelvis, which can mimic CT imaging manifestations of pyelocaliceal UTUC invading the renal parenchyma, making differential diagnosis challenging (3–5). In addition, radical nephrectomy is often applied for patients with infiltrative RCC (6), which is different from the surgical treatment of pyelocaliceal UTUC invading the renal parenchyma. Meanwhile, UTUC is prone to recurrence, and the patients mostly have a poor prognosis, requiring close clinical follow-up. Therefore, differential diagnosis of infiltrative RCC and pyelocaliceal UTUC preoperatively is essential.
Multiphasic multidetector-row CT (MDCT) scanning is the most common imaging modality for the detection and staging of UTUC and RCC (7), which can guide the subsequent strategy of imaging examination and treatment (8–11). Florian (12) demonstrated similar rates for detection, sensitivity, and specificity of metastases and local recurrence of RCC when comparing a dual-phase protocol with arterial and portal venous contrast to a single-phase protocol with portal venous contrast. Raza (13, 14) found that pyelocaliceal UTUC is more likely a solid, homogeneously enhancing mass centered on the collecting system and extended toward the ureteropelvic junction, with a focal pelvicalyceal filling defect and preserved renal outline. The accuracy of MDCT for the prediction of peritumoral invasion has positive and negative predictive values of 88.8% and 87.5%, respectively (14). Typically, RCCs appear as focal well-circumscribed masses and enhance avidly and heterogeneously with pseudocapsule (15, 16). In MRI, Wehrli found that pyelocaliceal UTUC exhibited a significantly lower normalized apparent diffusion coefficient (ADC) than RCC (17). In addition, Dursun found a higher SUVmax value in pyelocaliceal UTUC at 18−FDG PET/CT scanning (18). However, some infiltrative RCCs enhance poorly and homogeneously, with their imaging features overlapping with other cancers. Thus, more objective and quantitative parameters are required to identify infiltrative RCC and pyelocaliceal UTUC.
Radiomics is a quantitative analysis method based on medical images and uses a large number of algorithms to transform the region of interest (ROI) in medical images into high-dimensional features. It contains information on disease- and patient-specific processes that are imperceptible to the human eye (19, 20). It can be used to analyze the heterogeneity of an entire tumor based on hundreds of quantitative features and also quantitatively analyze the relationship between the biological and imaging characteristics of the tumor (21).
In this study, we aimed to assess the value of radiomics features and conduct a radiomics model and a combined model to differentiate pyelocaliceal UTUC that invades the renal parenchyma and infiltrative RCC based on enhanced CT images.
Data were collected through an electronic search of the picture archiving and communication system covering images recorded from January 2017 to December 2021. Two consecutive size-matched cohorts were established with the following inclusion criteria: 1) patients underwent nephrectomy, nephroureterectomy, or surgical resection of the renal lesions, and final diagnoses were based on histopathology, and 2) patients underwent preoperative four-phasic contrast-enhanced CT (CECT) scans. Exclusion criteria were prominent artifacts on CT images.
Finally, 80 patients (37 pathologically proven infiltrative RCCs and 43 pathologically proven pyelocaliceal UTUCs) were retrospectively enrolled and randomly divided into a training set (n = 56) and a testing set (n = 24) at a ratio of 7:3. Additionally, infiltrative RCCs were all clear cell carcinomas without rhabdoid or sarcomatoid differentiation, and pyelocaliceal UTUCs were all urothelial carcinomas.
CECT images were obtained using three scanners: the SOMATOM Definition CT scanner, the SOMATOM Force CT scanner (Siemens Healthcare, Erlangen, Germany), and the Revolution Frontier CT scanners (General Electric Company, Chicago, IL, USA). Before scanning, the patients’ bodies were fixed, and they were instructed to remain still and breathe calmly. The scanning parameters were as follows: tube voltage of 120 kVp and automated tube current modulation and a variable setting of 280–300 mA. Other parameters were as follows: slice interval of 5 mm, slice thickness of 5 mm, and reconstructed section thickness of 1.25 mm.
Following unenhanced CT images, the arterial, portal, and delayed phase images were obtained in all patients. The portal phase that we used in this study was obtained with a delay of 70 seconds. All patients received non-ionic intravenous contrast material of approximately 60–80 mL. The contrast material was administered using mechanical power injectors. A contrast agent was injected into the anterior elbow vein or dorsal hand vein at a rate of 3 ml/s.
Patient demographics and traditional CT imaging characteristics were used to construct the clinical model. Patient demographic characteristics were obtained from the picture archiving and communication system (PACS) of the hospital including gender, age, back pain, frequent urination, and painless hematuria. The traditional features based on the enhanced CT images were independently evaluated by two radiologists (SPH and ZXL, who have 4 and 30 years of experience in abdominal radiology, respectively). They were blinded to postoperative pathology. A consensus was reached through consultation in case of disagreement. The univariate logistic regression analysis was used to compare the differences in the patient demographics and traditional CT imaging characteristics between the infiltrative RCCs and pyelocaliceal UTUCs. The significant risk factors selected using the univariate logistic regression analysis were applied to the following multivariate logistic regression analysis to construct the clinical model.
The workflow of the radiomics model construction was described in Figure 1. First, ROIs were manually drawn by junior radiologists using the ITK SNAP software (http://www.itksnap.org/pmwiki/pmwiki.php), and after that, ROIs were reviewed and approved by an expert radiologist (ZXL). An example of the manual segmentation is shown in Figure 2.
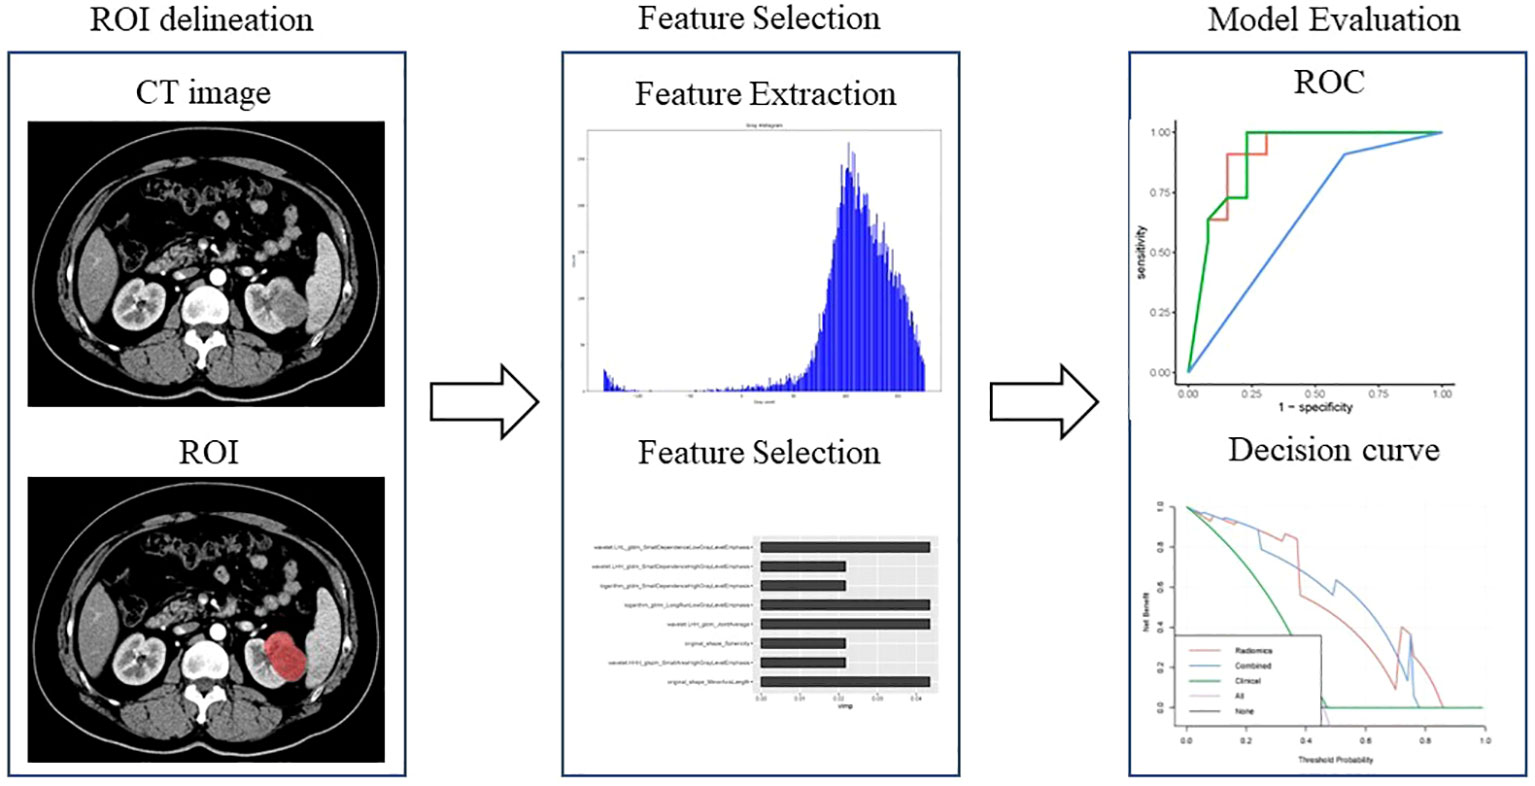
Figure 1 Workflow of the radiomics analysis to differentiate pyelocaliceal upper urinary tract urothelial carcinoma and infiltrative renal cell carcinoma.
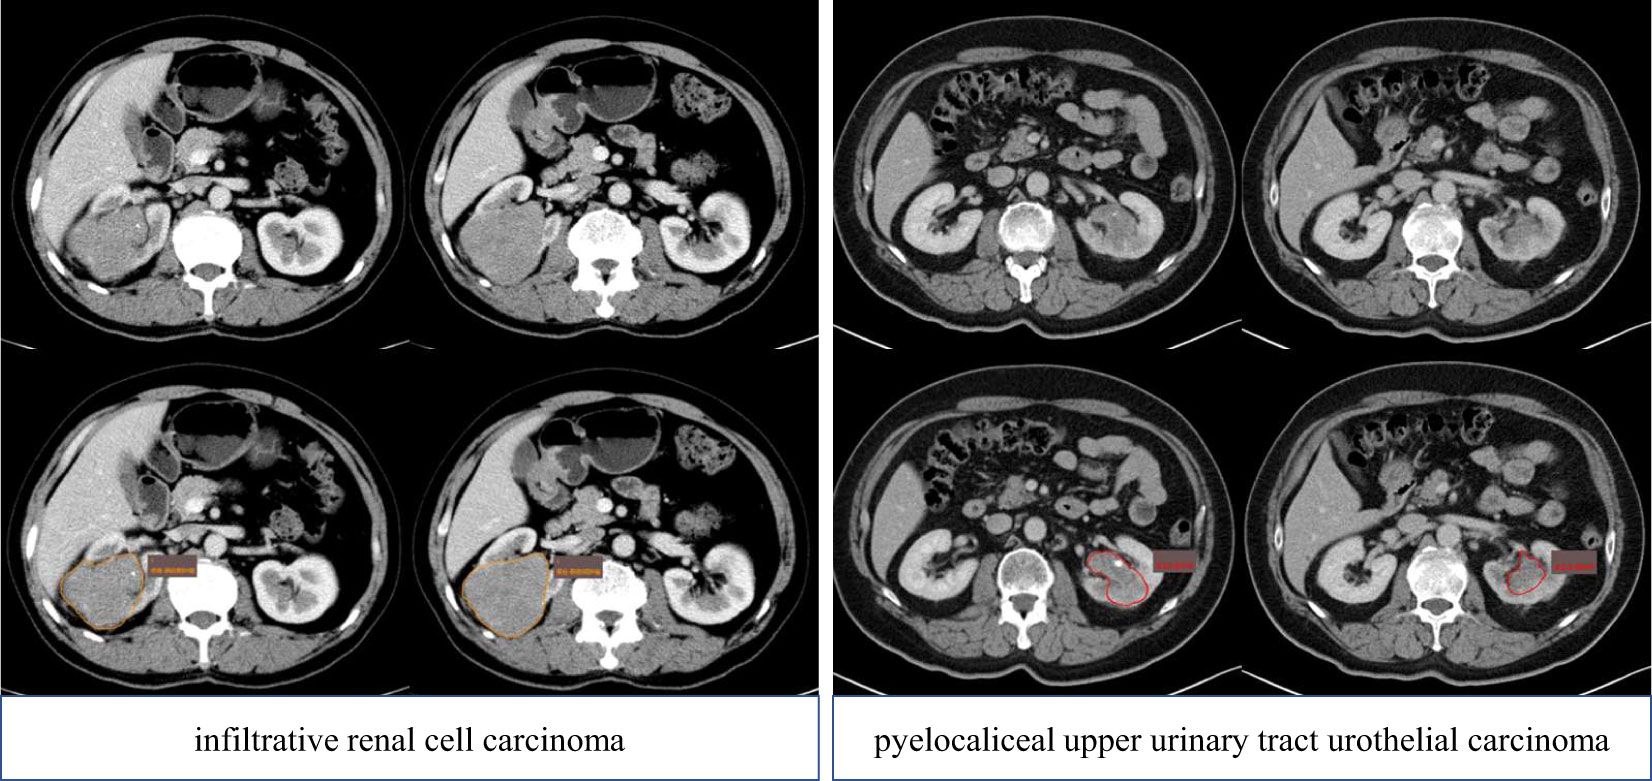
Figure 2 ROI delineation of pyelocaliceal upper urinary tract urothelial carcinoma and infiltrative renal cell carcinoma on the CT (portal phase). ROI, region of interest.
Then, the radiomics features were extracted based on the ROIs of the portal venous CT images. The radiomics features included intensity histogram features, shape and size features, and texture features such as gray-level co-occurrence matrix (GLCM), gray-level run length matrix (GLRLM), gray-level size zone matrix (GLSZM), neighborhood gray-tone difference matrix (NGTDM), and gray-level dependence matrix (GLDM). The definitions and names of the radiomics features were in accordance with the Image Biomarker Standardization Initiative (IBSI).
Although large numbers of features were extracted, not all features were beneficial to differentiating pyelocaliceal UTUC from infiltrative RCC. Therefore, the random forest-based Boruta algorithm was used to determine the features with the highest importance using the R package Boruta (22). Boruta is a random forest-based feature selection method. Boruta employs a recursive approach to disrupt the order of feature variables and assesses the importance of each feature to identify those with the highest relevance (22). Boruta is particularly advantageous for datasets with numerous predictor variables due to its superior computational efficiency (23).
The radiomics model was built based on the features selected by Boruta using the R package randomForestSRC (24). Random forest consistently provides high prediction accuracy and is not prone to overfitting compared to other models. A 10-fold cross-validation on the model was applied to optimize the parameters of the random forest (RF) classifiers. The radiomics score (RF score) was calculated using a formula based on the radiomics features. RF score was used to build the radiomics model.
The combined model was constructed by combining the significant factors of clinical factors and the RF score. The factors with p < 0.05 were considered significant predictors and used for developing the combined model.
Normal continuous variables are expressed as the mean ± standard deviation, whereas non-normal data are expressed as the median and interquartile range. Categorical variables are described as counts (percentages). Comparisons between groups were conducted using the t-test (normal data) or the Mann–Whitney U test (non-parametric data) for continuous variables and the chi-squared test for categorical variables.
The models were constructed using RF based on the feature sets with 10-fold cross-validation. In 10-fold cross-validation, the whole training set was randomly divided into 10 equal-sized subsets. A single subset was retained as the validation dataset, and the remaining four subsets were merged to create the training dataset. The cross-validation process was repeated 10 times, with each of the subsets used once as the validation dataset.
The receiver operating characteristic (ROC) curves and the area under the curve (AUC) value were used to assess the diagnostic efficacies of the three models. Delong’s test was performed to compare the AUCs of each model, and p-value < 0.0167 was considered statistically significant for multiple comparisons according to the Bonferroni correction. The net clinical benefits were assessed using decision curve analysis (DCA). R software (version 4.0.5 http://www.Rproject.org) was used for statistical analysis, and a two-sided p < 0.05 indicated statistical significance.
A total of 80 patients (37 pathologically proven infiltrative RCCs and 43 pathologically proven pyelocaliceal UTUCs) were retrospectively enrolled and randomly divided into the training set (n = 56) and testing set (n = 24) at a ratio of 7:3. The patient demographics and traditional CT imaging characteristics between infiltrative RCCs and pyelocaliceal UTUCs are shown in Table 1. The univariate logistic regression analysis showed that painless hematuria, lesion volume, and intrapulmonary metastases were statistically significantly different between groups (p < 0.05). There was no statistically significant difference in hydronephrosis, stone, tumor calcification, and venous tumor thrombus between infiltrative RCCs and pyelocaliceal UTUCs (p > 0.05). After univariate logistic regression analysis, the features with statistically significant differences (p < 0.05) were applied to construct the multivariate logistic regression analysis. Multivariate analysis showed that painless hematuria was the risk factor for differentiating infiltrative RCCs and pyelocaliceal UTUCs (p < 0.05).
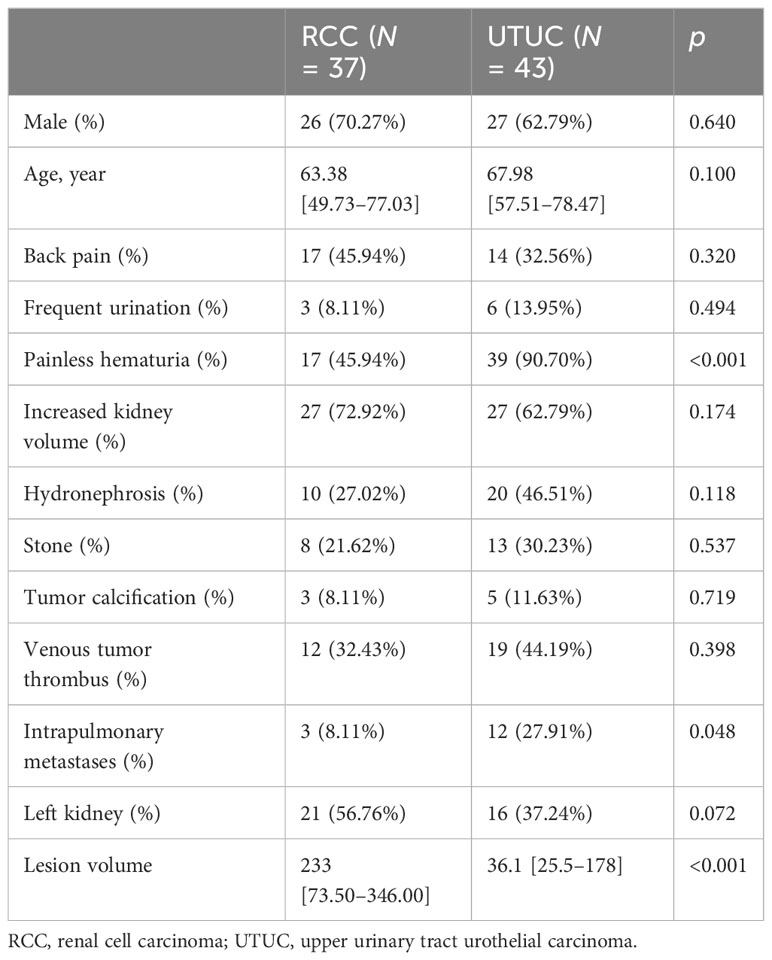
Table 1 Demographics and traditional CT features of the patients.
A total of 1,688 radiomics features were extracted from the portal venous CT images. After the Boruta analysis, eight features were extracted to construct the final model (detailed information on the selected features is shown in Figure 3). Then, RF models were conducted, and the RF scores of the training set and the testing set were calculated. The RF models of the training set and the testing set performed well with AUC values of 0.95 (95%CI: 0.88–1.00) and 0.90 (95%CI: 0.77–1.00), respectively. In addition, the RF score was lower in the pyelocaliceal UTUC groups than in the infiltrative RCC groups, with p < 0.001.
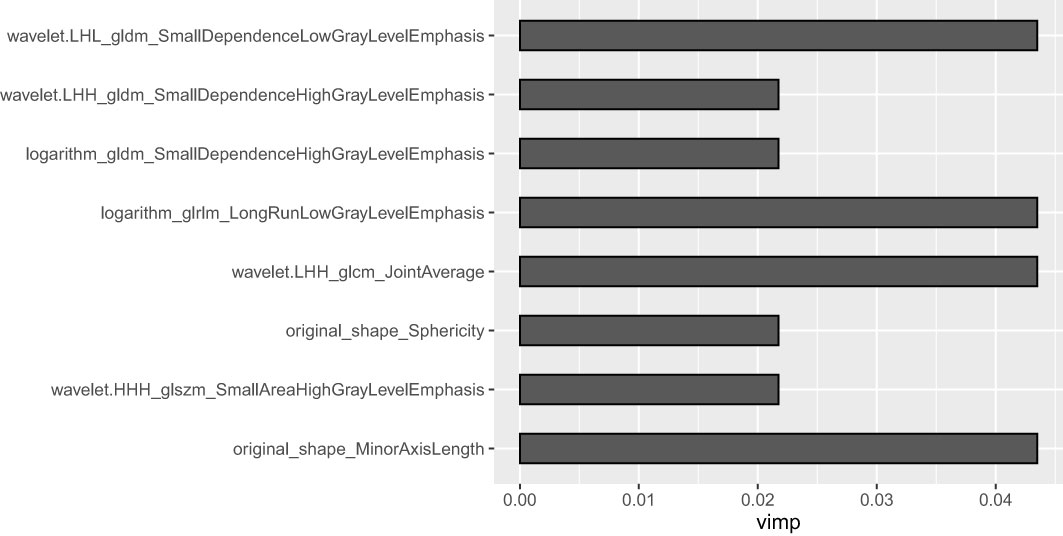
Figure 3 Weights of the eight radiomics features in the radiomics model.
The multivariate logistic regression analysis (as shown in Table 2 and Appendix Table 3) indicated that painless hematuria and RF score are the independent risk factors, and a combined model was constructed based on the two factors. An individualized nomogram that incorporated the two predictive factors based on the combined model in the training cohort was constructed to differentiate infiltrative RCC and pyelocaliceal UTUC, which is shown in Figure 4. Figure 5 shows a typically pyelocaliceal UTUC, which was consistent with the judgment of nomogram and an infiltrative RCC incorrectly identified as pyelocaliceal UTUC by nomogram.
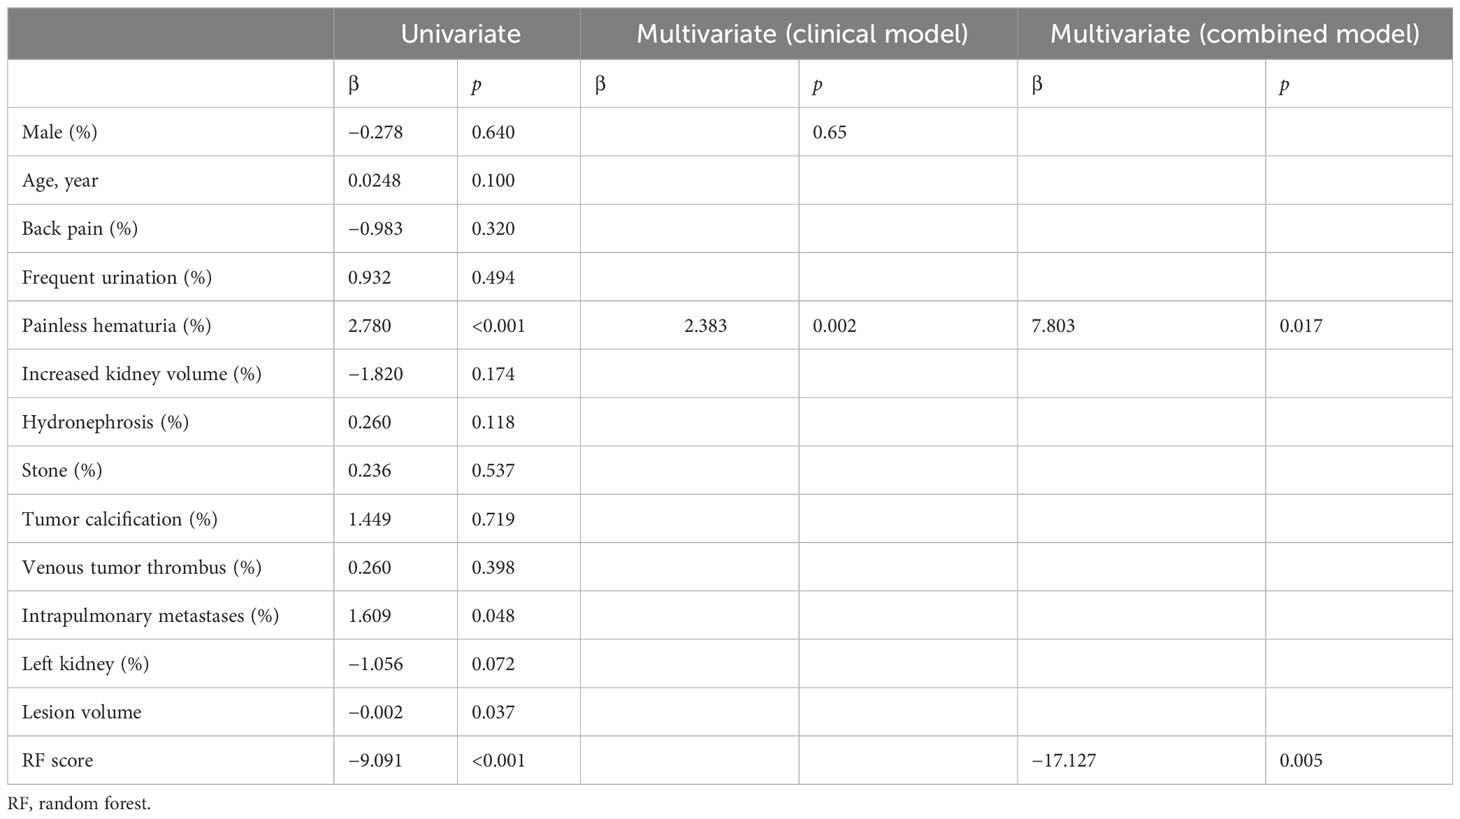
Table 2 The univariate and multivariate logistic regression analyses of the patients.
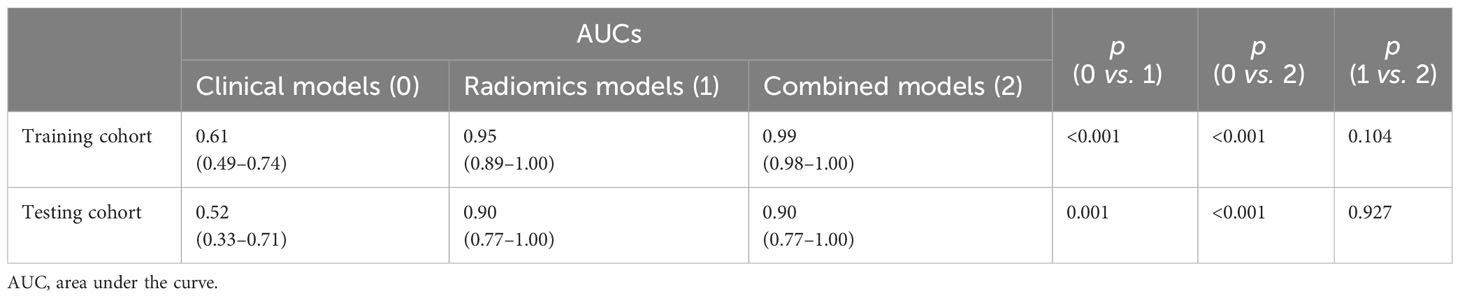
Table 3 Pairwise comparisons of AUCs of the clinical model, radiomics model, and combined model.
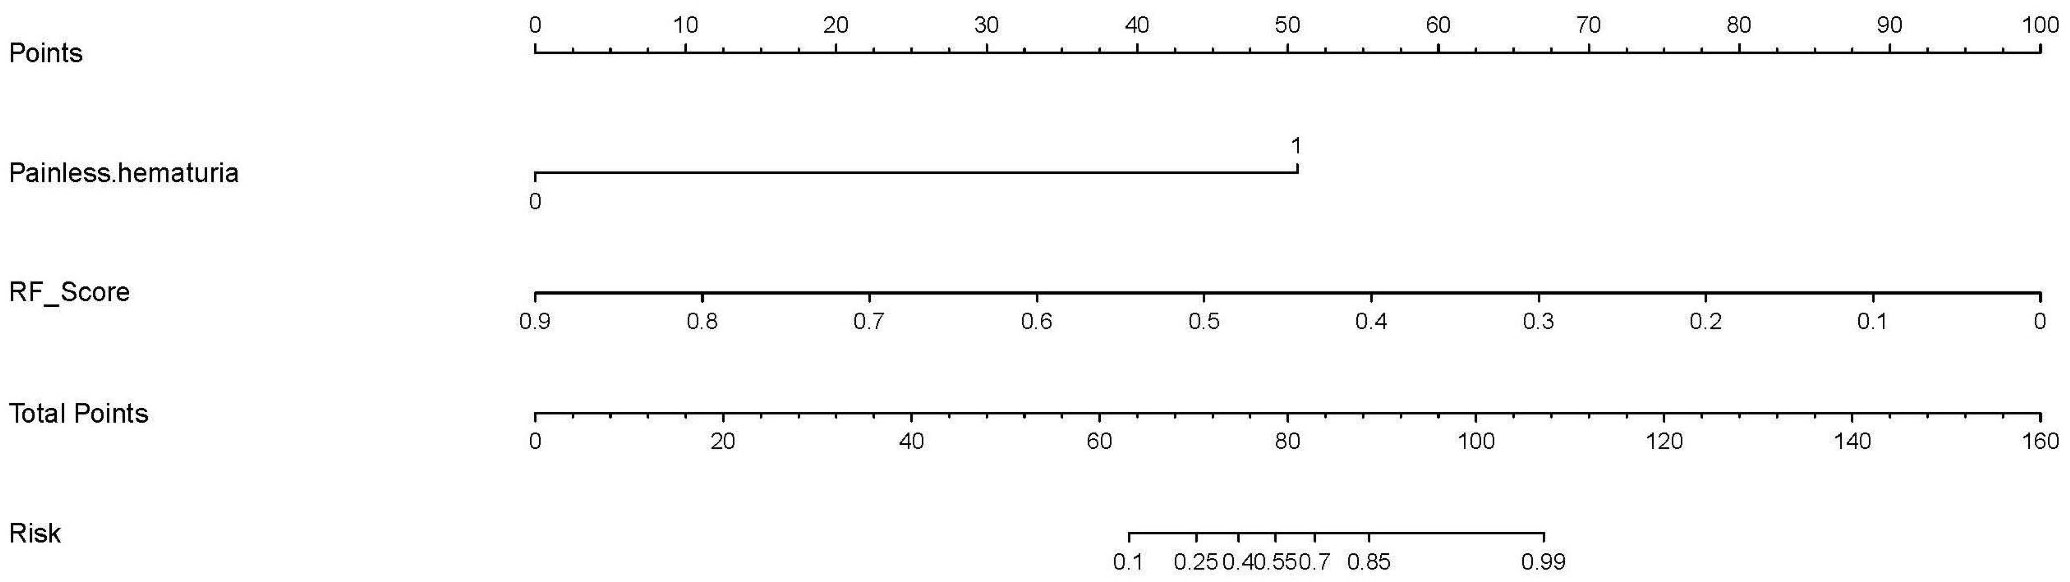
Figure 4 An individualized nomogram based on RF score and clinical features. RF, random forest.
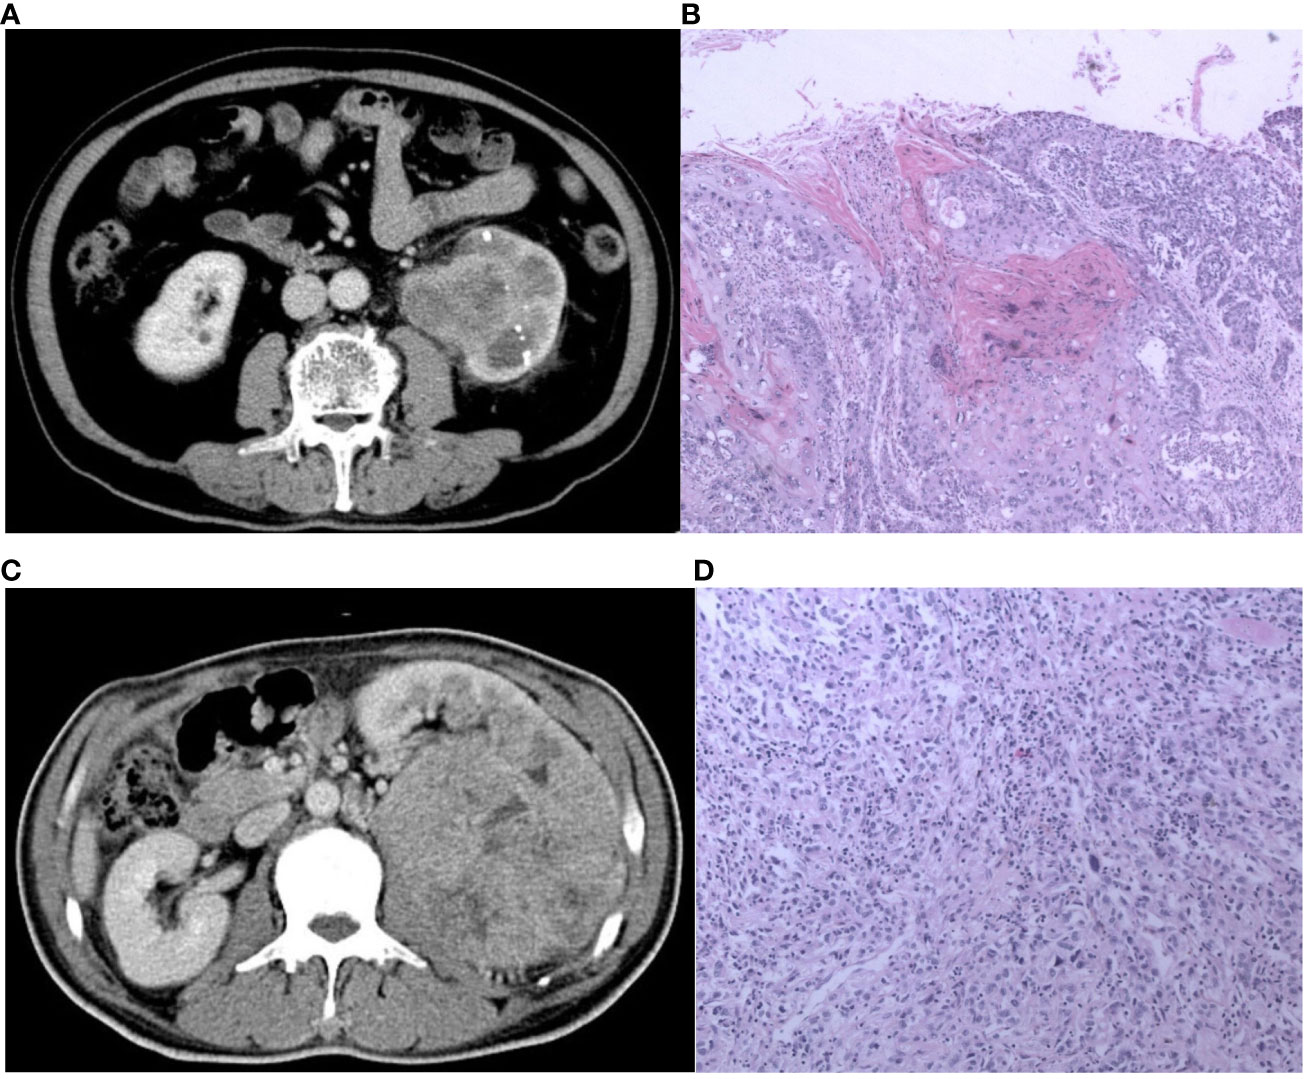
Figure 5 The CT and pathological images of the pyelocaliceal upper urinary tract urothelial carcinoma and infiltrative renal cell carcinoma. (A) A 60-year-old man with left kidney stones, hematuria, and left waist soreness. CT images show enlarged volume of the left kidney, multiple high-density nodular shadows in the parenchyma, and obvious expansion of the left renal pelvis with blurred edges, heterogeneous enhancement, and unclear boundary. (B) Pathological images (H&E, ×100) showed an invasive urothelial carcinoma infiltrating the muscle layer of the renal pelvis and infiltrating the renal parenchyma and finally diagnosed as pyelocaliceal upper urinary tract urothelial carcinoma, which was consistent with the judgment of nomogram. (C) A 56-year-old man with lower back pain and hematuria for more than 3 months. CT image showed a huge soft tissue mass in the left kidney, with heterogeneous enhancement, unclear boundaries, a low-density filling defect in the left renal vein, and an enlarged lymph node in the left retroperitoneum. (D) Pathological images (HE, 100×) showed a transparent cell carcinoma of grade 3 with necrosis, invading the renal capsule, renal pelvis mucosa, and renal sinus fat, and it was finally diagnosed as infiltrative RCC, which was not consistent with the judgment of nomogram.
Pairwise comparisons of the AUCs of the clinical model, radiomics model, and combined model were performed using Delong’s test. As Table 3 shows, in the training cohort, the AUC of the combined model as well as the radiomics model was significantly higher than that of the clinical model (p < 0.001). In the testing cohort, the AUC of the combined model as well as the radiomics model was significantly higher than that of the clinical model (p < 0.001). In the training and testing sets, the AUC of the combined model was slightly higher than that of the radiomics model, although not statistically significant (all p > 0.0167). The ROC curves for the clinical model, radiomics model, and combined model are shown in Figure 6. The decision curves for the three models showed that the net clinical benefit for the combined model as well as the radiomics model was higher than that of the clinical model, which is shown in Figure 7.
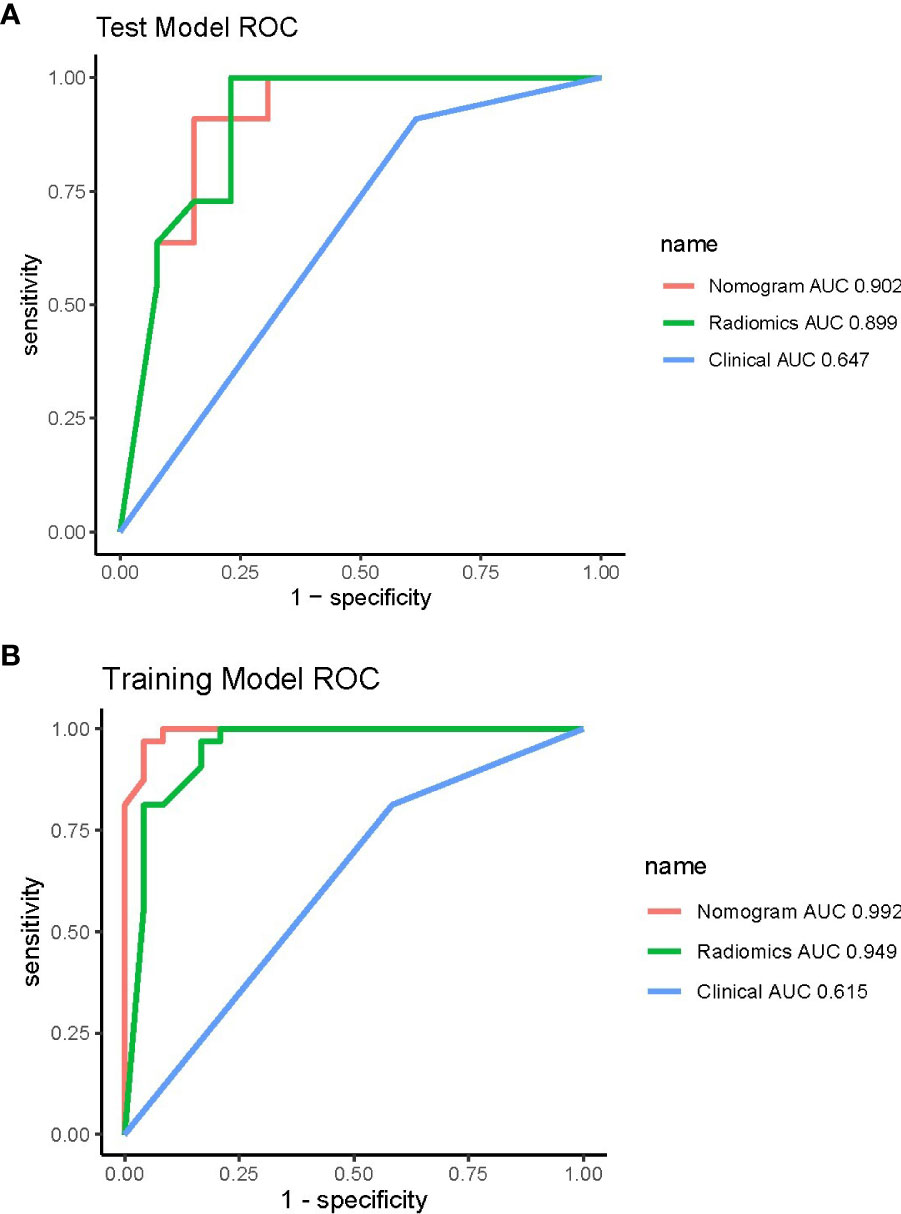
Figure 6 ROC curves of the three models in the training (A) and testing (B) cohorts. ROC, receiver operating characteristic.
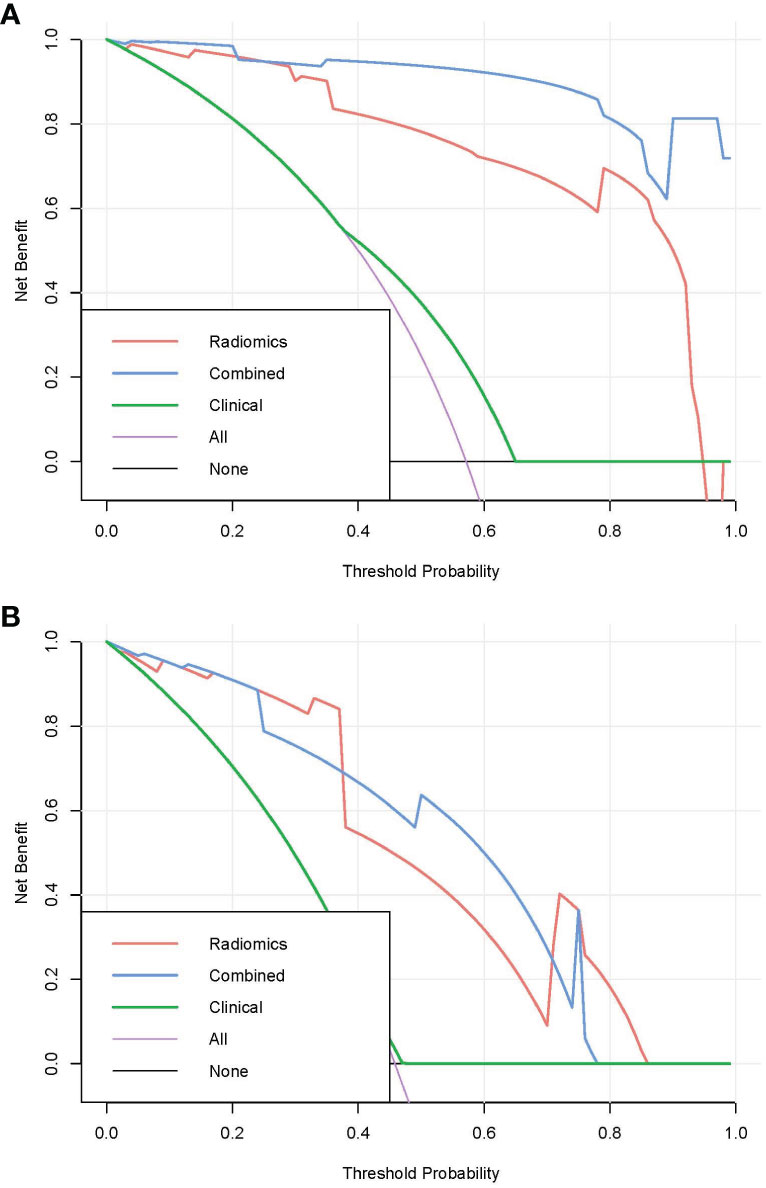
Figure 7 Decision curves for the three models in the training (A) and testing (B) cohorts.
We included the confusion matrix and accuracy of the visual assessments conducted by two radiologists, as well as the machine learning models, in the attached appendix (Tables 1, 2). The results demonstrated that both the radiomics model and the combined model achieved a notable reduction in false-positive and false-negativerates, resulting in significantly higher accuracy compared to the visual assessments in both the training and testing cohorts.
Accurate preoperative determination of infiltrative RCC and pyelocaliceal UTUC plays a crucial role in treatment decisions and follow-up strategies. In this study, we first developed a pretreatment CT-based radiomics model and a combined model to distinguish infiltrative RCC and pyelocaliceal UTUC via contrast-enhanced CT with a satisfactory discriminatory performance. Our results indicated that the combined model performed best for distinguishing these two malignancies.
The univariate logistic regression analysis of traditional features showed that pyelocaliceal UTUC patients were more likely to have painless hematuria and intrapulmonary metastases, which is consistent with previous studies (25). The most classical symptom of pyelocaliceal UTUC is painless hematuria, and pyelocaliceal UTUC patients often exhibit symptoms earlier than RCC patients. Pyelocaliceal UTUCs invade and metastasize more easily because of the thin layer of surrounding ureteral adventitia containing an extensive plexus of blood vessels and lymphatic channels.
The multivariate logistic regression analysis showed that pyelocaliceal UTUC patients were more likely to have painless hematuria and lower RF scores. Pyelocaliceal UTUC patients have lower RF scores, which means that they have lower heterogeneous enhancement. Pyelocaliceal UTUCs have infiltrative hypo-vascular masses coexisting with a filling defect in the adjacent collecting system or amputation of a calix, renal shape preservation, the absence of cystic or necrotic change, homogeneity of the tumor, and extension into the ureteropelvic junction. However, RCCs are soft tissue attenuation and are sometimes accompanied by necrosis and calcification, which have stronger or irregular enhancement during the corticomedullary phase (26, 27).
Although radiomics analysis has already been applied for differentiating renal tumors, previously published studies mostly focused on identifying benign and malignant renal lesions or distinguishing different types of RCCs such as clear cell renal cell carcinoma, renal papillary cell carcinoma, and chromophobe cell renal cell carcinoma (28). We first used radiomics analysis to differentiate clear cell renal cell carcinoma and urothelial carcinomas with good accuracy. In addition, we also compared the accuracy of the combined model and that of two expert radiologists, which showed better performance of the combined model.
Several limitations of our study have to be considered. The study was a retrospective data analysis; therefore, the quality of CT imaging in some cases may not be so satisfactory, and bias produced among different CT machines was hard to control. Our study merely investigated the portal venous phase CT images to develop a radiomics signature. Radiomics features extracted from non-enhanced CT images as well as arterial and venous phase images could provide additional information for better discriminatory performance. In addition, image preprocessing such as resampling was not performed in this study, which may limit the reproducibility of our findings.
The RF radiomics model and combined model can improve the accuracy of differentiating pyelocaliceal upper urinary tract urothelial carcinoma, which invades the renal parenchyma from infiltrative renal cell carcinoma, and provide a new potentially non-invasive method to guide surgery strategies.
The original contributions presented in the study are included in the article/Supplementary Material. Further inquiries can be directed to the corresponding author.
Ethical approval was not required for the study involving humans in accordance with the local legislation and institutional requirements.
XZ was responsible for clinical data collection and final ROI auditing. PS was responsible for drawing ROI, writing the article. SW was responsible for reviewing the article. XY and WS were responsible for radiomics analysis. XLi was responsible for pathological analysis. XLiu, TT and BZ were responsible for drawing ROI. All authors contributed to the article and approved the submitted version.
The author(s) declare that no financial support was received for the research, authorship, and/or publication of this article.
Author XY was employed by the company Siemens Healthineers Ltd. Author WS was employed by the company Huiying Medical Technology Beijing Co., Ltd.
The remaining authors declare that the research was conducted in the absence of any commercial or financial relationships that could be construed as a potential conflict of interest.
All claims expressed in this article are solely those of the authors and do not necessarily represent those of their affiliated organizations, or those of the publisher, the editors and the reviewers. Any product that may be evaluated in this article, or claim that may be made by its manufacturer, is not guaranteed or endorsed by the publisher.
The Supplementary Material for this article can be found online at: https://www.frontiersin.org/articles/10.3389/fonc.2023.1244585/full#supplementary-material
1. Benichou J, Chow WH, McLaughlin JK, Mandel JS, Fraumeni JF. Population attributable risk of renal cell cancer in Minnesota. Am J Epidemiol (1998) 148(5):424–30. doi: 10.1093/oxfordjournals.aje.a009667
2. Rouprêt M, Seisen T, Birtle AJ, Capoun O, Compérat EM, Dominguez-Escrig JoséL, et al. European association of urology guidelines on upper urinary tract urothelial carcinoma: 2023 update. Eur Urol (2023) 84(1):49–64. doi: 10.1016/j.eururo.2023.03.013
3. Palacios DA, Campbell R, Wang Y, Tanaka H, Ding X, Ye Y-L, et al. Infiltrative renal masses: clinical challenges. Urology (2020) 145:3–8. doi: 10.1016/j.urology.2020.06.038
4. Ding X, Ma X, Jia Y, Li H, Wang Y. Intrarenal urothelial cancers confused as infiltrative renal masses: Report of 22 cases and literature review. Oncol Lett (2018) 16(2):1912–6. doi: 10.3892/ol.2018.8867
5. Pickhardt PJ, Lonergan GJ, Davis CJ, Kashitani N, Wagner BJ. From the archives of the AFIP. Infiltrative renal lesions: radiologic-pathologic correlation. Armed Forces Institute of Pathology. Radiographics: Rev Publ Radiological Soc North America Inc (2000) 20(1):215–43. doi: 10.1148/radiographics.20.1.g00ja08215
6. Ljungberg Börje, Albiges L, Abu-Ghanem Y, Bedke J, Capitanio U, Dabestani S, et al. European association of urology guidelines on renal cell carcinoma: the 2022 update. Eur Urol (2022) 82(4):399–410. doi: 10.1016/j.eururo.2022.03.006
7. Sweet DE, Ward RD, Wang Y, Tanaka H, Campbell SC, Remer EM. Infiltrative renal Malignancies: imaging features, prognostic implications, and mimics. Radiographics: Rev Publ Radiological Soc North America Inc (2021) 41(2):487–508. doi: 10.1148/rg.2021200123
8. Veeratterapillay R, Ijabla R, Conaway D, Haslam P, Soomro N, Heer R. Contrast-enhanced CT in 100 clear cell renal cell cancers - an analysis of enhancement, tumour size, and survival. Clin Radiol (2015) 70(12):1357–61. doi: 10.1016/j.crad.2015.07.006
9. Park HJ, Kim HJ, Park SHo, Lee JS, Kim AhY, Ha HK. Gastrointestinal involvement of recurrent renal cell carcinoma: CT findings and clinicopathologic features. Korean J Radiol (2017) 18(3):452–60. doi: 10.3348/kjr.2017.18.3.452
10. Ren An, Cai F, Shang Y-N, Ma E-S, Huang Z-G, Wang Wu, et al. Differentiation of renal oncocytoma and renal clear cell carcinoma using relative CT enhancement ratio. Chin Med J (2015) 128(2):175–9. doi: 10.4103/0366-6999.149190
11. Ertekin E, Amasyalı AkınS, Erol B, Acikgozoglu S, Kucukdurmaz F, Nayman A, et al. Role of contrast enhancement and corrected attenuation values of renal tumors in predicting renal cell carcinoma (RCC) subtypes: protocol for a triphasic multi-slice computed tomography (CT) procedure. Polish J Radiol (2017) 82:384–91. doi: 10.12659/PJR.901957
12. Hagen F, Peisen F, Spogis J, Mair A, Nikolaou K, Stenzl A, et al. Is a single portal venous phase in contrast-enhanced CT sufficient to detect metastases or recurrence in clear cell renal cell carcinoma? - a single-center retrospective study. Cancer imaging: Off Publ Int Cancer Imaging Soc (2022) 22(1):9. doi: 10.1186/s40644-022-00444-8
13. Raza SA, Sohaib SA, Sahdev A, Bharwani N, Heenan S, Verma H, et al. Centrally infiltrating renal masses on CT: differentiating intrarenal transitional cell carcinoma from centrally located renal cell carcinoma. AJR. Am J roentgenology (2012) 198(4):846–53. doi: 10.2214/AJR.11.7376
14. Fritz GA, Schoellnast H, Deutschmann HA, Quehenberger F, Tillich M. Multiphasic multidetector-row CT (MDCT) in detection and staging of transitional cell carcinomas of the upper urinary tract. Eur Radiol (2006) 16(6):1244–52. doi: 10.1007/s00330-005-0078-0
15. Tsili AC, Argyropoulou MI, Gousia A, Kalef-Ezra J, Sofikitis N, Malamou-Mitsi V, et al. Renal cell carcinoma: value of multiphase MDCT with multiplanar reformations in the detection of pseudocapsule. AJR. Am J roentgenology (2012) 199(2):379–86. doi: 10.2214/AJR.11.7747
16. Sauk SC, Hsu MS, Margolis DJA, Lu DSK, Rao NP, Belldegrun AS, et al. Clear cell renal cell carcinoma: multiphasic multidetector CT imaging features help predict genetic karyotypes. Radiology (2011) 261(3):854–62. doi: 10.1148/radiol.11101508
17. Wehrli NE, Kim MJu, Matza BW, Melamed J, Taneja SS, Rosenkrantz AB. Utility of MRI features in differentiation of central renal cell carcinoma and renal pelvic urothelial carcinoma. AJR. Am J roentgenology (2013) 201(6):1260–7. doi: 10.2214/AJR.13.10673
18. Dursun M, Ozbek E, Otunctemur A, Besiroglu H. Differentiating renal pelvic cancer from renal cell carcinoma with 18-fluorodeoxyglucose positron emission tomography-computed tomography. J Cancer Res Ther (2021) 17(4):901–5. doi: 10.4103/jcrt.JCRT_217_16
19. Lambin P, Leijenaar RTH, Deist TM, Peerlings J, Jong EECde, Timmeren Jv, et al. Radiomics: the bridge between medical imaging and personalized medicine. Nature reviews. Clin Oncol (2017) 14(12):749–62. doi: 10.1038/nrclinonc.2017.141
20. Gillies RJ, Kinahan PE, Hricak H. Radiomics: images are more than pictures, they are data. Radiology (2016) 278(2):563–77. doi: 10.1148/radiol.2015151169
21. Griethuysen JJMv, Fedorov A, Parmar C, Hosny A, Aucoin N, Narayan V, et al. Computational radiomics system to decode the radiographic phenotype. Cancer Res (2017) 77(21):e104–7. doi: 10.1158/0008-5472.CAN-17-0339
22. Kursa MB, Rudnicki WR. Feature selection with the boruta package. J Stat Softw (2010) 36:1–13. doi: 10.18637/jss.v036.i11
23. Speiser JL, Miller ME, Tooze J, Ip E. A comparison of random forest variable selection methods for classification prediction modeling. Expert Syst Appl (2019) 134:93–101. doi: 10.1016/j.eswa.2019.05.028
24. Ishwaran H, Kogalur U. Fast unified Random Forests for Survival, Regression, and Classification (RF-SRC). R Package Version (2014). Available at: https://cran.r-project.org/package=randomForestSRC.
25. Zhang X, Zhu Z, Zhong S, Xu T, Shen Z. Ureteral tumours showing a worse prognosis than renal pelvis tumours may be attributed to ureteral tumours more likely to have hydronephrosis and less likely to have haematuria. World J Urol (2013) 31(1):155–60. doi: 10.1007/s00345-012-0885-2
26. Elkassem AMA, Lo SS, Gunn AJ, Shuch BM, Dewitt-Foy ME, Abouassaly R, et al. Role of imaging in renal cell carcinoma: A multidisciplinary perspective. Radiographics: Rev Publ Radiological Soc North America Inc (2021) 41(5):1387–407. doi: 10.1148/rg.2021200202
27. Elkassem AA, Allen BC, Sharbidre KG, Rais-Bahrami S, Smith AD. Update on the role of imaging in clinical staging and restaging of renal cell carcinoma based on the AJCC 8th edition, from the AJR special series on cancer staging. AJR. Am J roentgenology (2021) 217(3):541–55. doi: 10.2214/AJR.21.25493
28. Budai BK, Stollmayer Róbert, Rónaszéki AladárDávid, Körmendy Borbála, Zsombor Z, Palotás Lõrinc, et al. Radiomics analysis of contrast-enhanced CT scans can distinguish between clear cell and non-clear cell renal cell carcinoma in different imaging protocols. Front Med (2022) 9:974485. doi: 10.3389/fmed.2022.974485
Keywords: infiltrative renal cell cancer, pyelocaliceal upper urinary tract urothelial carcinoma, enhanced CT, differentiation, radiomics
Citation: Zhai X, Sun P, Yu X, Wang S, Li X, Sun W, Liu X, Tian T and Zhang B (2024) CT−based radiomics signature for differentiating pyelocaliceal upper urinary tract urothelial carcinoma from infiltrative renal cell carcinoma. Front. Oncol. 13:1244585. doi: 10.3389/fonc.2023.1244585
Received: 22 June 2023; Accepted: 22 December 2023;
Published: 18 January 2024.
Edited by:
Eros Montin, New York University, United StatesReviewed by:
Hector Lise De Moura, New York University, United StatesCopyright © 2024 Zhai, Sun, Yu, Wang, Li, Sun, Liu, Tian and Zhang. This is an open-access article distributed under the terms of the Creative Commons Attribution License (CC BY). The use, distribution or reproduction in other forums is permitted, provided the original author(s) and the copyright owner(s) are credited and that the original publication in this journal is cited, in accordance with accepted academic practice. No use, distribution or reproduction is permitted which does not comply with these terms.
*Correspondence: Penghui Sun, c3VucGgxOTk2MjRAMTYzLmNvbQ==
†These authors have contributed equally to this work and share first authorship
Disclaimer: All claims expressed in this article are solely those of the authors and do not necessarily represent those of their affiliated organizations, or those of the publisher, the editors and the reviewers. Any product that may be evaluated in this article or claim that may be made by its manufacturer is not guaranteed or endorsed by the publisher.
Research integrity at Frontiers
Learn more about the work of our research integrity team to safeguard the quality of each article we publish.