 Jianguo Yang
 Qican Deng
 Zhenzhou Chen
 Zhongxue Fu
- Department of Gastrointestinal Surgery, The First Affiliated Hospital of Chongqing Medical University, Chongqing, China
Aim: To investigate whether body composition parameters combined with systemic inflammatory markers and magnetic resonance imaging (MRI) can predict the pathological complete response (pCR) following neoadjuvant chemoradiotherapy (NCRT) in locally advanced rectal cancer (LARC).
Methods: A retrospective analysis of data on LARC patients treated with NCTR and radical surgery between January 2013 and May 2023 was performed. Body composition parameters were assessed by measuring the skeletal muscle index (SMI), subcutaneous adipose index (SAI), and visceral adipose index (VAI) at the third lumbar vertebra level by computed tomography (CT). Inflammatory markers such as neutrophil to lymphocyte ratio (NLR) were obtained from laboratory tests performed prior to NCRT. MRI was conducted to evaluate MRI tumor regression grading (mrTRG). Logistic regression analyses were employed to identify factors affecting the pCR. The risk score of pCR was computed by a nomogram. The discrimination of the nomogram was determined using C-index and calibration curve.
Results: Two hundred and ninety-one patients with LARC were enrolled in the study, 55 (18.9%) of whom achieved pCR after NCRT. Multivariate analysis suggested that pre-NCRT NLR≥2.6 (OR=0.378, 95% CI 0.164-0.868, P=0.022), mrTRG 3-5 (OR=0.256, 95%CI 0.121-0.54, P<0.001), and pre-NCRT L-SMI (OR=0.292, 95% CI 0.097-0.883, P=0.029) were independent risk factors for pCR. ROC curves analysis demonstrated that the performance of mrTRG combined with pre-NCRT NLR and pre-NCRT L-SMI in predicting pCR was significantly improved compared with mrTRG alone (AUC: 0.763 vs. 0.667). Additionally, mrTRG 3-5 (OR=0.375, 95% CI 0.219-0.641, P<0.001) was also an independent predictor for poor tumor regression.
Conclusion: The pathological complete response of neoadjuvant chemoradiotherapy in locally advanced rectal cancer can be effectively predicted by combining the body composition parameters with blood biomarkers and magnetic resonance imaging.
Introduction
The statistics for cancer in 2022 have shown that colorectal cancer (CRC) has the third incidence and second highest mortality rate of all cancers, and its occurrence is rapidly increasing (1). Rectal cancer represents approximately 30% of all CRCs, with most being diagnosed at an already locally advanced stage (2). The standard treatment strategy for locally advanced rectal cancer (LARC) continues to be neoadjuvant chemoradiotherapy (NCRT) in combination with total mesorectal resection (TME) (3, 4). NCRT has been found to significantly improve local control of tumors, R0 resection, and sphincter-preservation rate (5). However, there are significant differences in individualized treatment responses to NCRT in LARC. Although the majority of LARC patients exhibit a pathological tumor regression response after NCRT, only 10%-30% of LARC patients achieve pathological complete response (pCR) (6). Given that tumor regression response after NCRT is closely related to the oncological outcome of patients (7, 8), predicting pCR plays a crucial role in treating LARC.
Body composition and obesity were linked with the occurrence and prognosis of cancer. Obesity was a high-risk factor for developing CRC, as well as the potential risk factor for drug resistance and oncological prognosis (9, 10). LARC patients with obesity have lower pCR and sphincter-preservation rates, and higher postoperative complications (11). Skeletal muscle, subcutaneous adipose, and visceral adipose are important components of the body, and CT has become a popular tool for assessing body composition (12). Compared to body mass index (BMI), body composition parameters are more precise in reflecting the skeletal muscle and adipose status of patients with rectal cancer (13). Low skeletal muscle has been proven to predict poor short-term and long-term clinical outcomes in patients with CRC, gastric cancer, liver cancer, bile duct cancer, and pancreatic cancer (14, 15). Low skeletal muscle also contributes to adverse effects and decreased sensitivity of LARC patients to NCRT (16). Subcutaneous adipose and visceral adipose are also important parameters that reflect the function of the body. High subcutaneous adipose and visceral adipose were independent factors influencing the tumor regression grade (TRG), postoperative complications, and recurrence in LARC (17, 18). Several meta-analyses have shown that CT-based adiposity parameters are better predictors of short-term and long-term oncological outcomes in renal clear cell carcinoma, pancreatic cancer, and gastric cancer (19–23).
Cancer-related systemic inflammation is also connected to the development, treatment sensitivity, and prognosis of many cancers, including colorectal, gastric, prostate, and breast cancers (24). The neutrophil-to-lymphocyte ratio (NLR), monocyte-to-lymphocyte ratio (MLR), systemic immune-inflammatory index (SII), and platelet-to-lymphocyte ratio (PLR) are commonly used blood markers of systemic inflammation (24). Studies have revealed that systemic inflammatory markers are not only important predictors of pathological response to NCRT in LARC but are also influential factors of disease-free survival (DFS) and overall survival (OS) (24–26).
Magnetic resonance imaging (MRI) is widely performed for pre-treatment staging and assessment of tumor regression of rectal cancer. In particular, diffusion-weighted imaging (DWI) further effectively differentiates the residual tumor cells and the level of fibrosis in the treated area after NCRT (27). A previous study revealed that MRI tumor regression grade (mrTRG) was an independent predictor of pCR, with an AUC value of 0.721. In addition, mrTRG combined with NLR, LMR, and carcinoembryonic antigen (CEA) had a significantly higher performance in predicting pCR (AUC=0.913) (28). To date, there has been a lack of research investigating the combination of body composition parameters, mrTRG, and inflammatory markers for the purpose of predicting pCR after NCRT in patients with LARC.
Consequently, the aim of this study was to assess the potential of combining body composition parameters, systemic inflammatory markers, and mrTRG as a predictive tool for pCR following NCRT in LARC patients.
Materials and methods
Patients
We retrospectively analyzed data from 291 patients with LARC who underwent NCTR and radial surgery at The First Hospital of Chongqing Medical University between January 2013 and May 2023. The inclusion criteria were as follows: (1) age >18 years; (2) adenocarcinoma; (3) the distance tumor from the anus <12 cm; (4) clinical T3-4 or N+ and no distant metastasis; (5) completion of NCRT and radical surgery; (6) completion of imaging (CT and MRI) and laboratory tests before NCRT and surgery. The exclusion criteria were as follows: (1) incomplete clinical data; (2) history of other malignancies; (3) recurrent rectal cancer; (4) history of pelvic radiotherapy; (5) combination with acute or chronic infections, and hematologic diseases. This study was reviewed and approved by the Ethics Committee of the First Affiliated Hospital of Chongqing Medical University and was implemented in accordance with the Helsinki Declaration. Since this study was retrospective, written informed consent was exempted.
Neoadjuvant therapy
The treatment regimens for patients with LARC were developed by a multidisciplinary team (MDT). The radiotherapy regimens included long-course radiotherapy and short-course radiotherapy. Long-course radiotherapy was administered as 45-50Gy in 25 fractions with concurrent oral capecitabine 825 mg/m2 twice a day during radiotherapy. Short-course radiotherapy was administered as 25Gy in 5 fractions with concurrent oral capecitabine 825 mg/m2 twice a day during radiotherapy. After completion of radiotherapy, 1-3 cycles of consolidation chemotherapy were administered. The consolidation chemotherapy regimens were XELOX (Oxaliplatin 130 mg/m2, D1, Capecitabine 1000 mg/m2 twice daily, D1-D14) and XELIRI (Irinotecan 200 mg/m2, D1, Capecitabine 1000 mg/m2 twice daily, D1-D14). All patients underwent surgery according to TME principles after completion of NCRT. The tumor regression was evaluated according to the American Joint Committee on Cancer (AJCC) 8th edition classification criteria [28]. The pathological TRG (pTRG) 0-1 was defined as tumor regression (TR), while pTRG 2-3 is defined as non-tumor regression (non-TR). pCR was defined as the absence of residual tumor cells in the specimen and lymph nodes (T0N0M0).
Body composition
All patients performed abdominal CT within 2 weeks before NCRT and surgery. Two researchers applied SliceOmatic version 5.0 (TomoVision) software to measure skeletal muscle area, subcutaneous adipose area, and visceral adipose area on CT images of cross-sections of the lumbar 3 vertebrae (L3). The Hounsfield Units (HU) range of measured tissues was as follows: skeletal muscle (-29-150 HU), visceral adipose tissue (-15-50 HU), and subcutaneous adipose tissue (-190-30 HU) (Figure 1) (29). The body composition area was normalized by the square of the patient’s height. We finally obtained the skeletal muscle area index (SMI), subcutaneous adipose area index (SAI), and visceral adipose area index (VAI). The change in body composition was presented as (post-NCRT-pre-NCRT)/pre-NCRT×100. The low SMI (L-SMI) was defined as the lowest sex-specific quartile cutoff value. The high SAI (H-SAI) and high VAI (H-VAI) were defined as the highest sex-specific quartile cutoff value (16). Therefore, the cut-off values for L-SMI, H-SAI, and H-VAI were 43 cm2/m2, 43.18 cm2/m2, and 59.07 cm2/m2 for males and 36.77 cm2/m2, 79.75 cm2/m2, and 49.23 cm2/m2 for females, respectively.
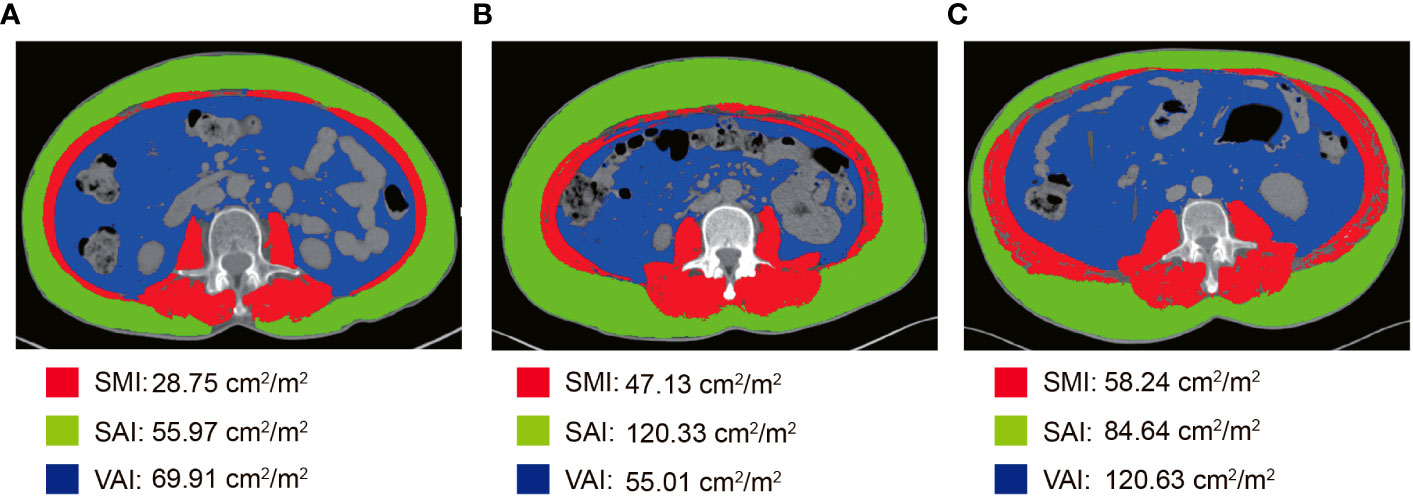
Figure 1 Body composition measurement based on CT images at the level of the third lumbar spine. (A) L-SMI; (B) H-SAI; (C) H-VAI.
Baseline hematological variables
The blood routine tests, blood biochemistry, CEA, and carbohydrate antigen 19-9 (CA19-9) were performed 1 week before NCRT. NLR = neutrophil count/lymphocyte count; PLR = platelet count/lymphocyte count; SII = (platelet count × neutrophil count)/lymphocyte count. We defined the cut-off values of NLR, PLR, and SII to maximize the discriminant power between the pCR group and the non-pCR group. Thus, the cut-off values of NLR, PLR, and SII were 2.6, 168.45, and 714.65, respectively (Supplementary Figure 1).
MRI assessment of tumor regression response
The rectal high-resolution MRI was conducted within 2 weeks before NCRT and surgery. The T-stage, N-stage, tumor size, distance from the anal verge, circumferential resection margin, and extra-mural vascular invasion of rectal cancer were assessed by MRI before NCRT. The T-stage, N-stage, circumferential resection margin, extra-mural vascular invasion, and TRG of rectal cancer were assessed by MRI before surgery. Mandard TRG was used to assess MRI tumor regression response after NCRT (28). mrTRG 1-2 was defined as a good response; mrTRG 3-5 was defined as a poor response. MRI parameters were evaluated by two experienced radiologists.
Statistical analysis
The primary endpoint of the study was pCR and the secondary endpoint was pTRG. The χ2 test or Fisher’s test was used for the analysis of categorical variables. Normally distributed continuous variables were expressed as mean ± standard deviation, and non-normally distributed continuous variables were expressed as median (interquartile range, IQR). The differences between the two samples of continuous variables were analyzed by Student’s t-test or Mann-Whitney U test. The Spearman correlation test was performed to compare the relationship between BMI, SMI, SAI, and VAI. Logistic regression was performed to univariate and multivariate analyses. Variables with p<0.10 in the univariate analysis were included in the multivariate analysis. The Receiver Operating Curve (ROC) was applied to predict the cut-off values of NLR, PLR, and SII. The nomogram graphs of predicting pCR were built according to the multivariate analysis. The internal validation and area under the curves (AUC) were performed to evaluate the performance of the nomogram graphs, and the C-index was used to test the discriminatory power of the nomogram graphs. P < 0.05 was considered statistically significant. SPSS 25, R version 4.1.3, and GraphPad 8 were conducted for statistical analysis.
Results
Basic characteristics of patients
A total of 291 LARC patients (95 female and 196 male) with a median age of 58 years fulfilled the inclusion criteria. Pre-NCRT CEA was elevated in 145 (53.26%) patients. The median of pre-NCRT NLR, PLR, and SII was 2.5 (range, 1.85-3.35), 154.07 (range, 116.91-211.48), and 574.4 (range, 389.21-870), respectively. The median of SMI, SAI, and VAI before NCRT were 45.51 cm2/m2 (range, 40.07-51.5), 36.72 cm2/m2 (range, 26.87-52.51), and 36.64 cm2/m2 (range, 19.92-55.99), respectively. Two hundred and twenty-seven (78.01%) patients with LARC suffered from long-course radiotherapy. The median interval between completion of radiotherapy and surgery was 11 weeks (range, 9-13). Anterior resection was performed in 188 patients. 55 (18.9%) patients achieved pCR after NCRT. Anastomotic leakage occurred in 27 (14.36%) patients who underwent the anterior resection procedure. Eleven (3.78%) patients underwent reoperation due to postoperative complications. Details regarding the baseline characteristics of the patients are shown in Table 1.
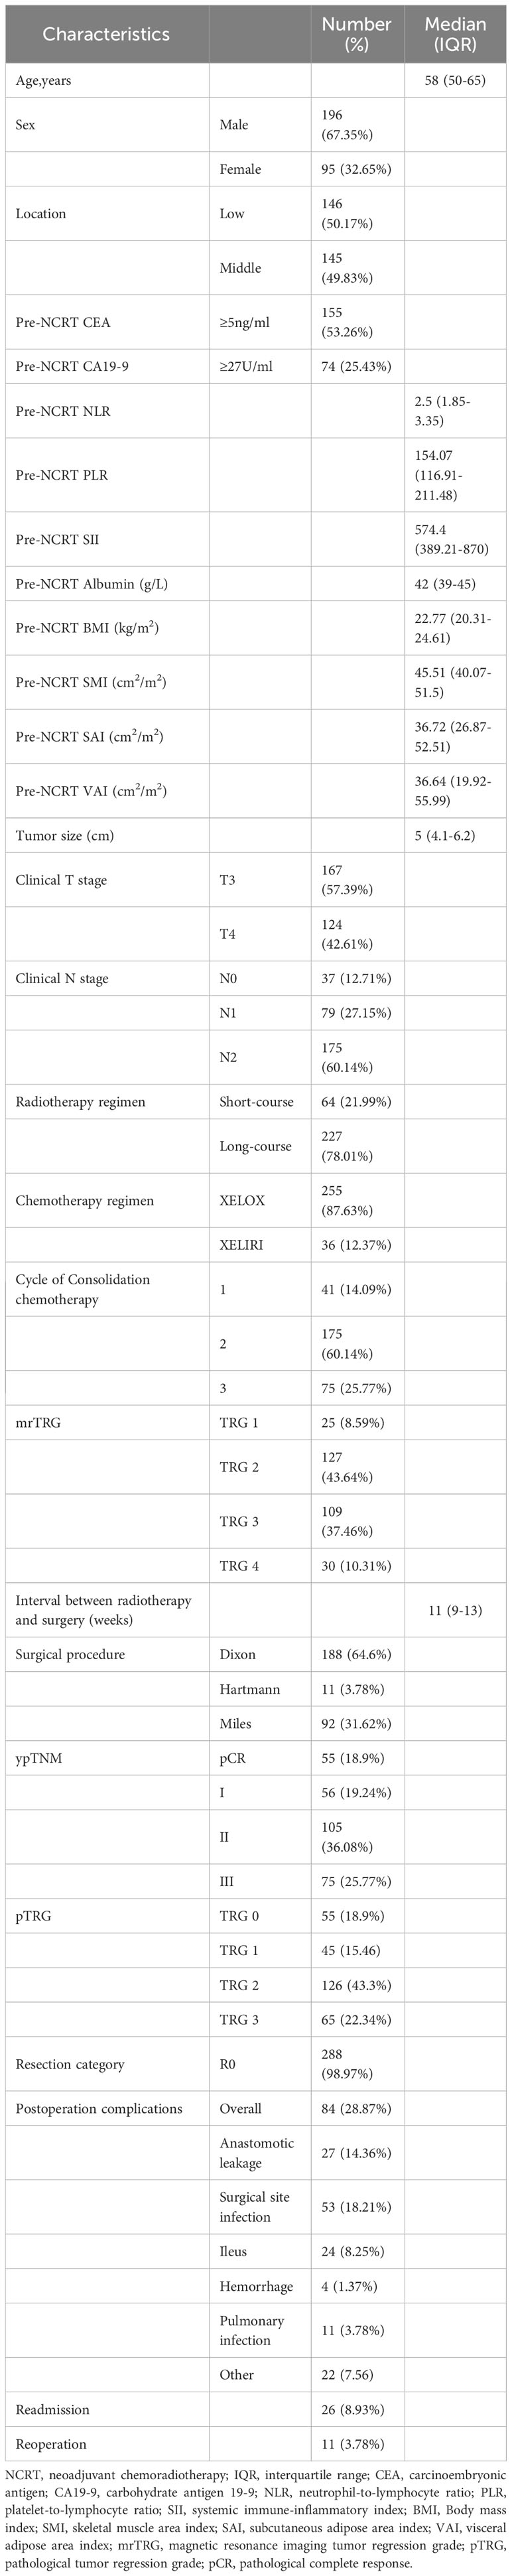
Table 1 The baseline characteristics.
Changes in BMI and body composition parameters after NCRT
Correlations between body composition parameters (SMI, SAI, and VAI) and BMI before and after NCRT were analyzed using Spearman correlation coefficients. The results showed that BMI was positively correlated with SMI, SAI, and VAI (SMI: r=0.52, P<0.001; SAI: r=0.53, p<0.001; VAI: r=0.67, P<0.001) before NCRT. There was no significant correlation between pre-NCRT VAI and SMI (r=0.02, P=0.76). The correlation between BMI, SMI, SAI, and VAI was not altered by NCRT (Figure 2). The median of BMI, SMI, SAI, and VAI before NCRT were 22.77 kg/m2, 45.51 cm2/m2, 36.72 cm2/m2, and 36.64 cm2/m2, respectively. The median of BMI, SMI, SAI, and VAI after NCRT were 22.58 kg/m2, 44.78 cm2/m2, 37.28 cm2/m2, and 36.06 cm2/m2, respectively. Overall, BMI and body composition parameters decreased in patients with LARC after NCRT. The post-NCRT BMI and SMI were significantly lower than pre-NCRT (P=0.015; P=0.002) (Figure 3). The median of changes in BMI, SMI, SAI, and VAI after NCRT were 0, -0.96%, -1.65%, and -3.04%, respectively (Table 2).

Figure 2 Correlation between BMI and body composition parameters before and after NCRT.
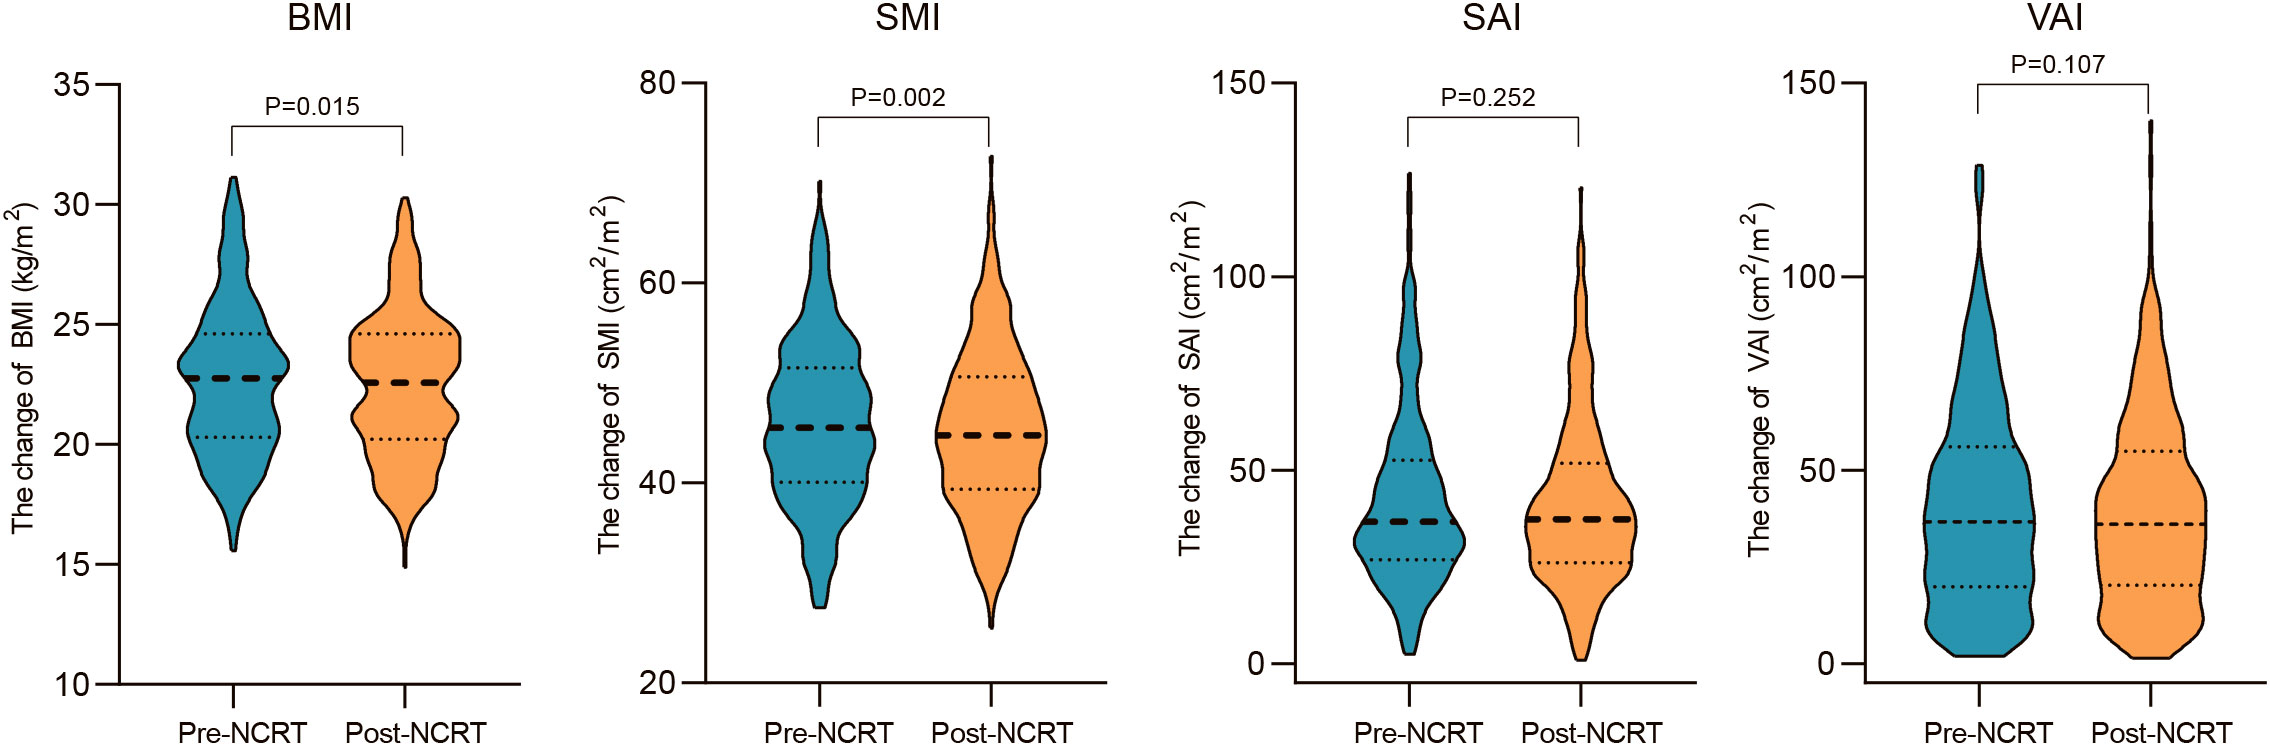
Figure 3 Changes in BMI and body composition parameters before and after NCRT.
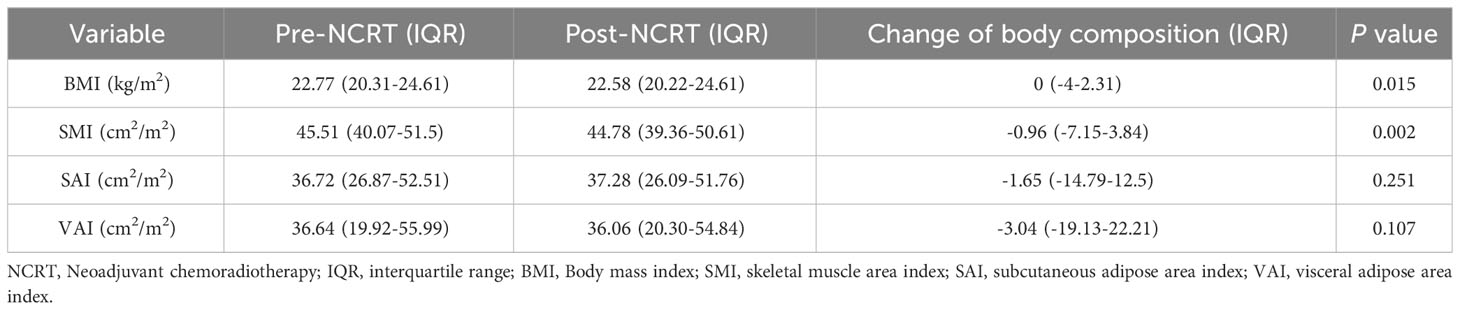
Table 2 The baseline of BMI and body composition parameters.
NCRT Baseline characteristics of patients with pCR
Fifty-five (18.9%) patients with LARC attained pCR after NCRT. The median age of the pCR group and the non-pCR group were 56 years (range, 49-66) and 59 years (range, 50.25-65) years, respectively. The proportion of female patients reaching pCR was higher than that of male patients (24.21% vs 16.33%), but the difference was not statistically significant (P=0.11). Patients with NLR < 2.6, PLR < 168.45, and SII < 714.65 before NCRT were more likely to obtain a pCR. There were no significant differences between the two groups in tumor size, clinical T stage, clinical N stage, radiotherapy regimen, chemotherapy regimen, the cycle of consolidation chemotherapy, and the interval between completion of radiotherapy and surgery. The proportion of pCR in patients with mrTRG 1-2 was significantly higher than that in patients with mrTRG 3-4 (52% vs 24.41% vs 9.17% vs 3.33%, P < 0.001). Significantly fewer patients had pre-NCRT L-SMI in the pCR group than in the non-pCR group (7.27% vs 29.34%, P < 0.001). Patients with LARC in the pCR group showed greater changes in BMI (-1.37% vs 0, P=0.021) (Table 3).
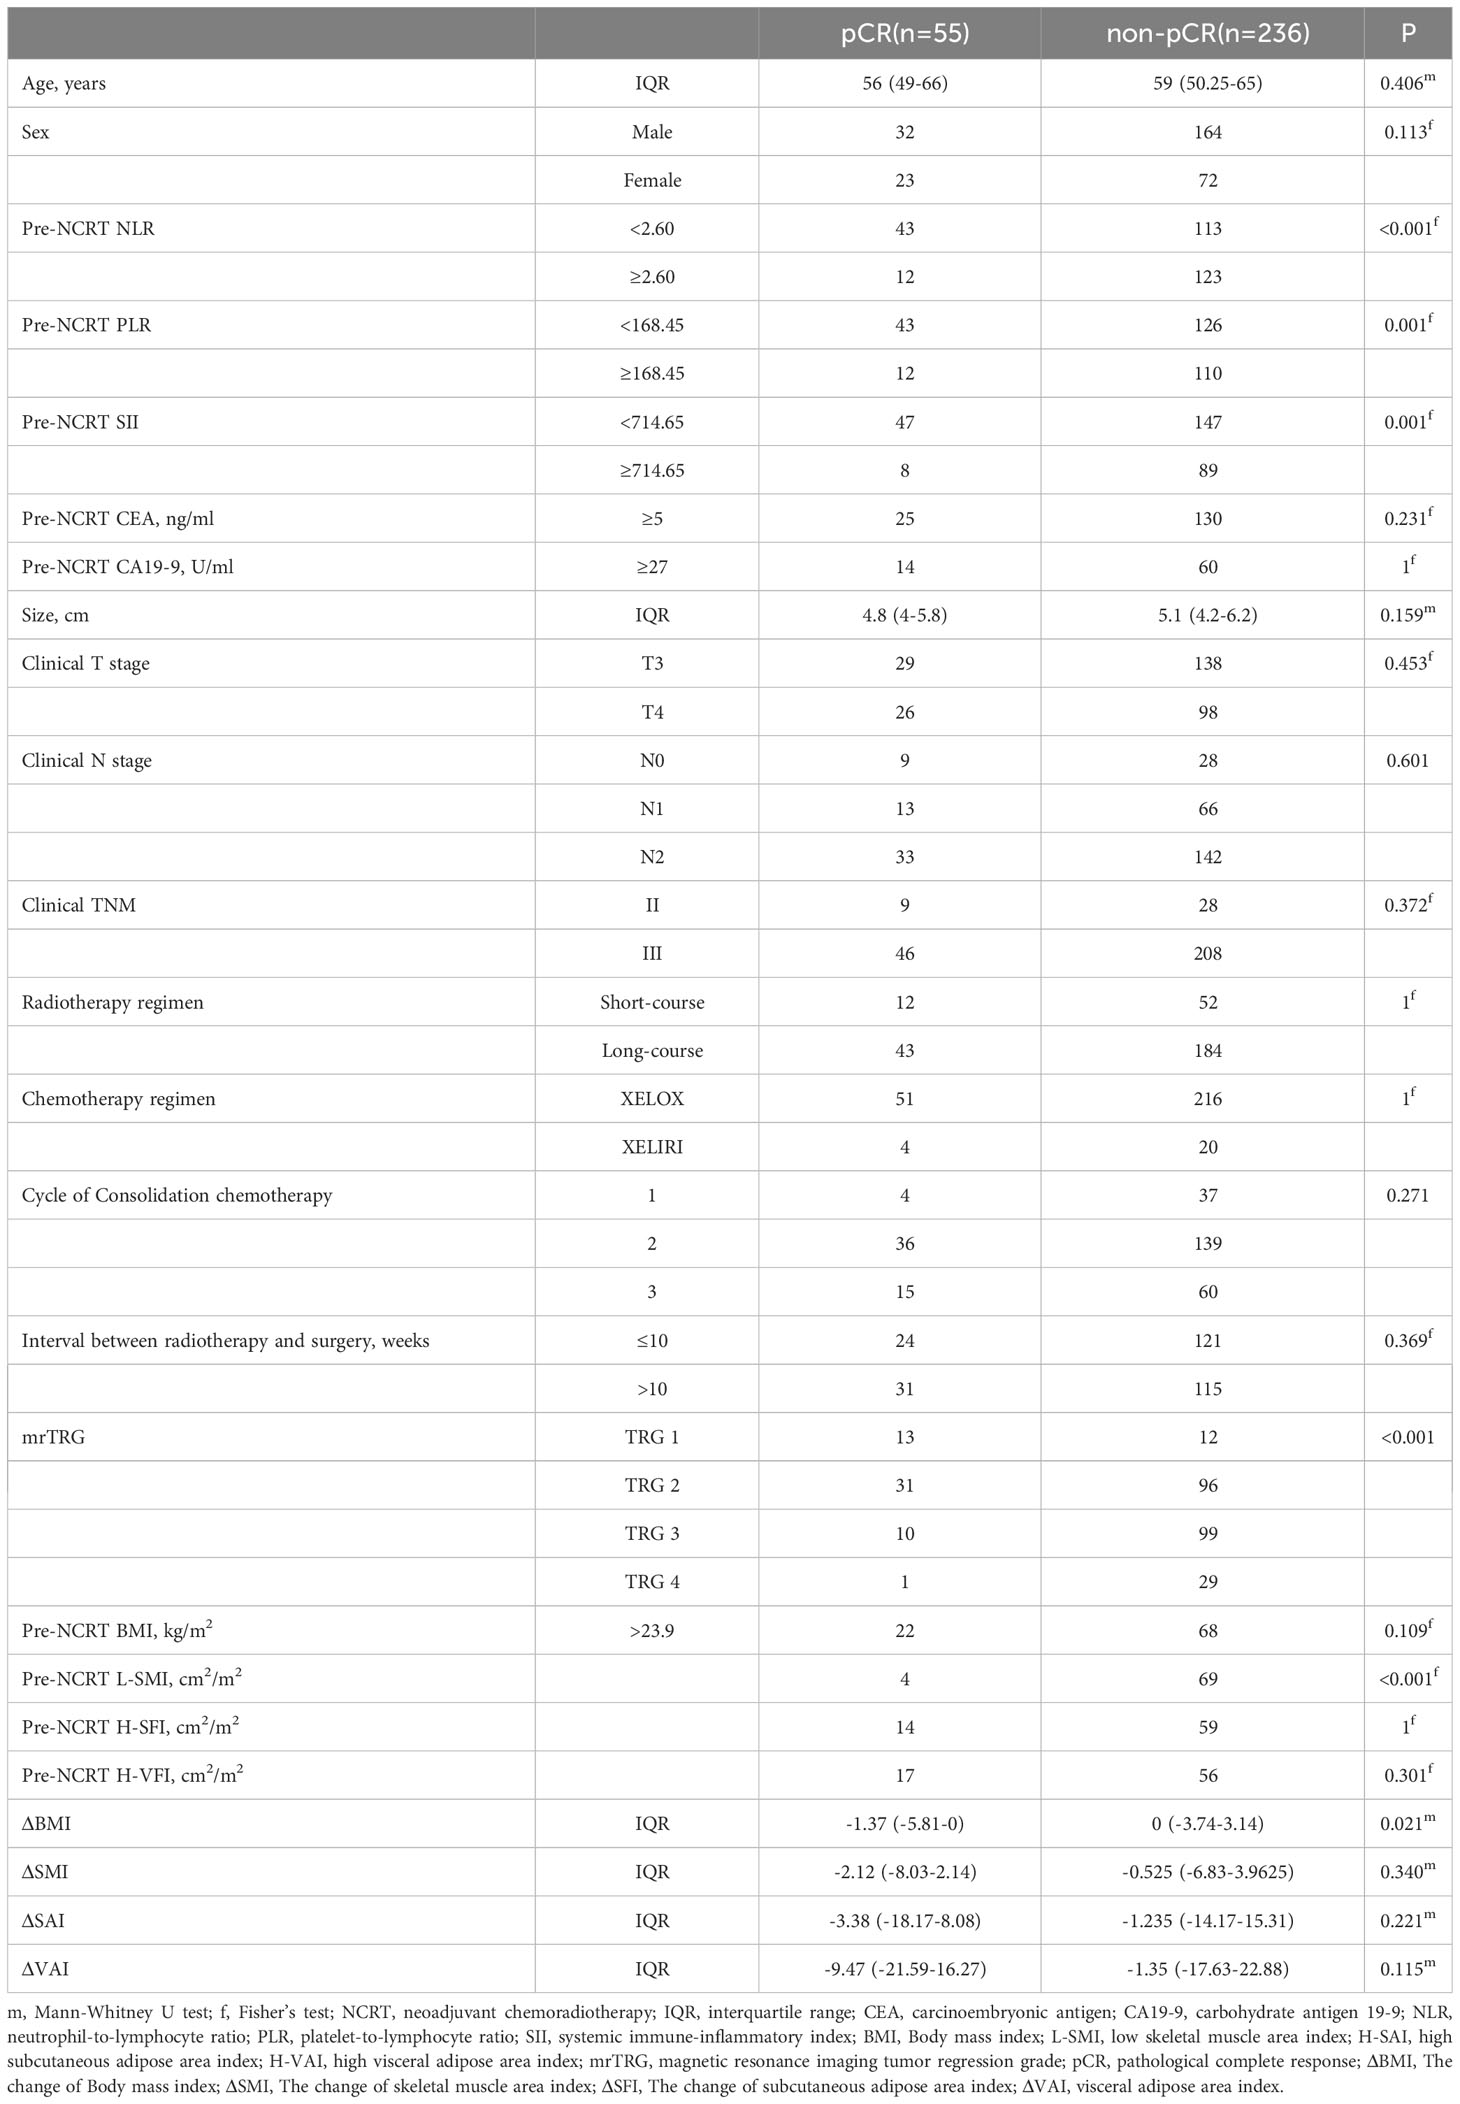
Table 3 Baseline characteristics of patients with pCR.
Predictors of pCR to NCRT
Univariate and multivariate analyses of LARC patients with pCR after NCRT were shown in Table 4. Univariate analysis indicated that pre-NCRT NLR≥2.6 (OR=0.256, 95% CI 0.129-0.511, P<0.001), pre-NCRT PLR≥168.45 (OR=0.32, 95% CI 0.16-0.637, P=0.001), pre-NCRT SII≥714.15 (OR=0.281, 95% CI 0.127-0.622, P=0.002), mrTRG 3-5(OR= 0.218, 95% CI 0.107-0.443, P<0.001) and pre-NCRT L-SMI (OR=0.19, 95% CI 0.066-0.546, P=0.002) were risk factors for pCR. Multivariate analysis was performed on variables with P<0.1 in the univariate analysis. The analysis results suggested that pre-NCRT NLR≥2.6 (OR= 0.378, 95%CI 0.164-0.868, P=0.022), mrTRG 3-5 (OR=0.256, 95%CI 0.121-0.54, P<0.001), and pre-NCRT L-SMI (OR=0.292, 95% CI 0.097-0.883, P=0.029) were independent risk factors for pCR.
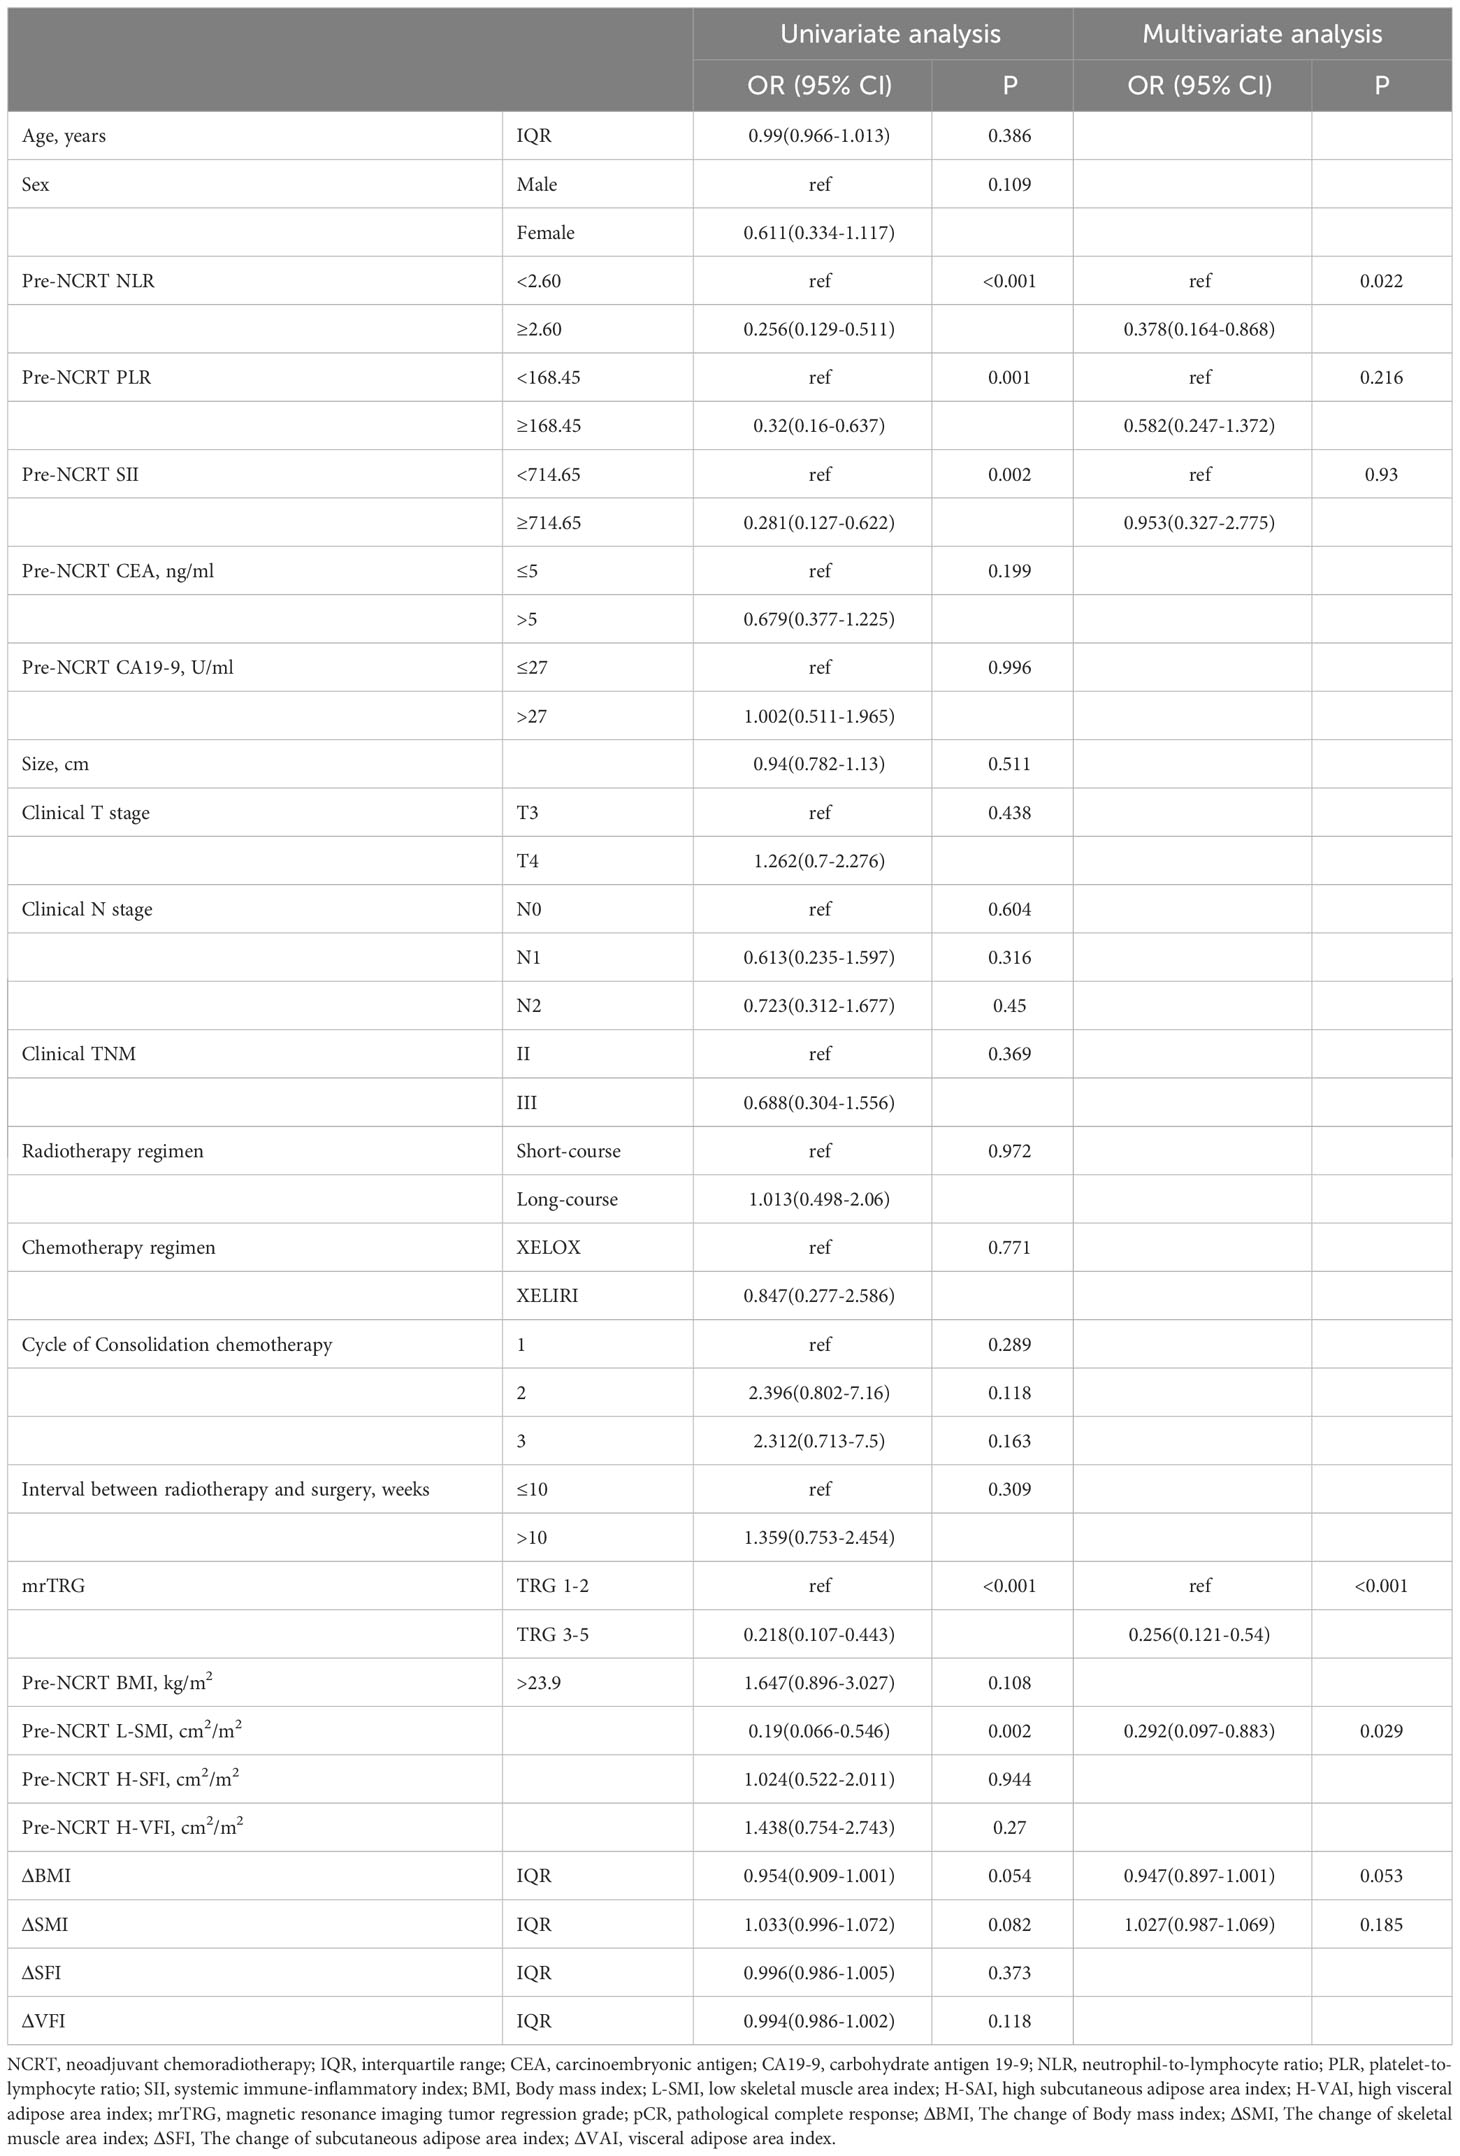
Table 4 Univariate and multivariate analysis for pCR to NCRT.
ROC curves were used to evaluate the performance of NLR, mrTRG, and L-SMI in predicting pCR. The results demonstrated that the AUC for pre-NCRT NLR, mrTRG, and pre-NCRT L-SMI was 0.667 (95% CI 0.592-0.742, P<0.001), 0.652 (95% CI 0.575-0.728, P<0.001) and 0.61 (95% CI 0.535-0.685, P=0.011), respectively. The performance of mrTRG combined with pre-NCRT NLR and pre-NCRT L-SMI in predicting pCR was significantly improved compared with mrTRG alone (AUC: 0.763 vs. 0.667) (Figure 4, Table 5).
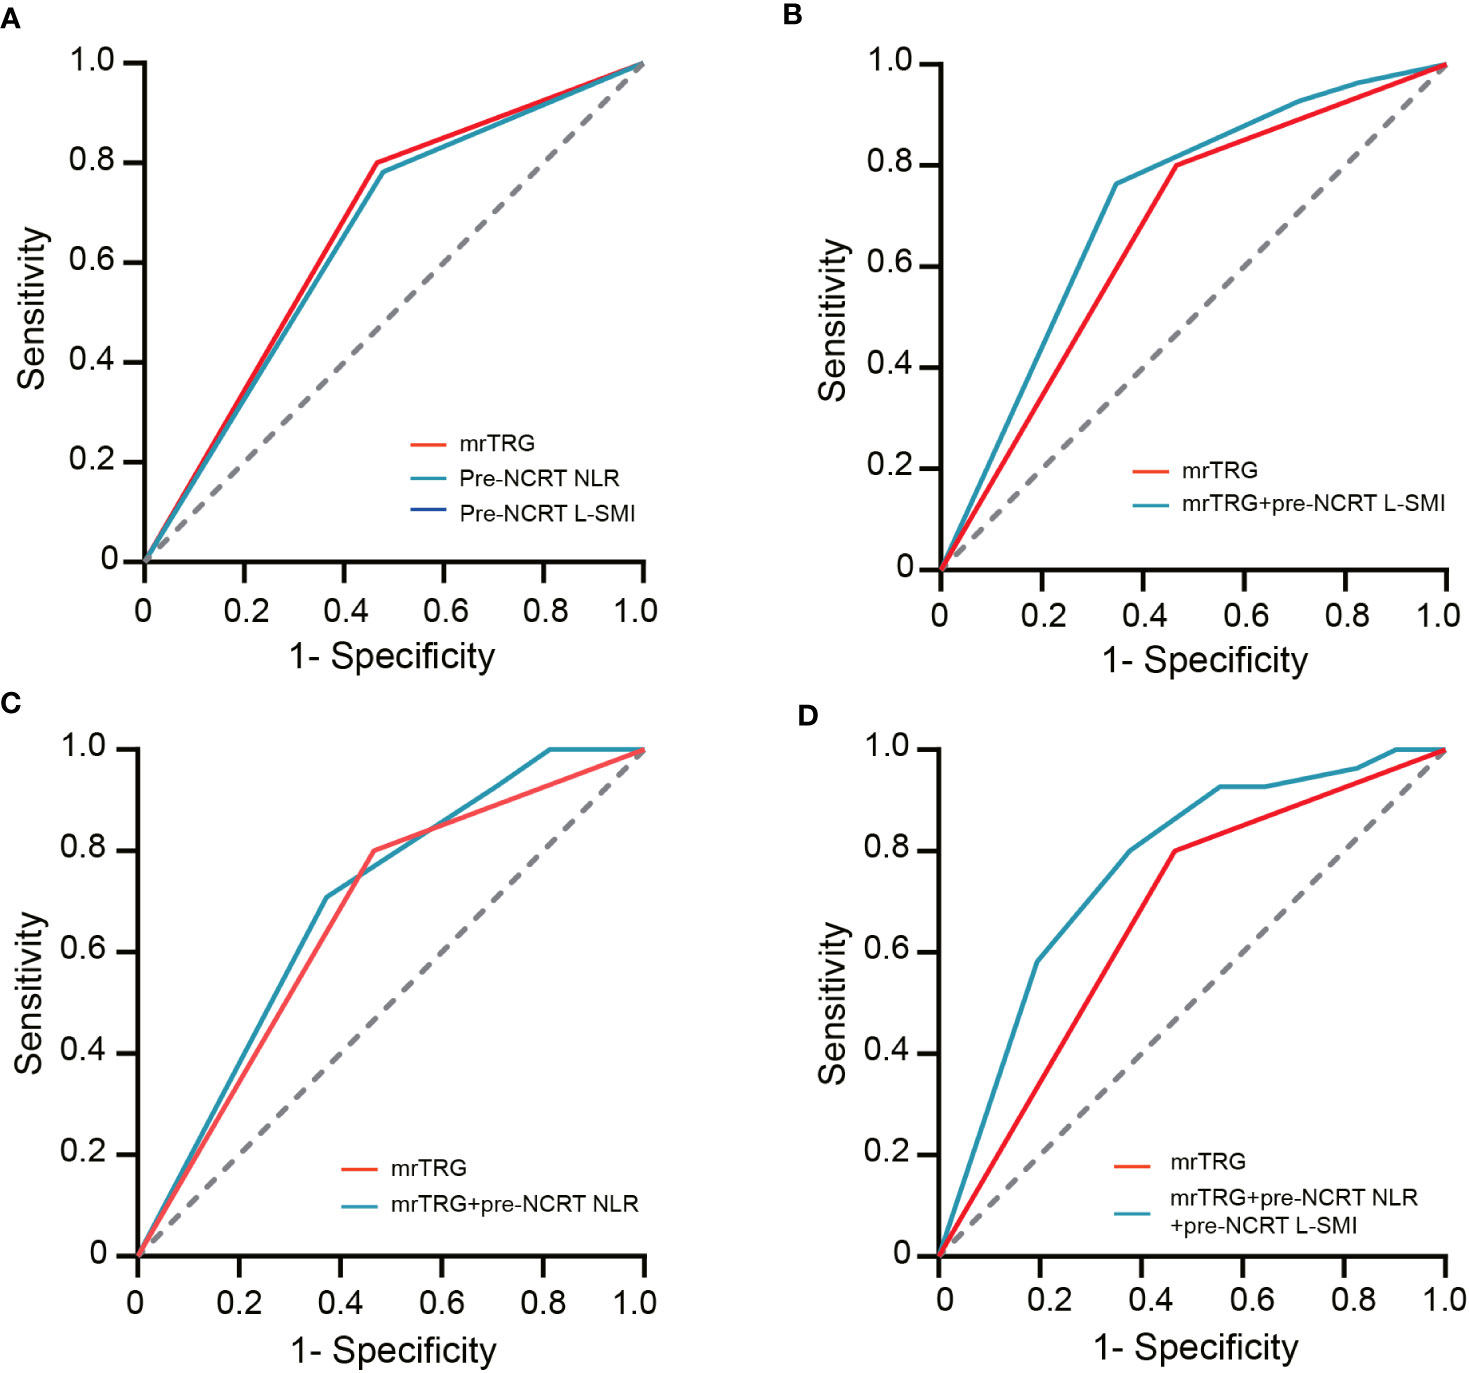
Figure 4 The ROC curves of assessing pCR. (A) the ROC curves of mrTRG, pre-NCRT NLR and pre-NCRT L-SMI alone; (B) the ROC curves of mrTRG + pre-NCRT L-SMI; (C) the ROC curves of mrTRG + pre-NCRT NLR; (D) the ROC curves of mrTRG+ pre-NCRT L-SMI + pre-NCRT NLR.
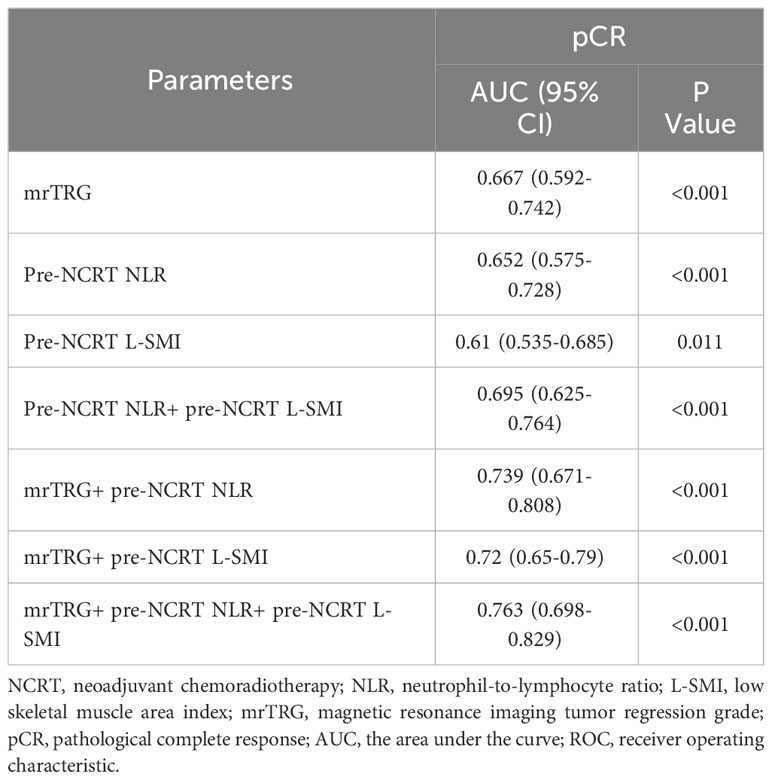
Table 5 The AUC value of ROC curves.
Based on the results of multivariate analysis, pre-NCRT NLR, mrTRG, and pre-NCRT L-SMI were performed to construct a predictive nomogram for pCR after NCRT for LARC (Figure 5A). The probability of pCR prediction after NCRT for LARC patients can be obtained by summing the scores corresponding to pre-NCRT NLR, mrTRG, and pre-NCRT L-SMI, and then plotting a straight line to obtain the probability of achieving pCR. Patients with higher total points were more likely to reach pCR. The model was validated internally and a correction curve was drawn. The validated results showed that the predicted probability of pCR was in good agreement with the actual probability (Figure 5B). The discriminant ability of pCR prediction models was evaluated by the C-index. The results revealed that the C-index of the nomogram was 0.763 (95% CI 0.700-0.826).
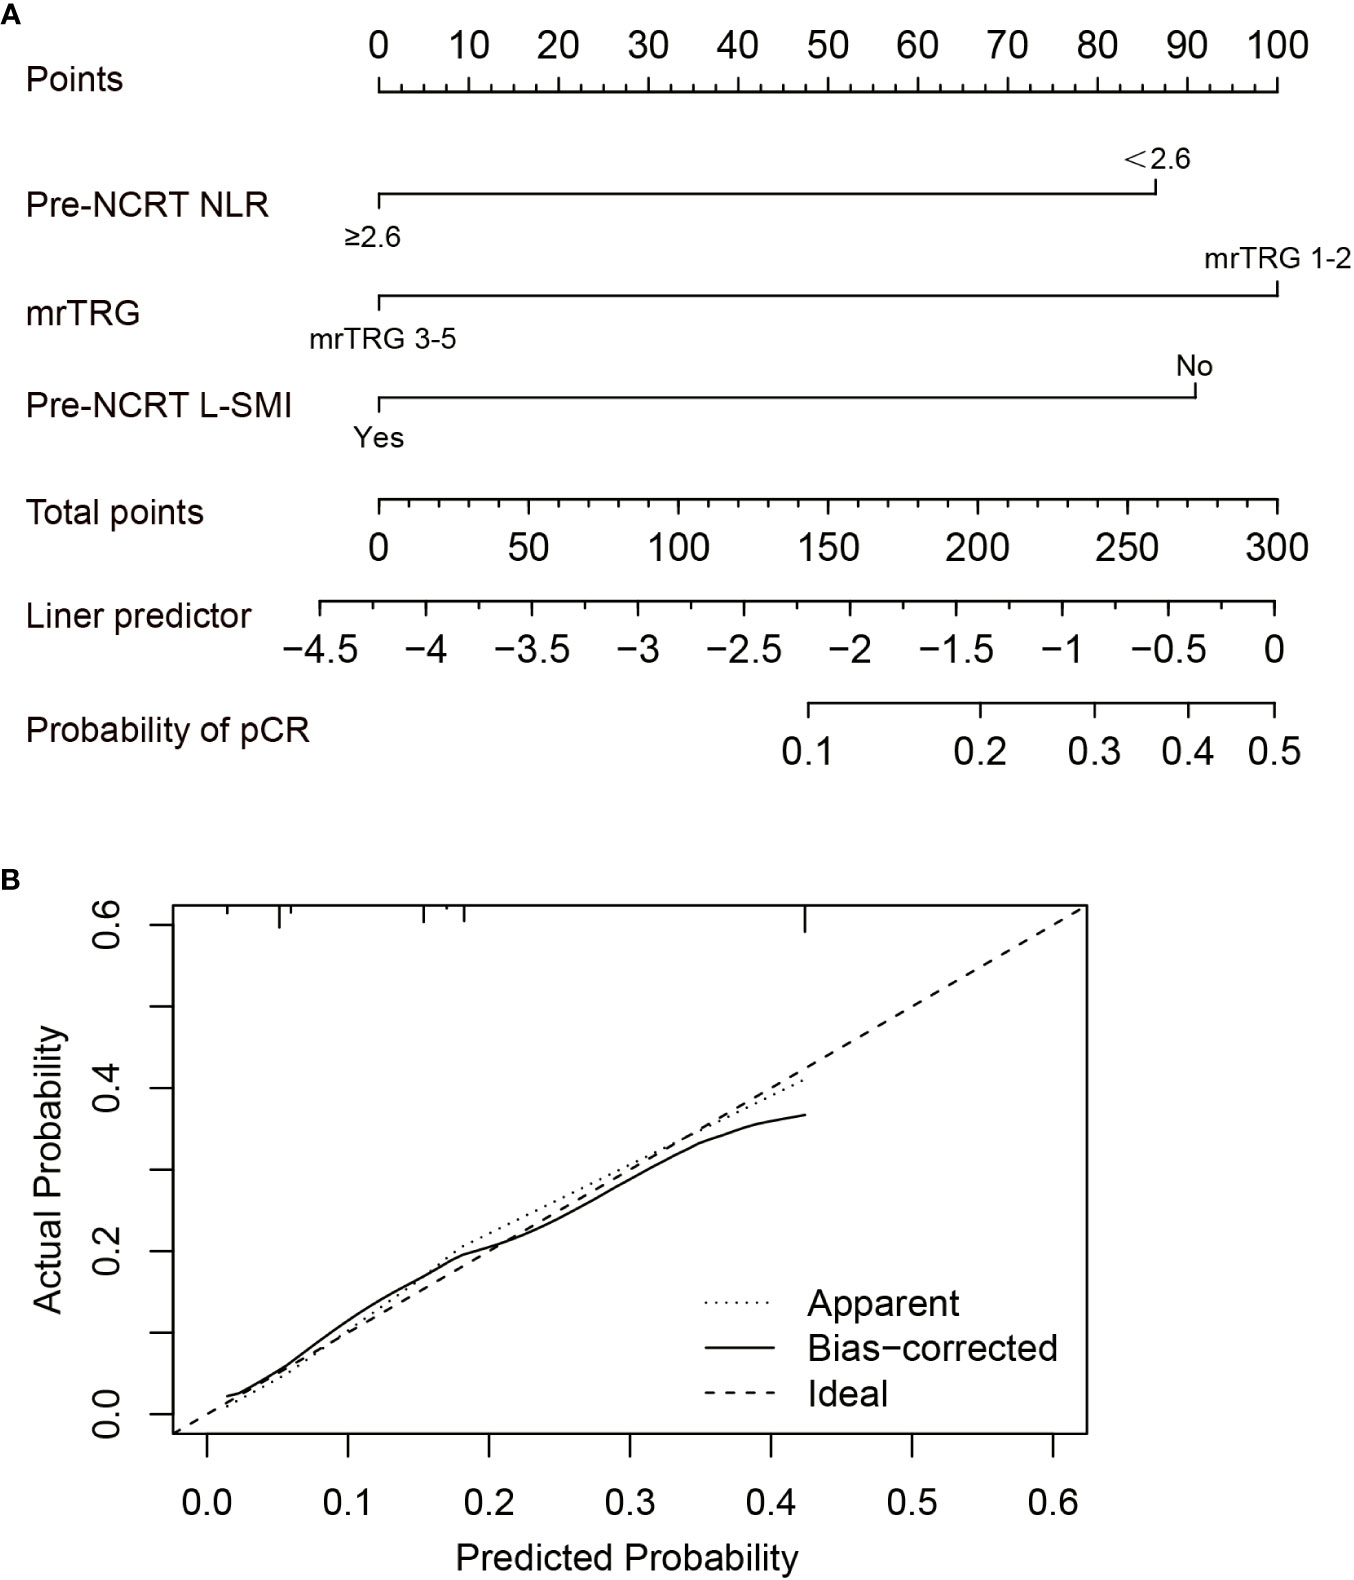
Figure 5 Construction of the factors for pCR to NCRT. (A) The Nomogram of predicting pCR; (B) The curves of internal validation for the nomogram.
Predictors of tumor regression response to NCRT
pTRG 0-1 was defined as tumor regression (TR), while pTRG 2-3 is defined as non-tumor regression (non-TR). Univariate analysis showed that pre-NCRT NLR≥2.6 (OR= 0.523, 95% CI 0.318-0.859, P=0.011), pre-NCRT PLR≥168.45 (OR= 0.461, 95% CI 0.276-0.771, P=0.011), pre-NCRT SII≥714.15 (OR= 0.402, 95%CI 0.229-0.705, P=0.001), and mrTRG 3-5 (OR= 0.336, 95%CI 0.201-0.563, P<0.001) were risk factors for TR. We then conducted multivariate analysis on variables with P<0.1 in univariate analysis. The results indicated that mrTRG 3-5 (OR=0.375, 95% CI 0.219-0.641, P<0.001) was an independent predictor for non-TR (Table 6).
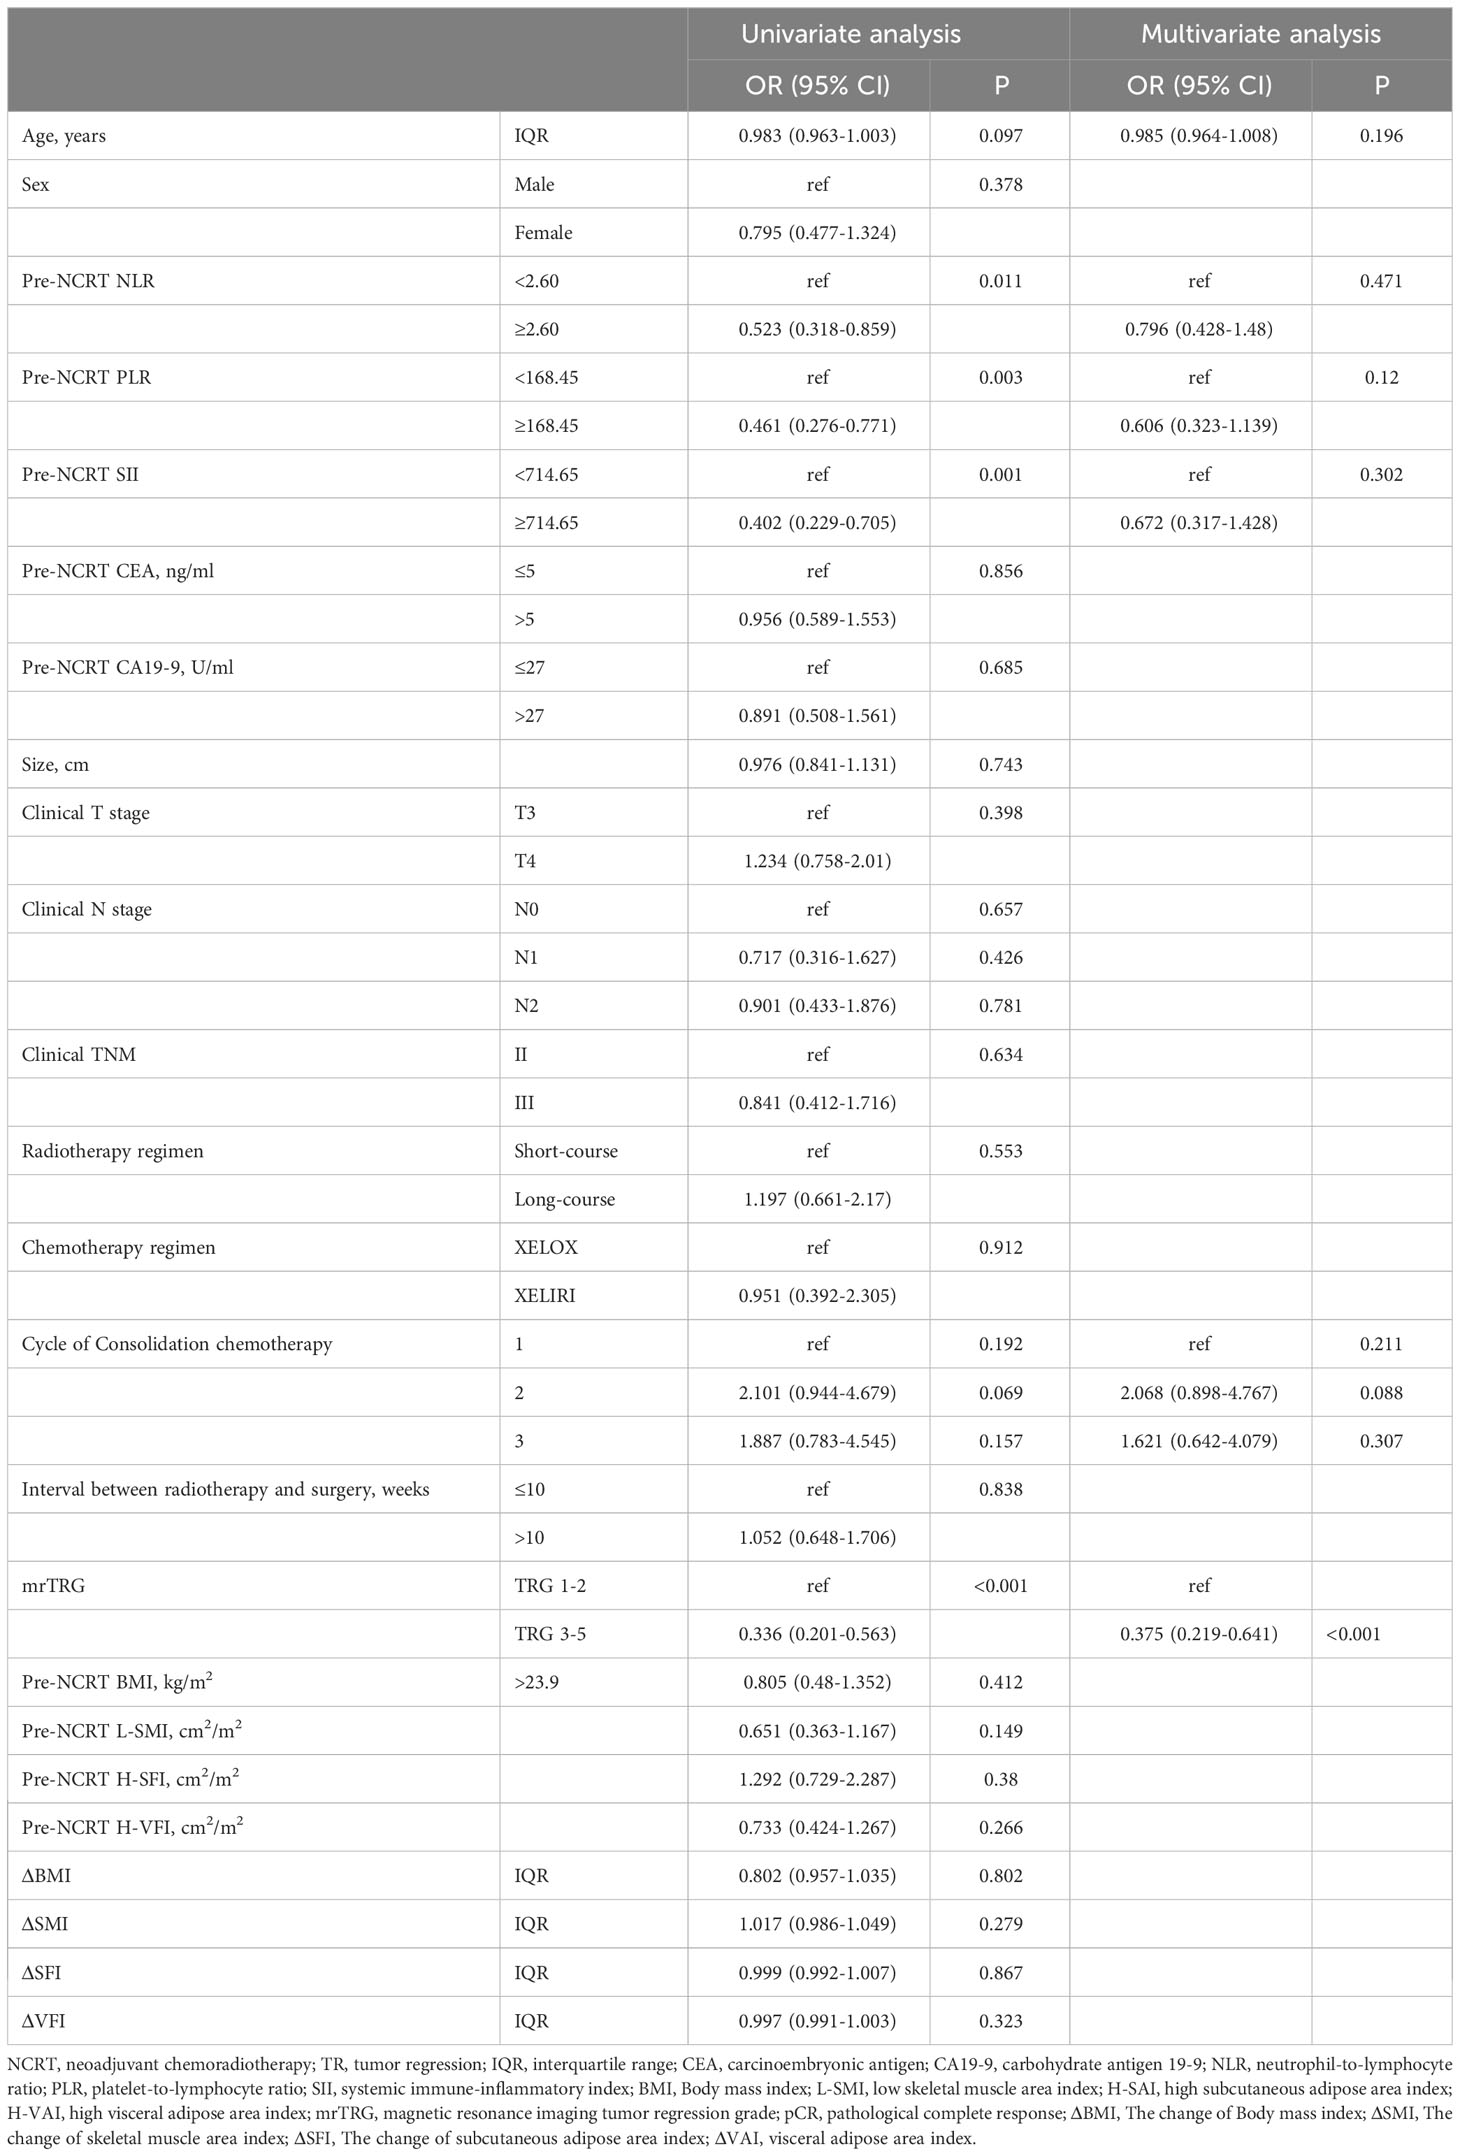
Table 6 Univariate and multivariate analysis for TR to NCRT.
Discussion
The pCR after NCRT is a crucial predictor of favorable prognosis in LARC. Several studies have reported a recurrence rate of 6-17% and a 5-year OS of 87-92.9% for patients who achieved a pCR (30–32). Although NCRT followed by surgery has been shown to reduce local recurrence and improve the clinical outcomes for LARC patients, this approach comes with a significant reduction in the quality of life due to radiotherapy adverse reactions, surgical complications, and permanent stoma (33, 34). Interestingly, radical surgery has been reported to have a similar recurrence rate and OS compared to local resection in LARC patients who achieved clinical complete response (cCR) following NCRT. However, local resection is known to significantly improve quality of life in patients with rectal cancer (35). Furthermore, a “wait-and-watch” approach has also resulted in similar oncological prognosis compared to radical surgery in patients who achieved cCR (36). Several factors contribute to the likelihood of achieving a pCR in LARC. One such factor is the radiation dose, which has a significant impact on the treatment outcome. In particular, tumor response can be enhanced by employing simultaneous integrated boost (SIB) with an up dose of 55-60 Gy (37, 38). Unfortunately, there are currently no reliable markers to accurately predict pCR and cCR for LARC patients after NCRT. This study evaluated the role of body composition parameters, systemic inflammatory markers, and MRI as predicting factors affecting pCR in LARC patients. The findings revealed that L-SMI, NLR, and mrTRG were independent risk factors for achieving pCR. Moreover, mrTRG was also an independent predictor of TR.
The assessment of short-term and long-term clinical outcomes in cancer patients based on L3 cross-sectional body composition parameters is superior to BMI because it provides sex-specific information regarding the patient’s skeletal muscle and adipose tissue (39–41). Nevertheless, the cut-off value of the body composition parameter remains controversial due to population differences. The cut-off value of L-SMI in Western populations may be higher than that in Eastern populations. In Western populations, the generally accepted cut-off values for L-SMI are 52.4 cm2/m2 for men and 38.5 cm2/m2 for women (42). However, two Asian studies defined the cutoff of L-SMI as the sex-specific lowest quartile which was strongly associated with CRC prognosis (43, 44). Therefore, the sex-specific lowest quartile was also defined as the cutoff value for the body composition parameters in this study.
The effect of L-SMI on tumor regression response and prognosis of LARC patients after NCRT is still unclear. A retrospective multicenter study investigated that sarcopenia was an independent risk factor for pCR and cCR but not a predictor of TR (45). In this study, the presence of sarcopenia was assessed by CT scanning of the psoas muscle region at the L3 level which was a minor muscle and cannot imply the entire skeletal muscle level. Olmez et al. analyzed the effect of sarcopenia on the pCR of LARC and identified sarcopenia, age≥60 years, the interval between surgery and completion of radiotherapy <8 weeks, and CEA≥2.5 ng/ml as risk factors for pCR through univariate analysis. However, this study did not conduct multivariate analysis of factors affecting pCR (46). It was also observed in our study that L-SMI before NCRT was an independent risk factor for pCR, but it was not a predictor of TR. Furthermore, studies have shown that L-SMI is an independent risk factor for adverse reactions to NCRT, postoperative complications, OS, and DFS in patients with LARC (16–18). However, the underlying reasons for the association between L-SMI and poor oncological outcomes or treatment response to NCRT in LARC remain unclear. Possible explanations for this included the overwhelming distribution of hydrophilic chemotherapeutic drugs such as fluorouracil and oxaliplatin in the lean body which can cause overdose of chemotherapy drugs (47). Loss of skeletal muscle in cancer patients indirectly reflected the strong invasive potential of the tumor (48). Malnutrition was also a principal factor in muscle loss, and patients with malnutrition have impaired immune status and reduced tolerance to chemotherapy (49). Additionally, L-SMI induced the accumulation of M2 macrophages, up-regulation immune checkpoint genes and proinflammatory cytokines (IL-6, IL-10, and TGF-β), and alteration the tumor microenvironment and immune status (50).
Systemic inflammation stimulated cancer cell proliferation, metastasis, immunosuppression, and alteration of the tumor microenvironment through pro-inflammatory factors (24). Several systemic inflammatory markers NLR, PLR, SII, and LMR have been demonstrated to be associated with tumor regression response and prognosis in a variety of cancers (51). A multicenter retrospective study involving 808 patients with LARC indicated that NLR>1.2 and SII>500 were independent risk factors for pCR (52). Furthermore, Liu et al. also confirmed that NLR (AUC=0.794, P=0.024) and PLR (AUC=0.740, P=0.006) were critical predictors of pCR in LARC (53). Sun et al. revealed that low NLR was an independent predictor of TR to NCRT in rectal mucinous adenocarcinoma (OR=4.025, P=0.028), but not SII (54). Our study also suggested that high NLR before NCRT can act as an independent risk factor predictor for pCR in patients with LARC. Although pre-NCRT SII and PLR were not confirmed to be independent risk factors of pCR, in a univariate analysis high SII and PLR were less likely to achieve pCR. However, the ability of systemic inflammatory markers to predict pCR, OS, and DFS in LARC remains controversial. A multicenter study indicated that NLR and PLR were neither risk factors of OS and DFS in LARC patients nor predictors of pCR and TR (26). AN et al. showed that NLR< 2.8 and PLR< 300 were not associated with pCR and 5-year OS, but PLR could be a predictor for 5-year DFS (55). Currently, there was no unified cut-off value of inflammatory markers such as NLR, PLR, and SII to predict pCR and prognosis. The cut-off value of NLR generally between 2-3 can prognosticate the pCR and outcomes (56). In this study, we predicted the optimal cut-off values for obtaining pCR by ROC curves for NLR, PLR, and SII, and ultimately indicated that NLR ≥2.6 was an independent predictor of pCR (AUC= 0.652, P<0.001).
MRI has routinely been applied for staging and treatment response of rectal cancer. Compared with conventional MRI, DWI was more effective in assessing TRG after NCRT for LARC (57). The assessment of mrTRG was also influenced by the radiologist and MRI parameters. Presently, the competence of MRI alone in predicting pCR is still unsatisfactory. Yoo et al. suggested that combination of mrTRG and blood biomarker CEA could better identify the TR to NCRT (AUC: 0.68 vs 0.728) (58). Shi et al. revealed that the proportion of pCR in patients with mrTRG 1-2 was significantly higher than that in patients with mrTRG 3-5 (70% vs 23.1%, P=0.001), and mrTRG could also serve as an independent predictor of pCR (OR=0.074 95% CI 0.011-0.499; P = 0.007). Besides, compared with mrTRG alone, the efficacy of mrTRG combined with NLR in predicting pCR was significantly improved (28). Consistent with this study, we also indicated that mrTRG 1-2 was also an independent predictor of pCR and TR after NCRT for LARC. The performance of mrTRG combined with pre-NCRT NLR and pre-NCRT L-SMI in predicting pCR was greater than that of mrTRG alone (AUC: 0.667 vs 0.763).
Despite the encouraging results observed in this study, we must consider several limitations. Firstly, this study was a single-center retrospective study that may be subject to selection bias and information bias. Secondly, the effect of mrTRG, pre-NCRT NLR, and pre-NCRT L-SMI on OS and DFS in LARC was unclear due to insufficient follow-up time. Thirdly, no uniform cut-off value of systemic inflammatory markers was performed to predict pCR and prognosis, and they were affected by a variety of factors. Finally, the cutoff value of body composition parameters in Asians is unclear, and the sex-specific quartile was conducted as the cutoff value in this study. Therefore, further research is needed to confirm that the selection method of this cut-off value is applicable to the Asian population.
In conclusion, this study demonstrated that MRI tumor regression grading combined with neutrophil-to-lymphocyte ratio and skeletal muscle index can effectively predict the pathological complete response to neoadjuvant chemoradiotherapy in locally advanced rectal cancer. mrTRG was also an independent predictor of tumor regression.
Data availability statement
The original contributions presented in the study are included in the article/Supplementary Material. Further inquiries can be directed to the corresponding author/s.
Ethics statement
The studies involving humans were approved by Ethics Committee of the First Affiliated Hospital of Chongqing Medical University. The studies were conducted in accordance with the local legislation and institutional requirements. The participants provided their written informed consent to participate in this study.
Author contributions
YJ: Research conception, data collection, data analysis, and manuscript writing. QC: Data collection and analysis. CZ: Data collection and literature search. YC: Literature retrieval and data extraction. ZF: conception, supervision, review, editing.
Funding
The author(s) declare financial support was received for the research, authorship, and/or publication of this article. This work is supported by Chongqing key disease Research and Application Demonstration Program (No. 2019ZX003).
Conflict of interest
The authors declare that the research was conducted in the absence of any commercial or financial relationships that could be construed as a potential conflict of interest.
Publisher’s note
All claims expressed in this article are solely those of the authors and do not necessarily represent those of their affiliated organizations, or those of the publisher, the editors and the reviewers. Any product that may be evaluated in this article, or claim that may be made by its manufacturer, is not guaranteed or endorsed by the publisher.
Supplementary material
The Supplementary Material for this article can be found online at: https://www.frontiersin.org/articles/10.3389/fonc.2023.1242193/full#supplementary-material
References
1. Siegel RL, Miller KD, Fuchs HE, Jemal A. Cancer statistics, 2022. CA Cancer J Clin (2022) 72(1):7–33. doi: 10.3322/caac.21708
2. Siegel RL, Wagle NS, Cercek A, Smith RA, Jemal A. Colorectal cancer statistics, 2023. CA Cancer J Clin (2023) 73(3):233–54. doi: 10.3322/caac.21772
3. Benson AB, Venook AP, Al-Hawary MM, Azad N, Chen YJ, Ciombor KK, et al. Rectal cancer, version 2.2022, NCCN clinical practice guidelines in oncology. J Natl Compr Canc Netw (2022) 20(10):1139–67. doi: 10.6004/jnccn.2022.0051
4. Glynne-Jones R, Wyrwicz L, Tiret E, Brown G, Rödel C, Cervantes A, et al. Rectal cancer: ESMO Clinical Practice Guidelines for diagnosis, treatment and follow-up. Ann Oncol (2018) 29(Suppl 4):iv263. doi: 10.1093/annonc/mdy161
5. Sauer R, Becker H, Hohenberger W, Rödel C, Wittekind C, Fietkau R, et al. Preoperative versus postoperative chemoradiotherapy for rectal cancer. N Engl J Med (2004) 351:1731–40. doi: 10.1056/NEJMoa040694
6. van der Valk MJM, Hilling DE, Bastiaannet E, Meershoek-Klein Kranenbarg E, Beets GL, Figueiredo NL, et al. Long-term outcomes of clinical complete responders after neoadjuvant treatment for rectal cancer in the International Watch & Wait Database (IWWD): an international multicentre registry study. Lancet (2018) 391(10139):2537–45. doi: 10.1016/S0140-6736(18)31078-X
7. Rullier A, Laurent C, Capdepont M, Vendrely V, Bioulac-Sage P, Rullier E. Impact of tumor response on survival after radiochemotherapy in locally advanced rectal carcinoma. Am J Surg Pathol (2010) 34(4):562–8. doi: 10.1097/PAS.0b013e3181d438b0
8. Hasan S, Renz P, Wegner RE, Finley G, Raj M, Monga D, et al. Microsatellite instability (MSI) as an independent predictor of pathologic complete response (PCR) in locally advanced rectal cancer: A national cancer database (NCDB) analysis. Ann Surg (2020) 271(4):716–23. doi: 10.1097/SLA.0000000000003051
9. Sun Y, Xu Z, Lin H, Lu X, Huang Y, Huang S, et al. Impact of body mass index on treatment outcome of neoadjuvant chemoradiotherapy in locally advanced rectal cancer. Eur J Surg Oncol (2017) 43(10):1828–34. doi: 10.1016/j.ejso.2017.07.022
10. Avgerinos KI, Spyrou N, Mantzoros CS, Dalamaga M. Obesity and cancer risk: Emerging biological mechanisms and perspectives. Metabolism (2019) 92:121–35. doi: 10.1016/j.metabol.2018.11.001
11. Diefenhardt M, Ludmir EB, Hofheinz RD, Ghadimi M, Minsky BD, Fleischmann M, et al. Impact of body-mass index on treatment and outcome in locally advanced rectal cancer: A secondary, post-hoc analysis of the CAO/ARO/AIO-04 randomized phase III trial. Radiother Oncol (2021) 164:223–31. doi: 10.1016/j.radonc.2021.09.028
12. Zopfs D, Theurich S, Große Hokamp N, Knuever J, Gerecht L, Borggrefe J, et al. Single-slice CT measurements allow for accurate assessment of sarcopenia and body composition. Eur Radiol (2020) 30(3):1701–8. doi: 10.1007/s00330-019-06526-9
13. Bao QR, Crimì F, Valotto G, Chiminazzo V, Bergamo F, Prete AA, et al. Obesity may not be related to pathologic response in locally advanced rectal cancer following neoadjuvant chemoradiotherapy. Front Oncol (2022) 12:994444. doi: 10.3389/fonc.2022.994444
14. Martin L, Birdsell L, Macdonald N, Reiman T, Clandinin MT, McCargar LJ, et al. Cancer cachexia in the age of obesity: skeletal muscle depletion is a powerful prognostic factor, independent of body mass index. J Clin Oncol (2013) 31(12):1539–47. doi: 10.1200/JCO.2012.45.2722
15. Lin JX, Tang YH, Zhou WX, Desiderio J, Parisi A, Xie JW, et al. Body composition parameters predict pathological response and outcomes in locally advanced gastric cancer after neoadjuvant treatment: A multicenter, international study. Clin Nutr (2021) 40(8):4980–7. doi: 10.1016/j.clnu.2021.06.021
16. Liu Z, Lu S, Wang Y, Lin X, Ran P, Zhou X, et al. Impact of body composition during neoadjuvant chemoradiotherapy on complications, survival and tumor response in patients with locally advanced rectal cancer. Front Nutr (2022) 9:796601. doi: 10.3389/fnut.2022.796601
17. Liu J, Yu X, Huang X, Lai Q, Chen J. Associations of muscle and adipose tissue parameters with long-term outcomes in middle and low rectal cancer: a retrospective cohort study. Cancer Imaging (2023) 23(1):5. doi: 10.1186/s40644-022-00514-x
18. Choi MH, Oh SN, Lee IK, Oh ST, Won DD. Sarcopenia is negatively associated with long-term outcomes in locally advanced rectal cancer. J Cachexia Sarcopenia Muscle (2018) 9(1):53–9. doi: 10.1002/jcsm.12234
19. Fujiwara N, Nakagawa H, Kudo Y, Tateishi R, Taguri M, Watadani T, et al. Sarcopenia, intramuscular fat deposition, and visceral adiposity independently predict the outcomes of hepatocellular carcinoma. J Hepatol (2015) 63(1):131–40. doi: 10.1016/j.jhep.2015.02.031
20. Bandera EV, John EM. Obesity, body composition, and breast cancer: an evolving science. JAMA Oncol (2018) 4(6):804–5. doi: 10.1001/jamaoncol.2018.0125
21. Kamarajah SK, Bundred J, Tan BHL. Body composition assessment and sarcopenia in patients with gastric cancer: a systematic review and meta-analysis. Gastric Cancer (2019) 22(1):10–22. doi: 10.1007/s10120-018-0882-2
22. Vrieling A, Kampman E, Knijnenburg NC, Mulders PF, Sedelaar JPM, Baracos VE, et al. Body composition in relation to clinical outcomes in renal cell cancer: A systematic review and meta-analysis. Eur Urol Focus (2018) 4(3):420–34. doi: 10.1016/j.euf.2016.11.009
23. Bundred J, Kamarajah SK, Roberts KJ. Body composition assessment and sarcopenia in patients with pancreatic cancer: a systematic review and meta-analysis. HPB (Oxford) (2019) 21(12):1603–12. doi: 10.1016/j.hpb.2019.05.018
24. Zhang Y, Liu X, Xu M, Chen K, Li S, Guan G. Prognostic value of pretreatment systemic inflammatory markers in patients with locally advanced rectal cancer following neoadjuvant chemoradiotherapy. Sci Rep (2020) 10(1):8017. doi: 10.1038/s41598-020-64684-z
25. Zhang X, Li J, Peng Q, Huang Y, Tang L, Zhuang Q, et al. Association of markers of systemic and local inflammation with prognosis of patients with rectal cancer who received neoadjuvant radiotherapy. Cancer Manag Res (2018) 11:191–9. doi: 10.2147/CMAR.S187559
26. Dudani S, Marginean H, Tang PA, Monzon JG, Raissouni S, Asmis TR, et al. Neutrophil-to-lymphocyte and platelet-to-lymphocyte ratios as predictive and prognostic markers in patients with locally advanced rectal cancer treated with neoadjuvant chemoradiation. BMC Cancer (2019) 19(1):664. doi: 10.1186/s12885-019-5892-x
27. Tang Z, Zhang XY, Liu Z, Li XT, Shi YJ, Wang S, et al. Quantitative analysis of diffusion weighted imaging to predict pathological good response to neoadjuvant chemoradiation for locally advanced rectal cancer. Radiother Oncol (2019) 132:100–8. doi: 10.1016/j.radonc.2018.11.007
28. Shi X, Zhao M, Shi B, Chen G, Yao H, Chen J, et al. Pretreatment blood biomarkers combined with magnetic resonance imaging predict responses to neoadjuvant chemoradiotherapy in locally advanced rectal cancer. Front Oncol (2022) 12:916840. doi: 10.3389/fonc.2022.916840
29. van Vugt JL, Levolger S, Gharbharan A, Koek M, Niessen WJ, Burger JW, et al. A comparative study of software programmes for cross-sectional skeletal muscle and adipose tissue measurements on abdominal computed tomography scans of rectal cancer patients. J Cachexia Sarcopenia Muscle (2017) 8(2):285–97. doi: 10.1002/jcsm.12158
30. van der Sluis FJ, Couwenberg AM, de Bock GH, Intven MPW, Reerink O, van Leeuwen BL, et al. Population-based study of morbidity risk associated with pathological complete response after chemoradiotherapy for rectal cancer. Br J Surg (2020) 107(1):131–9. doi: 10.1002/bjs.11324
31. Wasmuth HH, Rekstad LC, Tranø G. The outcome and the frequency of pathological complete response after neoadjuvant radiotherapy in curative resections for advanced rectal cancer: a population-based study. Colorectal Dis (2016) 18(1):67–72. doi: 10.1111/codi.13072
32. Zorcolo L, Rosman AS, Restivo A, Pisano M, Nigri GR, Fancellu A, et al. Complete pathologic response after combined modality treatment for rectal cancer and long-term survival: a meta-analysis. Ann Surg Oncol (2012) 19(9):2822–32. doi: 10.1245/s10434-011-2209-y
33. Shiraishi T, Ito M, Sasaki T, Nishizawa Y, Tsukada Y, Ikeda K. Association between urinary function and resected pattern of the autonomic nerve system after transanal total mesorectal excision for rectal cancer. Colorectal Dis (2021) 23(2):405–14. doi: 10.1111/codi.15416
34. Borelli B, Germani MM, Carullo M, Mattioni R, Manfredi B, Sainato A, et al. Total neoadjuvant treatment and organ preservation strategies in the management of localized rectal cancer: A narrative review and evidence-based algorithm. Crit Rev Oncol Hematol (2023) 186:103985. doi: 10.1016/j.critrevonc.2023.103985
35. Rullier E, Rouanet P, Tuech JJ, Valverde A, Lelong B, Rivoire M, et al. Organ preservation for rectal cancer (GRECCAR 2): a prospective, randomised, open-label, multicentre, phase 3 trial. Lancet (2017) 390(10093):469–79. doi: 10.1016/S0140-6736(17)31056-5
36. Renehan AG, Malcomson L, Emsley R, Gollins S, Maw A, Myint AS, et al. Watch-and-wait approach versus surgical resection after chemoradiotherapy for patients with rectal cancer (the OnCoRe project): a propensity-score matched cohort analysis. Lancet Oncol (2016) 17(2):174–83. doi: 10.1016/S1470-2045(15)00467-2
37. Bertocchi E, Barugola G, Nicosia L, Mazzola R, Ricchetti F, Dell'Abate P, et al. A comparative analysis between radiation dose intensification and conventional fractionation in neoadjuvant locally advanced rectal cancer: a monocentric prospective observational study. Radiol Med (2020) 125(10):990–8. doi: 10.1007/s11547-020-01189-9
38. Alongi F, Fersino S, Mazzola R, Fiorentino A, Giaj-Levra N, Ricchetti F, et al. Radiation dose intensification in pre-operative chemo-radiotherapy for locally advanced rectal cancer. Clin Transl Oncol (2017) 19(2):189–96. doi: 10.1007/s12094-016-1522-0
39. Albano D, Messina C, Vitale J, Sconfienza LM. Imaging of sarcopenia: old evidence and new insights. Eur Radiol (2020) 30(4):2199–208. doi: 10.1007/s00330-019-06573-2
40. Brown JC, Caan BJ, Prado CM, Cespedes Feliciano EM, Xiao J, Kroenke CH, et al. The association of abdominal adiposity with mortality in patients with stage I-III colorectal cancer. J Natl Cancer Inst (2020) 112(4):377–83. doi: 10.1093/jnci/djz150
41. Hilmi M, Jouinot A, Burns R, Pigneur F, Mounier R, Gondin J, et al. Body composition and sarcopenia: The next-generation of personalized oncology and pharmacology? Pharmacol Ther (2019) 196:135–59. doi: 10.1016/j.pharmthera.2018.12.003
42. De Nardi P, Giani A, Maggi G, Braga M. Relation between skeletal muscle volume and prognosis in rectal cancer patients undergoing neoadjuvant therapy. World J Gastrointest Oncol (2022) 14(2):423–33. doi: 10.4251/wjgo.v14.i2.423
43. Takeda Y, Akiyoshi T, Matsueda K, Fukuoka H, Ogura A, Miki H, et al. Skeletal muscle loss is an independent negative prognostic factor in patients with advanced lower rectal cancer treated with neoadjuvant chemoradiotherapy. PloS One (2018) 13(4):e0195406. doi: 10.1371/journal.pone.0195406
44. Miyamoto Y, Baba Y, Sakamoto Y, Ohuchi M, Tokunaga R, Kurashige J, et al. Sarcopenia is a negative prognostic factor after curative resection of colorectal cancer. Ann Surg Oncol (2015) 22(8):2663–8. doi: 10.1245/s10434-014-4281-6
45. Bedrikovetski S, Traeger L, Price TJ, Carruthers S, Selva-Nayagam S, Moore JW, et al. Can sarcopenia predict complete response after total neoadjuvant therapy in advanced rectal cancer? A multicentre observational cohort study. J Surg Oncol (2023) 128(1):75–84. doi: 10.1002/jso.27251
46. Olmez T, Ofluoglu CB, Sert OZ, Keser SH, Gulmez S, Senger AS, et al. The impact of sarcopenia on pathologic complete response following neoadjuvant chemoradiation in rectal cancer. Langenbecks Arch Surg (2020) 405(8):1131–8. doi: 10.1007/s00423-020-01983-z
47. Prado CM, Lima IS, Baracos VE, Bies RR, McCargar LJ, Reiman T, et al. An exploratory study of body composition as a determinant of epirubicin pharmacokinetics and toxicity. Cancer Chemother Pharmacol (2011) 67(1):93–101. doi: 10.1007/s00280-010-1288-y
48. Dodson S, Baracos VE, Jatoi A, Evans WJ, Cella D, Dalton JT, et al. Muscle wasting in cancer cachexia: clinical implications, diagnosis, and emerging treatment strategies. Annu Rev Med (2011) 62:265–79. doi: 10.1146/annurev-med-061509-131248
49. Papadopoulou SK, Papadimitriou K, Voulgaridou G, Georgaki E, Tsotidou E, Zantidou O, et al. Exercise and nutrition impact on osteoporosis and sarcopenia-the incidence of osteosarcopenia: A narrative review. Nutrients (2021) 13(12):4499. doi: 10.3390/nu13124499
50. Abe S, Nozawa H, Kawai K, Sasaki K, Murono K, Emoto S, et al. Poor nutrition and sarcopenia are related to systemic inflammatory response in patients with rectal cancer undergoing preoperative chemoradiotherapy. Int J Colorectal Dis (2022) 37(1):189–200. doi: 10.1007/s00384-021-04039-w
51. Grivennikov SI, Greten FR, Karin M. Immunity, inflammation, and cancer. Cell (2010) 140:883–99. doi: 10.1016/j.cell.2010.01.025
52. Chiloiro G, Romano A, Mariani S, Macchia G, Giannarelli D, Caravatta L, et al. Predictive and prognostic value of inflammatory markers in locally advanced rectal cancer (PILLAR) - A multicentric analysis by the Italian Association of Radiotherapy and Clinical Oncology (AIRO) Gastrointestinal Study Group. Clin Transl Radiat Oncol (2023) 9:100579. doi: 10.1016/j.ctro.2023.100579
53. Liu M, Feng Y, Zhang Y, Liu H. Evaluation of neutrophil-lymphocyte ratio and platelet-lymphocyte ratio on predicting responsiveness to neoadjuvant chemoradiotherapy in locally advanced rectal cancer patients. BioMed Res Int (2022) 2022:3839670. doi: 10.1155/2022/3839670
54. Sun Y, Huang Z, Chi P. An inflammation index-based prediction of treatment response to neoadjuvant chemoradiotherapy for rectal mucinous adenocarcinoma. Int J Clin Oncol (2020) 25(7):1299–307. doi: 10.1007/s10147-020-01670-5
55. An SH, Kim IY. Can pretreatment platelet-to-lymphocyte and neutrophil-to-lymphocyte ratios predict long-term oncologic outcomes after preoperative chemoradiation followed by surgery for locally advanced rectal cancer? Ann Coloproctol (2022) 38(3):253–61. doi: 10.3393/ac.2021.00633.0090
56. Colloca G, Venturino A, Guarneri D. Neutrophil-to-lymphocyte ratio predicts survival of patients with rectal cancer receiving neo-adjuvant chemoradiation followed by radical resection: a meta-analysis. Expert Rev Anticancer Ther (2023) 23(4):421–9. doi: 10.1080/14737140.2023.2194635
57. Enkhbaatar NE, Inoue S, Yamamuro H, Kawada S, Miyaoka M, Nakamura N, et al. MR imaging with apparent diffusion coefficient histogram analysis: evaluation of locally advanced rectal cancer after chemotherapy and radiation therapy. Radiology (2018) 288(1):129–37. doi: 10.1148/radiol.2018171804
58. Yoo GS, Park HC, Yu JI, Choi DH, Cho WK, Park YS, et al. Carcinoembryonic antigen improves the performance of magnetic resonance imaging in the prediction of pathologic response after neoadjuvant chemoradiation for patients with rectal cancer. Cancer Res Treat (2020) 52(2):446–54. doi: 10.4143/crt.2019.261
Keywords: rectal cancer, neoadjuvant chemoradiotherapy, pathological complete response, body composition parameters, blood biomarkers, magnetic resonance imaging
Citation: Yang J, Deng Q, Chen Z, Chen Y and Fu Z (2023) Body composition parameters combined with blood biomarkers and magnetic resonance imaging predict responses to neoadjuvant chemoradiotherapy in locally advanced rectal cancer. Front. Oncol. 13:1242193. doi: 10.3389/fonc.2023.1242193
Received: 18 June 2023; Accepted: 08 November 2023;
Published: 22 November 2023.
Edited by:
Sharon R. Pine, University of Colorado Anschutz Medical Campus, United StatesReviewed by:
Anton A. Plekhanov, Privolzhsky Research Medical University (PIMU), RussiaFrancesco Ricchetti, Sacro Cuore Don Calabria Hospital (IRCCS), Italy
Copyright © 2023 Yang, Deng, Chen, Chen and Fu. This is an open-access article distributed under the terms of the Creative Commons Attribution License (CC BY). The use, distribution or reproduction in other forums is permitted, provided the original author(s) and the copyright owner(s) are credited and that the original publication in this journal is cited, in accordance with accepted academic practice. No use, distribution or reproduction is permitted which does not comply with these terms.
*Correspondence: Zhongxue Fu, Znp4MTk5OTA1MjFAMTI2LmNvbQ==