 Baohong Wen1†
 Zanxia Zhang1†
 Jing Zhu1
 Liang Liu1Zijun Liu1
 Xiaoyue Ma1Kaiyu Wang2
 Lizhi Xie2
 Yong Zhang1*
 Jingliang Cheng1*
- 1Department of MRI, the First Affiliated Hospital of Zhengzhou University, Zhengzhou, China
- 2MR Research China, GE Healthcare, Beijing, China
Background: Preoperative classification of head and neck (HN) tumors remains challenging, especially distinguishing early cancerogenic masses from benign lesions. Synthetic MRI offers a new way for quantitative analysis of tumors. The present study investigated the application of synthetic MRI and stimulus and fast spin echo diffusion-weighted imaging with periodically rotated overlapping parallel lines with enhanced reconstruction (FSE-PROPELLER DWI) to differentiate malignant from benign HN tumors.
Materials and methods: Forty-eight patients with pathologically confirmed HN tumors were retrospectively recruited between August 2022 and October 2022. The patients were divided into malignant (n = 28) and benign (n = 20) groups. All patients were scanned using synthetic MRI and FSE-PROPELLER DWI. T1, T2, and proton density (PD) values were acquired on the synthetic MRI and ADC values on the FSE-PROPELLER DWI.
Results: Benign tumors (ADC: 2.03 ± 0.31 × 10⁻³ mm2/s, T1: 1741.13 ± 662.64 ms, T2: 157.43 ± 72.23 ms) showed higher ADC, T1, and T2 values compared to malignant tumors (ADC: 1.46 ± 0.37 × 10⁻³ mm2/s, T1: 1390.06 ± 241.09 ms, T2: 97.64 ± 14.91 ms) (all P<0.05), while no differences were seen for PD values. ROC analysis showed that T2+ADC (cut-off value, > 0.55; AUC, 0.950) had optimal diagnostic performance vs. T1 (cut-off value, ≤ 1675.84 ms; AUC, 0.698), T2 (cut-off value, ≤ 113.24 ms; AUC, 0.855) and PD (cut off value, > 80.67 pu; AUC, 0.568) alone in differentiating malignant from benign lesions (all P<0.05); yet, the difference in AUC between ADC and T2+ADC or T2 did not reach statistical significance.
Conclusion: Synthetic MRI and FSE-PROPELLER DWI can quantitatively differentiate malignant from benign HN tumors. T2 value is comparable to ADC value, and T2+ADC values could improve diagnostic efficacy., apparent diffusion coeffificient, head and neck tumors
Highlights
- Synthetic MRI, FSE-PROPELLER DWI, and the combination of the two methods can all be used to quantitatively diagnose differential head and neck (HN) tumors.
- Synthetic MRI could constitute a new adjunct in diagnosing HN tumors.
- Synthetic MRI is comparable to FSE-PROPELLER DWI.
- The combined effect of the two methods was better than synthetic MRI used alone.
1 Introduction
Head and neck (HN) cancer is the 6th most common cancer and the 9th most common cause of cancer-related death (1, 2). Surgery is the most effective treatment for managing primary HN cancer. Yet, many patients present with advanced-stage tumors at the time of diagnosis and thus require more invasive treatment, including radiochemotherapy, immunotherapy, and targeted therapy (3). Also, diagnosis remains challenging considering its specific location (masses originating from the larynx, the nasopharynx, oropharynx, oral cavity hypopharynx, salivary glands, etc.). In addition, HN cancer might cause various symptoms that commonly accompany benign conditions (1). Thus, the differentiation of benign from cancerous masses is very important.
Tissue biopsy and pathologic examination remain the gold standard for evaluating the nature of HN lesions; nevertheless, only a part of the tissue can be obtained using this method. In addition, this approach is invasive and not always well accepted by the patient (4).
Endoscopy, head MRI, computed tomography (CT of the sinuses and head, dental cone beam CT), panoramic dental x-ray, and positron emission tomography (PET)/CT or chest imaging are the most common imaging methods used to assess the HN region. MRI is frequently used to detect, differentiate, grade, or draw the extent of HN tumors (1, 5). Among different MRI models, diffusion-weighted imaging (DWI) can quantitatively evaluate the Brownian motion diffusion of water molecules in tissues at a cellular level expressed as an apparent diffusion coefficient (ADC). DWI with a single-shot echo-planar sequence (SS-EP-DWI), which is commonly applied to investigate HN regions (6), is sensitive to chemical shifts, signal loss and geometric distortion, metallic dental implant-related magnetic susceptibility artifacts, and motion artifacts (7). Moreover, stimulus and fast spin echo DWI with periodically rotated overlapping parallel lines with enhanced reconstruction (FSE-PROPELLER DWI) is useful to distinguish parotid pleomorphic adenoma from Warthin tumor with less distortion of tumors than SS-EP-DWI (7). However, the value of FSE-PROPELLER DWI in distinguishing malignant from benign HN tumors has not been fully explored.
The major limitations of DWI include low signal-to-noise ratios and prolonged acquisition time. Over the years, a new synthetic MRI sequence based on a quantitative approach has been developed. This tool can estimate absolute physical properties, proton density (PD), and longitudinal and transverse relaxation times (T1, T2), which are independent of the MRI scanners or scanning parameters at a given field strength (8). Also, quantitative values (PD, T1, and T2) can be simultaneously acquired on the synthetic MRI, which enables a significant reduction in examination time with good accuracy and reproducibility for use in clinical practice (individual patient follow-up and comparison analysis (9–11). This approach has been used in the study of multiple systemic diseases of the brain (12), knee (13), spine (14), prostate (15), breast (16), bladder (17), and nasopharynx (18).
In this study, we further assessed the value of synthetic MRI in differentiating malignant from benign HN tumors compared with FSE-PROPELLER DWI and a combination of these two methods. To the best of our knowledge, this is the first study that focused on synthetic MRI and FSE-PROPELLER DWI to characterize HN tumors.
2 Materials and methods
2.1 Patients
MRI data from 48 consecutive patients (mean age ± standard deviation [SD], 48.08 years ± 15.01 [range, 18–76 years]) with HN tumors who were treated at our hospital between August 2022 and October 2022 were collected. The inclusion criteria were: (1) no tumor treatments before MR examinations; (2) all pathological examinations of samples were obtained by surgical resection or biopsy of the tumor; (3) synthetic MRI and FSE-PROPELLER DWI were acquired before surgical resection and biopsy; (4) the maximum tumor diameter was ≥ 6 millimeters. The exclusion criteria were: (1) MR images with obvious artifacts and poor quality; (2) patients previously treated. Subjects were divided into benign and malignant groups.
This study was approved by our institutional review board. Informed consent was waived.
2.2 Data collection
Demographic data included gender and age. All MRI acquisitions were performed on a 3T MR scanner (Premier, GE Healthcare, Milwaukee, WI, USA) in a supine position with a 21-channel head-neck coil. The following sequences were acquired in this study: axial T1-weighted image (T1WI), T2-weighted image (T2WI), synthetic MRI, and FSE-PROPELLER DWI with two b-values (0 and 800s/mm2). Detailed acquisition parameters are listed in Table 1.
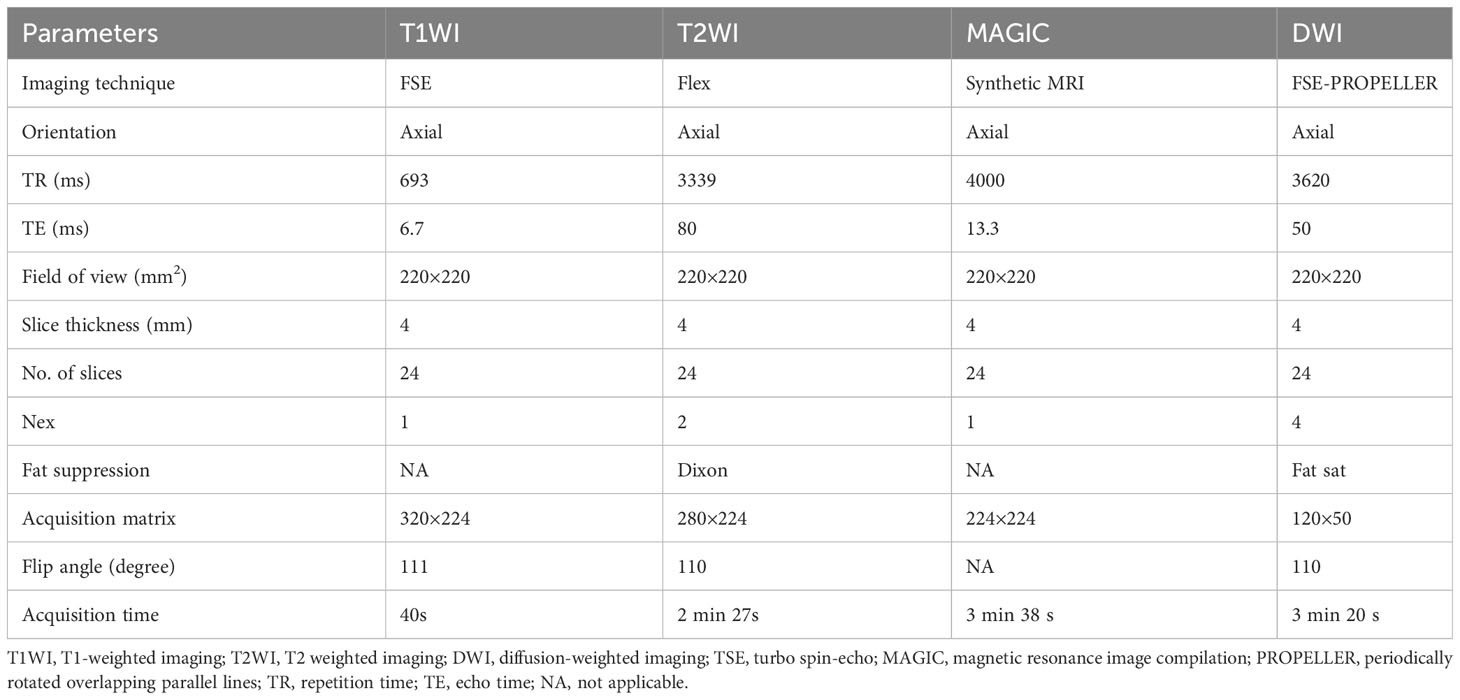
Table 1 MRI Sequence Parameters.
2.3 Image analysis
Acquired data from synthetic MRI sequences were analyzed using magnetic resonance image compilation (MAGIC) software. Then, quantitative T1, T2, and PD maps were created and used for measurements to yield synthetic images and match the conventional images (19). The two radiologists (with 10 and 8 years of experience in head and neck MR imaging independently analyzed MR images) who were blind to the grouping manually drew the regions of interest (ROIs) on synthetic T2WI to obtain the PD, T1, and T2 values. Postprocessing of FSE-PROPELLER DWI was performed using the ADW 4.7 workstation (GE Healthcare). The axial routine MR images and DWI were used as references. ROIs were drawn on synthetic T2WI and ADC maps with care by avoiding necrosis, cystic degeneration, and bleeding areas at the slice with the largest tumor diameter and directly colocalized on the T1, T2, and PD maps. The size of ROIs was >25 mm2. Two radiologists measured three times. The average value was obtained by both radiologists in the analysis. Additionally, the largest lesion was selected for analysis if more than one HN lesion were present.
2.4 Statistical analysis
Shapiro-Wilk test was used to assess normality, while Levene’s test was used for variance homogeneity. The normally distributed variables were expressed as the means ± SD. Non-normally distributed variables were expressed as medians (interquartile ranges, IQRs). Differences in sex between the two groups were compared using a chi-square test. An independent samples t-test was used to compare the discrepancy in age between the two groups. The intraclass correlation coefficient (ICC) was used to assess the intraobserver agreement for quantitative parameters (19): value <0.40, 0.41-0.59, 0.60-0.74, and ≥0.75 indicated poor, fair, good, and excellent consistency, respectively. Pearson’s correlation coefficient was used to evaluate the correlation among parameters. The receiver operating characteristic (ROC) curve was conducted, and the area under the curve (AUC), sensitivity, specificity, negative predictive value (NPV), and positive predictive value (PPV) were further calculated to ascertain the diagnostic performance of quantitative parameters for differentiating malignant from the benign HN tumors. The diagnostic value of the combined ADC and T2 values (T2+ADC) was based on the logistic regression analysis. The method developed by DeLong et al. (20) was applied to compare AUCs. Statistical analysis was performed using MedCalc statistical software (version 19.6, MedCalc) and SPSS software (version 17.0, Chicago, IL, USA). P < 0.05 was considered statistically significant.
3 Results
3.1 General data
A total of 48 patients with histologically diagnosed HN tumors were assessed. Demographics are listed in Tables 2 and 3. In addition, representative images of benign and malignant tumors are depicted in Figures 1 and 2. There was no difference in age (t = -1.392, P > 0.05) and gender between the two groups (χ2 = 0.689, P = 0.406).
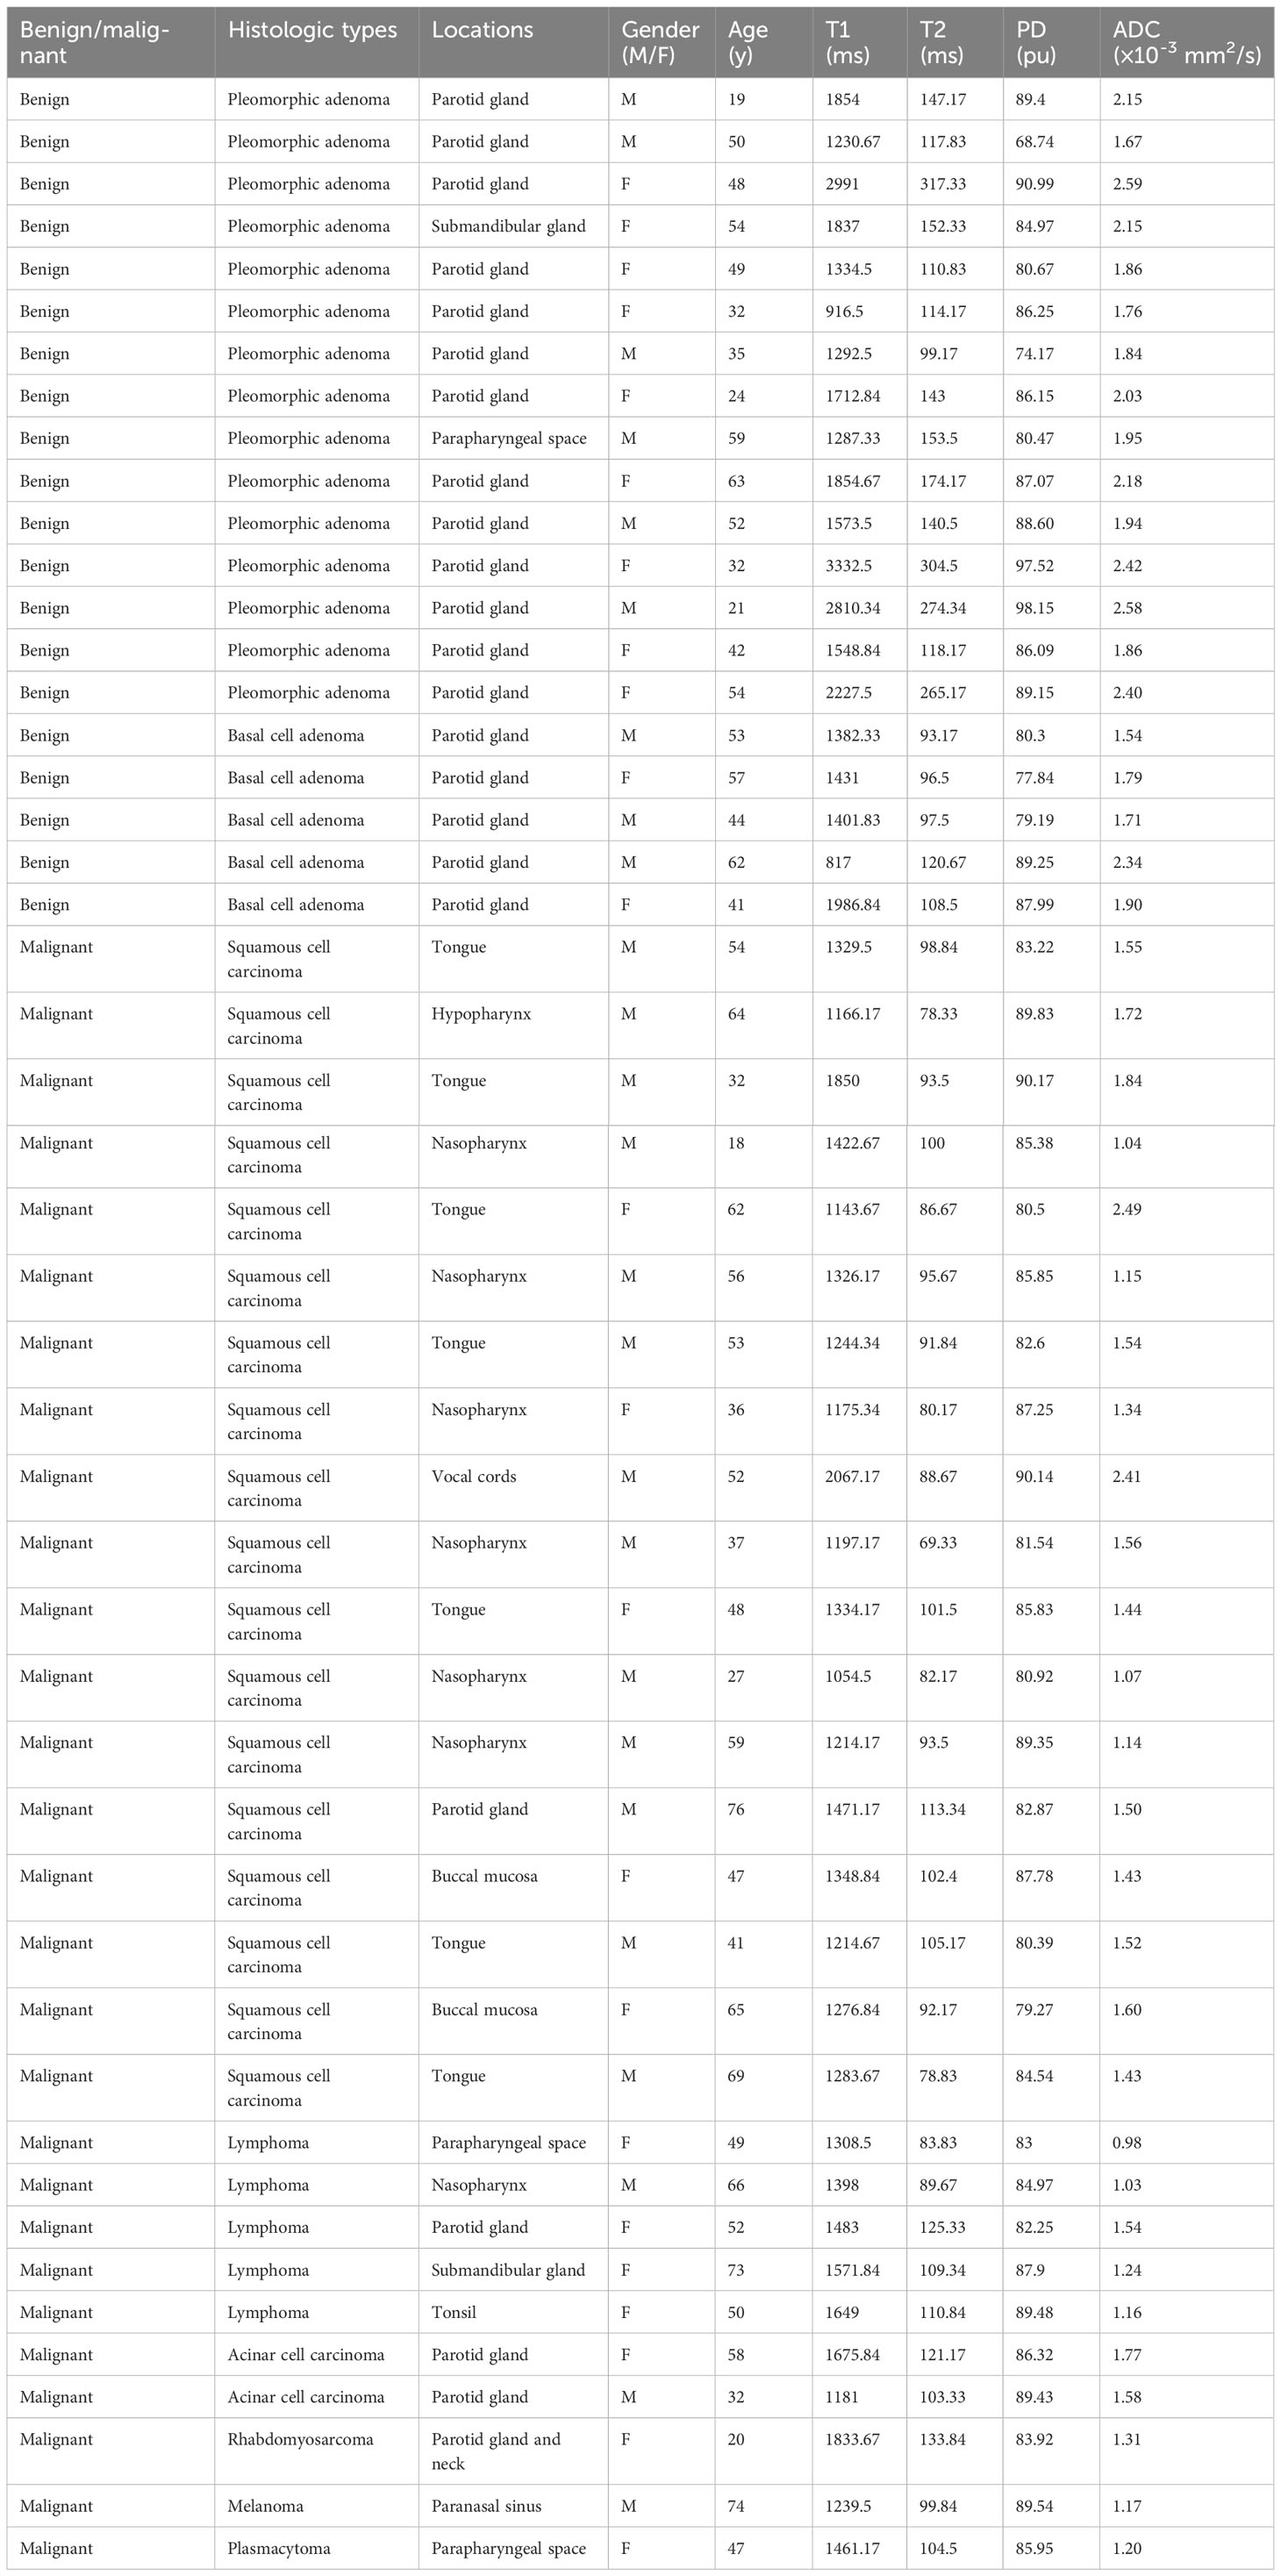
Table 2 Histologic types and locations of head and neck tumors.
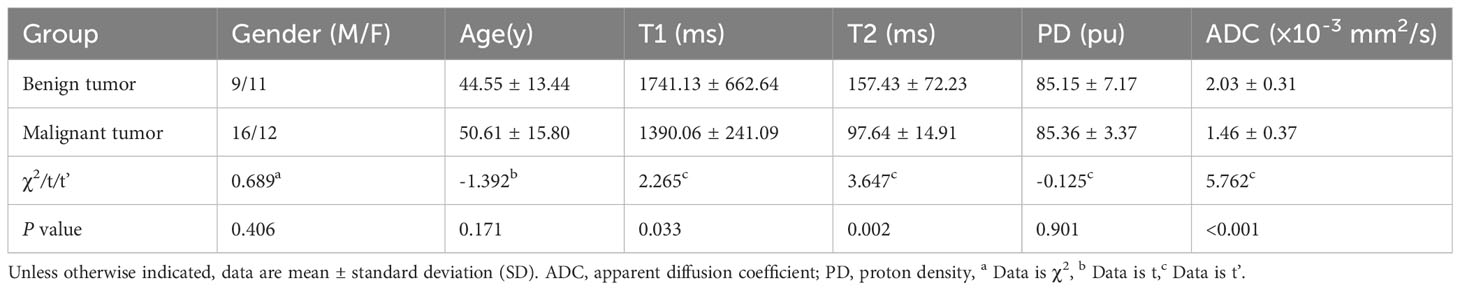
Table 3 Demographics and the parameters of patients with head and neck tumors.
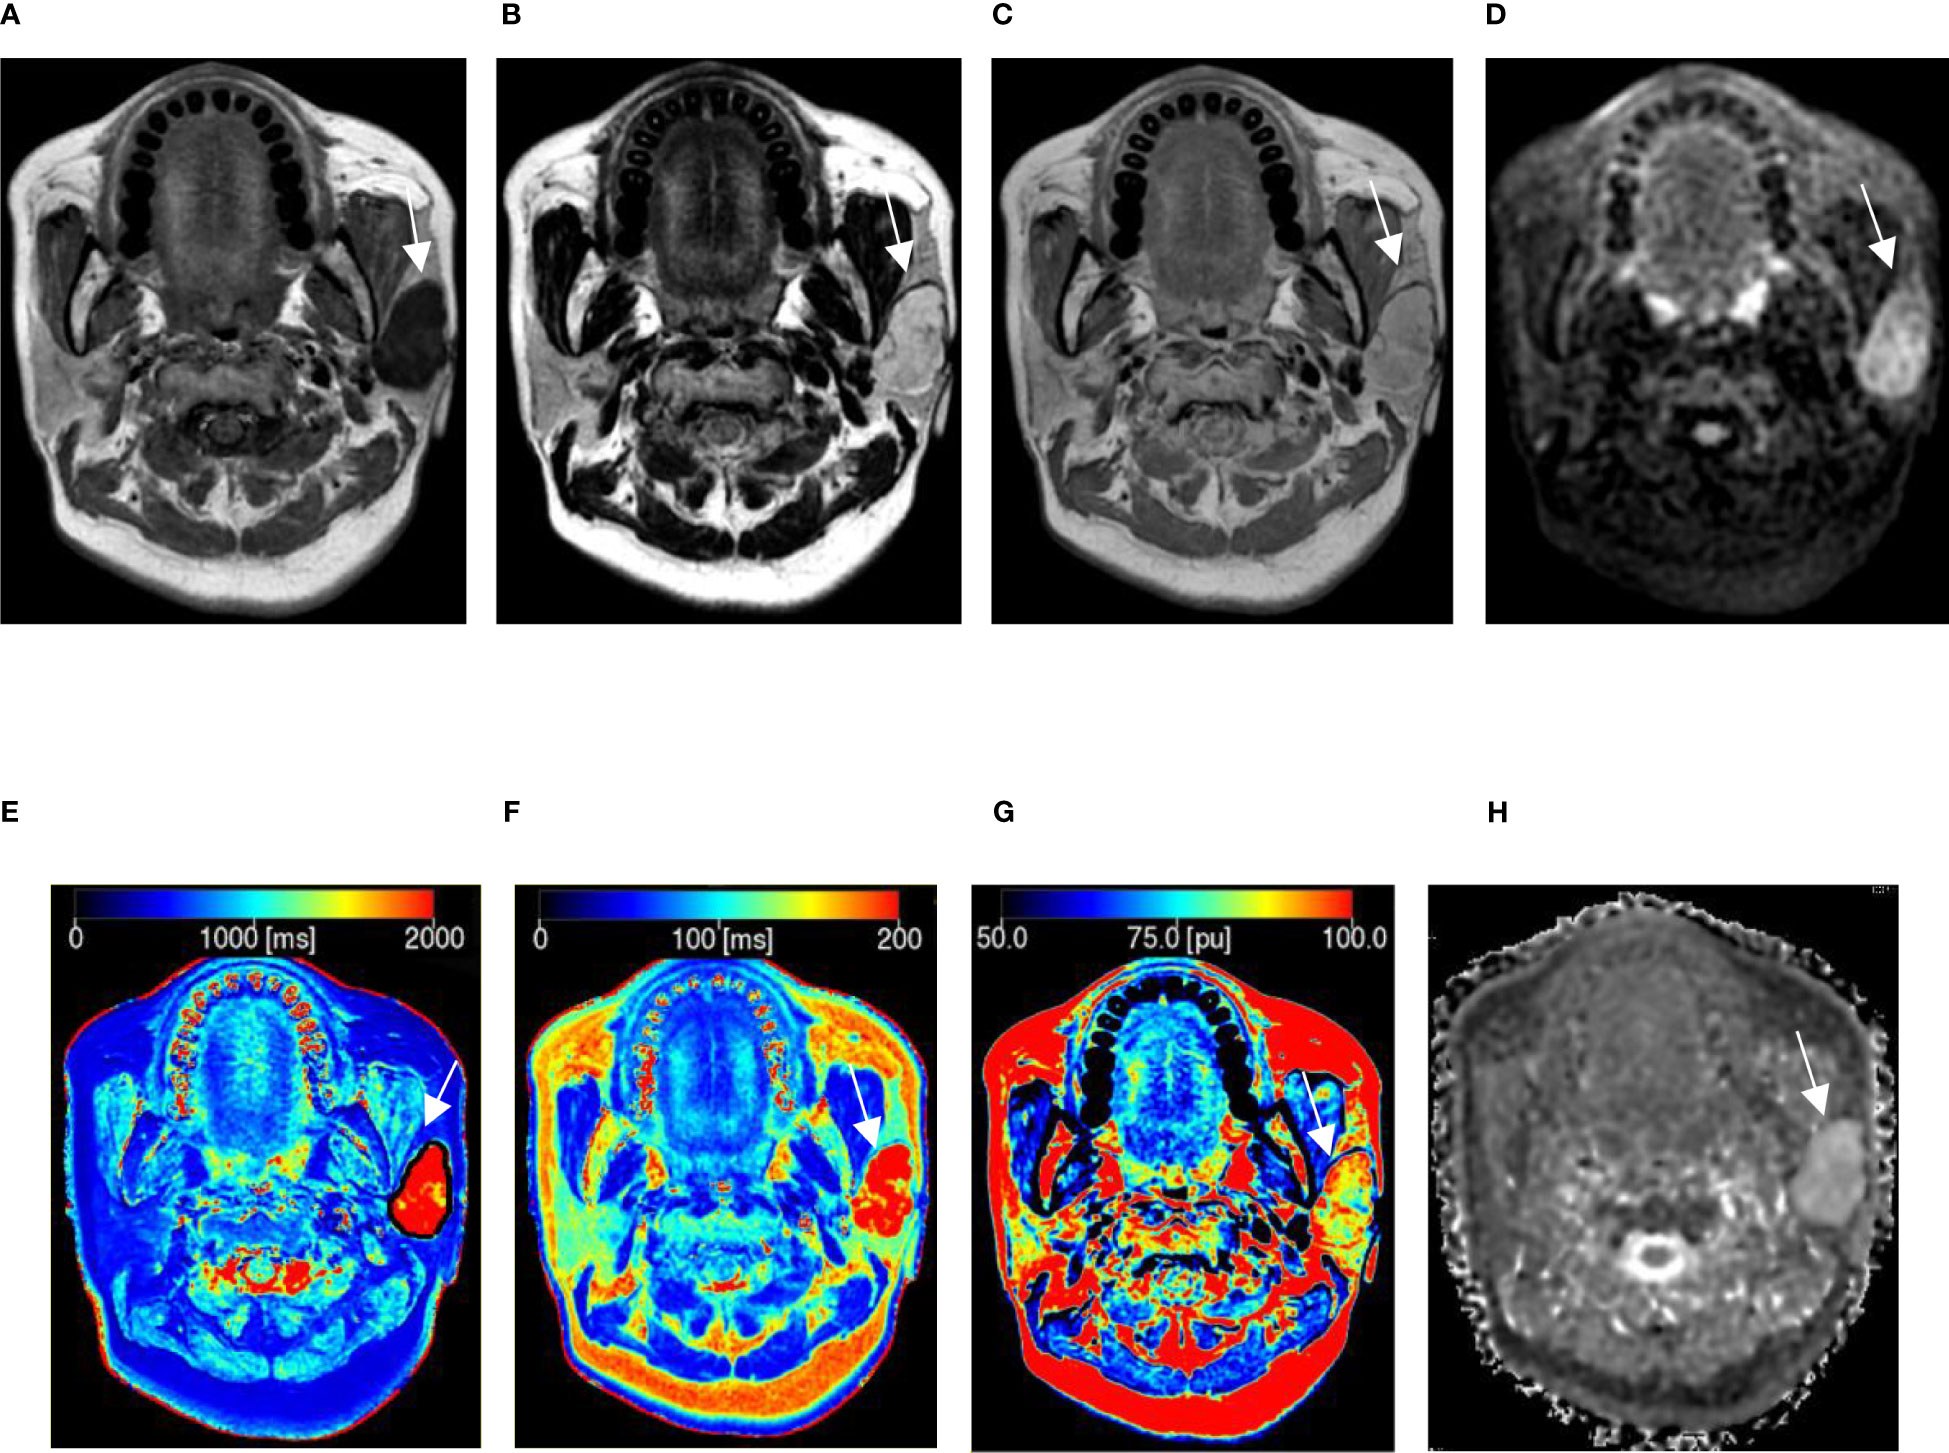
Figure 1 A 54-year-old woman with pleomorphic adenoma in the left parotid gland. (A–C) Proton density (PD), T1, and T2 images obtained from synthetic MRI. (D) Stimulus and fast spin echo diffusion-weighted imaging with periodically rotated overlapping parallel lines with enhanced reconstruction (b = 800 s/mm2). (E–G) Synthetic MRI-derived indicate that the mean T1, T2, and PD values measured by the two radiologists were 2227.50 ms, 265.17 ms, and 89.15 pu, respectively. (H) ADC map indicates that the mean apparent diffusion coefficient (ADC) value measured by the two radiologists was 2.40 × 10⁻³ mm2/s.
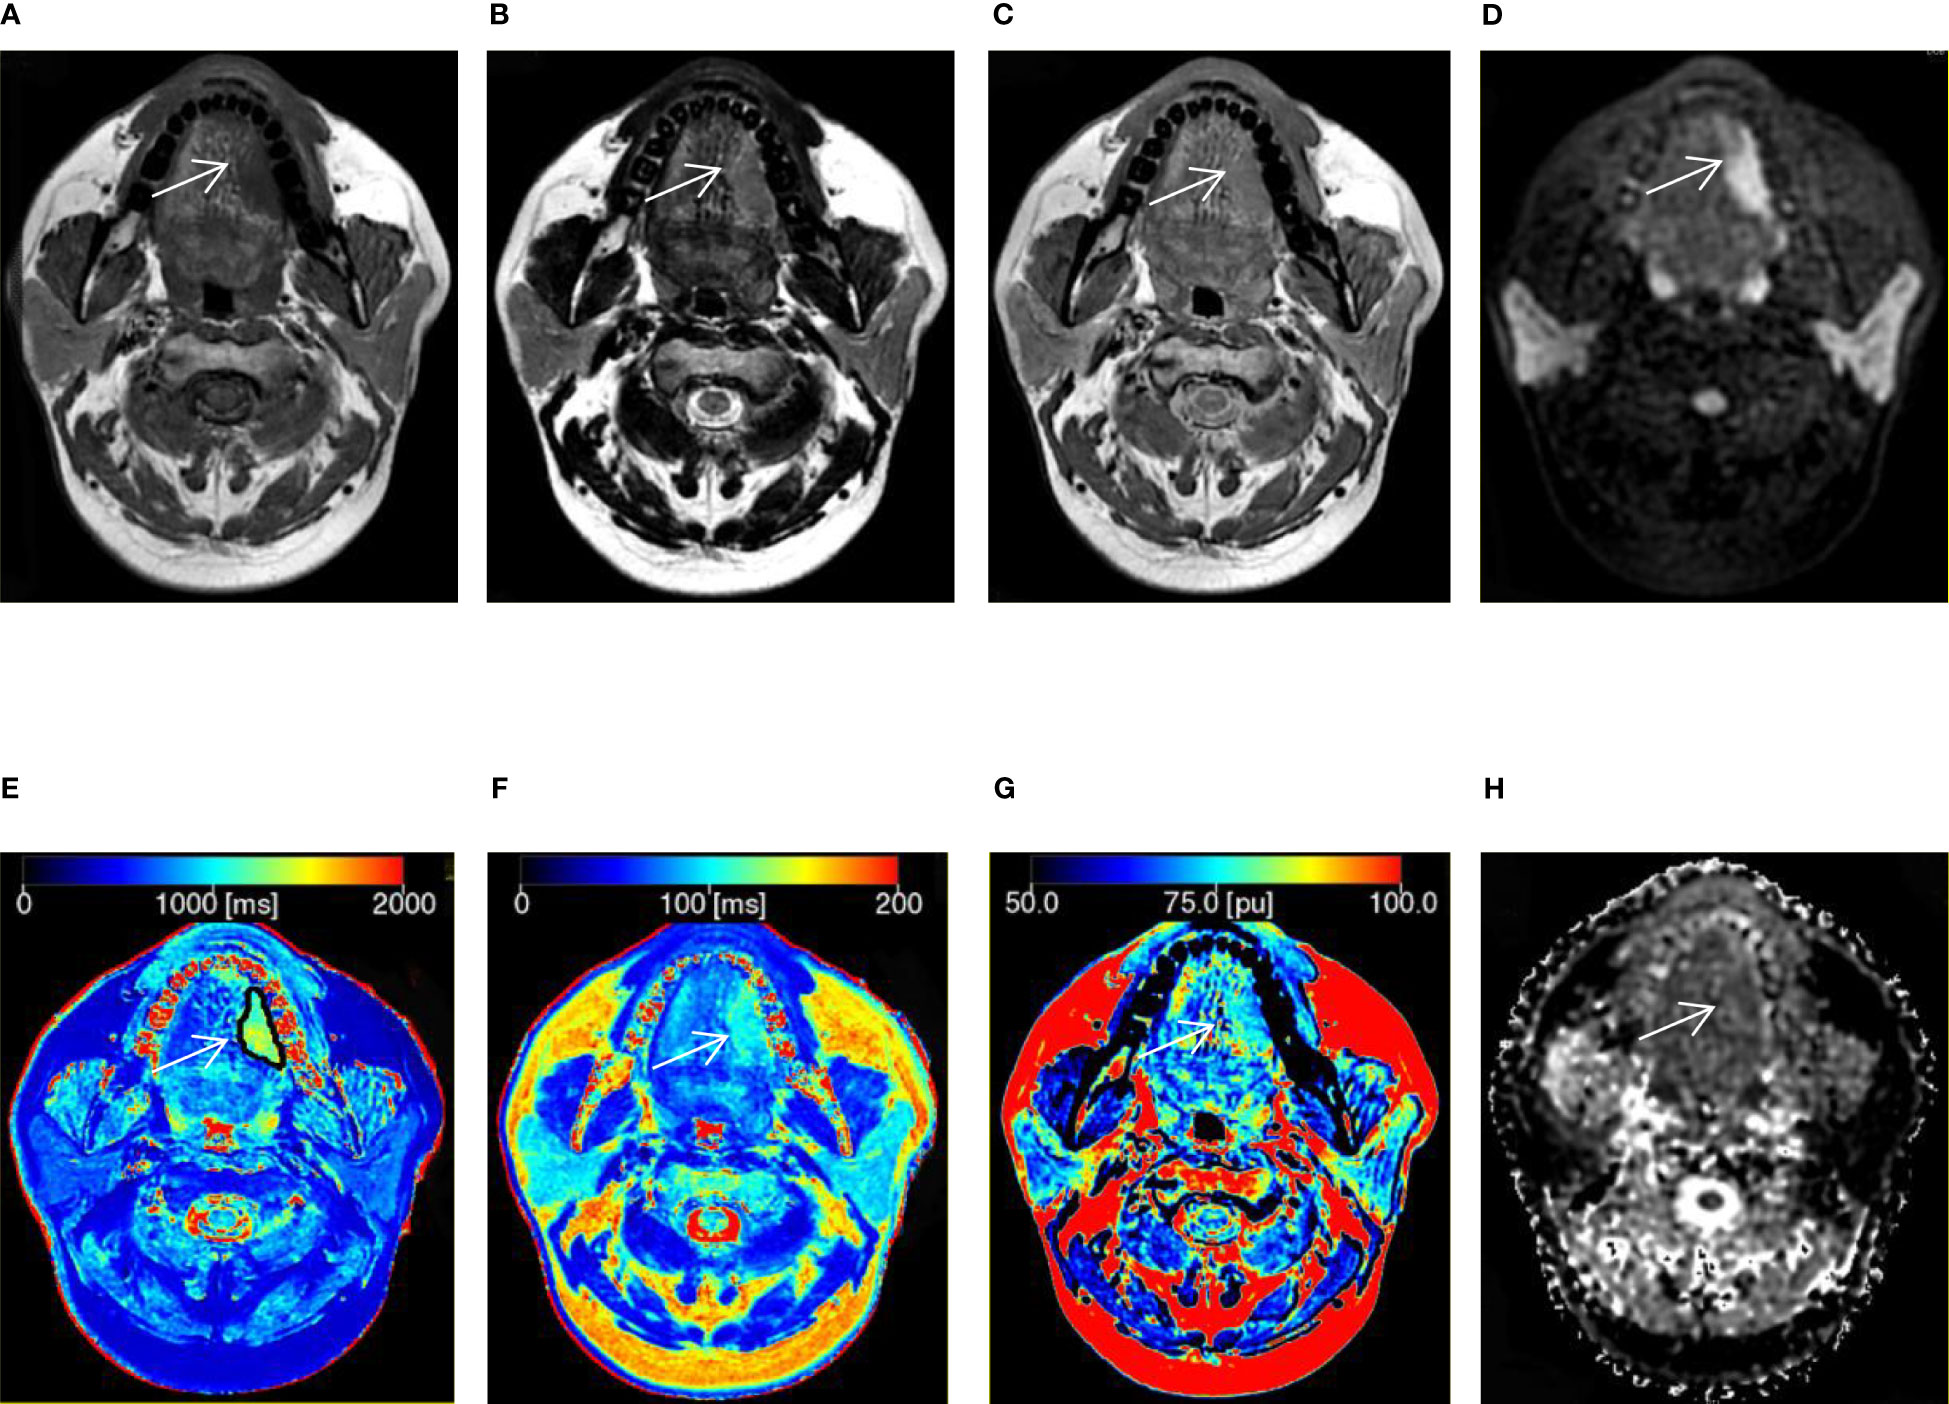
Figure 2 A 41-year-old man with squamous cell carcinoma in the tongue. (A–C) T1, T2, and proton density (PD) weighted images obtained from synthetic MRI. (D) Stimulus and fast spin echo diffusion-weighted imaging with periodically rotated overlapping parallel lines with enhanced reconstruction (b = 800 s/mm2). (E–G) Synthetic MRI-derived maps indicate that the mean T1, T2, and PD values measured by the two radiologists were 1214.67 ms, 105.17 ms, and 80.39 pu, respectively. (H) ADC map indicates that the mean apparent diffusion coefficient (ADC) value measured by the two radiologists was 1.52 × 10⁻³ mm2/s.
3.2 Interobserver reliability
ICC analyses showed excellent consistency in the ADC, T1, T2, and PD values assessed by the two physicians: the ICC values were 0.976 (95% CI 0.958 - 0.987, P = 0.000), 0.936 (95% CI 0.988 - 0.997, P = 0.000), 0.996 (95% CI 0.993 - 0.998, P 0.001), and 0.823 (95% CI 0.706 - 0.897, P = 0.000), respectively.
3.3 Correlation analysis
Pearson’s correlation analysis showed a significant positive correlation between the T1 and T2 values (r = 0.854, P < 0.001), T1 and PD values (r = 0.574, P < 0.001), T1 and ADC values (r = 0.565, P < 0.001), T2 and PD values (r = 0.495, P < 0.001), and T2 and ADC values (r = 0.646, P< 0.001), respectively. There was no significant positive correlation between PD and ADC values (r = 0.281, P = 0.053).
3.4 MRI values between the two groups
The T1 value (1741.13 ± 662.64ms), T2 value (157.43 ± 72.23ms), and ADC value (2.03 ± 0.31 × 10⁻³ mm2/s) of the benign group was higher compared to the malignant group (T1: 1390.06 ± 241.09ms, t’ = 2.265, P = 0.033; T2: 97.64 ± 14.91ms, t’ = 3.647, P = 0.002; ADC: 1.46 ± 0.37 × 10⁻³ mm2/s, t' = 5.762, P < 0.001). Yet, no significant differences were found in PD values between the two groups (t’ = -0.125, P = 0.901).
3.5 Comparison of ROC curves
The AUC, cut-off, sensitivity, specificity, PPV, and NPV of each parameter discriminating malignant from benign lesions are summarized in Table 4.
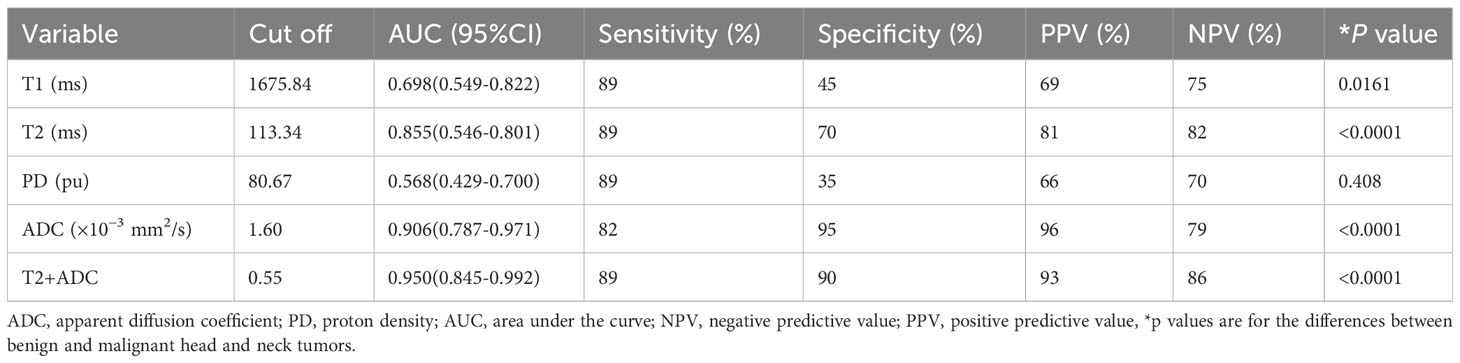
Table 4 Diagnostic performance of MRI values and combined values for differentiating malignant from benign lesions.
ROC curves for differentiating malignant from benign lesions are depicted in Figure 3. T2+ADC (cut-off value, > 0.55; AUC, 0.950) showed optimal diagnostic performance, which was better than that of T1 (cut-off value, ≤ 1675.84 ms; AUC, 0.698), T2 (cut-off value, ≤ 113.24 ms; AUC, 0.855) and PD (cut off value, > 80.67 pu; AUC, 0.568) (P = 0.0030, 0.0464, and P < 0.0001, respectively). The diagnostic performance of ADC was better than T1 and PD (P = 0.0138 and 0.0005, respectively), but the difference in AUC between ADC (cut-off value, ≤ 1.60 × 10⁻³ mm2/s; AUC, 0.906) and T2+ADC or T2 did not reach significance (P = 0.2648 and 0.4604, respectively). The diagnostic performance of T2 was better than PD (P = 0.0075); however, the difference in AUC between T2 and T1 did not reach statistical significance (P = 0.0549).
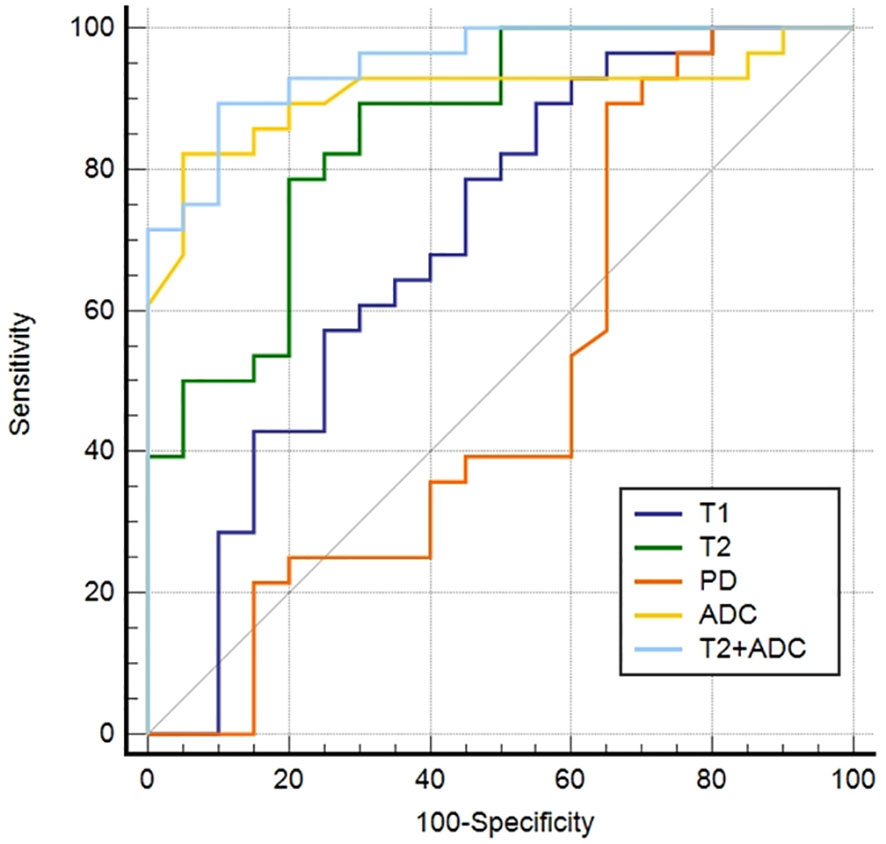
Figure 3 Receiver operating characteristic curves of the parameters derived from synthetic MRI and fast spin echo diffusion-weighted imaging with periodically rotated overlapping parallel lines with enhanced reconstruction in differentiating malignant from the benign head and neck tumors.
4 Discussion
We examined the tissue magnetic property parameters acquired on the synthetic MRI with MAGIC and ADC acquired on the FSE-PROPELLER DWI in discriminating malignant from benign HN lesions. The purpose of evaluating parameter correlation is to identify preferred parameters and facilitate the translation of scientific research into clinical practice. Except for PD values, T1, T2, and ADC values were lower in malignant than in benign HN tumors. ADC, T1, and T2 values are widely used parameters for differentiating malignant from benign HN tumors. The diagnostic performance of the T2 value is comparable to the ADC value. However, the diagnostic performance of the T1 and PD values was not as good as that of the ADC value. We also found that T2+ADC showed optimal diagnostic performance.
In this study, the malignant tumor had a lower T1 value related to hyper-cellularity, smaller extracellular space, and lower free water content (18). Meng et al. found that the T1 value for nasopharyngeal carcinoma was significantly lower than that for benign hyperplasia in the nasopharynx, regardless of the ROI used (18). Contrary Gao and his team found no difference in the T1 values between malignant and benign breast lesions (21). The different types of tumors in these studies may contribute to the discrepancy.
T2 value can be affected by various factors, including the main magnetic field strength and the intrinsic properties of the tissue and the environment. Tissue water content is the most important influencing factor (22). A previous study reported a linear relationship between the T2 value and water content (23); thus, increased T2 values indicate increased tissue water content (24). In our study, 75% of benign HN tumors were pleomorphic adenomas followed by basal cell adenomas, and 64% of malignant HN tumors were squamous cell carcinomas followed by lymphomas. We speculate that the higher T2 values of benign HN tumors could be ascribed to their tissue composition, lower cell density, and higher free water content (5). Nevertheless, the lower T2 values in malignant tumors are due to the increased solid components, smaller extracellular spaces, and lower free water content (5, 18, 25). Several studies have reported higher T2 values in benign breast lesions vs. in malignant lesions (21). This difference could be attributed to increased tissue water content or interaction between water and alkaline metal cations in the pathological tissue (22).
PD value, which primarily reflects the water content in tissue, is frequently used in brain imaging (26). This study found that the difference in PD value in the malignant compared with benign HN tumors was not statistically significant. Yet, Gao et al. demonstrated that the PD value was significantly lower in malignant than that benign breast lesions (21). The different types of tumors enrolled in these studies may contribute to the contradiction.
Here we found that the ADC values of malignant tumors were significantly lower than those of benign tumors. Higher ADC values correlate with lower cellularity (27). Malignant tumors demonstrate lower ADC values than benign tumors due to their relatively higher cellularity (4). Srinivasan et al. also found that malignant lesions showed lower ADC values than benign lesions (28).
In this study, the overall diagnostic performance of synthetic MRI-derived parameters in discriminating malignant from the benign HN lesions was inferior to the ADC value. However, the diagnostic performance showed no significant differences between ADC and T2 values. Also, T2+ADC showed optimal diagnostic efficacy in distinguishing malignant from benign tumors; T2+ADC showed a significantly higher differential performance vs. T1, T2, or PD value alone, but it did not improve the diagnostic performance of the ADC value. Despite this, the PD, T1, and T2 are intrinsic magnetic properties and independent from the MRI scanners or scanning parameters at a given field strength (15), predicting the potential advantage of using synthetic MRI-derived parameters compared to the ADC value alone (17). In addition, synthetic MRI can generate multiple contrast-weighted images and quantification maps in a single scan, greatly improving work efficiency (10). Thus, synthetic MRI plus FSE-PROPELLER DWI might be a promising tool for differentiating benign from malignant HN lesions.
The present study has a few limitations. First, this is a single-center retrospective study with small sample size, next, we will expand the sample size for further study. Second, ROIs were manually drawn at the slice with the largest tumor diameter, leading to potential operator errors. In the future, the whole tumor should be selected to determine whether the tumor volume is more meaningful and accurate for tumor characterizing. Finally, test-retest repeatability was not assessed.
5 Conclusion
The quantitative T1, T2, and PD values obtained by synthetic MRI and ADC value obtained by FSE-PROPELLER DWI helped discriminate malignant from benign HN tumors. The overall diagnostic performance of synthetic MRI was inferior to FSE-PROPELLER DWI. However, the T2 value was comparable to the ADC value, and the combination of synthetic MRI and FSE-PROPELLER DWI could provide improved diagnostic efficacy.
Data availability statement
The raw data supporting the conclusions of this article will be made available by the authors, without undue reservation.
Author contributions
BW: Conceptualization, Methodology, Software, Data curation, Writing - original draft, Visualization, Investigation, Writing - review & editing. ZZ: Data curation, Writing - original draft, Visualization, Investigation, Writing - review & editing. JZ: data analysis, statistical analysis. LL: Data curation. ZL: Data curation, Writing - original draft. XM: Visualization, Investigation. KW: Conceptualization, Methodology, Software, Writing - review & editing. LX: Conceptualization, Methodology, Software, Validation, Writing - review & editing. YZ: Supervision. JC: Supervision. All authors contributed to the article and approved the submitted version.
Funding
Henan Medical Science and Technology Research Plan (LHGJ20190157) supported this study.
Acknowledgments
We are particularly grateful to everyone who helped us with our article. This work was supported by the First Affiliated Hospital of Zhengzhou University, especially the Department of MRI.
Conflict of interest
The authors declare that the research was conducted in the absence of any commercial or financial relationships that could be construed as a potential conflict of interest.
Publisher’s note
All claims expressed in this article are solely those of the authors and do not necessarily represent those of their affiliated organizations, or those of the publisher, the editors and the reviewers. Any product that may be evaluated in this article, or claim that may be made by its manufacturer, is not guaranteed or endorsed by the publisher.
Abbreviations
ADC, apparent diffusion coefficient; AUC, area under the curve; DWI, diffusion-weighted imaging; EPI, echo-planar imaging; FOV, field of view; FSE, fast spin echo; ICC, intraclass correlation coefficient; MAGIC, magnetic resonance image compilation; NA, not applicable; NPV, negative predictive value; PD, proton density; PPV, positive predictive value; PROPELLER, periodically rotated overlapping parallel lines with enhanced reconstruction; ROC, receiver operating characteristic; ROI, region of interest; SS, single-shot; T1, longitudinal relaxation time; T2, transverse relaxation time; T1WI, T1-weighted imaging; T2WI, T2-weighted imaging; TE, echo time; TR, repetition time; TSE, turbo spin-echo.
References
1. Law BKH, King AD, Ai QY, Poon DMC, Chen W, Bhatia KS, et al. Head and neck tumors: Amide proton transfer MRI. Radiology (2018) 288:782–90. doi: 10.1148/radiol.2018171528
2. Noij DP, Martens RM, Marcus JT, de Bree R, Leemans CR, Castelijns JA, et al. Intravoxel incoherent motion magnetic resonance imaging in head and neck cancer: A systematic review of the diagnostic and prognostic value. Oral Oncol (2017) 68:81–91. doi: 10.1016/j.oraloncology.2017.03.016
3. Siegel RL, Miller KD, Jemal A. Cancer statistics, 2017. CA Cancer J Clin (2017) 67:7–30. doi: 10.3322/caac.21387
4. Payabvash SMD. Quantitative diffusion magnetic resonance imaging in head and neck tumors. Quant Imaging Med Surg (2018) 8:1052–65. doi: 10.21037/qims.2018.10.14
5. Baohong W, Jing Z, Zanxia Z, Kun F, Liang L, Eryuan G, et al. T2 mapping and readout segmentation of long variable echo-train diffusion-weighted imaging for the differentiation of parotid gland tumors. Eur J Radiol (2022) 151:110265. doi: 10.1016/j.ejrad.2022.110265
6. Cheng J, Shao S, Chen W, Zheng N. Application of diffusion kurtosis imaging and dynamic contrast-enhanced magnetic resonance imaging in differentiating benign and Malignant head and neck lesions. J Magn Reson Imaging (2022) 414–23. doi: 10.1002/jmri.27885
7. Liu YJ, Lee YH, Chang HC, Chung HW, Wang CW, Juan CH, et al. Imaging quality of PROPELLER diffusion-weighted MR imaging and its diagnostic performance in distinguishing pleomorphic adenomas from Warthin tumors of the parotid gland. NMR BioMed (2020) 33:e4282. doi: 10.1002/nbm.4282
8. Granberg T, Uppman M, Hashim F, Cananau C, Nordin LE, Shams S, et al. Clinical feasibility of synthetic MRI in multiple sclerosis: A diagnostic and volumetric validation study. AJNR Am J Neuroradiol (2016) 37:1023–9. doi: 10.3174/ajnr.A4665
9. Park S, Kwack KS, Lee YJ, Gho SM, Lee HY. Initial experience with synthetic MRI of the knee at 3T: Comparison with conventional T1 weighted imaging and T2 mapping. Br J Radiol (2017) 90:20170350. doi: 10.1259/bjr.20170350
10. Krauss W, Gunnarsson M, Andersson T, Thunberg P. Accuracy and reproducibility of a quantitative magnetic resonance imaging method for concurrent measurements of tissue relaxation times and proton density. Magn Reson Imaging (2015) 33:584–91. doi: 10.1016/j.mri.2015.02.013
11. Boudabbous S, Neroladaki A, Bagetakos I, Hamard M, Delattre BM, Vargas MI. Feasibility of synthetic MRI in knee imaging in routine practice. Acta Radiol Open (2018) 7:205846011876968. doi: 10.1177/2058460118769686
12. Betts AM, Leach JL, Jones BV, Zhang B, Serai S. Brain imaging with synthetic MR in children: clinical quality assessment. Neuroradiology (2016) 58:1017–26. doi: 10.1007/s00234-016-1723-9
13. Chougar L, Hagiwara A, Andica C, Hori M, Aoki S. Synthetic MRI of the knee: New perspectives in musculoskeletal imaging and possible applications for the assessment of bone marrow disorders. Br J Radiol (2018) 91:20170886. doi: 10.1259/bjr.20170886
14. Zhang W, Zhu J, Xu X, Fan G. Synthetic MRI of the lumbar spine at 3.0 T: feasibility and image quality comparison with conventional MRI. Acta Radiol (2020) 61:461–70. doi: 10.1177/0284185119871670
15. Cui Y, Han S, Liu M, Wu PY, Zhang W, Zhang J, et al. Diagnosis and grading of prostate cancer by relaxation maps from synthetic MRI. J Magn Reson Imaging (2020) 52:552–64. doi: 10.1002/jmri.27075
16. Jung Y, Gho SM, Back SN, Ha T, Kang DK, Kim TH. The feasibility of synthetic MrI in breast cancer patients: Comparison of T 2 relaxation time with multiecho spin echo T 2 mapping method. Br J Radiol (2019) 92:20180479. doi: 10.1259/bjr.20180479
17. Cai Q, Wen Z, Huang Y, Li M, Ouyang L, Ling J, et al. Investigation of synthetic magnetic resonance imaging applied in the evaluation of the tumor grade of bladder cancer. J Magn Reson Imaging (2021) 54:1989–97. doi: 10.1002/jmri.27770
18. Meng T, He H, Liu H, Lv X, Huang C, Zhong L, et al. Investigation of the feasibility of synthetic MRI in the differential diagnosis of non-keratinising nasopharyngeal carcinoma and benign hyperplasia using different contoured methods for delineation of the region of interest. Clin Radiol (2021) 76:238.e9–238.e15. doi: 10.1016/j.crad.2020.10.010
19. Matsuda M, Fukuyama N, Matsuda T, Kikuchi S, Shiraishi Y, Takimoto Y, et al. Utility of synthetic MRI in predicting pathological complete response of various breast cancer subtypes prior to neoadjuvant chemotherapy. Clin Radiol (2022) 77:855–63. doi: 10.1016/j.crad.2022.06.019
20. DeLong ER, DeLong DM, Clarke-Pearson DL. Comparing the areas under two or more correlated receiver operating characteristic curves: a nonparametric approach. Biometrics (1988) 44:837–45.
21. Gao W, Zhang S, Guo J, Wei X, Li X, Diao Y, et al. Investigation of synthetic relaxometry and diffusion measures in the differentiation of benign and Malignant breast lesions as compared to BI-RADS. J Magn Reson Imaging (2021) 53:1118–27. doi: 10.1002/jmri.27435
22. Liu L, Yin B, Shek K, Geng D, Lu Y, Wen J, et al. Role of quantitative analysis of T2 relaxation time in differentiating benign from Malignant breast lesions. J Int Med Res (2018) 46:1928–35. doi: 10.1177/0300060517721071
23. Chaland B, Mariette F, Marchal P, De Certaines J. 1H nuclear magnetic resonance relaxometric characterization of fat and water states in soft and hard cheese. J Dairy Res (2000) 67:609–18. doi: 10.1017/S0022029900004398
24. Lüssea S, Claassen H, Gehrke T, Hassenpflug J, Schünke M, Heller M, et al. Evaluation of water content by spatially resolved transverse relaxation times of human articular cartilage. Magn Reson Imaging (2000) 18:423–30. doi: 10.1016/S0730-725X(99)00144-7
25. Wu Q, Zhu LN, Jiang JS, Bu SS, Xu XQ, Wu FY. Characterization of parotid gland tumors using T2 mapping imaging: initial findings. Acta Radiol (2020) 61:629–35. doi: 10.1177/0284185119875646
26. Gracien RM, Reitz SC, Hof SM, Fleischer V, Zimmermann H, Droby A, et al. Changes and variability of proton density and T1 relaxation times in early multiple sclerosis: MRI markers of neuronal damage in the cerebral cortex. Eur Radiol (2016) 26:2578–86. doi: 10.1007/s00330-015-4072-x
27. Chen L, Liu M, Bao J, Xia Y, Zhang J, Zhang L, et al. The correlation between apparent diffusion coefficient and tumor cellularity in patients: A meta-analysis. PloS One (2013) 8:e79008. doi: 10.1371/journal.pone.0079008
Keywords: synthetic, magnetic resonance imaging, diffusion-weighted image, apparent diffusion coefficient, head and neck tumors
Citation: Wen B, Zhang Z, Zhu J, Liu L, Liu Z, Ma X, Wang K, Xie L, Zhang Y and Cheng J (2023) Synthetic MRI plus FSE-PROPELLER DWI for differentiating malignant from benign head and neck tumors: a preliminary study. Front. Oncol. 13:1225420. doi: 10.3389/fonc.2023.1225420
Received: 24 May 2023; Accepted: 04 September 2023;
Published: 27 September 2023.
Edited by:
Zhimin Li, Northwestern University, United StatesReviewed by:
Han Lv, Capital Medical University, ChinaGuolin Ma, China-Japan Friendship Hospital, China
Ruiyang Zhao, GE Healthcare, United States
Copyright © 2023 Wen, Zhang, Zhu, Liu, Liu, Ma, Wang, Xie, Zhang and Cheng. This is an open-access article distributed under the terms of the Creative Commons Attribution License (CC BY). The use, distribution or reproduction in other forums is permitted, provided the original author(s) and the copyright owner(s) are credited and that the original publication in this journal is cited, in accordance with accepted academic practice. No use, distribution or reproduction is permitted which does not comply with these terms.
*Correspondence: Yong Zhang, enp1emhhbmd5b25nMjAxM0AxNjMuY29t; Jingliang Cheng, ZmNjY2hlbmdqbEB6enUuZWR1LmNu
†These authors have contributed equally to this work