 Jian Xiong
 Junyuan Chen
 Zhongming Guo3
 Chaoyue Zhang
 Kefei Gao
95% of researchers rate our articles as excellent or good
Learn more about the work of our research integrity team to safeguard the quality of each article we publish.
Find out more
ORIGINAL RESEARCH article
Front. Oncol. , 18 July 2023
Sec. Cancer Immunity and Immunotherapy
Volume 13 - 2023 | https://doi.org/10.3389/fonc.2023.1224071
This article is part of the Research Topic Novel Immune Markers and Predictive Models for Immunotherapy and Prognosis in Breast and Gynecological Cancers View all 16 articles
Background: To explore the underlying mechanism of programmed cell death (PCD)-related genes in patients with endometrial cancer (EC) and establish a prognostic model.
Methods: The RNA sequencing data (RNAseq), single nucleotide variation (SNV) data, and corresponding clinical data were downloaded from TCGA. The prognostic PCD-related genes were screened and subjected to consensus clustering analysis. The two clusters were compared by weighted correlation network analysis (WGCNA), immune infiltration analysis, and other analyses. The least absolute shrinkage and selection operator (LASSO) algorithm was used to construct the PCD-related prognostic model. The biological significance of the PCD-related gene signature was evaluated through various bioinformatics methods.
Results: We identified 43 PCD-related genes that were significantly related to prognoses of EC patients, and classified them into two clusters via consistent clustering analysis. Patients in cluster B had higher tumor purity, higher T stage, and worse prognoses compared to those in cluster A. The latter generally showed higher immune infiltration. A prognostic model was constructed using 11 genes (GZMA, ASNS, GLS, PRKAA2, VLDLR, PRDX6, PSAT1, CDKN2A, SIRT3, TNFRSF1A, LRPPRC), and exhibited good diagnostic performance. Patients with high-risk scores were older, and had higher stage and grade tumors, along with worse prognoses. The frequency of mutations in PCD-related genes was correlated with the risk score. LRPPRC, an adverse prognostic gene in EC, was strongly correlated with proliferation-related genes and multiple PCD-related genes. LRPPRC expression was higher in patients with higher clinical staging and in the deceased patients. In addition, a positive correlation was observed between LRPPRC and infiltration of multiple immune cell types.
Conclusion: We identified a PCD-related gene signature that can predict the prognosis of EC patients and offer potential targets for therapeutic interventions.
Endometrial cancer (EC) was the sixth most common cancer diagnosed in women in 2020, with a total of 417,000 new cases documented worldwide. The median age of diagnosis of EC patients is 61 years, and the lifetime risk of EC is around 3% (1). EC is associated with a high mortality rate, and over 76,000 women die annually as a result of EC (2). The mortality rate due to EC further increases with advanced tumor stage, invasive histology, and metastasis (3). There is currently a paucity of biomarkers or models that can effectively predict the prognosis and survival of EC patients (4). Therefore, it is crucial to elucidate the molecular mechanisms underlying EC occurrence and progression in order to identify novel prognostic markers and therapeutic targets.
Cell death plays a crucial role in several biological processes, and can be classified as programmed cell death (PCD) and accidental cell death (ACD) (5). PCD is the culmination of ordered, gene-controlled pathways following the spontaneous loss of cellular function, whereas ACD is an uncontrolled process that is triggered in response to certain harmful stimuli. PCD is primarily responsible for maintaining intracellular homeostasis (6). Various types of PCD have been documented so far, including autophagy-dependent cell death, necroptosis, apoptosis, ferroptosis, pyroptosis, entosis, parthanatos, NETosis, alkaliptosis, lysosome-dependent cell death (LCD), and oxeiptosis (7).
Lysosomal degradation during autophagy-mediated cell death facilitates metabolic adaptation and nutrient recycling (8). Necrosis has long been considered an involuntary form of cell death, although recent evidence indicates that necrosis can be initiated and sustained, resulting in necroptosis that centers around the formation of necrosomes (9, 10). Apoptosis is an intrinsic mechanism for eliminating damaged cells and involves a series of events including condensation, nucleolysis, and nuclear fragmentation, which culminate in the engulfment of apoptotic vesicles by macrophages (11). Ferroptosis is characterized by the accumulation of lipid hydroperoxides in an iron-dependent manner that ultimately reaches a lethal threshold (12, 13). Cuproptosis is a recently identified mode of PCD that is triggered by copper imbalance and is closely associated with disease progression (14). Pyroptosis is an inflammatory form of PCD that is typified by the creation of membrane pores that compromise cellular integrity, eventually leading to cell rupture (15). Entosis is a form of cell “cannibalism” wherein one live cell is engulfed and lysed by another cell without the activation of the apoptotic pathway (16). Parthanatos is induced by excessive activation of the nuclease PARP-1 (17), an RNA polymerase (RP) that interacts with and activates DNA or RNA, leading to replication or repair of damaged DNA and proteins. NETosis is initiated by the release of neutrophil extracellular traps (NETs), i.e., interconnected structures that cells release in response to infection or injury (18). Alkaliptosis, a newly recognized type of PCD, heavily relies on the intracellular alkalization process (19). LCD is dependent on hydrolase, which facilitates lysosomal transport to the cytoplasm by means of membrane penetration. This process is regulated by intracellular signaling systems and membrane proteins (20). KEAP1, a detector of reactive oxygen species (ROS), has recently been shown to be involved in a unique type of cell death known as oxygen apoptosis (21).
Mutations in the PCD pathways have been detected in the early stages of cancer, which endow the tumor cells with resistance to anti-cancer treatments (7). Therefore, targeted interventions that activate PCD pathways using single or combined therapies are an effective anti-cancer strategy. For instance, the FDA-approved BCL-2 inhibitor triggers apoptosis in lymphoma cells (22). In addition, activation of GSDME-mediated pyroptosis has proved to be highly effective against many cancers (23). Cancer cells can resist PD-1/PD-L1 checkpoint inhibition by blocking ferroptosis through the regulation of ferritin and other proteins (24), indicating that activation of the ferroptosis pathway in these cells can sensitize them to PD-1/PD-L1 blockers.
In this study, we used bioinformatic approaches to establish a PCD-related prognostic gene signature for EC and found that higher risk scores were associated with a worse prognosis. Our findings provide new insights into the molecular basis of EC progression. Furthermore, the genes associated with PCD have significant potential as prognostic biomarkers and therapeutic targets for EC.
The RNA sequencing (RNAseq), single nucleotide variation (SNV), and relevant clinical data of 544 tumor samples and 35 normal samples from TCGA-UCEC (Uterine Corpus Endometrial Carcinoma) were downloaded through the UCSC XENA website (https://xenabrowser.net/datapages/) and Sangerbox website (http://www.sangerbox.com/). TCGA-CESC (168 tumor samples) and TCGA-BRCA (1057 tumor samples) were downloaded from the UCSC XENA website (https://xenabrowser.net/datapages/) for external validation. The RNAseq data was transformed into fragments per kilobase of exon model per million mapped fragments (FPKM) format. In addition, the curated transcriptome data, SNV data, and corresponding clinical data of 12,591 patients across 32 cancer types were also retrieved from the UCSC XENA website (http://xena.ucsc.edu/). All transcriptomic data were transformed to the FPKM format for downstream analysis.
A list of PCD-related genes (Supplementary Table S1) was obtained through literature review and manual searching (7), and these genes were extracted from the TCGA-UCEC cohort. The prognostically relevant genes were screened through univariate Cox regression analysis using the “survival” package, and subjected to consensus clustering using the “ConsensusClusterPlus” package. The patients were accordingly divided into two clusters. The “limma” and “estimate” packages were used for scoring immune filtration, and the results were visualized using the “ComplexHeatmap”, “gplots”, “ggplot2”, “RColorBrewer” and “oompaBase” packages. The immune cell populations were characterized on the basis of classical markers, including immunoglobulin G (IgG), hematopoietic cell kinase (HCK), major histocompatibility complex class II (MHC-II), lymphocyte-specific kinase (LCK), activation transcription 1 (STAT1), interferons, TNF and B7-CD28 (CD28) (25). The scores of the immune cell subsets in both clusters were evaluated by ssGSEA. Weighted correlation network analysis (WGCNA) was performed using the “WGCNA” and “limma” packages, with cluster, age, stage, grade, and tumor mutation burden (TMB) as the factors. The gene modules with the strongest correlations with each factor were screened using abline=60 and soft threshold=4 as the criteria. Finally, the PCD-related genes were functionally annotated by GO analysis.
The “glmnet” package was used for LASSO analysis to select the PCD-related genes for the prognostic model. Although overfit potential generally exists in machine learning-based models, feature selection can effectively solve the overfitting problem because it can select the most relevant features from the original feature set, thus reducing the complexity and noise interference of the model. Common feature selection methods include Filter method, Wrapper method, and Embedded method. Among them, the Filter method sorts and filters according to the correlation between features and target variables. The wrapper method, by constantly trying different feature subsets, uses the model itself to evaluate and select the optimal subset. Embedded methods use feature selection as part of the model training process, such as LASSO and ridge regression. As our model is exactly based on the LASSO algorithm, the overfit potential could be avoided to some extent. The risk score was calculated by multiplying the expression of each gene with its respective coefficient:
The variable “n” represents the number of genes included in the signature, and the variable “β” denotes the coefficient assigned to each gene obtained from LASSO regression.
Risk score= [expression value of GZMA × (-0.116286998)] + [expression value of ASNS × (0.127252486)] + [expression value of GLS × (0.042654301)] + [expression value of PRKAA2 × (0.1310519)] + [expression value of VLDLR × (-0.114179696)] + [expression value of PRDX6 × (0.016522634)] + [expression value of PSAT1 × (0.016313951)] + [expression value of CDKN2A × (0.116960742)] + [expression value of SIRT3 × (-0.180170396)] + [expression value of TNFRSF1A × (-0.026584716)] +[expression value of LRPPRC × (0.055918364)]
According to the median risk score, patients were divided into high-risk and low-risk groups. The “survival” package was used to perform proportional hazards assumption testing and survival regression, and the “survminer” and “ggplot2” packages were used to plot the graphs. The diagnostic capability of PCD-related gene signature in the TCGA-UCEC cohort was evaluated by receiver operational characteristic (ROC) analysis using the “timeROC” package, and the results were visualized with the “ggplot2” package. All the samples with survival information were included in the ROC analysis. The number of samples was 544. The area under the curve (AUC) was calculated, and 0.7 was the cut-off for satisfactory diagnostic performance. The “ggplot2” package was used to visualize the risk factor plot. The prognostic model was tested on 32 types of cancer (Supplementary Table S2) using the “ggplot2”, “data.table”, “survival”, “cowplot” and “ggpub” packages. The prognostic endpoints of the patients included disease-specific survival (DSS), overall survival (OS), and progression-free interval (PFI).
Pan-cancer analysis on the top 10 mutated genes in the signature using the “ggplot2”, “data.table”, “cowplot”, “ggpubr”, “GSVA”, “SimDesign” and “tidyr” packages. The mutation frequencies of the PCD-related genes in the different organs were also calculated.
The “ComplexHeatmap” package was used to create a heatmap showing the relationship between the risk score and the clinical factors like age, grade, and stage. Gene set enrichment analysis (GSEA) was performed on the high-risk and low-risk groups, and the top 5 pathways in each group were identified. The “RColorBrewer” package was used to visualize the results. The “oncoPredict” package was used for drug sensitivity analysis.
The “survival” package was used to perform proportional hazards assumption testing and Cox regression analysis, and a nomogram consisting of age, stage, grade, and the PCD risk score was constructed using the “rms” package. The 1-, 3- and 5-year survival were predicted using the nomogram. Calibration curves for 1-, 3- and 5-year survival were plotted using the “rms” package. All the samples with survival information were included in the ROC analysis. The number of samples was 544.
The correlation between the PCD-related genes and proliferation-related genes (WNT5A, PCNA, MKI67, CTNNB1, and CDH1) was analyzed using the “ggplot2” package. LRPPRC was identified as the gene of interest. The “survival” and “survminer” packages were used to evaluate the prognostic relevance of LRPPRC, and analyze its expression across different clinical stages and OS events. The “igraph” and “ggraph” packages were used to analyze the pairwise correlation of genes within the PCD-related gene signature. Finally, the “ggplot2” package was used to visualize the association between LRPPRC and the infiltration of 24 immune cell types infiltration through Spearman correlation analysis.
R software (4.1.3) was used for statistical analyses. T-test was used to compare the data between the two groups. P value< 0.05 was considered statistically significant.
The workflow of our study is illustrated in Figure 1. We identified 43 PCD-related genes that were significantly correlated to the prognosis of EC patients (Supplementary Table S3), and the Forest plot of the genes with p<0.01 is shown in Figure 2A. Consensus clustering analysis of these 43 genes with 2-9 clusters showed that dividing the samples into two clusters resulted in better distinction (Figures 2B, C). Patients in Cluster B had higher tumor purity, more advanced T stage, and worse prognosis compared to those in Cluster A. The latter generally had higher ESTIMATEScore, ImmuneScore, and StromalScore (Supplementary Table S4). Furthermore, Cluster A was associated with high expression levels of IgG, HCK, MHC-II, LCK, B7-CD28, and TNF, whereas STAT1 and IFN were overexpressed in Cluster B (Figures 2D, E). Subsequently, ssGSEA showed distinct immune cell infiltration patterns of Cluster A and Cluster B (p<0.05). For instance, CD8+ T cells, cytolytic activity, inflammation-promoting, T-cell co-stimulation, etc. were significantly higher in Cluster A compared with Cluster B, whereas the latter had higher levels of aDCs, para inflammation, and Type I IFN response (Figure 2F). The results of WGCNA indicated that the brown module had a high degree of positive correlation with both Cluster and Grade, with correlation coefficients of 0.49 (p<0.05). You could see that the brown module had a high degree of positive correlation (0.49) with both Cluster and Grade. In the meanwhile, other modules were almost poorly or negatively correlated with Cluster and Grade. That is to say, the brown module shows high specificity for Cluster and Grade. Although the royal blue module had the strongest correlation with Cluster (with a related coefficient of 0.56, p<0.05), the low number of genes in the module was not representative. Therefore, we selected the brown module for further analysis (Figure 3A). The correlation scatter plot of Module Membership in the brown module (MM) and Gene significance for Cluster (GS) showed a highly positive correlation (with a correlation coefficient of 0.45, p=7.8*10-28), which suggested that the brown module genes were upregulated in Cluster B (Figure 3B). GO analysis indicated that the 43 prognosis-related PCD-related genes were significantly downregulated in the “lipid and atherosclerosis” pathway (Figure 3C; Table 1).
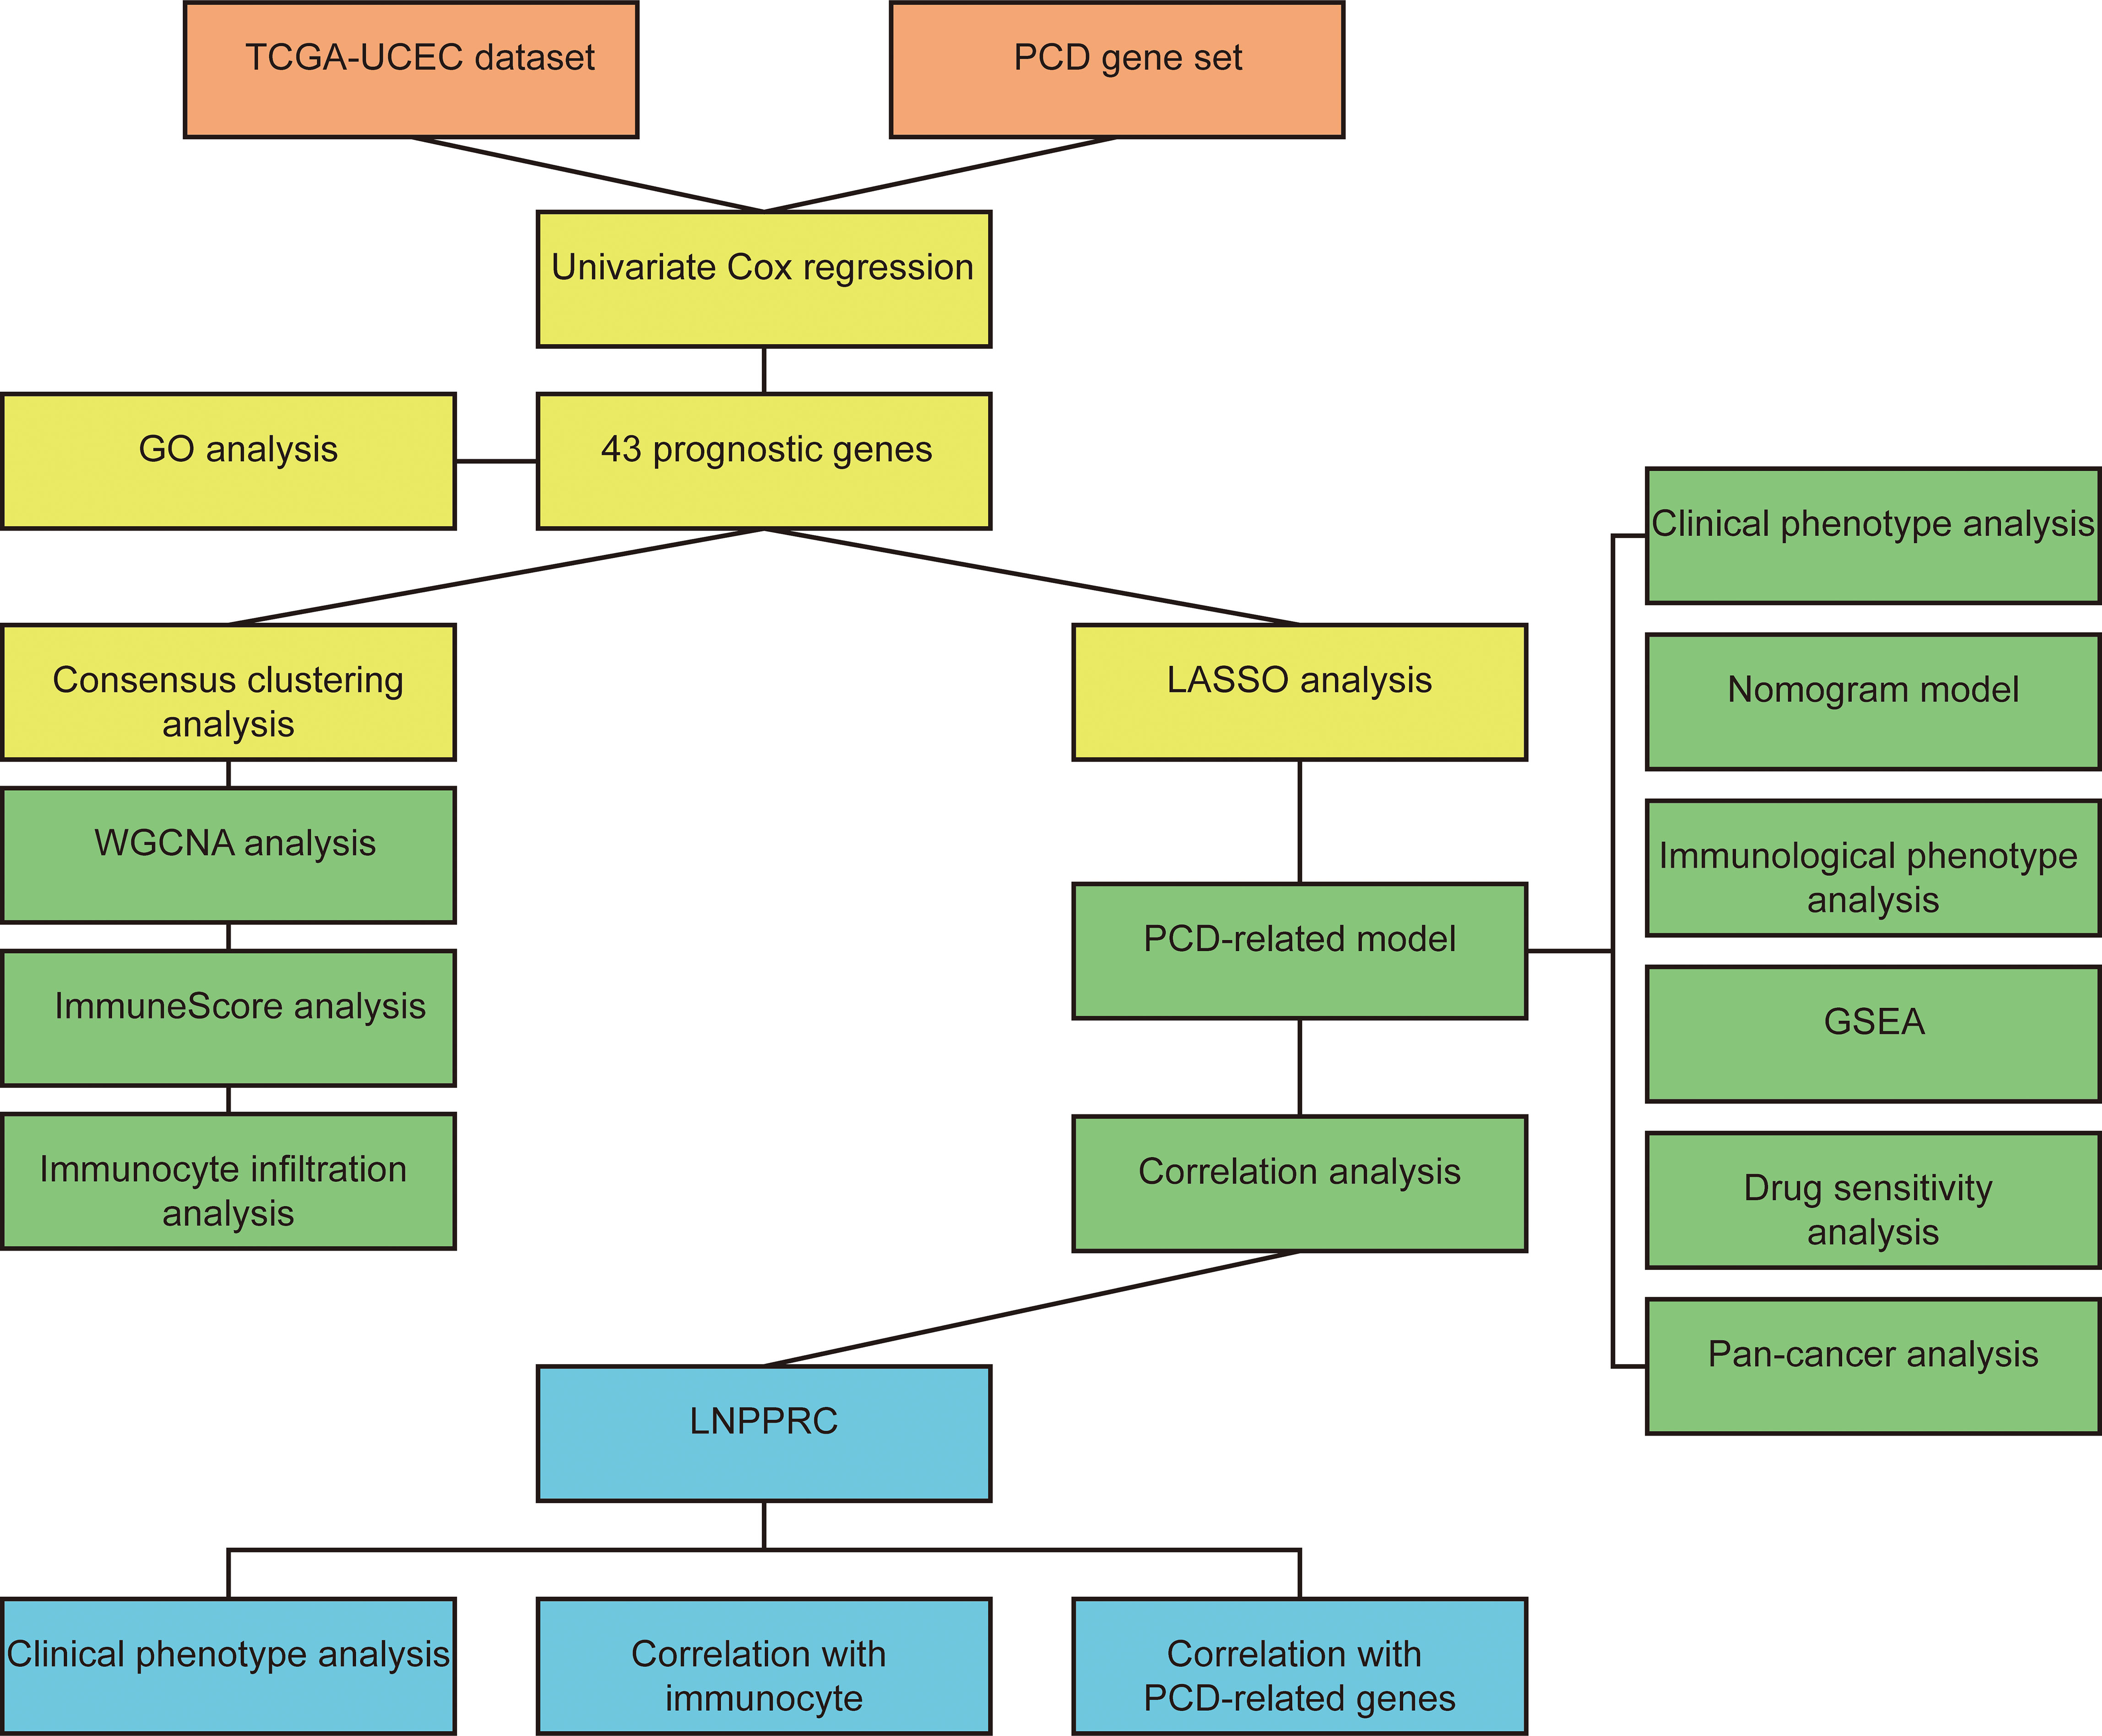
Figure 1 The workflow chart of the study.
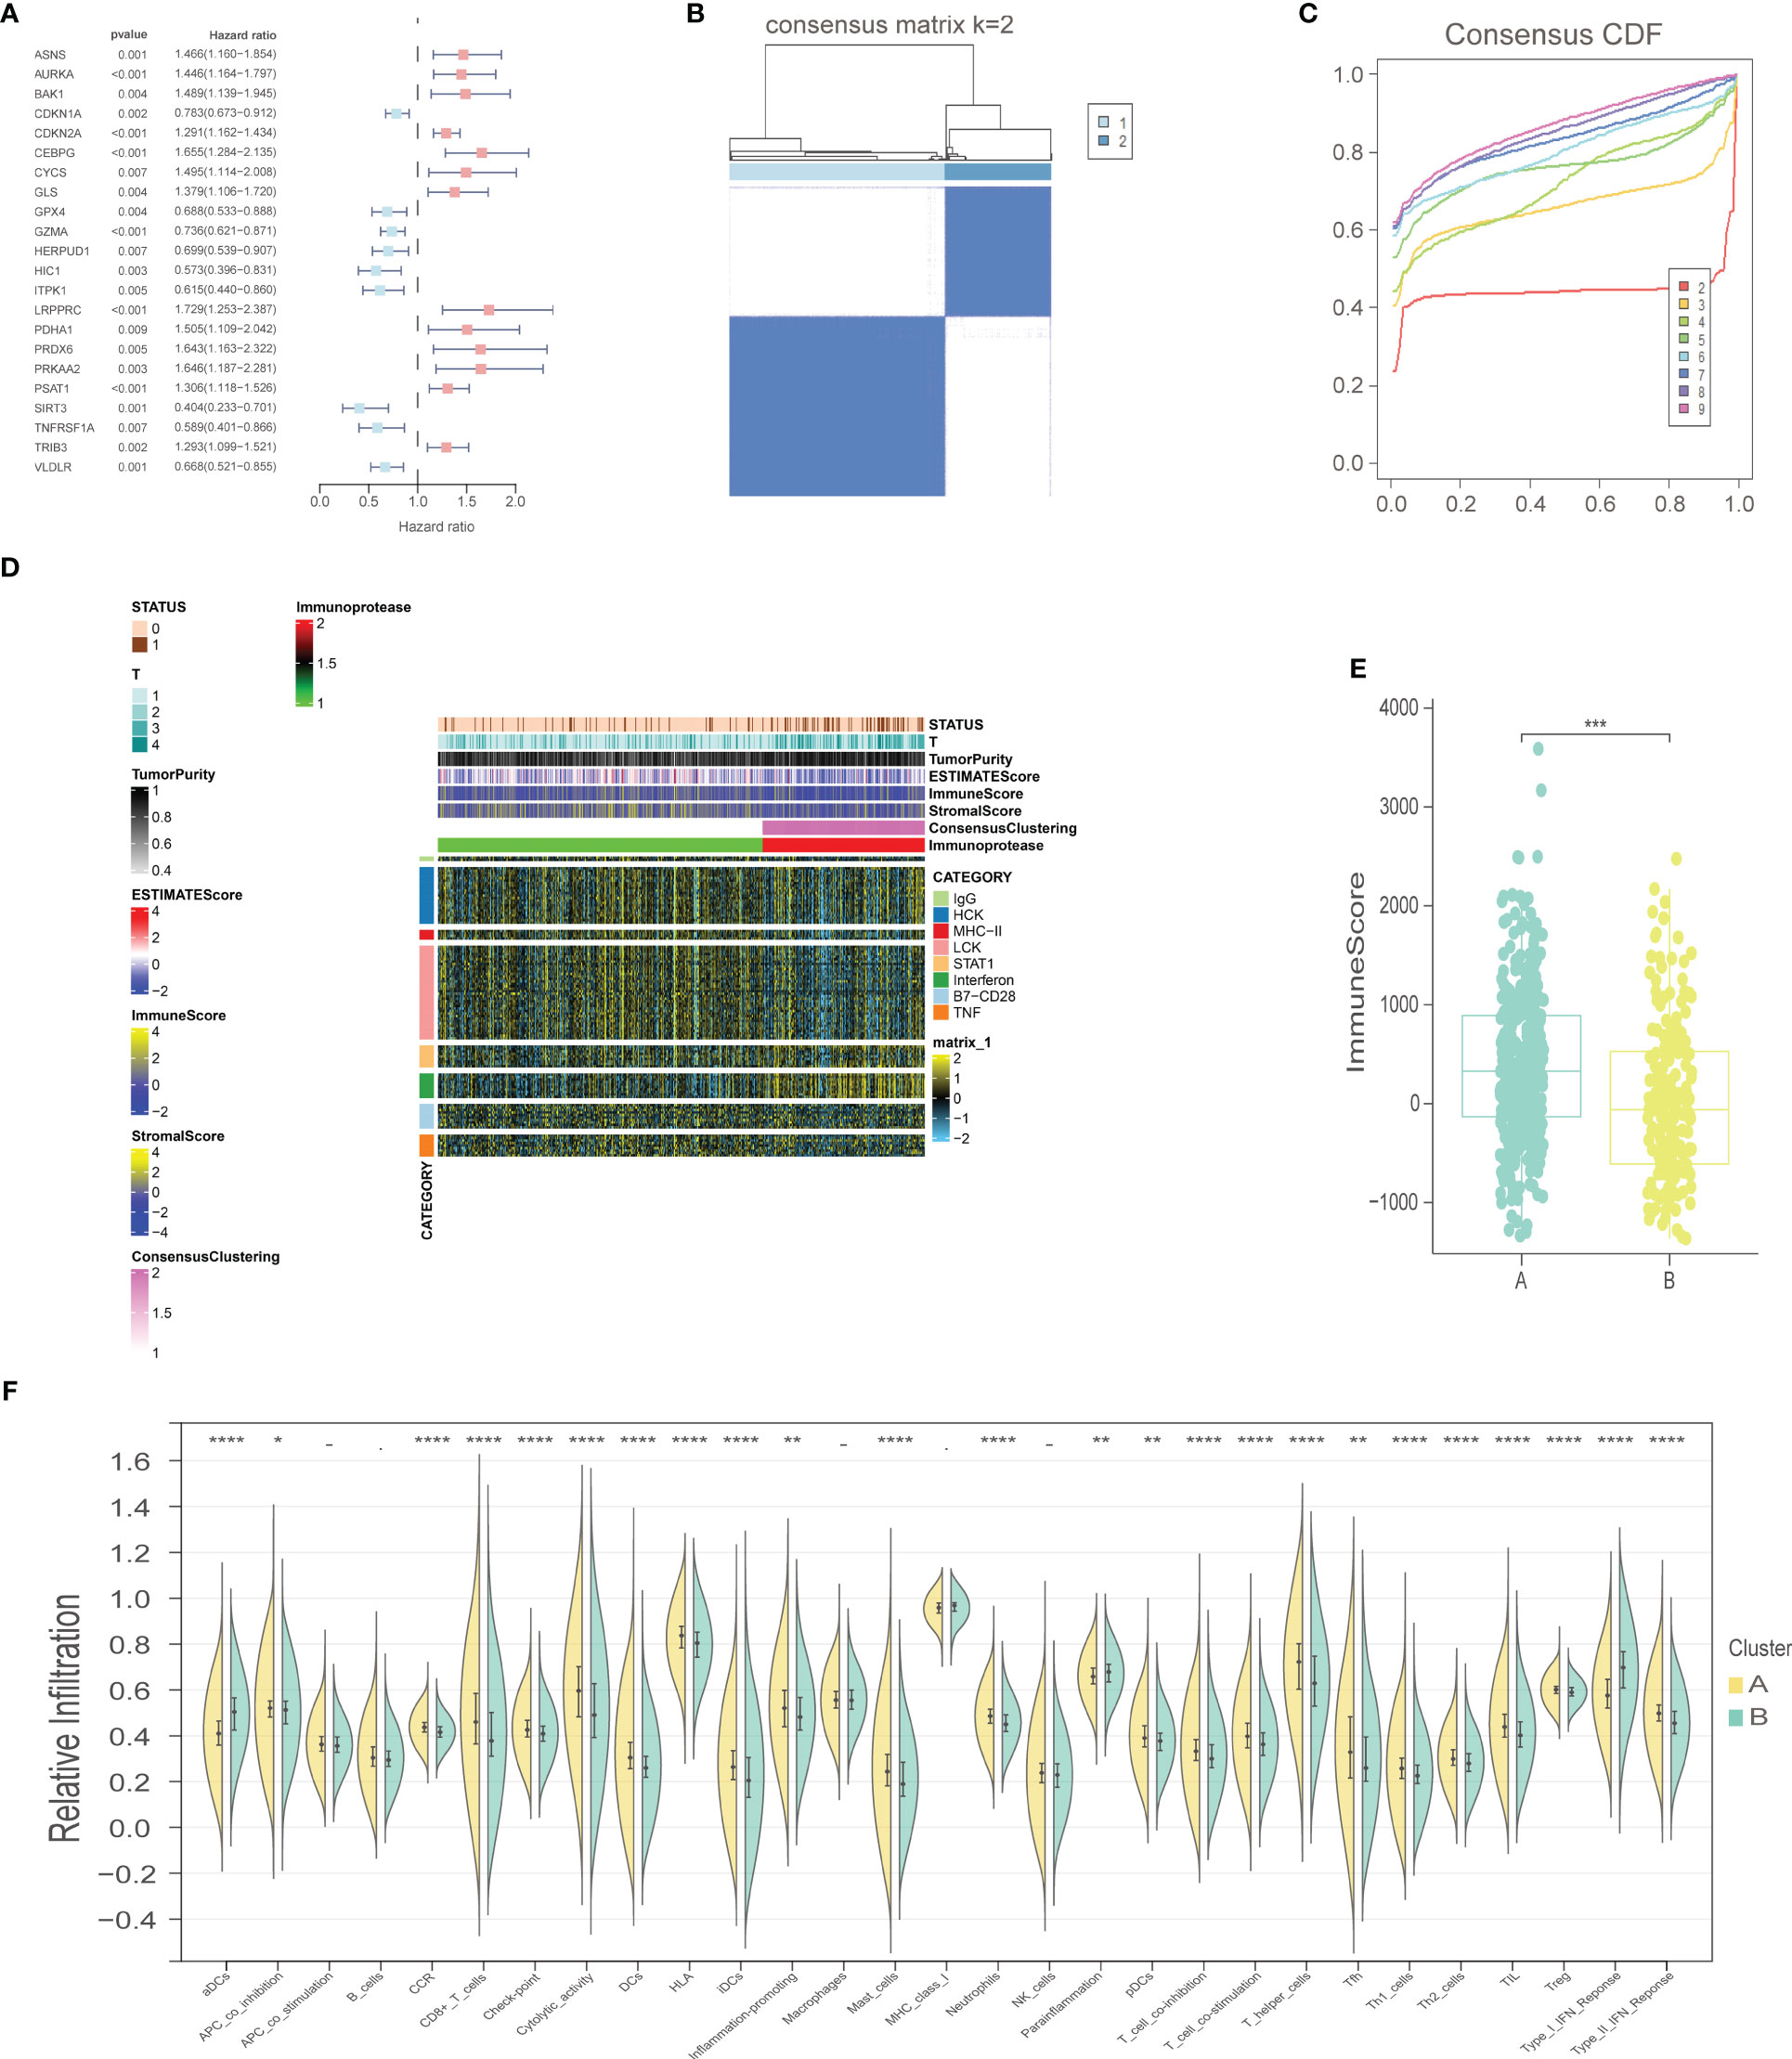
Figure 2 Selection of prognostic-related PCD-related genes, consensus clustering analysis, and immune-related analysis. (A) Forest plot of PCD-related genes with prognostic significance at p<0.01. (B) Consensus matrix, k=2. (C) Consensus CDF. (D) Heat map of immune scores. (E) ImmuneScore boxplot of two clusters. (F) Violin plot of immune infiltration analysis for two clusters. "*" represents p < 0.05; "**" represents p < 0.01; "***" represents p < 0.001; "****" represents p < 0.0001.
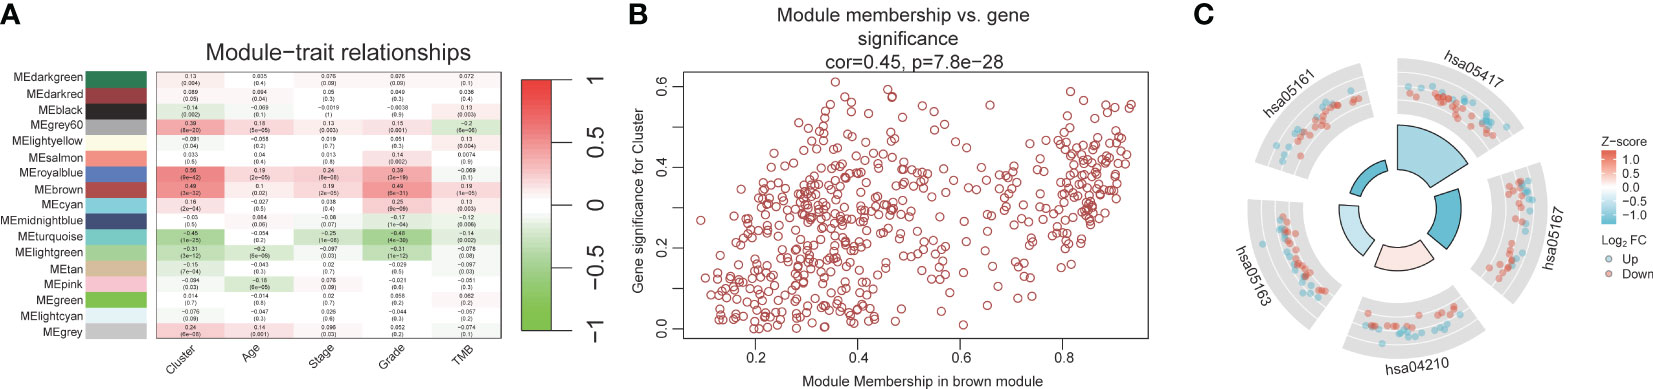
Figure 3 WGCNA and GO analysis. (A) Heat map of module-trait relationships. (B) Scatter plot of module membership versus gene significance. (C) GO analysis for 43 prognostic PCD-related genes.
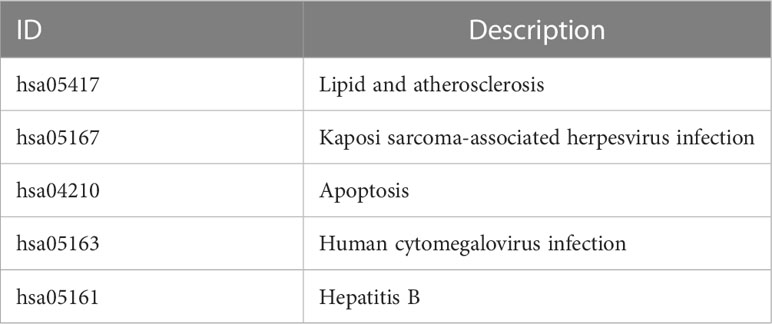
Table 1 Description of ID in GO analysis.
A total of 200 PCD-related genes were incorporated in the LASSO algorithm and 11 genes (GZMA, ASNS, GLS, PRKAA2, VLDLR, PRDX6, PSAT1, CDKN2A, SIRT3, TNFRSF1A, LRPPRC) were finally selected to construct the prognostic gene signature (Figures 4A, B). The detailed information and coefficients of these genes are shown in Supplementary Table S5. The risk scores of the individual patients in the TCGA-UCEC cohort were calculated (see methods), and the patients were divided into high-risk and low-risk groups based on the median PCD risk score. As shown in Figure 4C, higher risk scores correlated with shorter OS and higher mortality rates (p<0.001). In addition, the PCD signature showed strong predictive performance for 1-, 3- and 5-year OS, with respective AUC values of 0.678, 0.776, and 0.77 (Figure 4D). LRPPRC, CDKN2A, PSAT1, PRDX6, PRKAA2, GLS, and ASNS were overexpressed in the high-risk group, whereas TNFRSF1A, SIRT3, VLDLR, and GZMA were highly expressed in the low-risk group (Figure 4E). We also tested the risk score across 32 types of cancer and found that uterine carcinosarcoma, brain lower-grade glioma, and ovarian serous cystadenocarcinoma had higher risk scores, while uveal melanoma, mesothelioma, and skin cutaneous melanoma typically had lower risk scores. The PCD risk score distribution for other cancers is shown in Figure 4F.
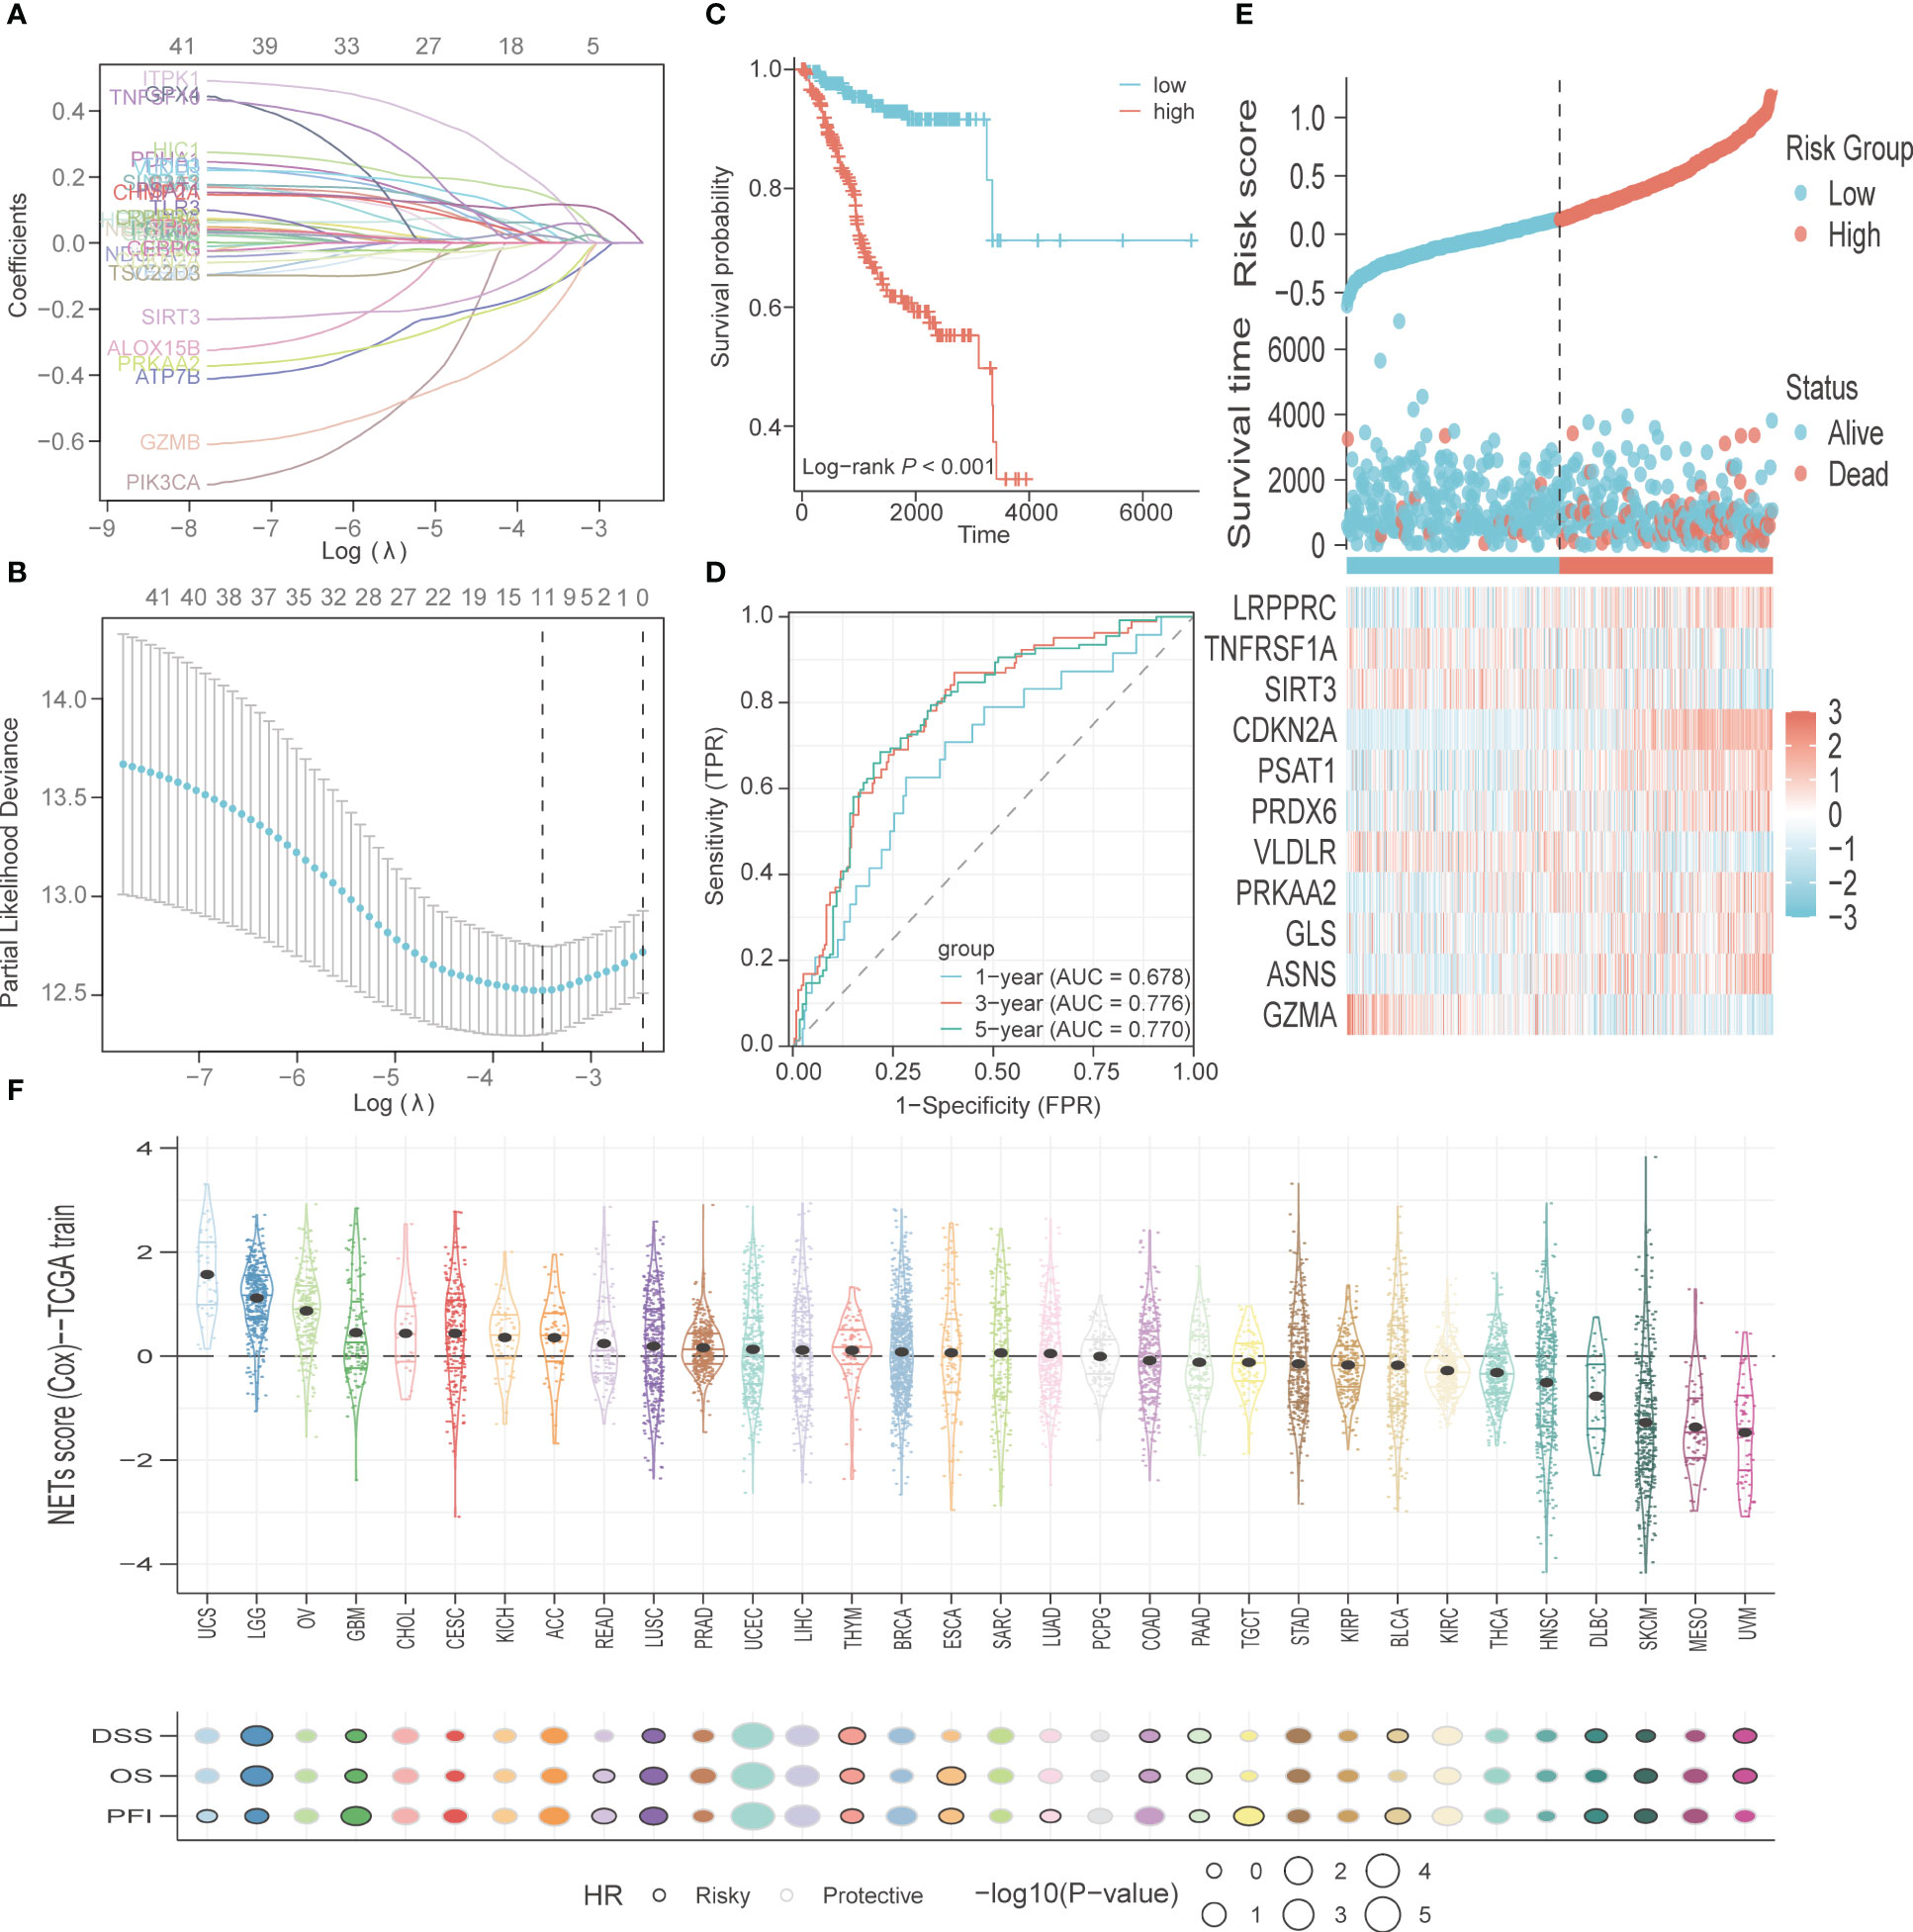
Figure 4 Construction and validation of PCD-related genes signature. (A) The variable coefficient values, logarithmic lambda values, and L1 regularization values obtained through LASSO analysis were visualized. (B) Lambda values, maximum likelihood numbers, and C-Index obtained from LASSO analysis were visualized. (C) K-M curves for OS in high-risk and low-risk patient groups. (D) ROC analysis to evaluate the performance of signature in 1-year, 3-year, and 5-year prognoses. (E) Visualization of risk factors. (F) The PCD risk score in other types of cancer, with patients’ prognostic endpoints including DSS, OS, and PFI.
The PCD-related genes signature was further validated in TCGA-CESC and TCGA-BRCA cohorts. The risk scores of the individual patients in the TCGA-BRCA cohort were calculated, and the patients were divided into high-risk and low-risk groups based on the median PCD risk score. As shown in Figure S1A, higher risk scores correlated with shorter OS and higher mortality rates (p<0.001). In addition, the PCD signature showed strong predictive performance for 1-, 3- and 5-year OS, with respective AUC values of 0.661, 0.647, and 0.632 (Figure S1B). The calibration curves for 1-, 3- and 5-year OS showed good consistency between observed survival and predicted survival (Figure S1C). The risk scores of the individual patients in the TCGA-CESC cohort were also calculated, and the patients were divided into high-risk and low-risk groups based on the median PCD risk score. As shown in Figure S1D, higher risk scores correlated with shorter OS and higher mortality rates (p<0.01). In addition, the PCD signature showed strong predictive performance for 1-, 3- and 5-year OS, with respective AUC values of 0.765, 0.816, and 0.849 (Figure S1E). The calibration curves for 1-, 3- and 5-year OS showed good consistency between observed survival and predicted survival (Figure S1F).
The pan-cancer SNV profiles of the top 10 mutated genes of the PCD risk model were also analyzed. CDKN2A displayed higher mutation rates across multiple cancer types (31%), and other frequently mutated genes included LRPPRC (13%), PRKAA2 (11%), VLDLR (9%), ASNS (8%), GZMA (7%), GLS (7%), TNFRSF1A (6%), PSAT1 (5%), and PRDX6 (4%). A missense mutation was the most frequently observed mutation type. However, the mutation types in CDKN2A were predominantly nonsense mutation, splice site, frameshift deletion, and multi-hit (Figure 5A). Furthermore, CDKN2A displayed higher mutation frequency in head and neck squamous cell carcinoma (104%), lung squamous cell carcinoma (73%), skin cutaneous melanoma (61%), pancreatic adenocarcinoma (36%), bladder urothelial carcinoma (27%), and lung adenocarcinoma (24%). The SNV frequency of PRKAA2 in skin cutaneous melanoma was 42%. Also, several PCD-related genes exhibited high mutation frequency in uterine corpus endometrial carcinoma and skin cutaneous melanoma (Figure 5B).
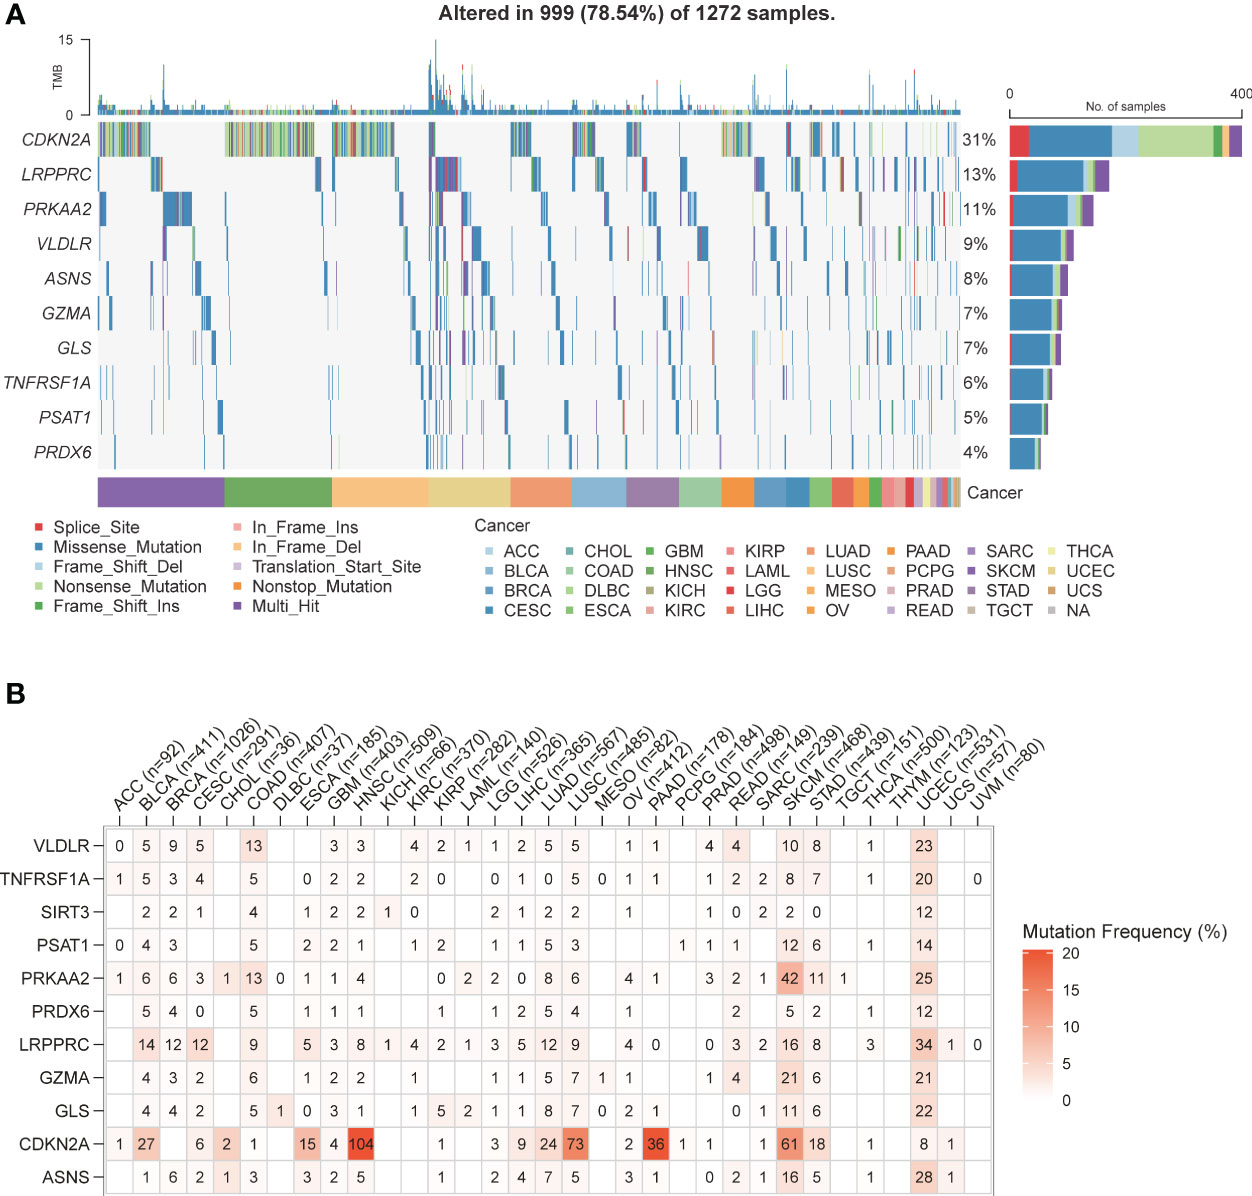
Figure 5 PCD-related genes SNV patterns. (A) Waterfall plot of PCD-related genes SNV pattern in various types of cancer. (B) Mutation frequency of PCD-related genes in various types of cancer.
As shown in Figure 6A, patients in the high-risk group were older (p<0.001) and had more advanced tumor grade and stage (p<0.001), which was indicative of poor prognosis. GSEA on the two risk groups revealed significant enrichment of “KEGG_CELL_CYCLE” and “KEGG_DNA_REPLICATION” in the high-risk group, and that of “KEGG_CHEMOKINE_SIGNALING_PATHWAY” and “KEGG_CYTOKINE_CYTOKINE_RECEPTOR_INTERACTION” in the low-risk group (Figure 6B; Supplementary Table S6). Four subgroups were identified through immune typing analysis. The proportion of high-risk patients was higher in the c2 subgroup, while the opposite trend was observed in the other subgroups. The sample distribution of the high-risk and low-risk groups differed significantly (p<0.001) across the four subgroups (Figure 6C). Drug sensitivity analysis also showed significant differences between the high-risk and low-risk groups (Supplementary Table S7). As shown in Figure 6D, patients in the high-risk group showed greater sensitivity to AT3148, Elephantin, I-BET-762, and Niraparib (p<0.001).
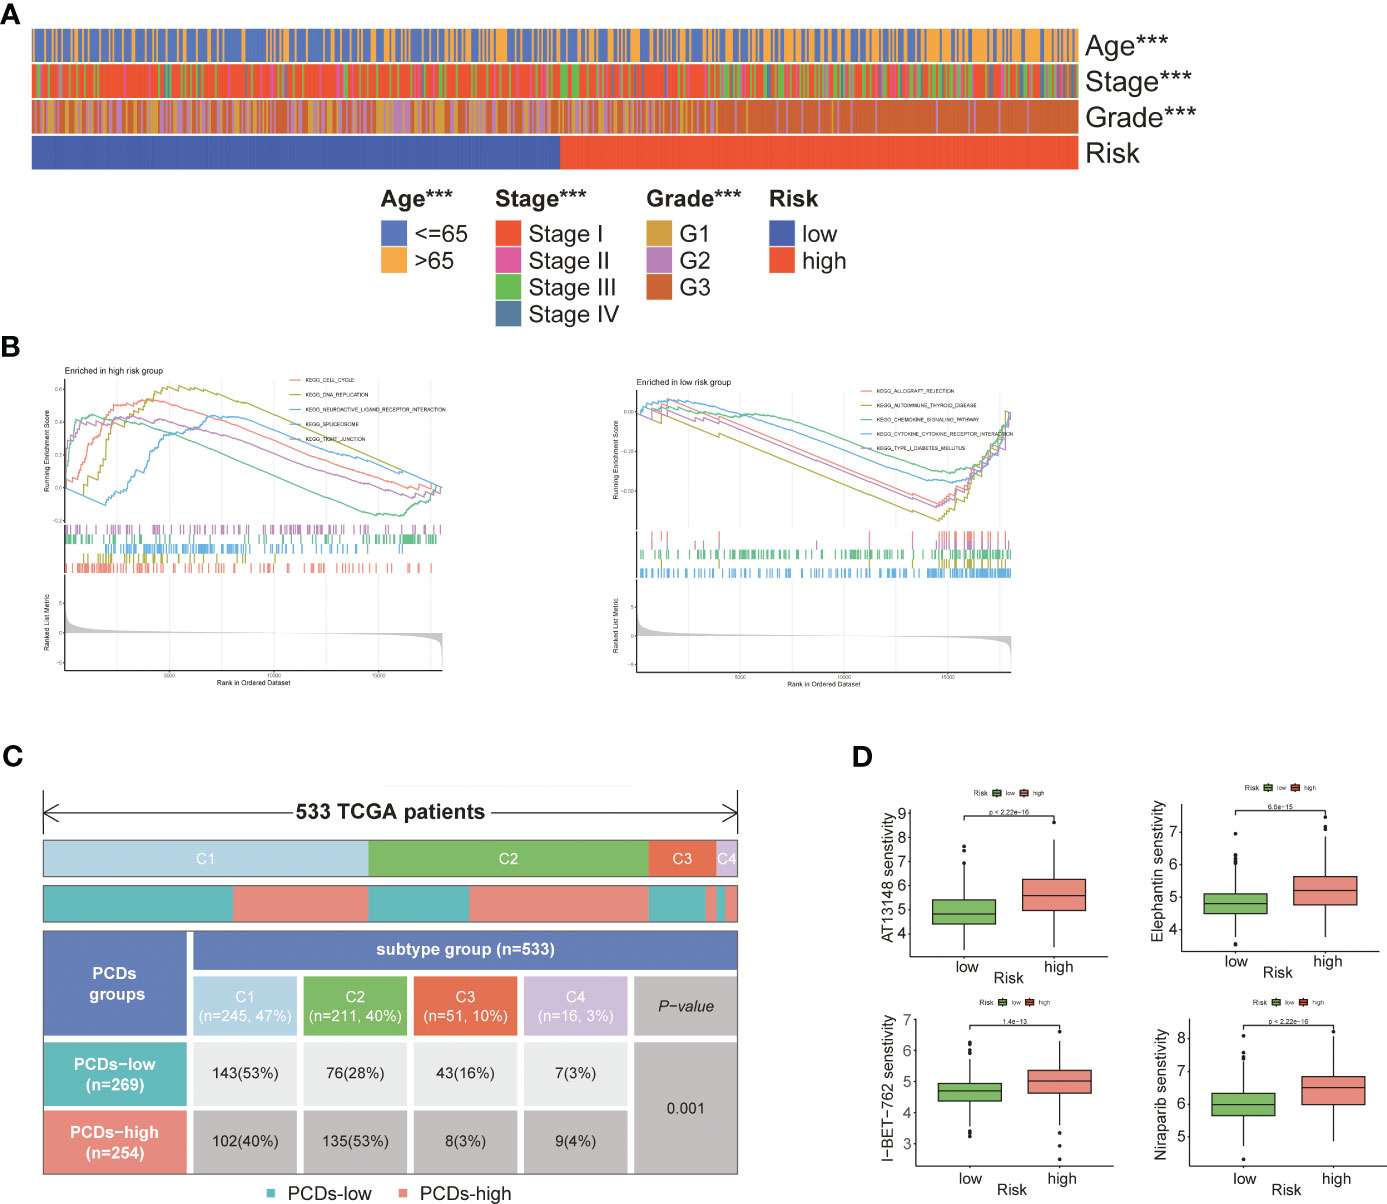
Figure 6 Comprehensive analysis of two risk groups. (A) Heat map of the correlation between risk groups and clinical characteristics. (B) GSEA analysis of two risk groups. (C) Immunotyping analysis. (D) Boxplot of the difference in drug sensitivity between high-risk and low-risk groups. "***" represents p < 0.001.
A nomogram was constructed using age, staging, grading, and the PCD risk score to predict patient survival at 1, 3, and 5 years (Supplementary Table S8). The scores for each risk factor were calculated, and the total score was plotted (Figure 7A). On this basis, this study intends to establish a correction curve to verify the applicability of the model at the PCD gene level. Our prognostic indicators predicted favorable 1,3 and 5-year survival rates (Figure 7B).
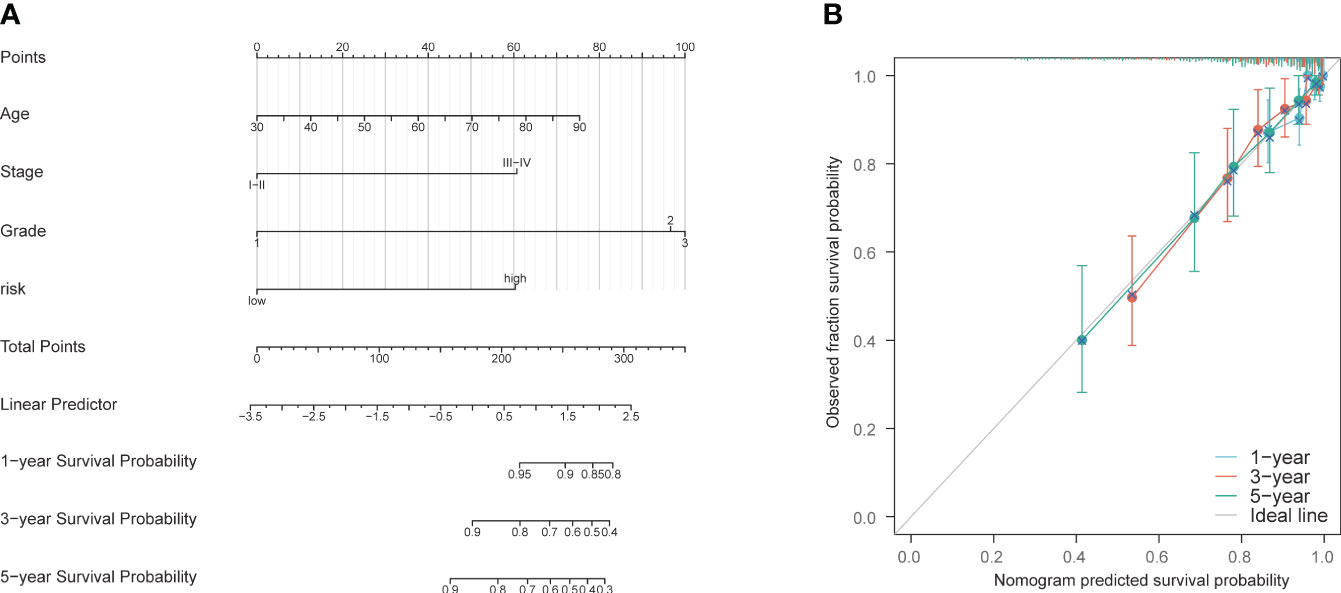
Figure 7 Construction and validation of nomogram model. (A) Nomogram prognostic model. (B) 1-year, 3-year, and 5-year calibration curves.
The correlation between the expression of the PCD-related genes and five proliferation-related genes, including WNT5A, PCNA, MKI67, CTNNB1, and CDH1, was also evaluated. LRPPRC showed a significant positive correlation with PCNA, MKI67, CTNNB1, and CDH1 (p< 0.001), which indicated that LRPPRC may promote the proliferation of EC cells. CDKN2A was correlated to all five proliferation-related genes, with a positive correlation with MKI67 and PCNA (p<0.05), and a negative correlation with WNT5A, CTNNB1, and CDH1 (p<0.01). PSAT1 was positively correlated with PCNA, MKI67, CTNNB1 and CDH1 (p<0.05; Figure 8A). High expression levels of LRPPRC, CDKN2A, and PSAT1 were associated with poor patient prognosis (Figure 8B). Furthermore, LRPPRC was expressed at higher levels in the deceased patients compared to the surviving patients (p< 0.01; Figure 8C). Furthermore, LRPPRC was also significantly upregulated in stage IV tumors compared to stage I/II tumors (p< 0.05; Figure 8D). LRPPRC also showed a significant positive correlation with some genes of the prognostic signature, including GLS, PRKAA2, and PSAT1, and this correlation was stronger compared to that among the other genes (Figure 8E). Finally, the relationship between LRPPRC and the infiltration of 24 immune cells was analyzed. LRPPRC showed a highly positive correlation with Th2 cells (R=0.433), Tcm cells (R=0.391), and T helper cells (R=0.316) (p<0.001), and a negative correlation with NK CD56bright cells (R=-0.540), pDCs (R=-0.487), and NK cells (R=-0.43) (Figures 8F, G).
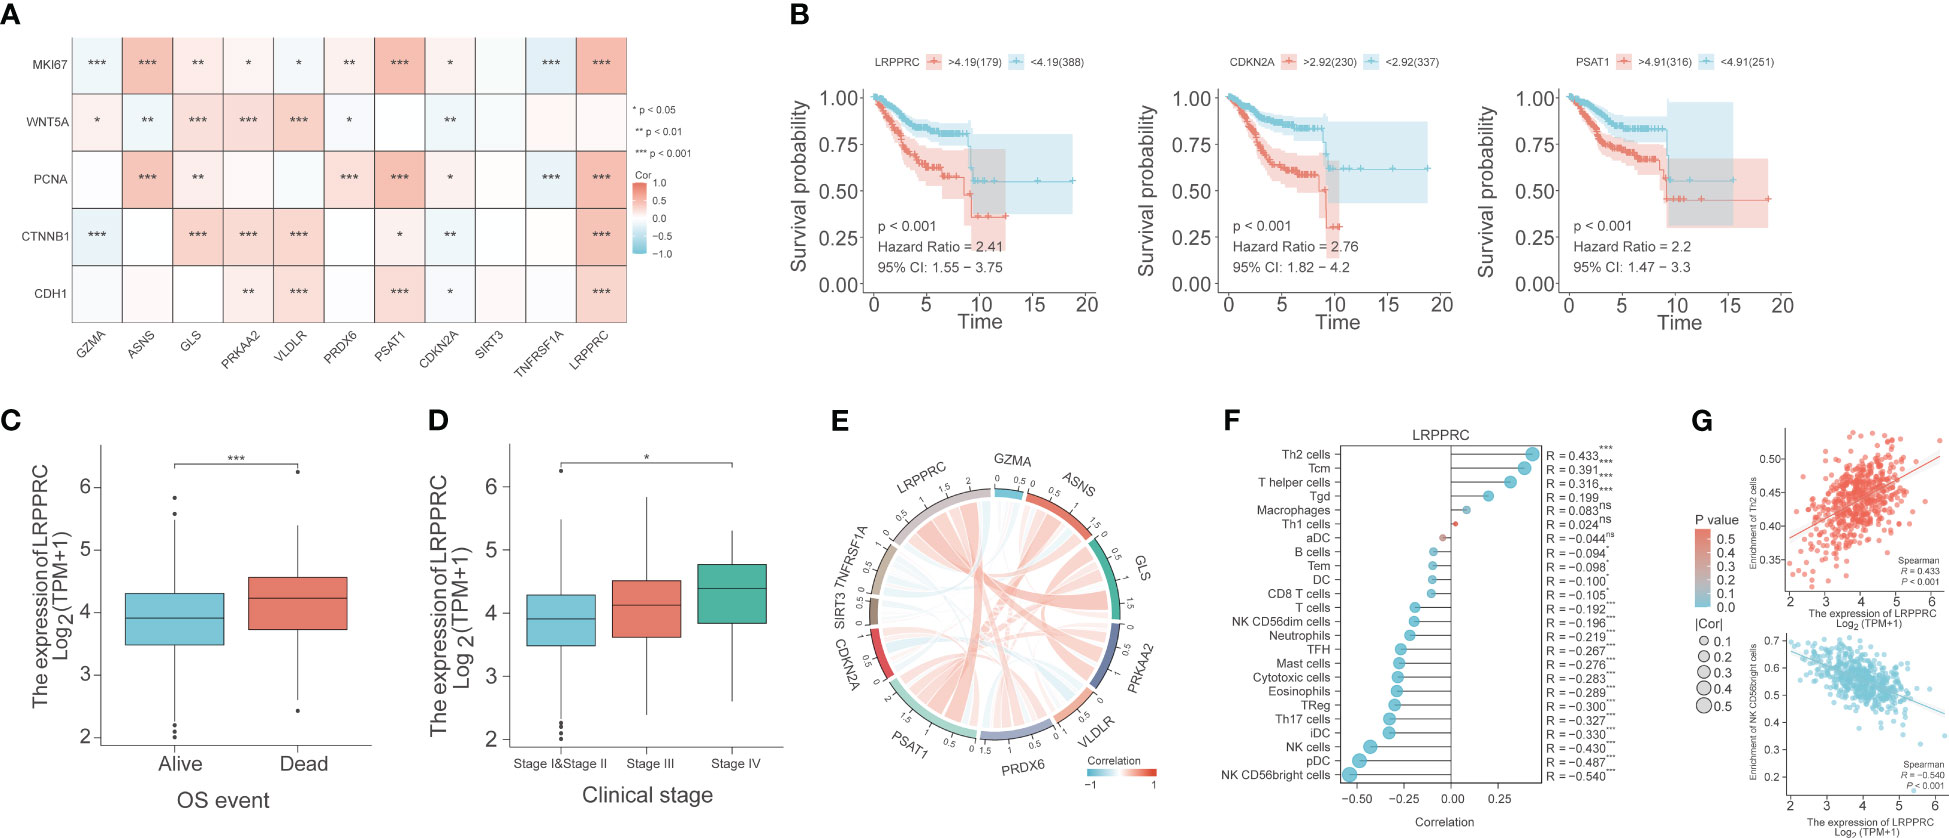
Figure 8 Bioinformatics analysis reveals the correlation between PCD-related genes, proliferation genes, and immune cell phenotypes. (A) Correlation heat map depicting the relationship between genes in the PCD-related gene signature and genes associated with cell proliferation. (B) Survival curves for LRPPRC, CDKN2A, and PSAT1. (C) Box plot of the relationship between LRPPRC and OS event. (D) Box plot of the relationship between LRPPRC and clinical stage. (E) Co-expression network within PCD-related genes. (F) The lollipop graph depicts the correlation between LRPPRC and immune phenotype. (G) Scatter plot of the correlation between LRPPRC expression and Th2 cells and CD56bright cells, respectively. "*" represents p < 0.05; "**" represents p < 0.01; "***" represents p < 0.001.
Since irregular vaginal bleeding is an early symptom of EC, most patients are diagnosed at an early stage. Although early diagnosis confers some survival advantage, the annual mortality rate due to EC is still high (4, 26), which warrants the identification of novel prognostic biomarkers. The aim of this study was to identify the prognostic PCD-associated genes in EC in order to construct a predictive model to guide clinical decision-making. A total of 43 PCD-related genes were associated with the prognosis of EC patients, and two distinct clusters were identified.
The patients in Cluster B generally had higher tumor purity, higher T stage, and worse prognosis, while Cluster A was associated with higher ESTIMATE scores, ImmuneScore, and StromalScore. The ImmuneScore is a measure of the percentage of cytotoxic and memory T cells at the tumor core and tumor margin (27), and the StromalScore is indicative of the ratio of stromal cells in the tumor microenvironment (TME) (28). A higher ImmuneScore or StromalScore suggests the presence of more immune substances or matrix components in the TME. Thus, Cluster B was associated with a general decrease in stromal and immune cells and an overall increase in tumor purity compared to Cluster A, indicating that immune infiltration and tumor purity are determinants of EC development and that enhancing the degree of immune infiltration may slow tumor growth. Furthermore, patients in Cluster A generally expressed genes characteristic of immune cell subsets, while patients in Cluster B showed high expression levels of STAT1 and interferon genes, which suggests an immune active state corresponding to favorable prognosis in Cluster A. Consistent with this, Cluster A showed a significant increase in the infiltration of T cells (such as CD8+ T cells, cytolytic activity, inflammation-promoting, and T cell co-stimulation) compared to Cluster B. On the other hand, Cluster B showed a significant increase in aDCs, para-inflammation, and type I IFN response compared to Cluster A. Furthermore, WGCNA indicated that the brown module has the strongest correlation with the clusters, and the genes in the brown module are upregulated in Cluster B. The WGCNA algorithm is a powerful tool for identifying co-expressed gene modules and their relationships with phenotypic traits. One of the main advantages of WGCNA is that it can handle large-scale gene expression data sets and identify biologically meaningful gene modules that are associated with specific traits or conditions. Additionally, WGCNA can be used to identify key hub genes that play important roles in regulating gene expression networks. Overall, WGCNA is a valuable tool for understanding the complex relationships between genes and phenotypes. Thus, the brown module was thought to be reliable. In addition, GO analysis showed that the 43 prognostic PCD-related genes were negatively regulated in the pathway of “lipids and atherosclerosis”. Based on these findings, we hypothesize overexpression of PCD-related genes may allow cancer cells to proliferate rapidly by accelerating lipid metabolism.
A LASSO-based PCD-related gene signature comprising 11 genes, including GZMA, ASNS, GLS, PRKAA2, VLDLR, PRDX6, PSAT1, CDKN2A, SIRT3, TNFRSF1A, and LRPPRC, was developed to predict the OS of EC patients. The LASSO algorithm is a type of linear regression that is used for feature selection and regularization. One of the main advantages of the LASSO algorithm is that it can help prevent overfitting by shrinking the coefficients of less important variables to zero. This can lead to a more parsimonious model that is easier to interpret and less prone to errors. Additionally, the LASSO algorithm can handle high-dimensional data sets with many variables, which can be useful in fields like genetics and finance. The PCD-related gene signature showed good performance in the TCGA-UCEC cohort and two external validation cohorts, TCGA-CESC and TCGA-BRCA. This finding strongly supported the accuracy, sensitivity, and specificity of the PCD-related gene signature in predicting prognosis. GZMA is predominantly expressed in the cytosolic granules of NK cells and cytotoxic T-cells. It cleaves gasdermin-B (GSDMB), which releases the pore-forming moiety of GSDMB and triggers pyroptosis (29–31). Asparagine synthetase (ASNS) catalyzes the de novo synthesis of asparagine by transferring amino groups from glutamine to aspartic acid. Inhibiting ASNS expression in cancer cells impairs nutrient uptake and promotes apoptosis (32). GLS hydrolyzes glutamine to produce glutamate (33), and its inhibition can induce apoptosis in tumor cells (34). PRKAA2 encodes the catalytic subunit of AMPK, a key enzyme that senses cellular energy status (35). VLDLR is a cell surface receptor with multiple functions, such as binding to very low-density lipoprotein and facilitating its endocytosis, which contributes to energy metabolism (36). PRDX6 is a mercaptan-specific peroxidase that reduces hydrogen peroxide and organic hydroperoxide to water and alcohol respectively (37, 38), and can attenuate apoptosis induced by oxygen-glucose deprivation/reoxygenation (39). PSAT1 is a member of the V-class pyridoxal phosphate ester-dependent transaminase family that fuels tumor cells by generating serine. Inhibition of PSAT1 expression can suppress serine synthesis in tumors, thereby inhibiting their growth (40). CDKN2A prevents MDM2-induced degradation of p53, and promotes p53-dependent apoptosis (41). SIRT3 is an exclusive mitochondrial member of the Sirtuin family of class III histone deacetylases, similar to the yeast Sir2 protein. It can eliminate reactive oxygen species, prevent malignant transformation, and inhibit apoptosis (42). TNFRSF1A belongs to the TNF receptor superfamily of proteins that plays a role in TNFα-mediated cell apoptosis and necrosis (7). LRPPRC is a mitochondrial protein that regulates RNA metabolism and transcription. Loss of LRPPRC affects the electron transport chain in the mitochondria, which increases mitochondrial permeability and generation of reactive oxygen species (43). LRPPRC, CDKN2A, PSAT1, PRDX6, PRKAA2, GLS, and ASNS were highly expressed in the high-risk group, while TNFRSF1A, SIRT3, VLDLR, and GZMA showed high expression in the low-risk group. Consistent with our findings, Tian et al. reported high expression of LRPPRC in EC tissues (44). Upregulation of CDKN2A in the extracellular matrix can promote EC progression by releasing cytokines and proteases in the TME (45, 46). Roh et al. demonstrated that silencing EZH2 in EC cells inhibited PRDX6, leading to the activation of the exogenous homocysteine pathway and eventually cell death (47). Zhou et al. found that estrogen activates Grn metabolism in estrogen-sensitive EC, depending on the up-regulation of GLS (48). However, the functions of LRPPRC, PSAT1, PRKAA2, ASNS, TNFRSF1A, SIRT3, VLDLR, and GZMA in EC progression, and the underlying mechanisms, remain to be elucidated.
The PCD risk score was also calculated across 32 types of cancer and showed marked organ specificity. For instance, uterine carcinosarcoma, brain lower-grade glioma, and ovarian serous cystadenocarcinoma had higher PCD risk scores, while uveal melanoma, mesothelioma, and skin cutaneous melanoma usually had lower PCD risk scores. The PCD risk scores of other cancers were similarly distributed. The PCD-related genes are likely overexpressed in the cancers with higher risk scores, and relatively lowly expressed in cancers with lower scores. We found that cancers with higher mutation frequencies in PCD-related genes tended to have lower PCD risk scores. The mutations may affect the normal expression of PCD-related genes, thereby affecting the level of the risk score. Furthermore, mutations in PCD-related genes may reduce their expression in some cancers, leading to dysregulation of cell death pathways and malignant development. CDKN2A was the most frequently mutated PCD gene across all cancer types, and exhibited the most diverse mutation profile, indicating that SNVs in CDKN2A are ubiquitous in multiple cancers.
The EC patients in the high-risk group were older and have more advanced-stage tumors, which corresponded to a worse prognosis. The PCD gene signature exhibited good predictive performance for 1-, 3- and 5-year survival. Furthermore, the prognosis of high-risk patients worsened with age and tumor grade. GSEA results showed that signaling pathways related to DNA replication were abundant in the high-risk group, while the low-risk group was enriched in pathways related to chemotaxis. This indicated that the tumor cells in the high-risk population proliferate actively, while an active immune response characterizes the tumors in the low-risk population. There were remarkable discrepancies in the distribution of specimens between high-risk and low-risk groups for the four different types of immunization. The patients in the high-risk group were sensitive to AT3148, elephantirin, I-BET-762, and Niraparib, suggesting their potential clinical applicability in EC patients. We also established a nomogram consisting of age, stage, grade, and risk score, which predicted the 1-, 3- and 5-year survival rates with high accuracy.
The PCD genes also showed a significant correlation with several proliferation-related genes. WNT5A is known to regulate the proliferation, invasion, and metastasis of tumor cells. In a previous study, we found that low expression of WNT5A in gastric cancer tissues was significantly associated with the invasion and metastasis of tumor cells, and poor prognosis (49, 50). MKI67 is a typical marker of cell proliferation that remains on the single mitotic chromosome after the breakdown of the nuclear membrane. It is expressed at low levels in EC tissues (51). Mutations in the CTNNB1 gene promote the development of esophageal cancer by upregulating the Wnt/beta-catenin pathway and the downstream target genes (52). CDH1 encodes E-cadherin, an epithelial marker that regulates cell adhesion, migration, and proliferation. It is downregulated during epithelial-mesenchymal transformation (EMT), which is the driver of tumor cell metastasis (53). Low expression of E-cadherin is linked to worse prognosis and survival (54). No study so far has reported any interaction between LRPPRC and these proliferation-related genes in EC. Based on the expression patterns and clinical association of LRPPRC, this gene is likely a risk factor in EC patients and therefore a potential therapeutic target. LRPPRC showed a strong positive correlation with GLS, PRKAA2, and PSAT1. There is a possibility of a synergistic interaction between these genes in EC development, which warrants further research. Wang et al. have identified biomarkers in different tumors by combining computational biology methods such as WGCNA, opening up more possibilities for researching tumorigenesis mechanisms (55, 56). LRPPRC expression showed a positive correlation with Th2 cells and a negative correlation with NK CD56bright cells, which may accelerate tumor progression. High expression of LRPPRC may inhibit NK cell activity, thereby suppressing the immune response and promoting cancer progression. Further studies are needed to assess the role of LRPPRC in tumorigenesis and development, and the underlying molecular mechanisms involved in programmed cell death. Single-cell sequencing (scRNA-seq) has been widely used to explore the mechanisms and biomarkers of gynecological tumors (57, 58). In our subsequent study, we will focus on the mechanism of LRPPRC in EC development through the scRNA-seq approach.
PCD-related genes are involved in the development of EC and can predict patient prognosis. We developed a PCD-related cluster system for discriminating EC patients with different prognoses. We also constructed an 11-gene PCD-related signature with high predictive performance in prognosis, mutation, and drug response. LRPPRC, an adverse prognostic gene in EC and a member of the model genes, could predict the clinical status and immune infiltration level of EC patients. Our findings provide new insights into the mechanisms underlying EC development and highlight potential therapeutic targets.
The original contributions presented in the study are included in the article/Supplementary Material. Further inquiries can be directed to the corresponding authors.
The studies involving human participants were reviewed and approved by Department of Obstetrics and Gynaecology, Guangzhou Women and Children’s Medical Center, Guangzhou Medical University. The patients/participants provided their written informed consent to participate in this study.
KG contribute to the method and the results, JX wrote the manuscript. Other authors confirmed their contribution to this research. All authors contributed to the article and approved the submitted version.
This study was funded by the Research Foundation of Guangzhou Women and Children’s Medical Center for Clinical Doctor (2020RC003, 2021BS044), the Science and Technology Program of Guangzhou, China (2023A04J1244), the Plan on enhancing scientific research in GMU (02-410-2302169XM), and the Administration of Traditional Chinese Medicine of Guangdong Province (20201299).
We thank the TCGA database for its open source.
The authors declare that the research was conducted in the absence of any commercial or financial relationships that could be construed as a potential conflict of interest.
All claims expressed in this article are solely those of the authors and do not necessarily represent those of their affiliated organizations, or those of the publisher, the editors and the reviewers. Any product that may be evaluated in this article, or claim that may be made by its manufacturer, is not guaranteed or endorsed by the publisher.
The Supplementary Material for this article can be found online at: https://www.frontiersin.org/articles/10.3389/fonc.2023.1224071/full#supplementary-material
Supplementary Figure 1 | External validation of PCD-related genes signature. (A) K-M curves for OS in high-risk and low-risk patient groups. (B) ROC analysis to evaluate the performance of signature in 1-year, 3-year, and 5-year prognoses. (C) Calibration curves to evaluate the performance of signature in 1-year, 3-year, and 5-year prognoses. (D) K-M curves for OS in high-risk and low-risk patient groups. (E) ROC analysis to evaluate the performance of signature in 1-year, 3-year, and 5-year prognoses. (F) Calibration curves to evaluate the performance of signature in 1-year, 3-year, and 5-year prognoses.
1. Crosbie EJ, Kitson SJ, McAlpine JN, Mukhopadhyay A, Powell ME, Singh N. Endometrial cancer. Lancet (London England) (2022) 399(10333):1412–28. doi: 10.1016/S0140-6736(22)00323-3
2. Urick ME, Bell DW. Clinical actionability of molecular targets in endometrial cancer. Nat Rev Cancer (2019) 19(9):510–21. doi: 10.1038/s41568-019-0177-x
3. Sud S, Holmes J, Eblan M, Chen R, Jones E. Clinical characteristics associated with racial disparities in endometrial cancer outcomes: a surveillance, epidemiology and end results analysis. Gynecol Oncol (2018) 148(2):349–56. doi: 10.1016/j.ygyno.2017.12.021
4. Lai J, Xu T, Yang H. Protein-based prognostic signature for predicting the survival and immunotherapeutic efficiency of endometrial carcinoma. BMC Cancer (2022) 22(1):325. doi: 10.1186/s12885-022-09402-w
5. Galluzzi L, Vitale I, Aaronson SA, Abrams JM, Adam D, Agostinis P, et al. Molecular mechanisms of cell death: recommendations of the nomenclature committee on cell death 2018. Cell Death Differ (2018) 25(3):486–541. doi: 10.1038/s41418-017-0012-4
6. Christgen S, Tweedell RE, Kanneganti TD. Programming inflammatory cell death for therapy. Pharmacol Ther (2022) 232:108010. doi: 10.1016/j.pharmthera.2021.108010
7. Peng F, Liao M, Qin R, Zhu S, Peng C, Fu L, et al. Regulated cell death (RCD) in cancer: key pathways and targeted therapies. Signal Transduct Target Ther (2022) 7(1):286. doi: 10.1038/s41392-022-01110-y
8. Amaravadi RK, Kimmelman AC, Debnath J. Targeting autophagy in cancer: recent advances and future directions. Cancer Discov (2019) 9(9):1167–81. doi: 10.1158/2159-8290.CD-19-0292
9. Su Z, Yang Z, Xu Y, Chen Y, Yu Q. Apoptosis, autophagy, necroptosis, and cancer metastasis. Mol Cancer (2015) 14:48. doi: 10.1186/s12943-015-0321-5
10. Xie J, Tian W, Tang Y, Zou Y, Zheng S, Wu L, et al. Establishment of a cell necroptosis index to predict prognosis and drug sensitivity for patients with triple-negative breast cancer. Front Mol Biosci (2022) 9:834593. doi: 10.3389/fmolb.2022.834593
11. Zhao R, Kaakati R, Lee AK, Liu X, Li F, Li CY. Novel roles of apoptotic caspases in tumor repopulation, epigenetic reprogramming, carcinogenesis, and beyond. Cancer Metastasis Rev (2018) 37(2-3):227–36. doi: 10.1007/s10555-018-9736-y
12. Stockwell BR, Friedmann Angeli JP, Bayir H, Bush AI, Conrad M, Dixon SJ, et al. Ferroptosis: a regulated cell death nexus linking metabolism, redox biology, and disease. Cell (2017) 171(2):273–85. doi: 10.1016/j.cell.2017.09.021
13. Zou Y, Zheng S, Xie X, Ye F, Hu X, Tian Z, et al. N6-methyladenosine regulated FGFR4 attenuates ferroptotic cell death in recalcitrant HER2-positive breast cancer. Nat Commun (2022) 13(1):2672. doi: 10.1038/s41467-022-30217-7
14. Tsvetkov P, Coy S, Petrova B, Dreishpoon M, Verma A, Abdusamad M, et al. Copper induces cell death by targeting lipoylated TCA cycle proteins. Sci (New York NY) (2022) 375(6586):1254–61. doi: 10.1126/science.abf0529
15. Tang R, Xu J, Zhang B, Liu J, Liang C, Hua J, et al. Ferroptosis, necroptosis, and pyroptosis in anticancer immunity. J Hematol Oncol (2020) 13(1):110. doi: 10.1186/s13045-020-00946-7
16. Wen S, Niu Y, Lee SO, Chang C. Androgen receptor (AR) positive vs negative roles in prostate cancer cell deaths including apoptosis, anoikis, entosis, necrosis and autophagic cell death. Cancer Treat Rev (2014) 40(1):31–40. doi: 10.1016/j.ctrv.2013.07.008
17. Fatokun AA, Dawson VL, Dawson TM. Parthanatos: mitochondrial-linked mechanisms and therapeutic opportunities. Br J Pharmacol (2014) 171(8):2000–16. doi: 10.1111/bph.12416
18. Brinkmann V, Reichard U, Goosmann C, Fauler B, Uhlemann Y, Weiss DS, et al. Neutrophil extracellular traps kill bacteria. Sci (New York NY) (2004) 303(5663):1532–5. doi: 10.1126/science.1092385
19. Song X, Zhu S, Xie Y, Liu J, Sun L, Zeng D, et al. JTC801 induces pH-dependent death specifically in cancer cells and slows growth of tumors in mice. Gastroenterology (2018) 154(5):1480–93. doi: 10.1053/j.gastro.2017.12.004
20. Aits S, Jäättelä M. Lysosomal cell death at a glance. J Cell Sci (2013) 126(Pt 9):1905–12. doi: 10.1242/jcs.091181
21. Scaturro P, Pichlmair A. Oxeiptosis: a discreet way to respond to radicals. Curr Opin Immunol (2019) 56:37–43. doi: 10.1016/j.coi.2018.10.006
22. Carneiro BA, El-Deiry WS. Targeting apoptosis in cancer therapy. Nat Rev Clin Oncol (2020) 17(7):395–417. doi: 10.1038/s41571-020-0341-y
23. Zhang Z, Zhang Y, Xia S, Kong Q, Li S, Liu X, et al. Gasdermin e suppresses tumour growth by activating anti-tumour immunity. Nature (2020) 579(7799):415–20. doi: 10.1038/s41586-020-2071-9
24. Jiang Z, Lim SO, Yan M, Hsu JL, Yao J, Wei Y, et al. TYRO3 induces anti-PD-1/PD-L1 therapy resistance by limiting innate immunity and tumoral ferroptosis. J Clin Invest (2021) 131(8). doi: 10.1172/JCI139434
25. Rody A, Holtrich U, Pusztai L, Liedtke C, Gaetje R, Ruckhaeberle E, et al. T-Cell metagene predicts a favorable prognosis in estrogen receptor-negative and HER2-positive breast cancers. Breast Cancer Res BCR (2009) 11(2):R15. doi: 10.1186/bcr2234
26. Bell DW, Ellenson LH. Molecular genetics of endometrial carcinoma. Annu Rev Pathol (2019) 14:339–67. doi: 10.1146/annurev-pathol-020117-043609
27. Galon J, Pagès F, Marincola FM, Angell HK, Thurin M, Lugli A, et al. Cancer classification using the immunoscore: a worldwide task force. J Trans Med (2012) 10:205. doi: 10.1186/1479-5876-10-205
28. Xue YN, Xue YN, Wang ZC, Mo YZ, Wang PY, Tan WQ. A novel signature of 23 immunity-related gene pairs is prognostic of cutaneous melanoma. Front Immunol (2020) 11:576914. doi: 10.3389/fimmu.2020.576914
29. Zhou Z, He H, Wang K, Shi X, Wang Y, Su Y, et al. Granzyme a from cytotoxic lymphocytes cleaves GSDMB to trigger pyroptosis in target cells. Sci (New York NY) (2020) 368(6494). doi: 10.1126/science.aaz7548
30. Hansen JM, de Jong MF, Wu Q, Zhang LS, Heisler DB, Alto LT, et al. Pathogenic ubiquitination of GSDMB inhibits NK cell bactericidal functions. Cell (2021) 184(12):3178–91.e18. doi: 10.1016/j.cell.2021.04.036
31. Gong W, Liu P, Liu J, Li Y, Zheng T, Wu X, et al. GSDMB n-terminal assembles in plasma membrane to execute pyroptotic cell death. Genes Dis (2022) 9(6):1405–7. doi: 10.1016/j.gendis.2021.12.022
32. Gwinn DM, Lee AG, Briones-Martin-Del-Campo M, Conn CS, Simpson DR, Scott AI, et al. Oncogenic KRAS regulates amino acid homeostasis and asparagine biosynthesis via ATF4 and alters sensitivity to l-asparaginase. Cancer Cell (2018) 33(1):91–107.e6. doi: 10.1016/j.ccell.2017.12.003
33. Song M, Kim SH, Im CY, Hwang HJ. Recent development of small molecule glutaminase inhibitors. Curr Topics Med Chem (2018) 18(6):432–43. doi: 10.2174/1568026618666180525100830
34. Zhang J, Mao S, Guo Y, Wu Y, Yao X, Huang Y. Inhibition of GLS suppresses proliferation and promotes apoptosis in prostate cancer. Bioscience Rep (2019) 39(6). doi: 10.1042/BSR20181826
35. Weijiao Y, Fuchun L, Mengjie C, Xiaoqing Q, Hao L, Yuan L, et al. Immune infiltration and a ferroptosis-associated gene signature for predicting the prognosis of patients with endometrial cancer. Aging (2021) 13(12):16713–32. doi: 10.18632/aging.203190
36. Dlugosz P, Tresky R, Nimpf J. Differential action of reelin on oligomerization of ApoER2 and VLDL receptor in HEK293 cells assessed by time-resolved anisotropy and fluorescence lifetime imaging microscopy. Front Mol Neurosci (2019) 12:53. doi: 10.3389/fnmol.2019.00053
37. Kang SW, Baines IC, Rhee SG. Characterization of a mammalian peroxiredoxin that contains one conserved cysteine. J Biol Chem (1998) 273(11):6303–11. doi: 10.1074/jbc.273.11.6303
38. Chen JW, Dodia C, Feinstein SI, Jain MK, Fisher AB. 1-cys peroxiredoxin, a bifunctional enzyme with glutathione peroxidase and phospholipase A2 activities. J Biol Chem (2000) 275(37):28421–7. doi: 10.1074/jbc.M005073200
39. Kim JE, Lee DS, Kang TC. Sp1-mediated Prdx6 upregulation leads to clasmatodendrosis by increasing its aiPLA2 activity in the CA1 astrocytes in chronic epilepsy rats. Antioxidants (Basel Switzerland) (2022) 11(10). doi: 10.3390/antiox11101883
40. Montrose DC, Saha S, Foronda M, McNally EM, Chen J, Zhou XK, et al. Exogenous and endogenous sources of serine contribute to colon cancer metabolism, growth, and resistance to 5-fluorouracil. Cancer Res (2021) 81(9):2275–88. doi: 10.1158/0008-5472.CAN-20-1541
41. Han M, Yamaguchi S, Onishi M, Fujii T, Hosoya M, Wen X, et al. The MDM2 and CDKN2A copy-number-variation influence the TP53-signature-score in wild-type TP53 luminal type breast cancer. Anticancer Res (2022) 42(5):2277–88. doi: 10.21873/anticanres.15707
42. Zu Y, Chen XF, Li Q, Zhang ST, Si LN. PGC-1α activates SIRT3 to modulate cell proliferation and glycolytic metabolism in breast cancer. Neoplasma (2021) 68(2):352–61. doi: 10.4149/neo_2020_200530N584
43. Hu S, Sechi M, Singh PK, Dai L, McCann S, Sun D, et al. A novel redox modulator induces a GPX4-mediated cell death that is dependent on iron and reactive oxygen species. J Med Chem (2020) 63(17):9838–55. doi: 10.1021/acs.jmedchem.0c01016
44. Tian T, Ikeda J, Wang Y, Mamat S, Luo W, Aozasa K, et al. Role of leucine-rich pentatricopeptide repeat motif-containing protein (LRPPRC) for anti-apoptosis and tumourigenesis in cancers. Eur J Cancer (Oxford Engl 1990) (2012) 48(15):2462–73. doi: 10.1016/j.ejca.2012.01.018
45. Davalos AR, Coppe JP, Campisi J, Desprez PY. Senescent cells as a source of inflammatory factors for tumor progression. Cancer Metastasis Rev (2010) 29(2):273–83. doi: 10.1007/s10555-010-9220-9
46. Coppé JP, Desprez PY, Krtolica A, Campisi J. The senescence-associated secretory phenotype: the dark side of tumor suppression. Annu Rev Pathol (2010) 5:99–118. doi: 10.1146/annurev-pathol-121808-102144
47. Roh JW, Choi JE, Han HD, Hu W, Matsuo K, Nishimura M, et al. Clinical and biological significance of EZH2 expression in endometrial cancer. Cancer Biol Ther (2020) 21(2):147–56. doi: 10.1080/15384047.2019.1672455
48. Zhou WJ, Zhang J, Yang HL, Wu K, Xie F, Wu JN, et al. Estrogen inhibits autophagy and promotes growth of endometrial cancer by promoting glutamine metabolism. Cell Commun Signal CCS (2019) 17(1):99. doi: 10.1186/s12964-019-0412-9
49. Opławski M, Nowakowski R, Średnicka A, Ochnik D, Grabarek BO, Boroń D. Molecular landscape of the epithelial-mesenchymal transition in endometrioid endometrial cancer. J Clin Med (2021) 10(7). doi: 10.3390/jcm10071520
50. Cao M, Chan RWS, Cheng FHC, Li J, Li T, Pang RTK, et al. Myometrial cells stimulate self-renewal of endometrial mesenchymal stem-like cells through WNT5A/β-catenin signaling. Stem Cells (Dayton Ohio) (2019) 37(11):1455–66. doi: 10.1002/stem.3070
51. Lax SF. Pathology of endometrial carcinoma. Adv Exp Med Biol (2017) 943:75–96. doi: 10.1007/978-3-319-43139-0_3
52. Ledinek Ž, Sobočan M, Knez J. The role of CTNNB1 in endometrial cancer. Dis Markers (2022) 2022:1442441. doi: 10.1155/2022/1442441
53. González-Rodilla I, Aller L, Llorca J, Muñoz AB, Verna V, Estévez J, et al. The e-cadherin expression vs. tumor cell proliferation paradox in endometrial cancer. Anticancer Res (2013) 33(11):5091–5. doi: 10.1093/annonc/mdt460.34
54. Stefansson IM, Salvesen HB, Akslen LA. Prognostic impact of alterations in p-cadherin expression and related cell adhesion markers in endometrial cancer. J Clin Oncol (2004) 22(7):1242–52. doi: 10.1200/JCO.2004.09.034
55. Wang Y, Wang J, Yan K, Lin J, Zheng Z, Bi J. Identification of core genes associated with prostate cancer progression and outcome via bioinformatics analysis in multiple databases. PeerJ (2020) 8:e8786. doi: 10.7717/peerj.8786
56. Wang Y, Yan K, Lin J, Liu Y, Wang J, Li X, et al. CD8+ T cell Co-expressed genes correlate with clinical phenotype and microenvironments of urothelial cancer. Front Oncol (2020) 10:553399. doi: 10.3389/fonc.2020.553399
57. Liu C, Li X, Huang Q, Zhang M, Lei T, Wang F, et al. Single-cell RNA-sequencing reveals radiochemotherapy-induced innate immune activation and MHC-II upregulation in cervical cancer. Signal Transduct Target Ther (2023) 8(1):44. doi: 10.1038/s41392-022-01264-9
Keywords: LASSO, cell death, endometrial cancer, signature, cell assay, immune infiltration
Citation: Xiong J, Chen J, Guo Z, Zhang C, Yuan L and Gao K (2023) A novel machine learning-based programmed cell death-related clinical diagnostic and prognostic model associated with immune infiltration in endometrial cancer. Front. Oncol. 13:1224071. doi: 10.3389/fonc.2023.1224071
Received: 17 May 2023; Accepted: 29 June 2023;
Published: 18 July 2023.
Edited by:
Feifei Teng, Shandong University Cancer Center, ChinaReviewed by:
Yidong Xie, Sichuan University, ChinaCopyright © 2023 Xiong, Chen, Guo, Zhang, Yuan and Gao. This is an open-access article distributed under the terms of the Creative Commons Attribution License (CC BY). The use, distribution or reproduction in other forums is permitted, provided the original author(s) and the copyright owner(s) are credited and that the original publication in this journal is cited, in accordance with accepted academic practice. No use, distribution or reproduction is permitted which does not comply with these terms.
*Correspondence: Li Yuan, bGl6enlrbGFyY2tAMTI2LmNvbQ==; Kefei Gao, Z2Fva2VmZWlfZmV6eEB5ZWFoLm5ldA==
†These authors have contributed equally to this work
Disclaimer: All claims expressed in this article are solely those of the authors and do not necessarily represent those of their affiliated organizations, or those of the publisher, the editors and the reviewers. Any product that may be evaluated in this article or claim that may be made by its manufacturer is not guaranteed or endorsed by the publisher.
Research integrity at Frontiers
Learn more about the work of our research integrity team to safeguard the quality of each article we publish.