Erratum: Extracellular volume fraction using contrast-enhanced CT is useful in differentiating intrahepatic cholangiocellular carcinoma from hepatocellular carcinoma
- 1Department of Radiology, Osaka University Graduate School of Medicine, Osaka, Japan
- 2Department of Radiology, Osaka Medical and Pharmaceutical University, Osaka, Japan
- 3Department of Pathology, Osaka University Graduate School of Medicine, Osaka, Japan
- 4Department of Gastroenterological Surgery, Osaka University Graduate School of Medicine, Osaka, Japan
Objectives: To evaluate whether tumor extracellular volume fraction (fECV) on contrast-enhanced computed tomography (CT) aids in the differentiation between intrahepatic cholangiocarcinoma (ICC) and hepatocellular carcinoma (HCC).
Methods: In this retrospective study, 113 patients with pathologically confirmed ICC (n = 39) or HCC (n = 74) who had undergone preoperative contrast-enhanced CT were enrolled. Enhancement values of the tumor (Etumor) and aorta (Eaorta) were obtained in the precontrast and equilibrium phase CT images. fECV was calculated using the following equation: fECV [%] = Etumor/Eaorta × (100 – hematocrit [%]). fECV values were compared between the ICC and HCC groups using Welch’s t-test. The diagnostic performance of fECV for differentiating ICC and HCC was assessed using receiver-operating characteristic (ROC) analysis. fECV and the CT imaging features of tumors were evaluated by two radiologists. Multivariate logistic regression analysis was performed to identify factors predicting a diagnosis of ICC.
Results: Mean fECV was significantly higher in ICCs (43.8% ± 13.2%) than that in HCCs (31.6% ± 9.0%, p < 0.001). The area under the curve for differentiating ICC from HCC was 0.763 when the cutoff value of fECV was 41.5%. The multivariate analysis identified fECV (unit OR: 1.10; 95% CI: 1.01–1.21; p < 0.05), peripheral rim enhancement during the arterial phase (OR: 17.0; 95% CI: 1.29–225; p < 0.05), and absence of washout pattern (OR: 235; 95% CI: 14.03–3933; p < 0.001) as independent CT features for differentiating between the two tumor types.
Conclusions: A high value of fECV, peripheral rim enhancement during the arterial phase, and absence of washout pattern were independent factors in the differentiation of ICC from HCC.
Highlights
● Extracellular volume fraction of ICC is significantly higher than that of HCC.
● Diagnosis by extracellular volume fraction has a sensitivity and specificity of 59.0% and 90.5%, respectively.
● Extracellular volume fraction is an independent factor in differentiating ICC from HCC.
Introduction
Hepatocellular carcinoma (HCC) and intrahepatic cholangiocarcinoma (ICC) are the first and second most common primary liver malignancies, respectively (1, 2). Accurate differentiation between ICC and HCC is essential in treatment planning and for the assessment of the prognosis. Unlike HCC, surgical resection of ICC requires lymph node sampling or dissection (3–9), and radiofrequency ablation and transcatheter arterial chemoembolization are not indicated for ICC (10–13). Considering that HCC is often diagnosed noninvasively without pathologic confirmation, based on the computed tomography (CT) and/or magnetic resonance (MR) image findings in high-risk patients (14, 15), misdiagnosis of ICC as HCC on imaging studies can lead to improper treatment. Tumor biopsy is not routinely used because of its invasiveness and concern regarding procedure-related complications (16–19). There is also the possibility of misdiagnosis due to sampling errors in percutaneous liver biopsy (20–22).
According to the Liver Imaging Reporting and Data System (LI-RADS), typical ICCs are classified as LR-M (i.e., non-HCC malignancy), but atypical cases are sometimes classified as LR-4 (i.e., probably HCC) or LR-5 (i.e., definitely HCC), which decrease the diagnostic specificity for HCC (specificity of 0.84 for LR-5 as positive; 0.74 for LR-4 or LR-5 as positive) (23–26). Meanwhile, Wengert et al. (27) have reported a diagnostic algorithm using MR imaging findings that could help reliably differentiate ICC from HCC, resulting in a sensitivity and a specificity of 68.8% and 90.6%, respectively.
The estimation of the hepatic extracellular volume fraction (fECV) on equilibrium phase CT imaging is based on the direct proportionality between the concentration of contrast material and the CT attenuation. The fECV is calculated by dividing the enhancement of the regions of interest (ROIs) by the enhancement of the blood pool and then multiplying the result by the difference of 1 minus the hematocrit value during the equilibrium phase (28).
Equilibrium imaging is a technique that uses contrast agents, commonly employed in CT and MR imaging, to assess the fECV that is increased in fibrosis and other deposition processes, including amyloidosis. This method has been successfully applied with both CT and MR imaging to measure myocardial fECV (29–33) as an indirect indicator for diffuse fibrosis or to estimate histologic pancreatic fibrosis (34–36). In addition, because fECV suggests iodine levels, a method of diagnosing lymph node metastasis of papillary thyroid cancer using fECV has also been reported (37). Moreover, recent studies have demonstrated the potential of fECV to quantitatively assess diffuse fibrosis in chronic liver diseases (38–41). The fECV value reflects the proportion of extracellular interstitial space and increases with fibrosis progression, indicating the expansion of the third space (38). Therefore, fECV can accurately evaluate the degree of fibrosis in liver parenchyma. Fibrosis is often observed pathologically in ICCs (1, 42, 43), whereas it is rare in HCCs (44). Therefore, fECV may be applied to the evaluation of fibrosis of liver tumors to help distinguish ICC from HCC and is expected to be higher in ICC than that in HCC. To the best of our knowledge, no previous study has used fECV to distinguish between ICC and HCC. The aim of this study is to evaluate whether tumor fECV on contrast-enhanced CT aids in the differentiation of ICC and HCC and to prove that fECV is a variable independent of other imaging findings.
Materials and methods
Our institutional review board approved this retrospective study and waived the requirement for informed consent.
Patients
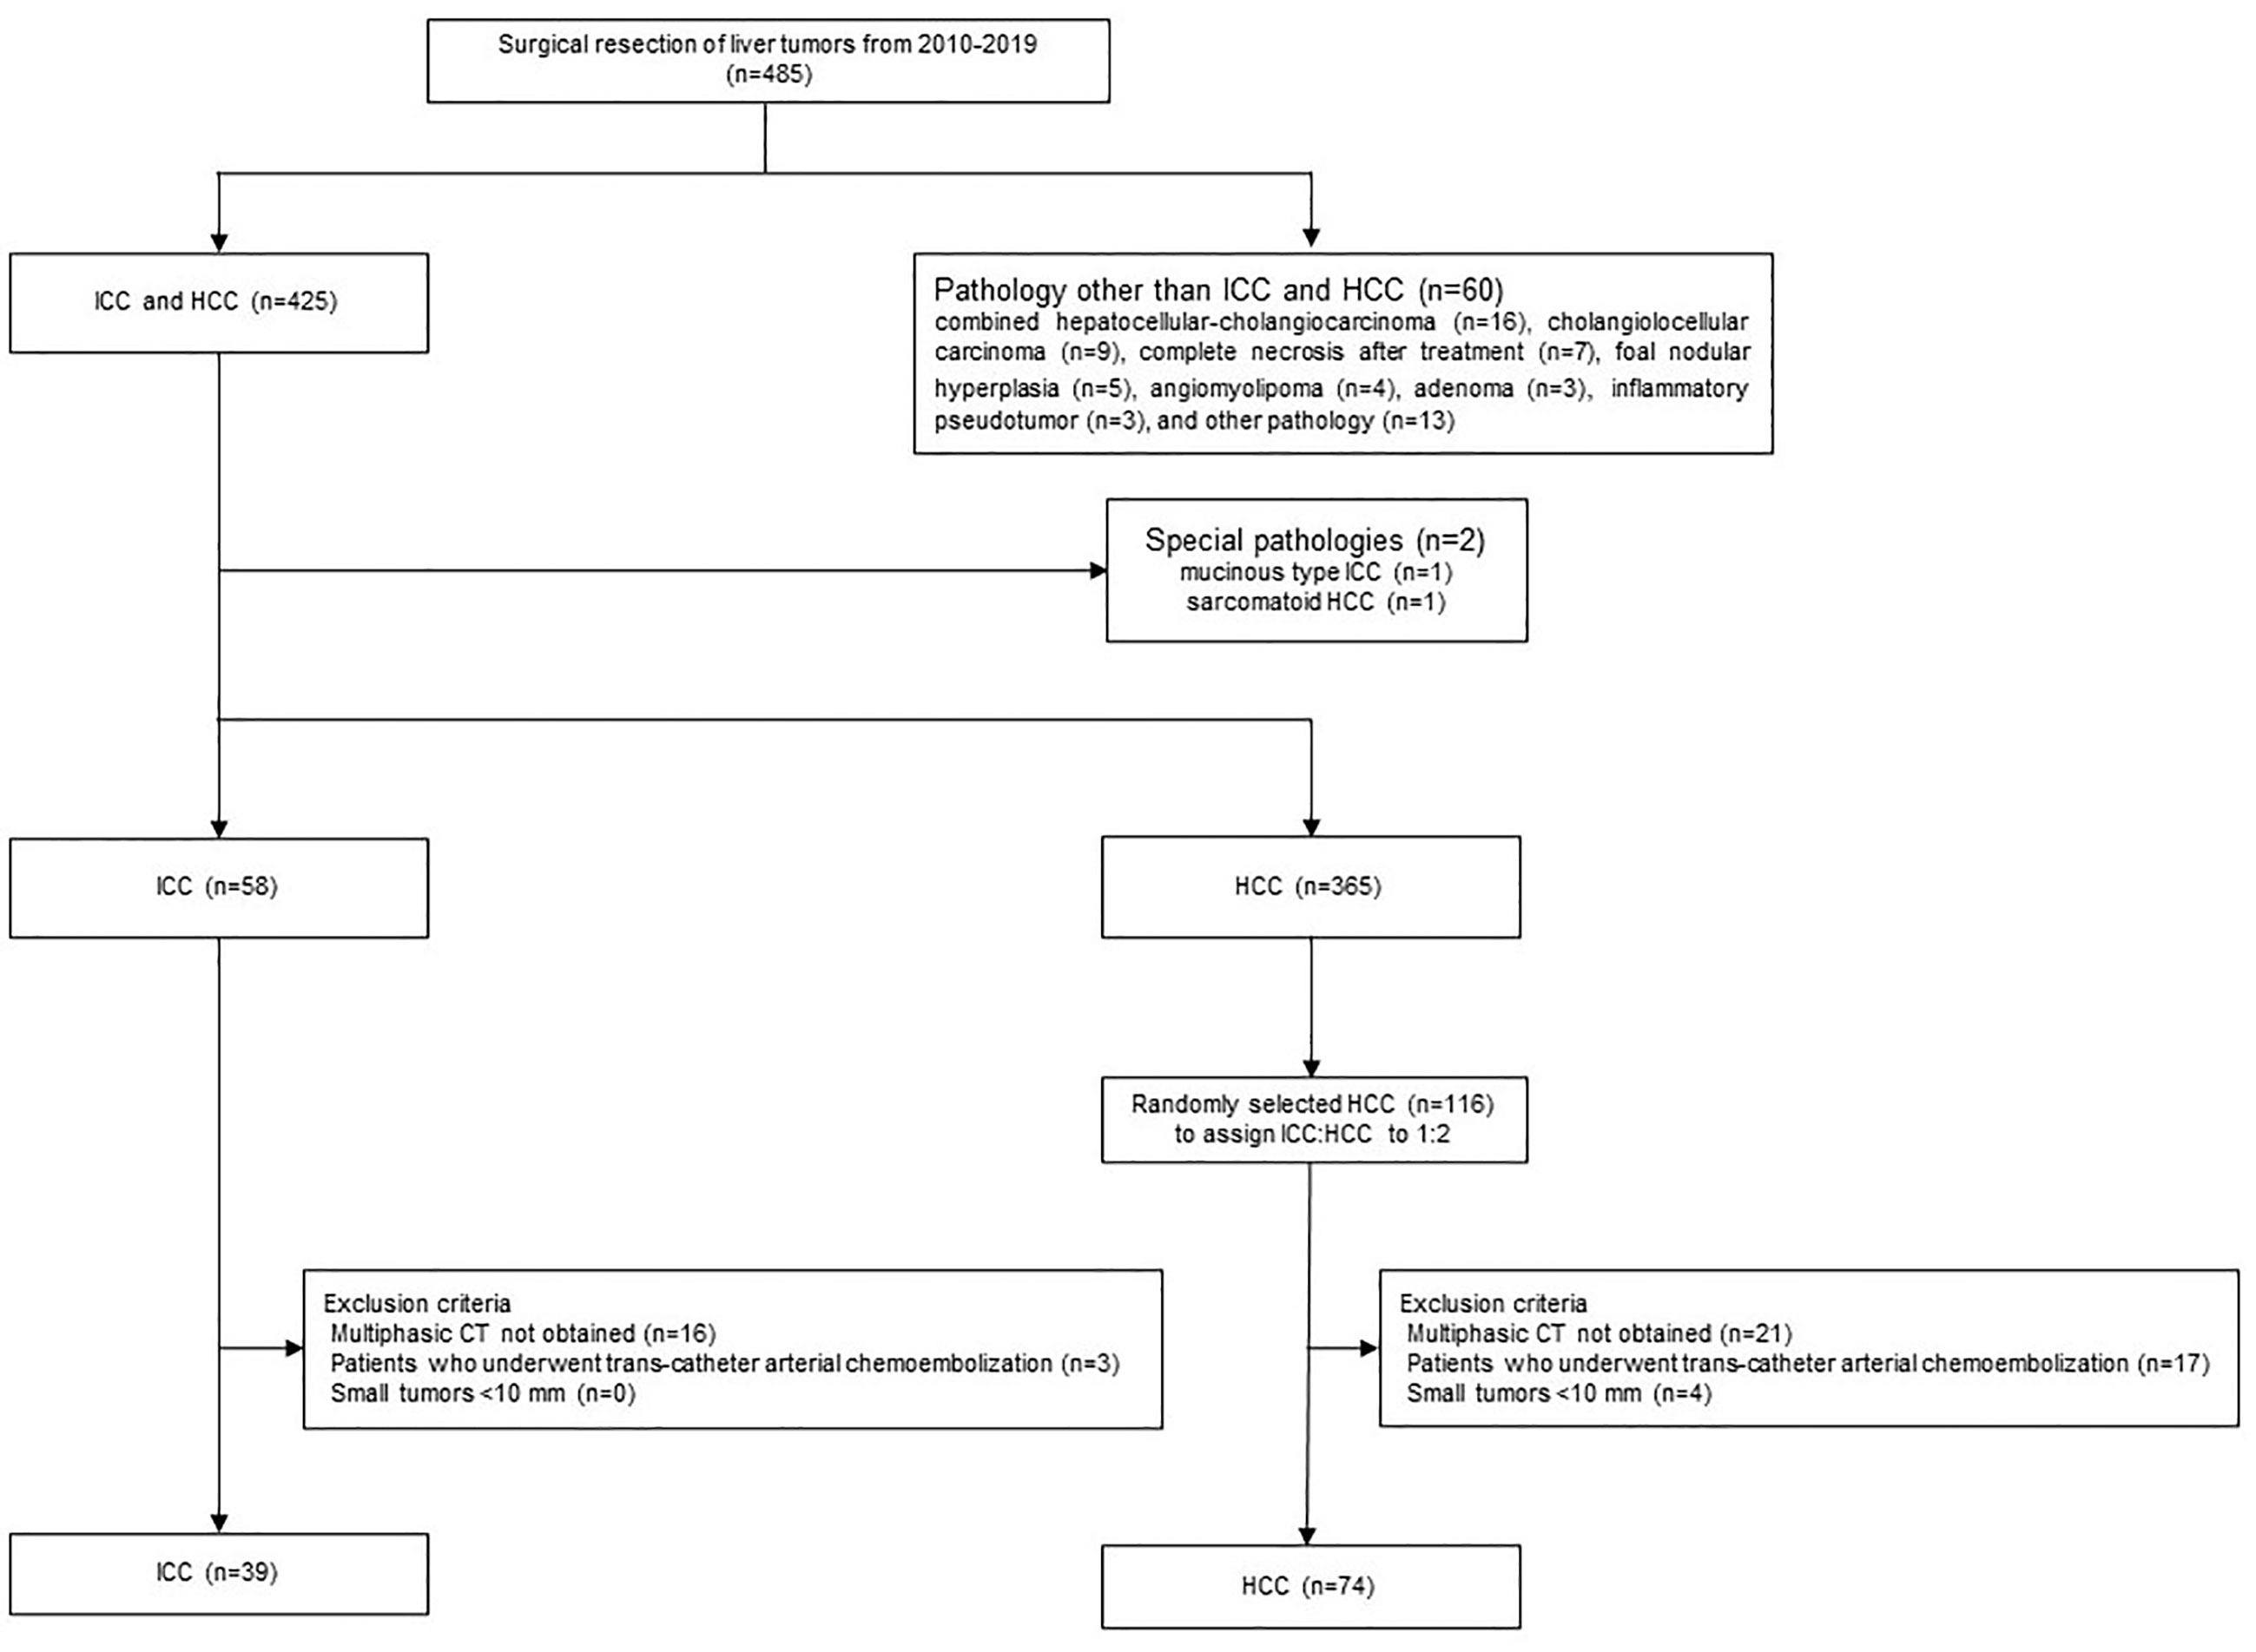
Candidate cases in the study were 485 patients who had undergone surgical resection of liver tumors between January 2010 and December 2019. Of these, 425 had ICCs (n = 59) or HCCs (n = 366). After excluding two cases with special pathologies such as mucinous type ICC (n = 1) or sarcomatoid HCC (n = 1), 58 had ICCs and 365 had HCCs. The final diagnoses were confirmed based on histopathological examination of the surgical specimens. As HCC cases outnumbered the ICC cases epidemiologically, 116 of the 365 HCC patients were extracted randomly to achieve an HCC/ICC ratio of 2:1. The exclusion criteria were precontrast CT and dynamic CT obtained at a different institution from our own, a tumor diameter <10 mm, and a history of preoperative transcatheter arterial chemoembolization (Figure 1). Finally, 39 cases in the ICC group and 74 cases in the HCC group were included. We collected and assessed the patients’ clinical data from our database and institutional medical records.
Imaging techniques
Contrast-enhanced dynamic CT was performed using 320-channel (Aquilion ONE; Canon Medical Systems, Otawara, Japan), 256-channel (Revolution CT; GE Healthcare), or 64-channel (Discovery CT 750 HD; GE Healthcare) CT scanners. After obtaining the precontrast images, contrast agent (600 mg of iodine per kilogram of body weight) was administered intravenously with a power injector at a rate of 3–5 ml/s. Images were obtained during the arterial, portal venous, and equilibrium phases at approximately 20, 50, and 170 s, respectively, after the CT value had reached 100 HU in the aorta at the hepatic hilum level. CT images reconstructed into 5-mm slices were used in the image analyses.
Image analysis
Quantitative analysis was performed by two radiologists (H.T. and Y.K., with 7 and 8 years’ experience in abdominal radiology, respectively) on a multimodality picture archiving and communication system (SAI workstation software, FUJIFILM, Tokyo, Japan). They were blinded to the final pathological diagnosis and all background clinical information. CT images from the ICC and HCC groups were presented randomly in a blinded manner. In patients with multiple lesions, only the largest lesion was evaluated.
CT attenuation values of the tumor and aorta were measured in images obtained before contrast agent administration and in the equilibrium phase. For each tumor, three ROIs of approximately 10 mm2 in area were placed on the most enhanced solid parts of the lesion, avoiding the tumor capsule, septa, and visible vessels in the lesion on the equilibrium phase. The images where each of the three ROIs were placed were not always the same slice. To enable efficient detection of fibrous characteristics, from among the three ROIs, that with the largest mean CT value in the equilibrium phase was used in the evaluation. Another ROI of the same size was placed in the same positions on the unenhanced images. For the aorta, a round ROI as large as possible was drawn within the abdominal aorta at the same level as the tumor, avoiding the aortic wall, any atheromatous plaque, and artifacts.
Tumor fECV was calculated using the following formula: fECV [%] = (100 – hematocrit [%]) × (ΔHUtumor/ΔHUaorta), where ΔHU is HU in the equilibrium phase minus HU before contrast agent administration. The hematocrit value obtained closest to the date of the CT scan was used. If no blood test was available before the CT scan, the hematocrit value of the closest day after the CT scan was used. The average fECV value of the two radiologists was used in the analysis.
Image evaluation
Two other radiologists (K.K. and F.H., with 7 and 13 years’ experience in abdominal radiology, respectively) who were blinded to the clinicopathologic information assessed the CT image findings of the tumors independently. If there was inconsistency, consensus was achieved through discussion or referral to a third radiologist (O.H., with 25 years’ experience in abdominal radiology).
The CT images were assessed by the radiologists in accordance with important differentiating factors between ICC and HCC, which have been reported as: (1) demarcation of the tumor; (2) shape of the tumor (round, lobulated, or irregular); (3) pattern of arterial enhancement; (4) washout; (5) dilation of the bile duct; and (6) presence of tortuous tumoral vessels (24, 45). The assessment of tumor demarcation was divided into four categories: indistinct, a well-defined area of <50% of the tumor margin, a well-defined area of >50% of the tumor margin, or sharp. The arterial enhancement pattern was classified as homogeneous, heterogeneous (with mixed areas of tumor enhancement), or peripheral (with contrast enhancement at the periphery of the tumor). The washout pattern was defined as the area of the tumor that showed arterial enhancement in the arterial phase, followed by hypoattenuation compared to the surrounding hepatic parenchyma in the portal venous phase and/or equilibrium phase. Tortuous tumoral vessels were identified as enhancing vasculature within the tumor that was distinct from normal hepatic vessels and more enlarged or numerous than expected for that particular region of the liver (46).
Statistical analysis
Statistical analysis was performed with JMP Pro version 16.2.0 (SAS Institution Japan Ltd., Tokyo, Japan). fECV values were compared between the ICC and HCC groups using Welch’s t-test. The tentative cutoff fECV value of the tumor that maximized the difference in the diagnosis of ICC was determined using the area under the curve (AUC), calculated by receiver operating characteristic (ROC) analysis. Subgroup analysis was also performed for patients at high risk for HCC and patients at no risk for HCC (Student’s t-test and Welch’s t-test, respectively, and ROC analysis).
Student’s t-test was used to compare the mean period between CT scan and the day of surgery and also the mean period between hematocrit blood test and the day of CT scan between the ICC and HCC groups. The mean areas of ROIs placed in the tumor and in the aorta were also compared by Student’s t-test. For both patient background and CT imaging features, differences in the numerical data of the two groups were examined by χ2 test or Fisher’s exact test (when n < 5). Differences in quantitative variables were evaluated by Student’s t-test or Welch’s t-test.
Univariate logistic regression analyses were performed to determine whether tumor demarcation, tumor shape, arterial enhancement pattern, washout, bile duct dilatation, and tortuous tumoral vessels were important findings in the differentiation of ICC and HCC. To identify factors predicting a diagnosis of ICC, a multivariate logistic regression analysis was performed in which four image findings considered particularly important based on the findings of previous studies (shape, arterial enhancing pattern, washout, and bile duct dilatation) as well as fECV were entered into the final model. For factors with multiple categories, the Wald test was used.
To evaluate interobserver agreement, the intraclass correlation coefficient was calculated for fECV values using the following criteria: <0.40 = poor agreement; 0.40–0.59 = fair agreement; 0.60–0.74 = good agreement; 0.75–1.00 = excellent agreement (47). Cohen’s κ coefficient was calculated for interobserver agreement in the evaluation of the CT imaging features using the following criteria: κ values of up to 0.40 were considered to indicate positive but poor agreement; 0.41–0.75, good agreement; and 0.75 or higher, excellent agreement (48).
Results
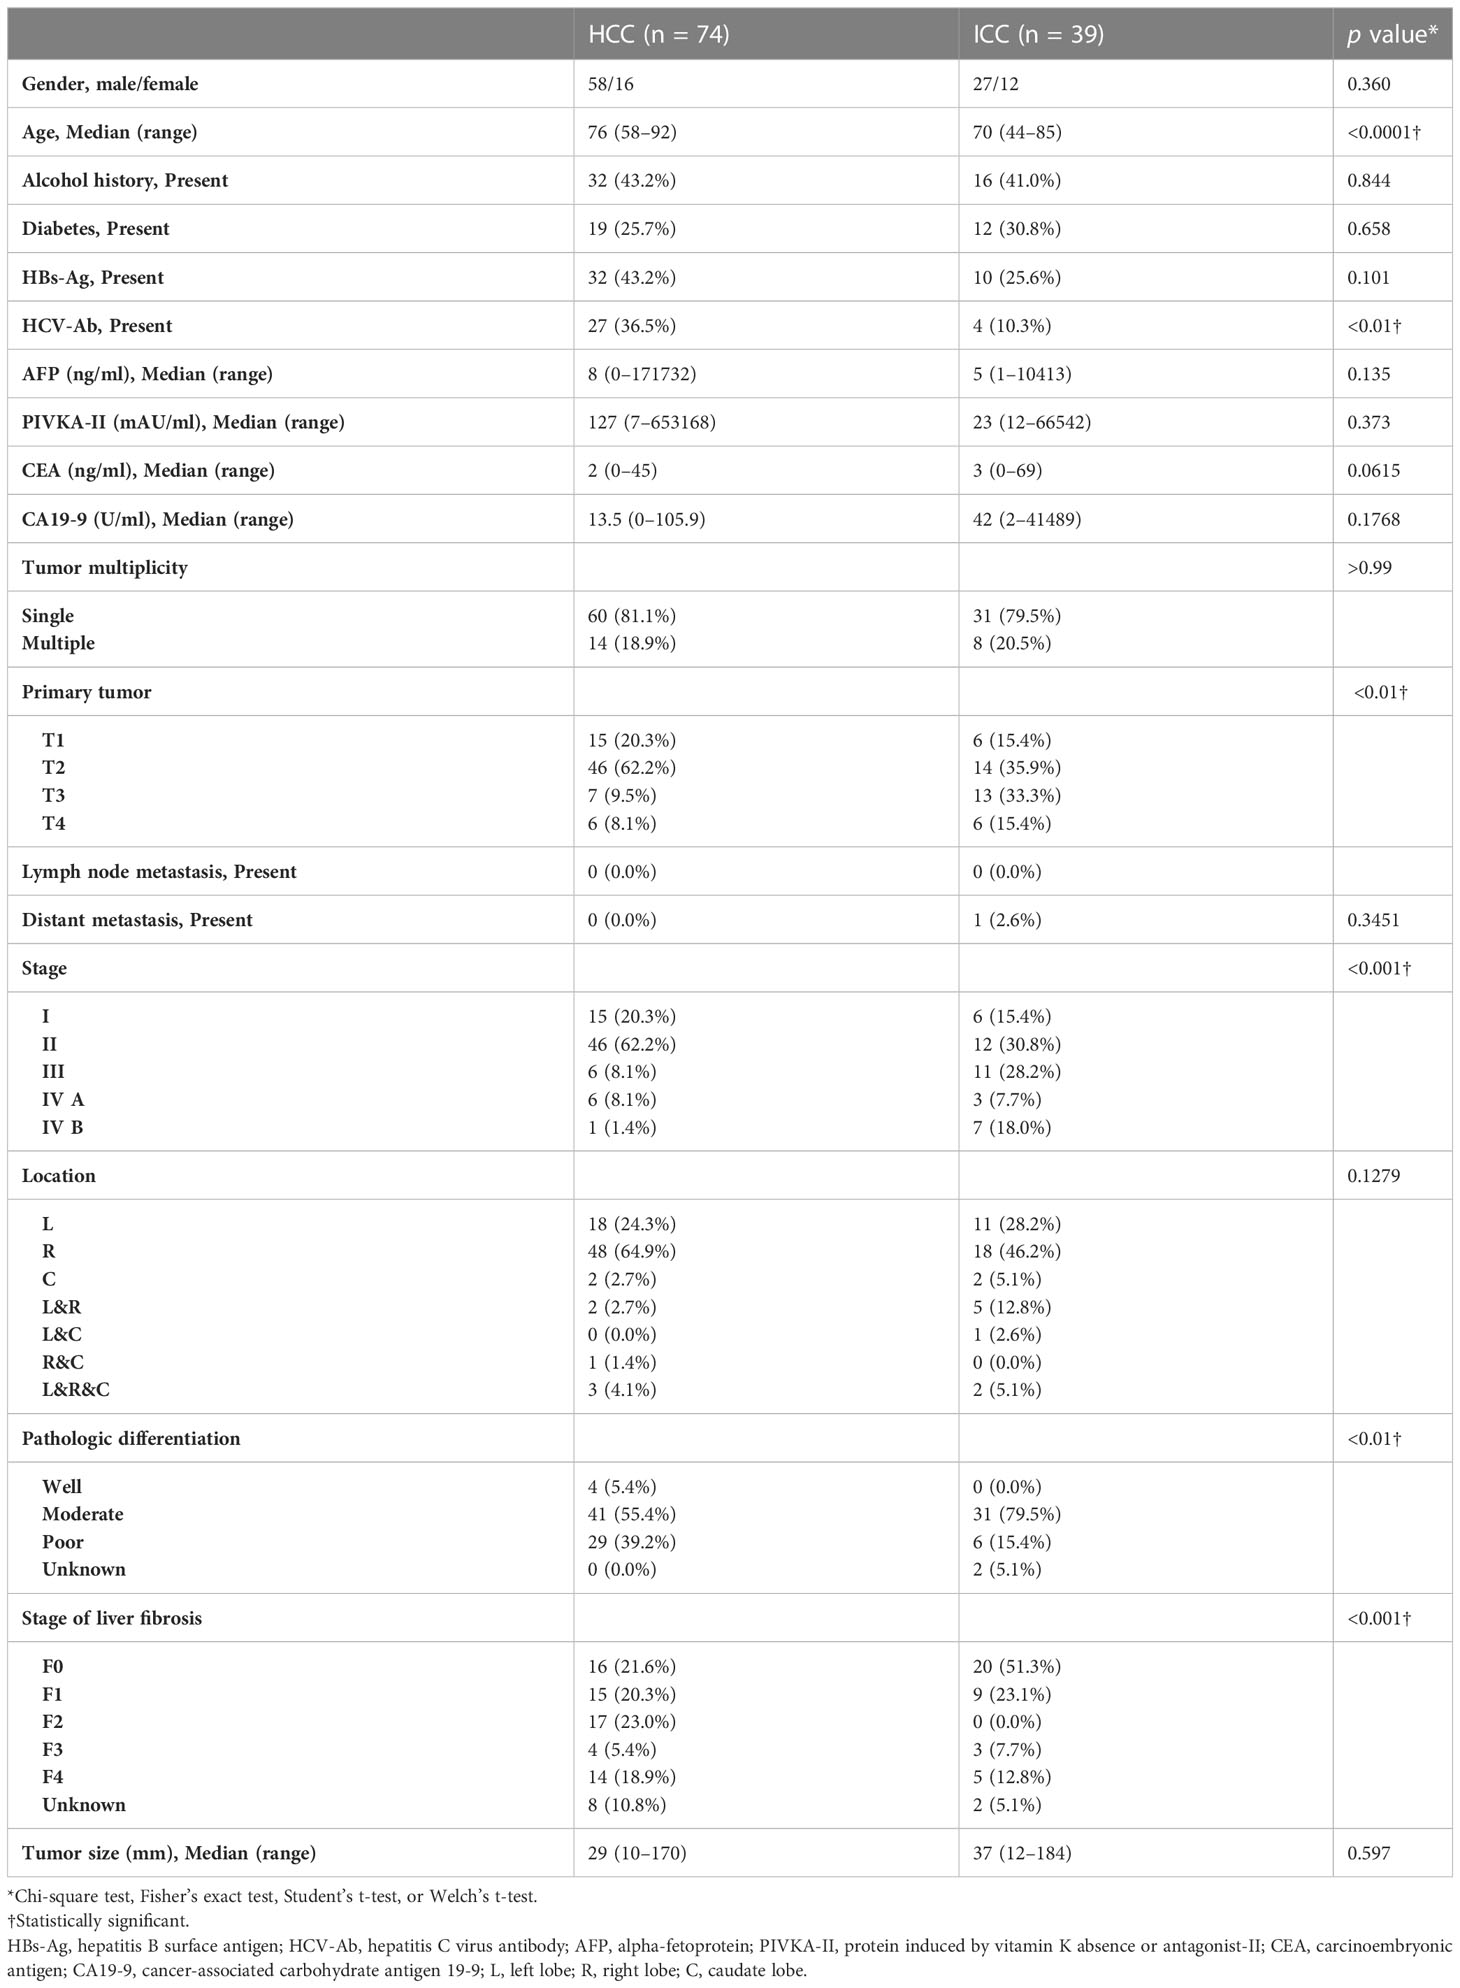
The patient demographics and clinicopathologic characteristics in the HCC and ICC groups are listed in Table 1. There was no difference between the groups in terms of the mean period between the CT scan and surgery day (45.0 ± 28.7 days for ICC vs. 38.4 ± 27.8 days for HCC; p = 0.88) or in the mean period between the day of the hematocrit blood test and the CT scan (7.6 ± 5.8 days for ICC vs. 7.6 ± 13.3 days for HCC; p = 0.51).
Mean fECV was significantly higher in ICCs (43.8% ± 13.2%) than that in HCCs (31.6% ± 9.0%) (p < 0.001) (Figures 2A, 3, 4). The intraclass correlation coefficient for interobserver agreement in the fECV measurements was 0.82; 95% CI: 0.74, 0.87; well correlated. ROC analysis for differentiating ICC from HCC showed that an fECV cutoff value of 41.5% provided the maximum sum of sensitivity (59.0%) and specificity (90.5%). The AUC was 0.763 (Figure 2D).
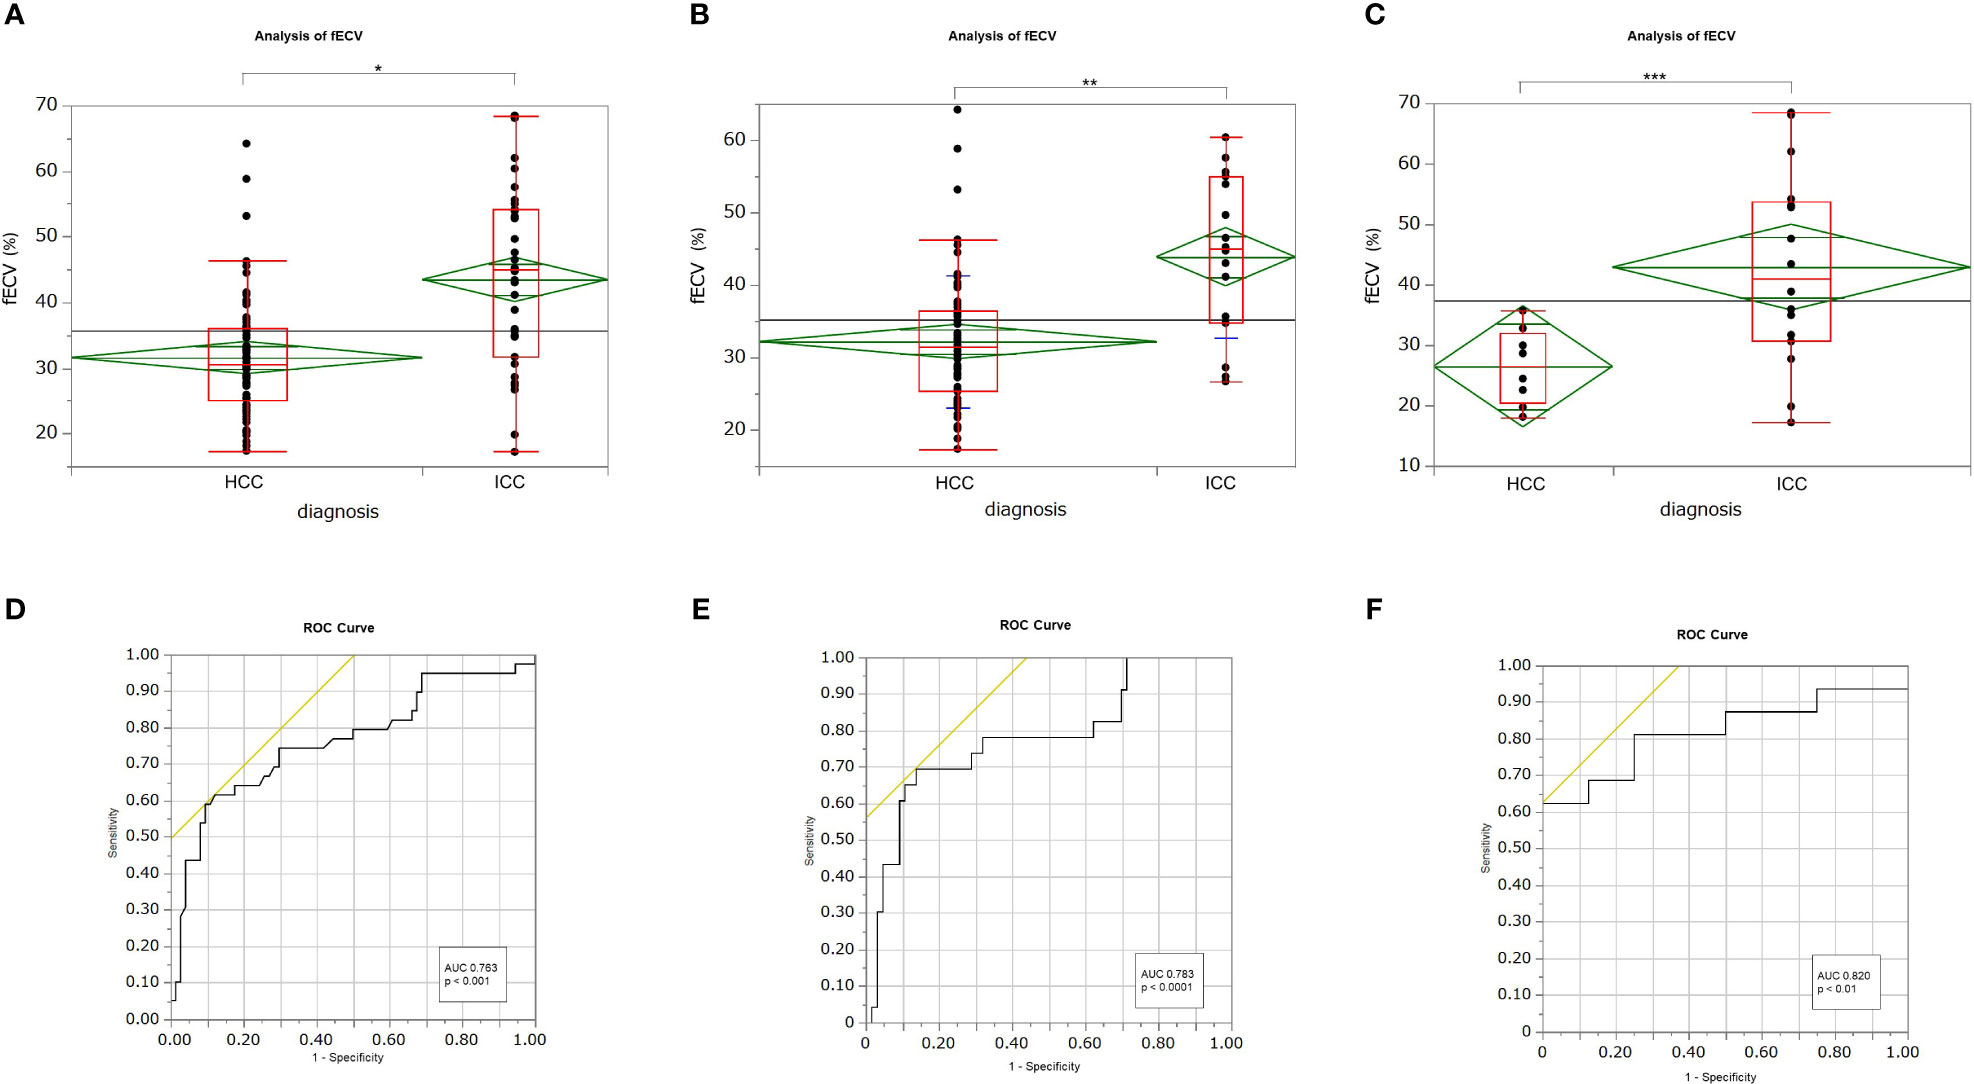
Figure 2 Box-and-whisker plots showing medians and ranges for extracellular volume fraction (fECV) of hepatocellular carcinoma (HCC) and intrahepatic cholangiocarcinoma (ICC) for all patients (A), patients at high risk for HCC (B), and patients at no risk (C), respectively. The grand sample mean is represented by a horizontal black line. The boxes represent the values from the first to the third quartile. The horizontal line in each box represents the median value. The whiskers include values of 1.5 times the interquartile range. The horizontal line within each diamond is the group mean. The diamond is the confidence interval for each group. Mean fECV values were significantly higher in ICCs than those in HCCs, respectively (A: p < 0.001*; B: p < 0.001**; C: p < 0.01***). Receiver operating characteristic (ROC) curves showing the performance in differentiating ICCs from HCCs based on tumor fECV for all patients (D), patients at high risk for HCC (E), and patients at no risk (F). The areas under the curves were 0.763 (D), 0.783 (E), and 0.820 (F), respectively.
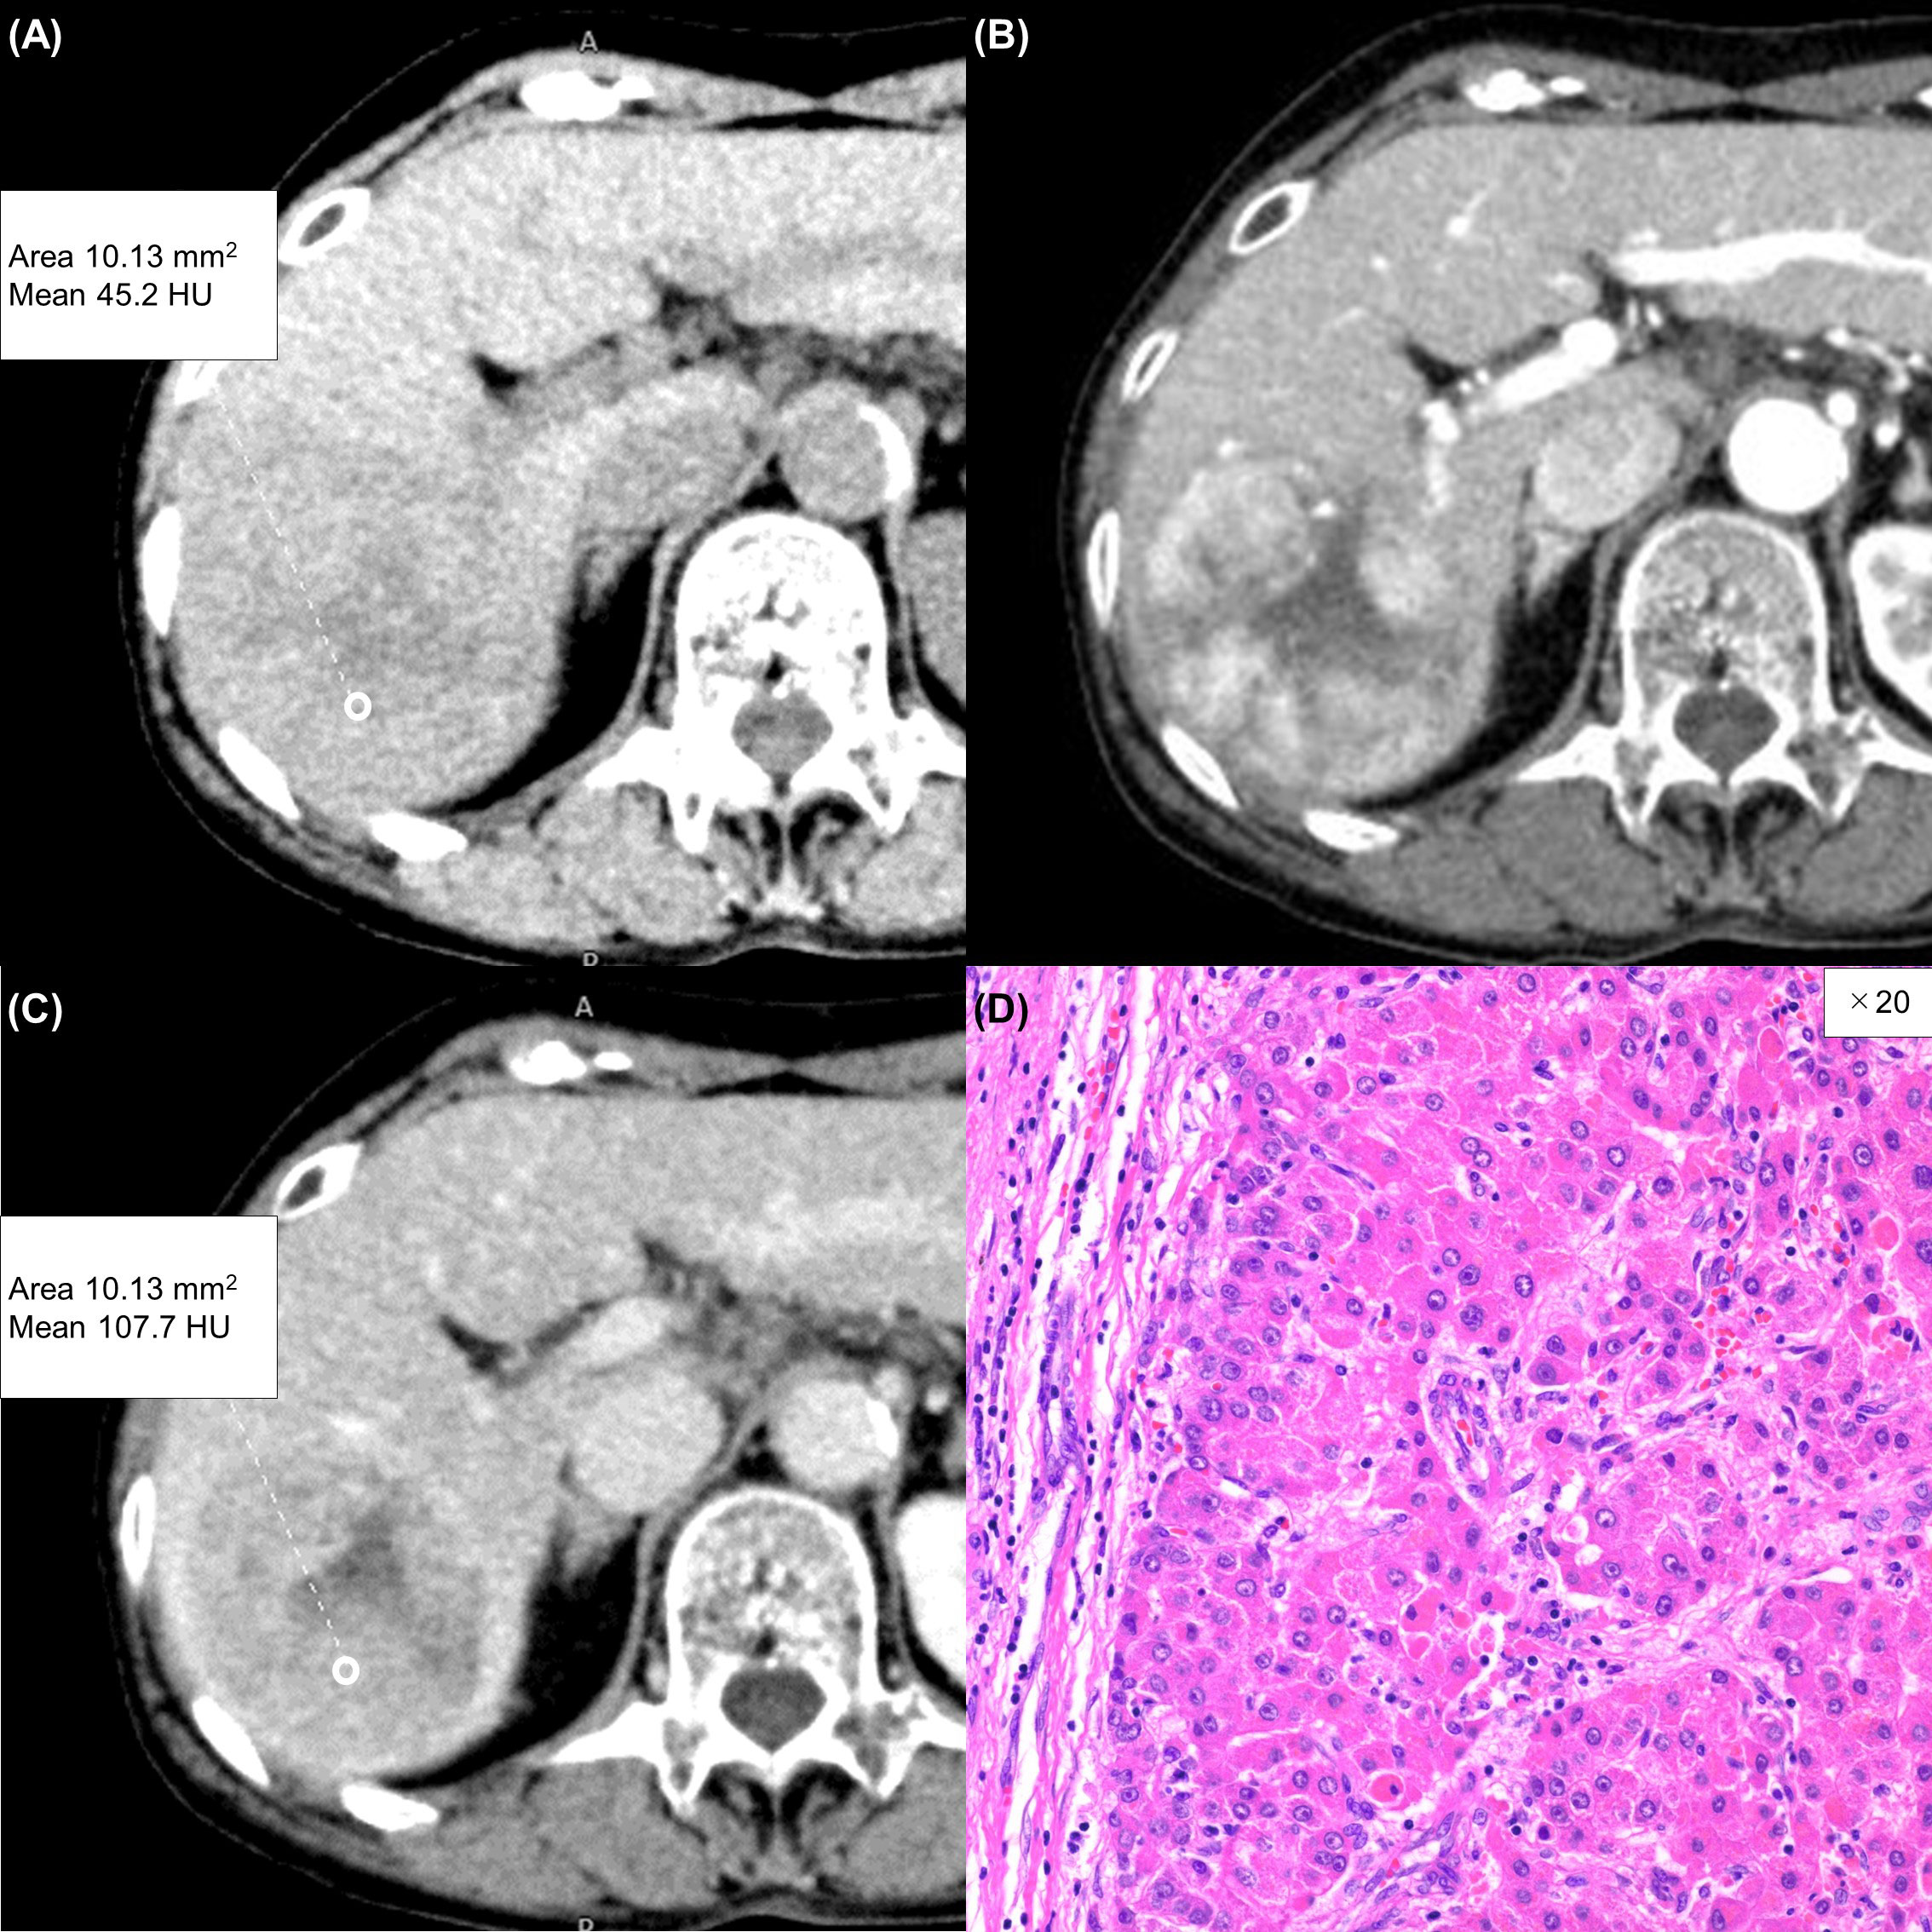
Figure 3 A 75-year-old woman with a typical hepatocellular carcinoma. Precontrast CT shows a round hypodense lesion in the right lobe of the liver (A). The lesion shows inhomogeneous enhancement during the arterial phase (B) and washout during the equilibrium phase (C). A round region of interest was placed in the solid part of the tumor that showed the most remarkable enhancement. Tumor extracellular volume fraction (fECV) is 33.1%, which is below the cutoff value (41.5%). No fibrosis is observed in the tumor histopathologically (D, ×20, hematoxylin-eosin stain).
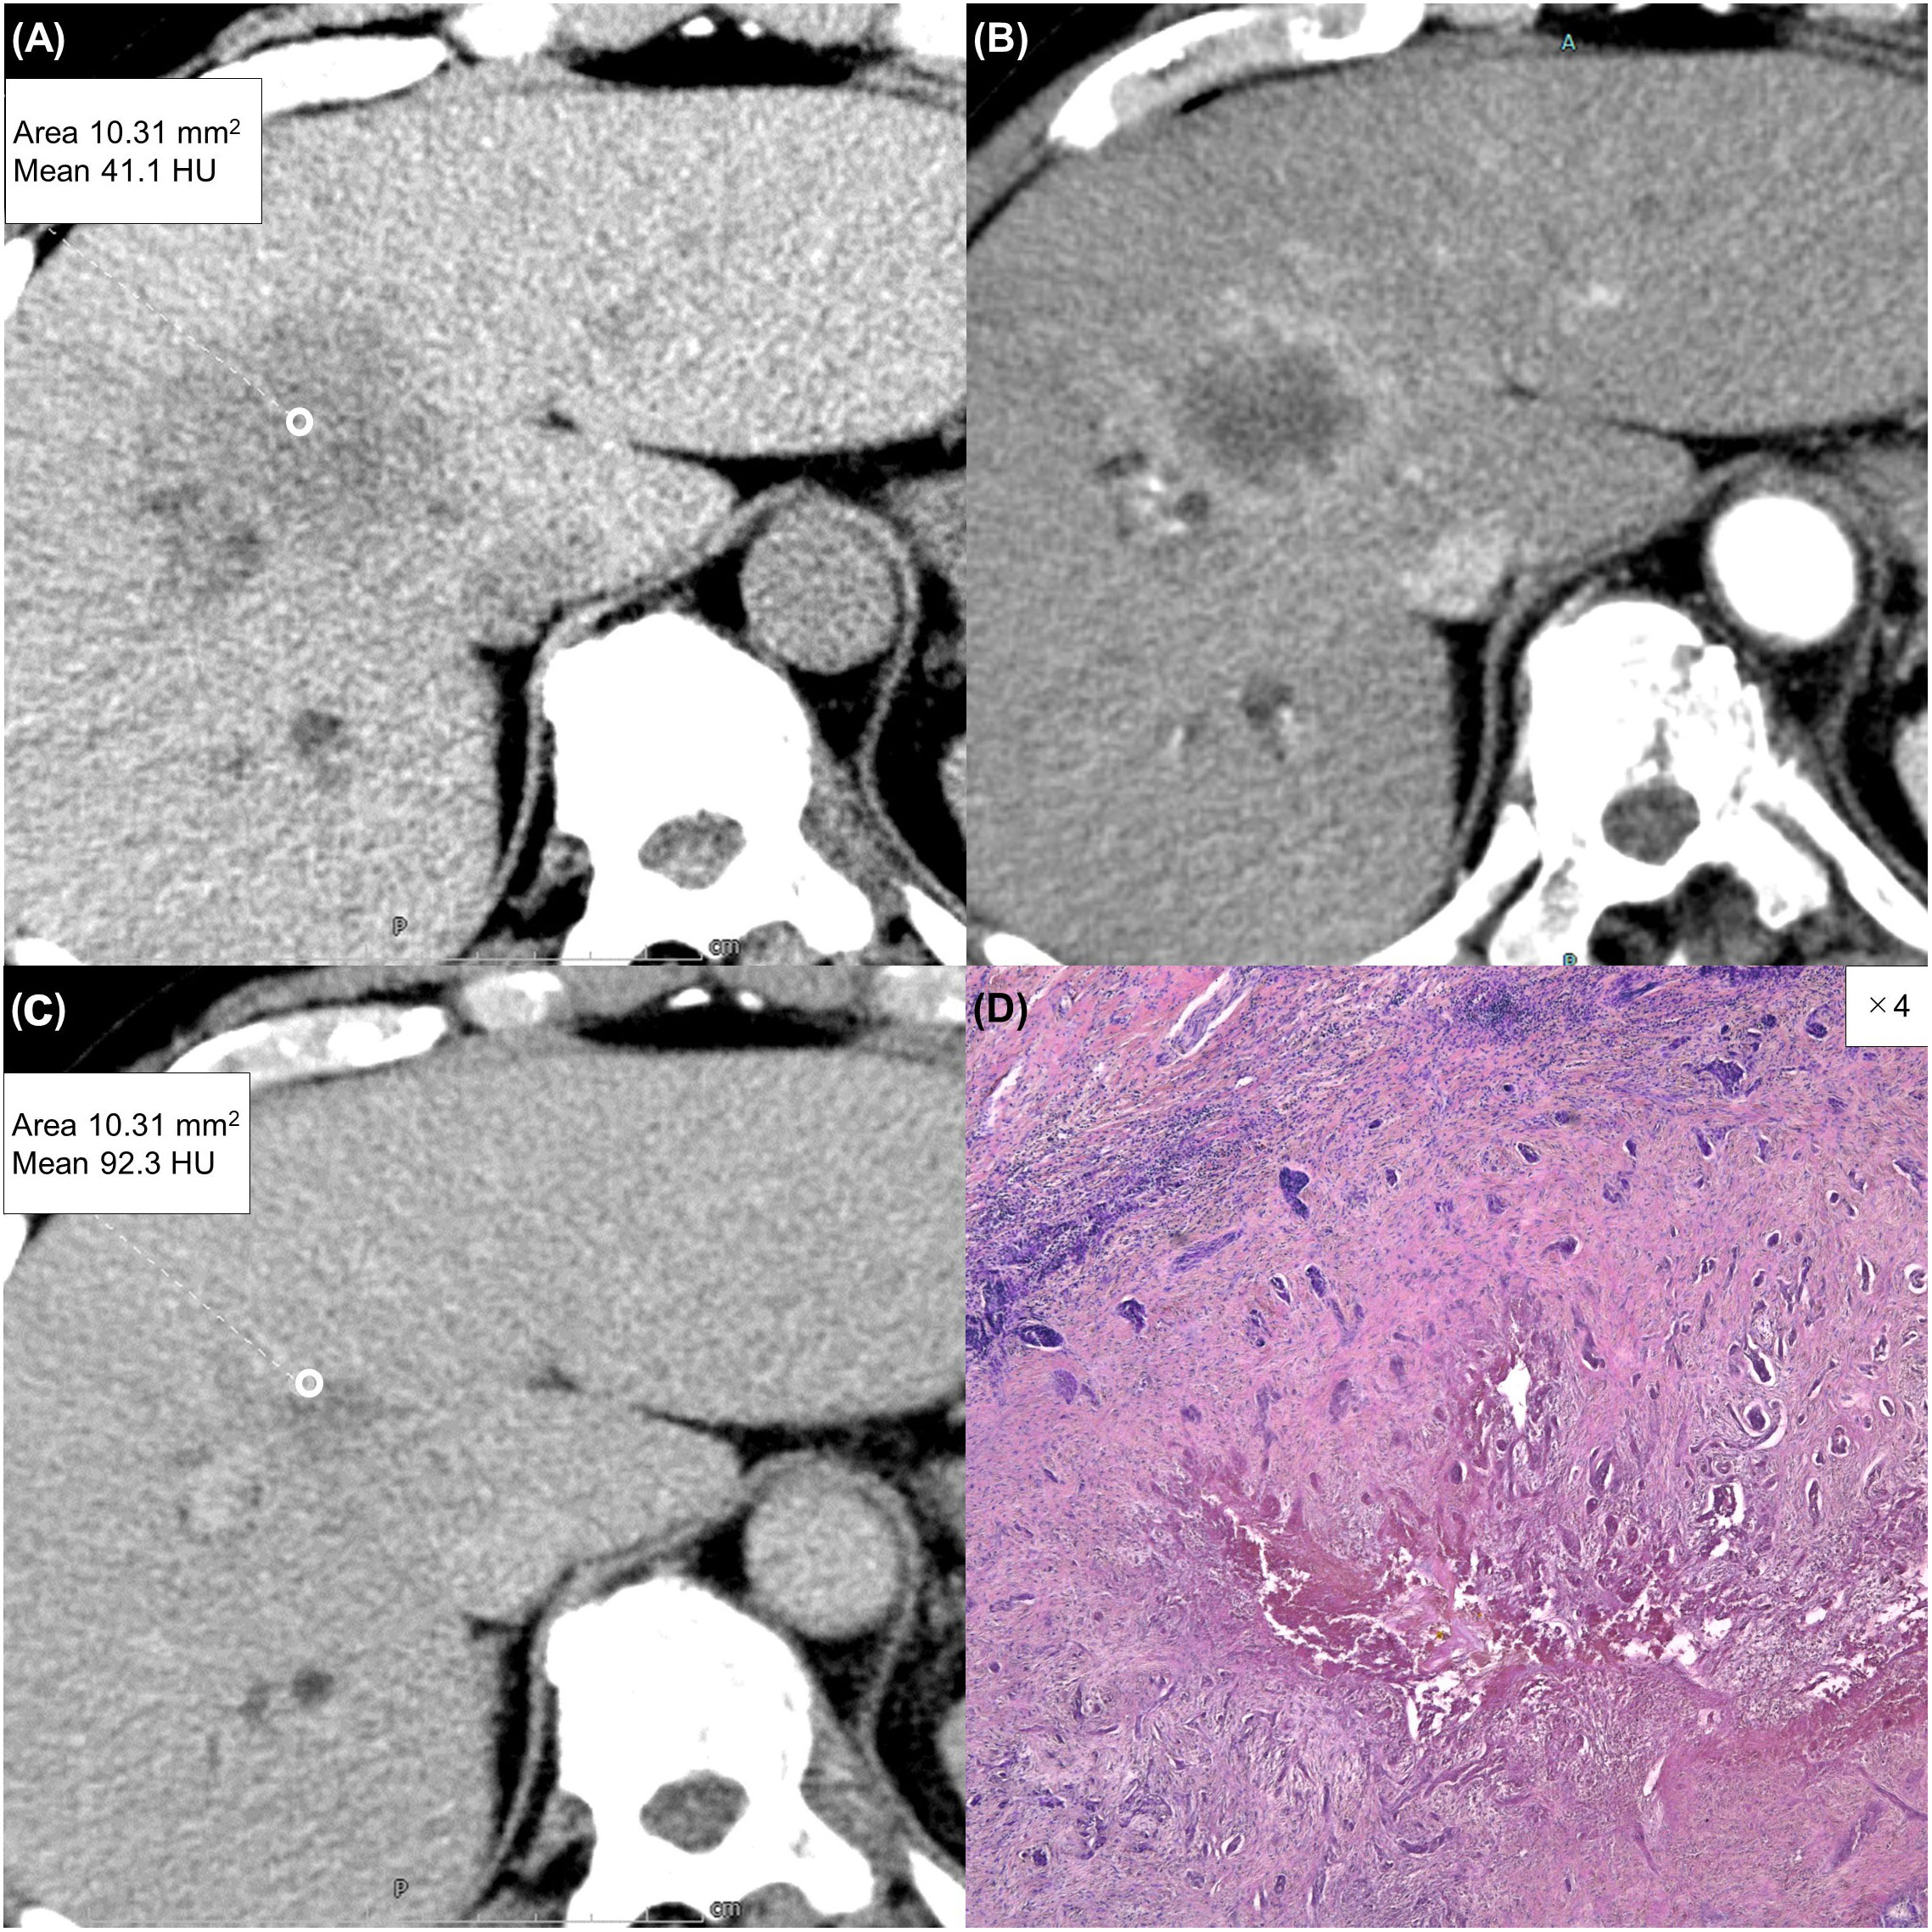
Figure 4 A 63-year-old man with a typical intrahepatic cholangiocarcinoma. Precontrast CT shows a hypodense lesion between the left and right lobes of the liver (A). The lesion shows rim enhancement during the arterial phase (B) and progressive enhancement during the equilibrium phase (C). Tumor extracellular volume fraction (fECV) is 52.6%, which exceeds the cutoff value (41.5%). Fibrosis is observed in the tumor histopathologically (D, ×4, hematoxylin-eosin stain).
Subgroup analysis revealed that in the high-risk HCC group (n = 89), the mean ECV of ICC (43.9% ± 11.1%) was significantly higher than that of HCC (32.2% ± 9.1%) (p < 0.0001) (Figure 2B). ROC analysis showed that a cutoff value of 41.1% for fECV provided the maximum sum of sensitivity (69.6%) and specificity (86.4%), and the AUC was 0.783 (Figure 2E). Even in the non-risk group (n = 24), the mean fECV of ICC (42.9% ± 16.0%) was significantly higher than the mean fECV of HCC (26.5% ± 6.3%) (p < 0.01) (Figure 2C). ROC analysis showed that an fECV cutoff value of 35.9% provided the maximum sum of sensitivity (62.5%) and specificity (100%), and the AUC was 0.820 (Figure 2F).
There was no significant difference between the two groups in terms of the mean ROI area placed in the tumor (10.2 mm2 in the HCC group vs. 10.2 mm2 in the ICC group, p = 0.597) or in the aorta (212 mm2 in the HCC group vs. 227 mm2 in the ICC group, p = 0.650).
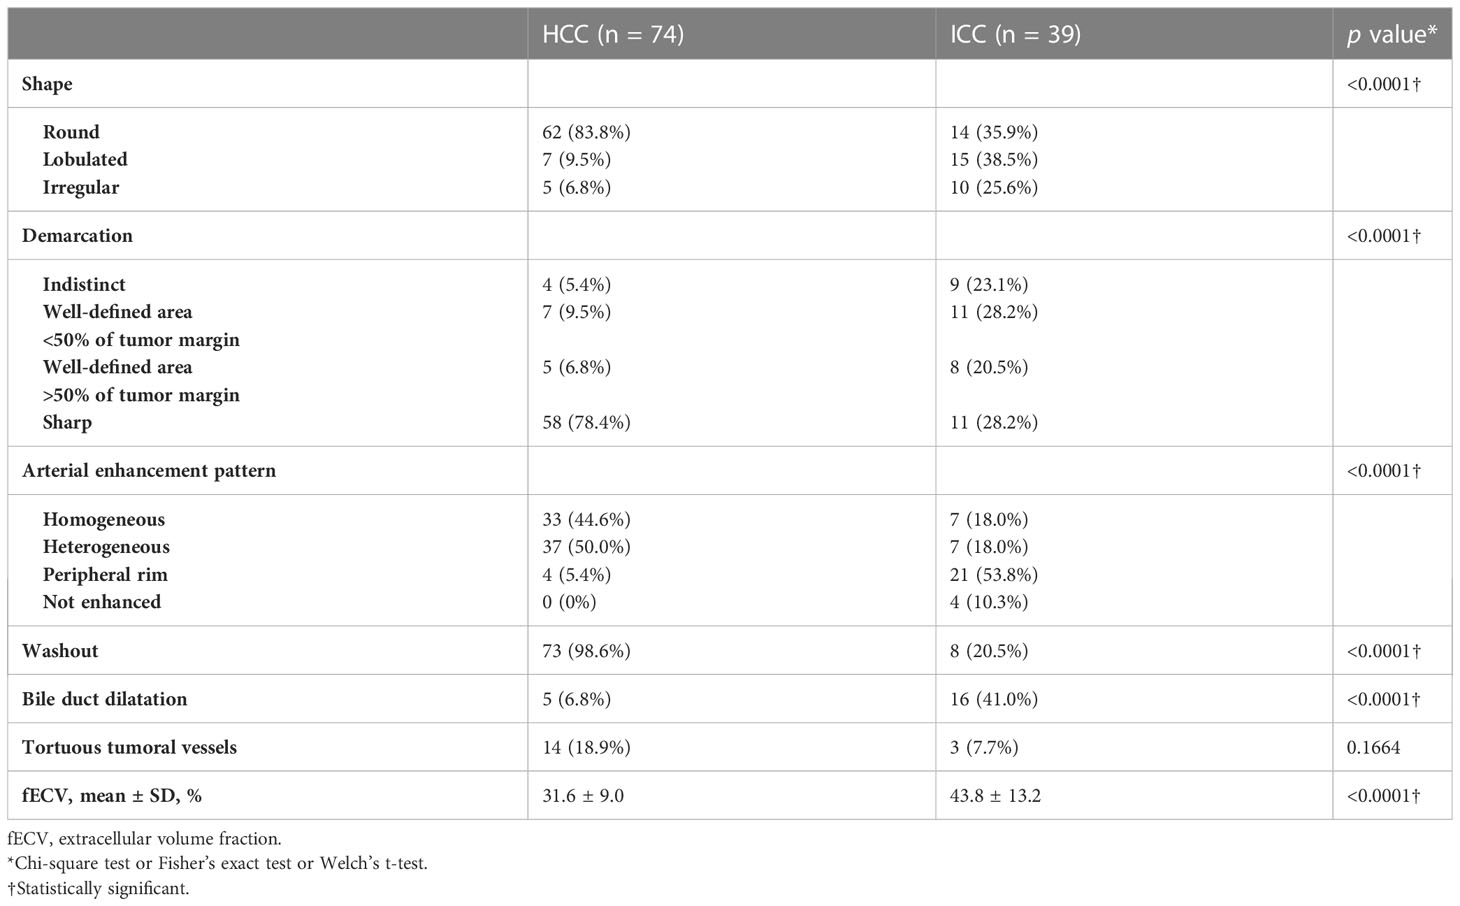
Table 2 lists the morphological and enhancement features in detail for each tumor type. The univariate analyses revealed fECV value, tumor shape, tumor demarcation, arterial enhancement pattern, presence of washout, and presence of bile duct dilatation as significant parameters for differentiating between the two tumors (Table 3). Cohen’s Kappa coefficients of interobserver agreement for each image finding are listed in Table 4. There was excellent agreement for all imaging findings.
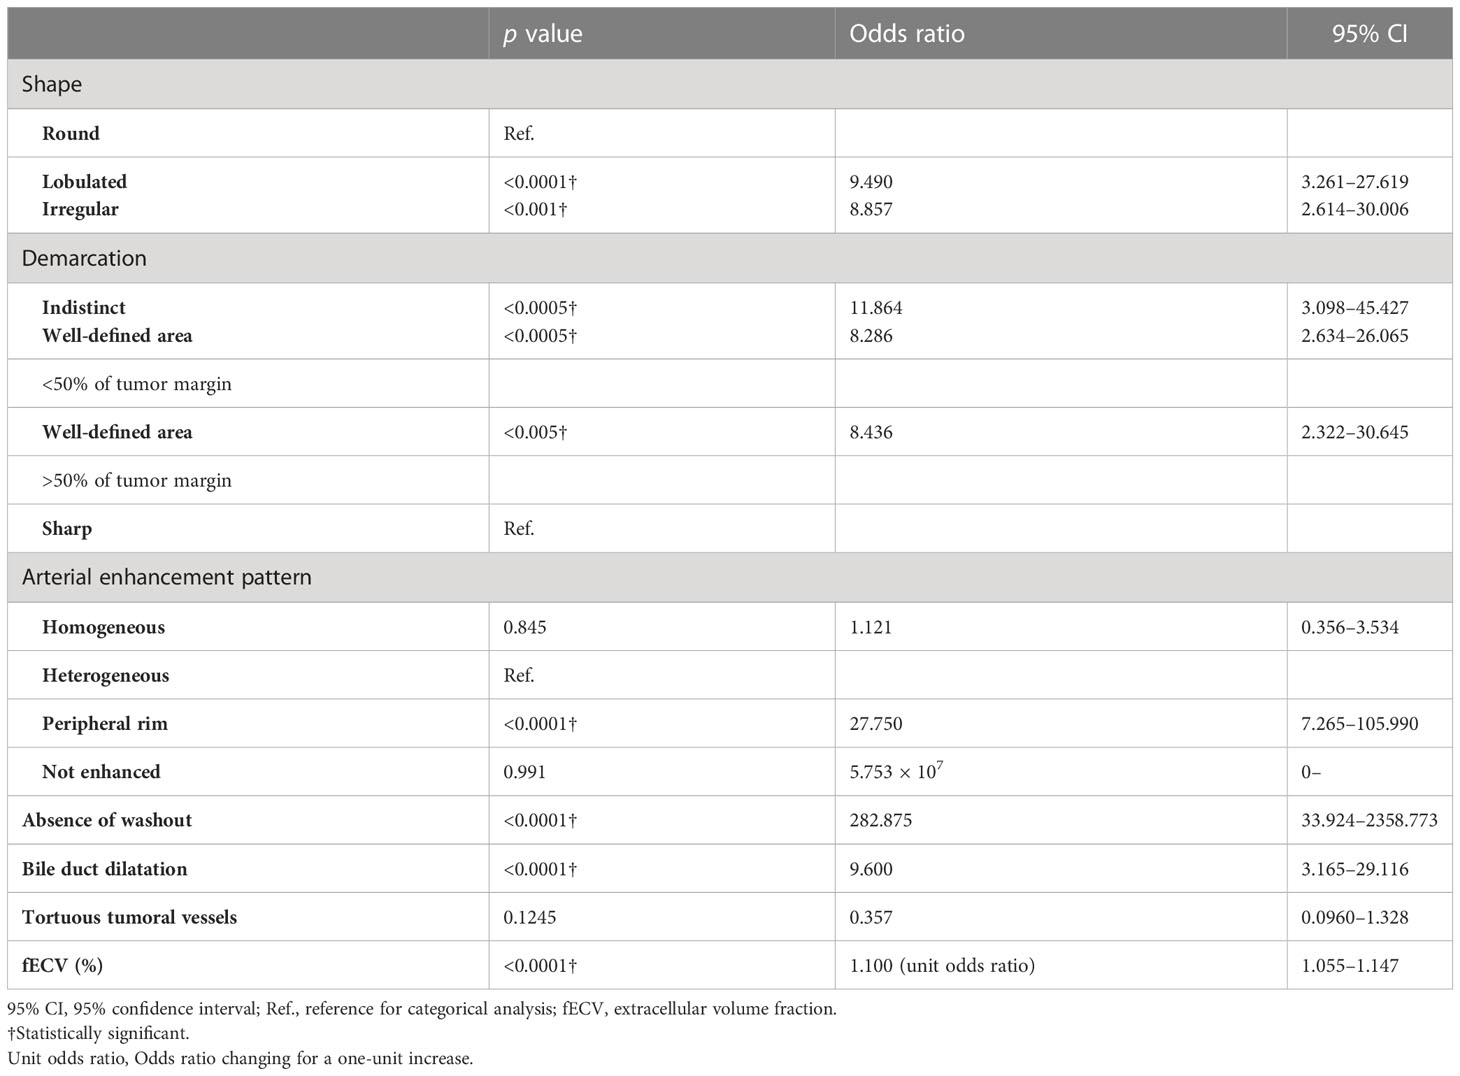
In the multivariate analysis, higher fECV value, peripheral rim enhancement in the arterial phase, and absence of washout pattern were independent variables predictive of ICC (p < 0.05, p < 0.05, p < 0.001, respectively) (Table 5).
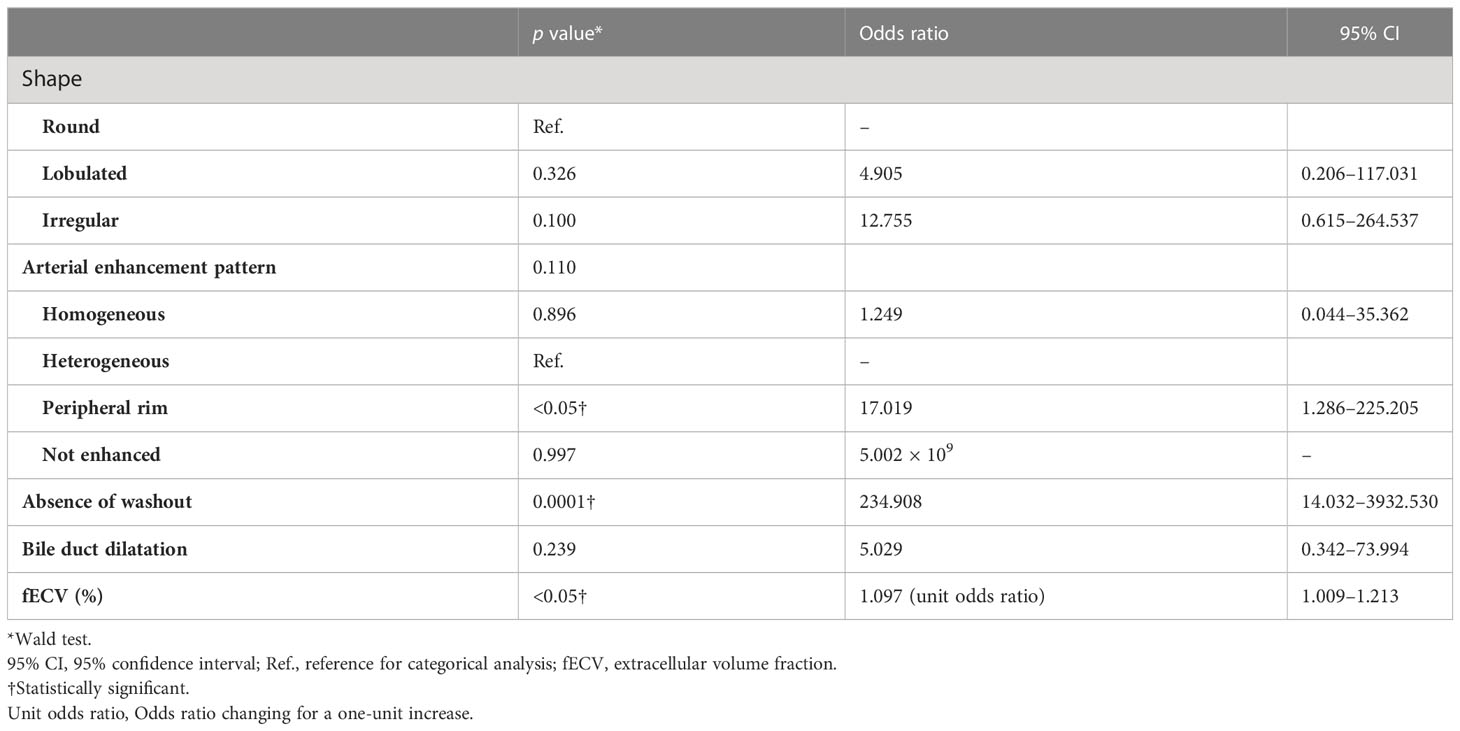
Table 5 Multivariate analysis using multiple logistic regression model for distinguishing ICC from HCC on contrast-enhanced CT.
Among all HCCs, only one HCC was determined to be without washout. The fECV of this tumor was 41.7%, which is slightly higher than the cutoff value of 41.5%, indicating the possibility of ICC. There was discrepancy between the two radiologists regarding the presence or absence of washout in the two HCCs. Their fECV values (28.4% and 20.3%) were lower than the cutoff value, and both were finally determined by the third radiologist to have slight washout (Figure 5). Of the eight ICCs that showed washout pattern, five had fECV values (mean, 54.5%) higher than the cutoff value, indicating the possibility of ICC. In particular, one of these showed inhomogeneous arterial enhancement followed by a washout pattern characteristic of HCC and an fECV (49.6%) that exceeded the cutoff value (41.5%) (Figure 6). Ten ICCs that did not show washout but showed arterial enhancement characteristic of HCC had fECV values (mean, 54.2%) higher than the cutoff value.
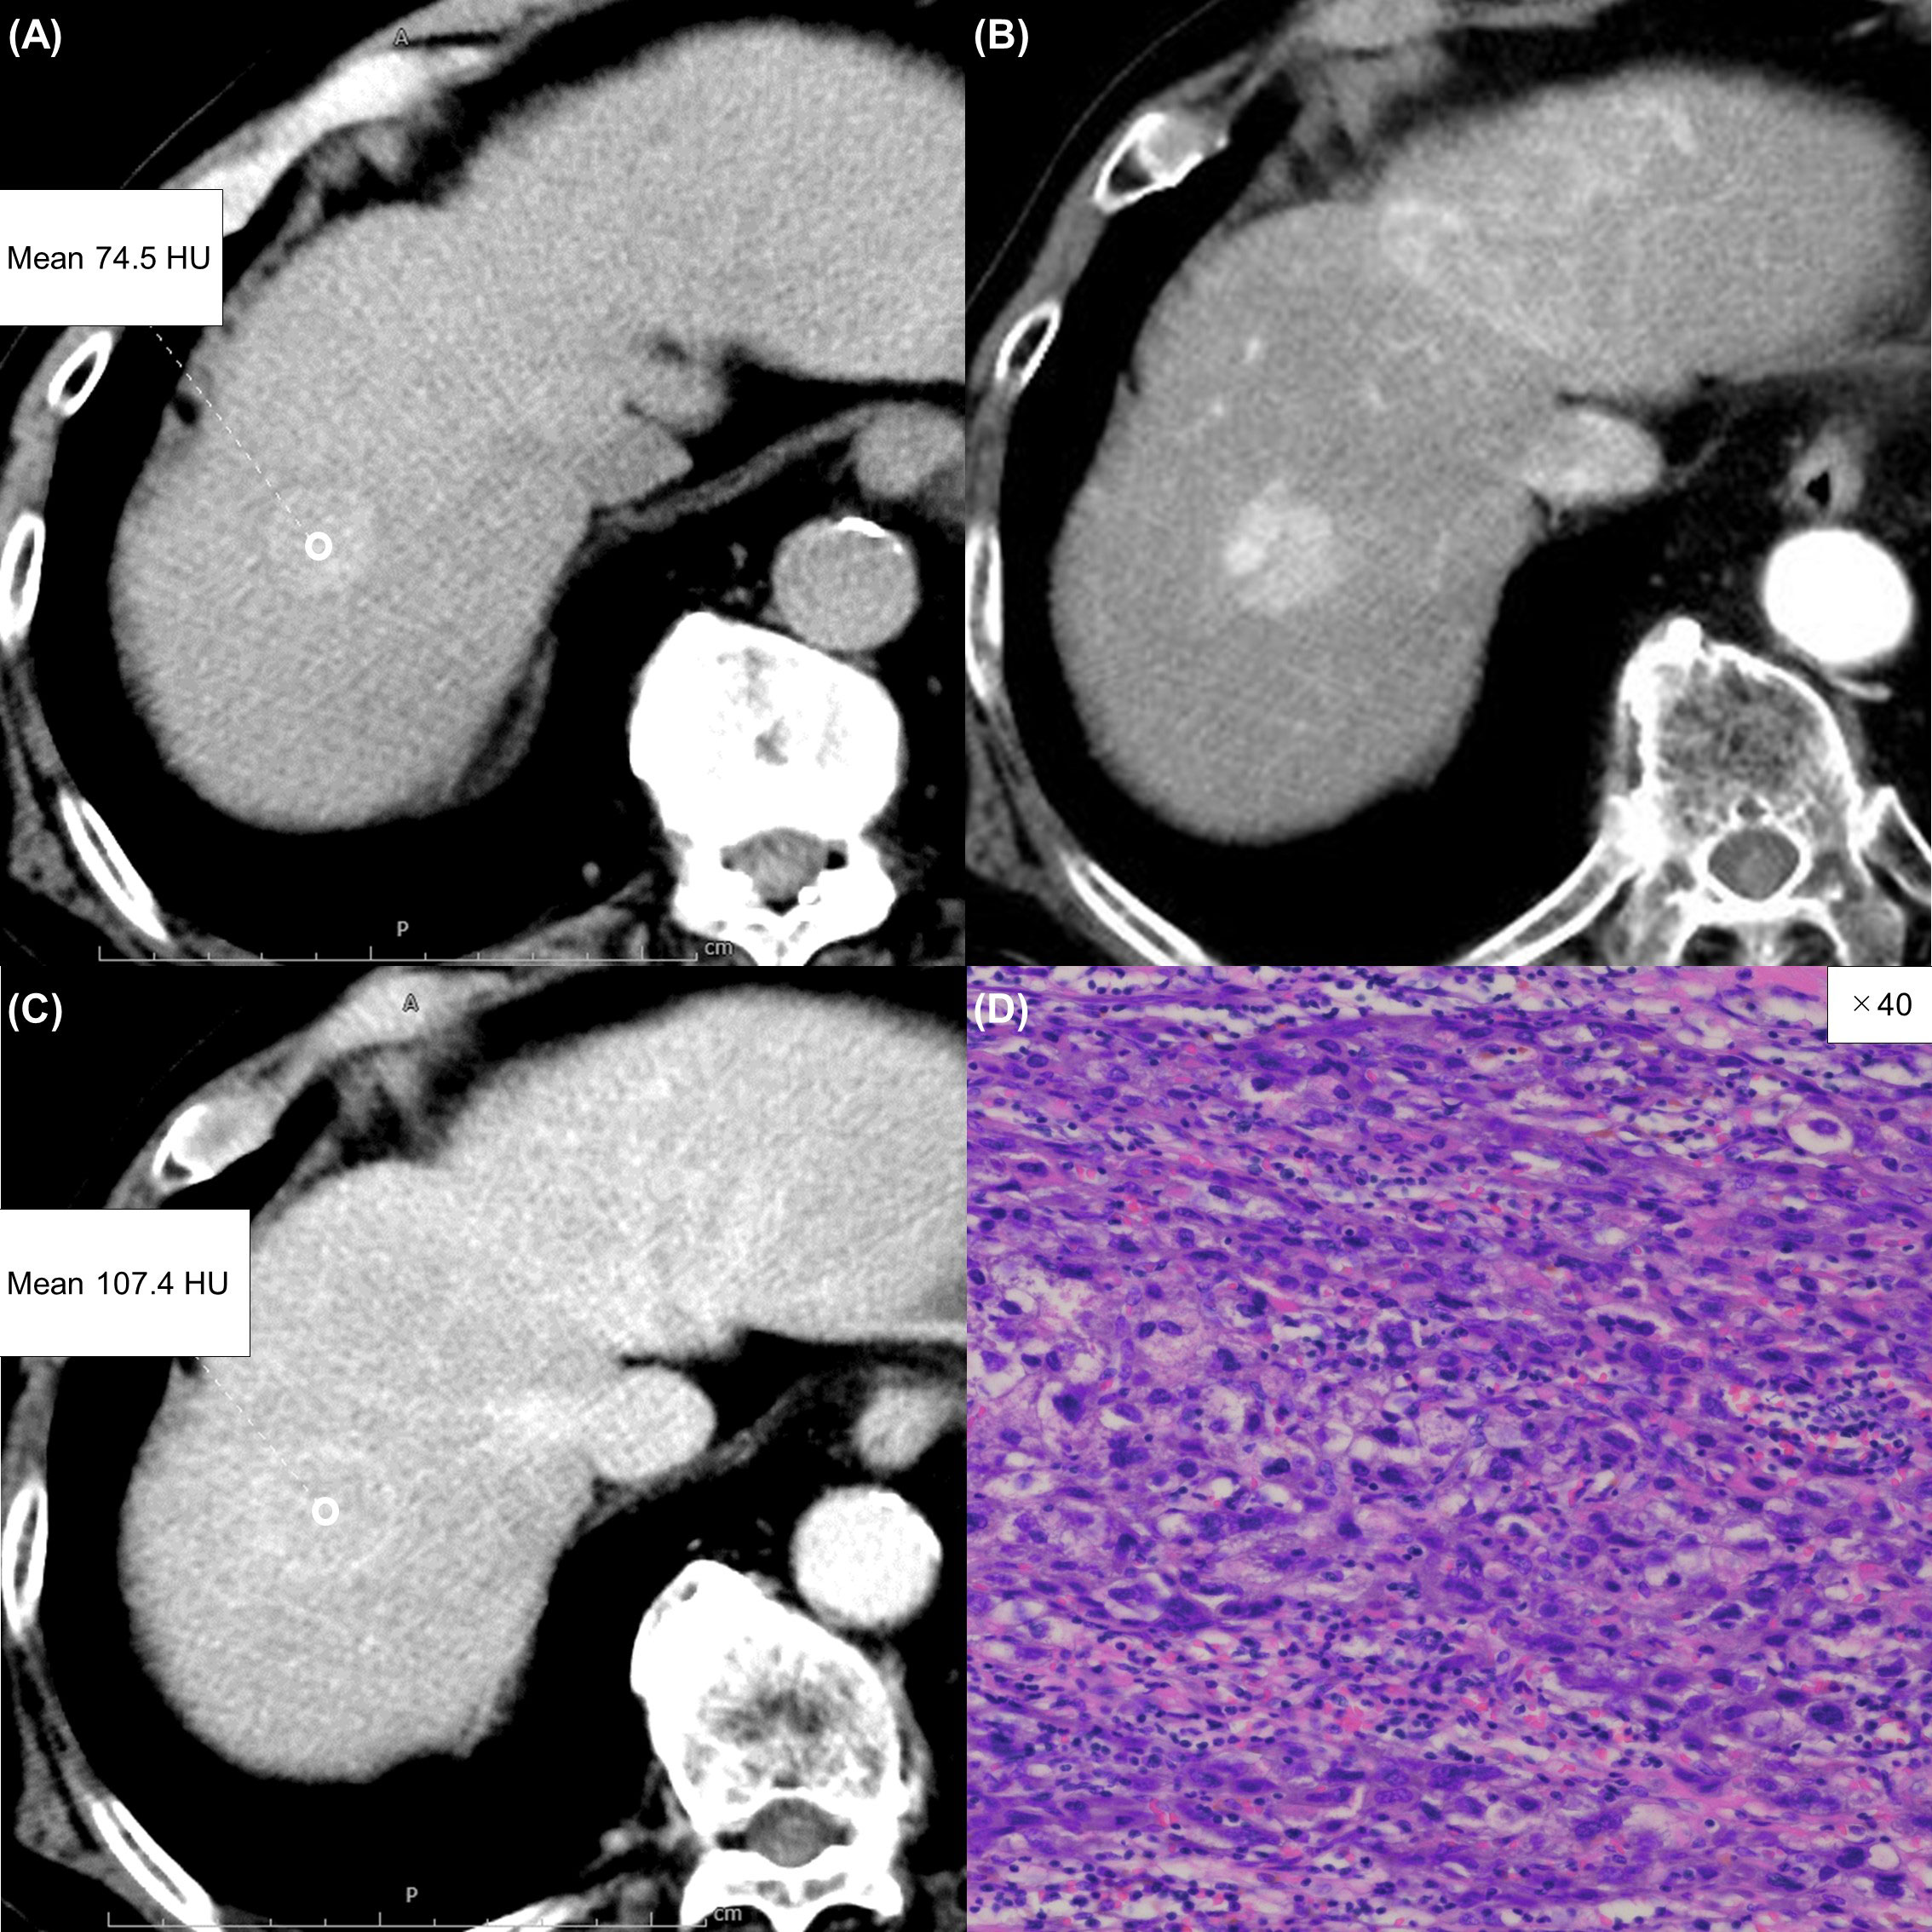
Figure 5 An 85-year-old man with an atypical hepatocellular carcinoma. Precontrast CT shows a round hyperdense lesion in the right lobe of the liver (A). The lesion shows homogeneous enhancement during the arterial phase (B) and slight washout during the equilibrium phase (C). Because of differences in the judgment of washout between readers 1 and 2, reader 3 made the final judgment. Tumor extracellular volume fraction (fECV) is 20.3%, which is below the cutoff value (41.5%). No fibrosis is observed in the tumor histopathologically (D, ×40, hematoxylin-eosin stain).
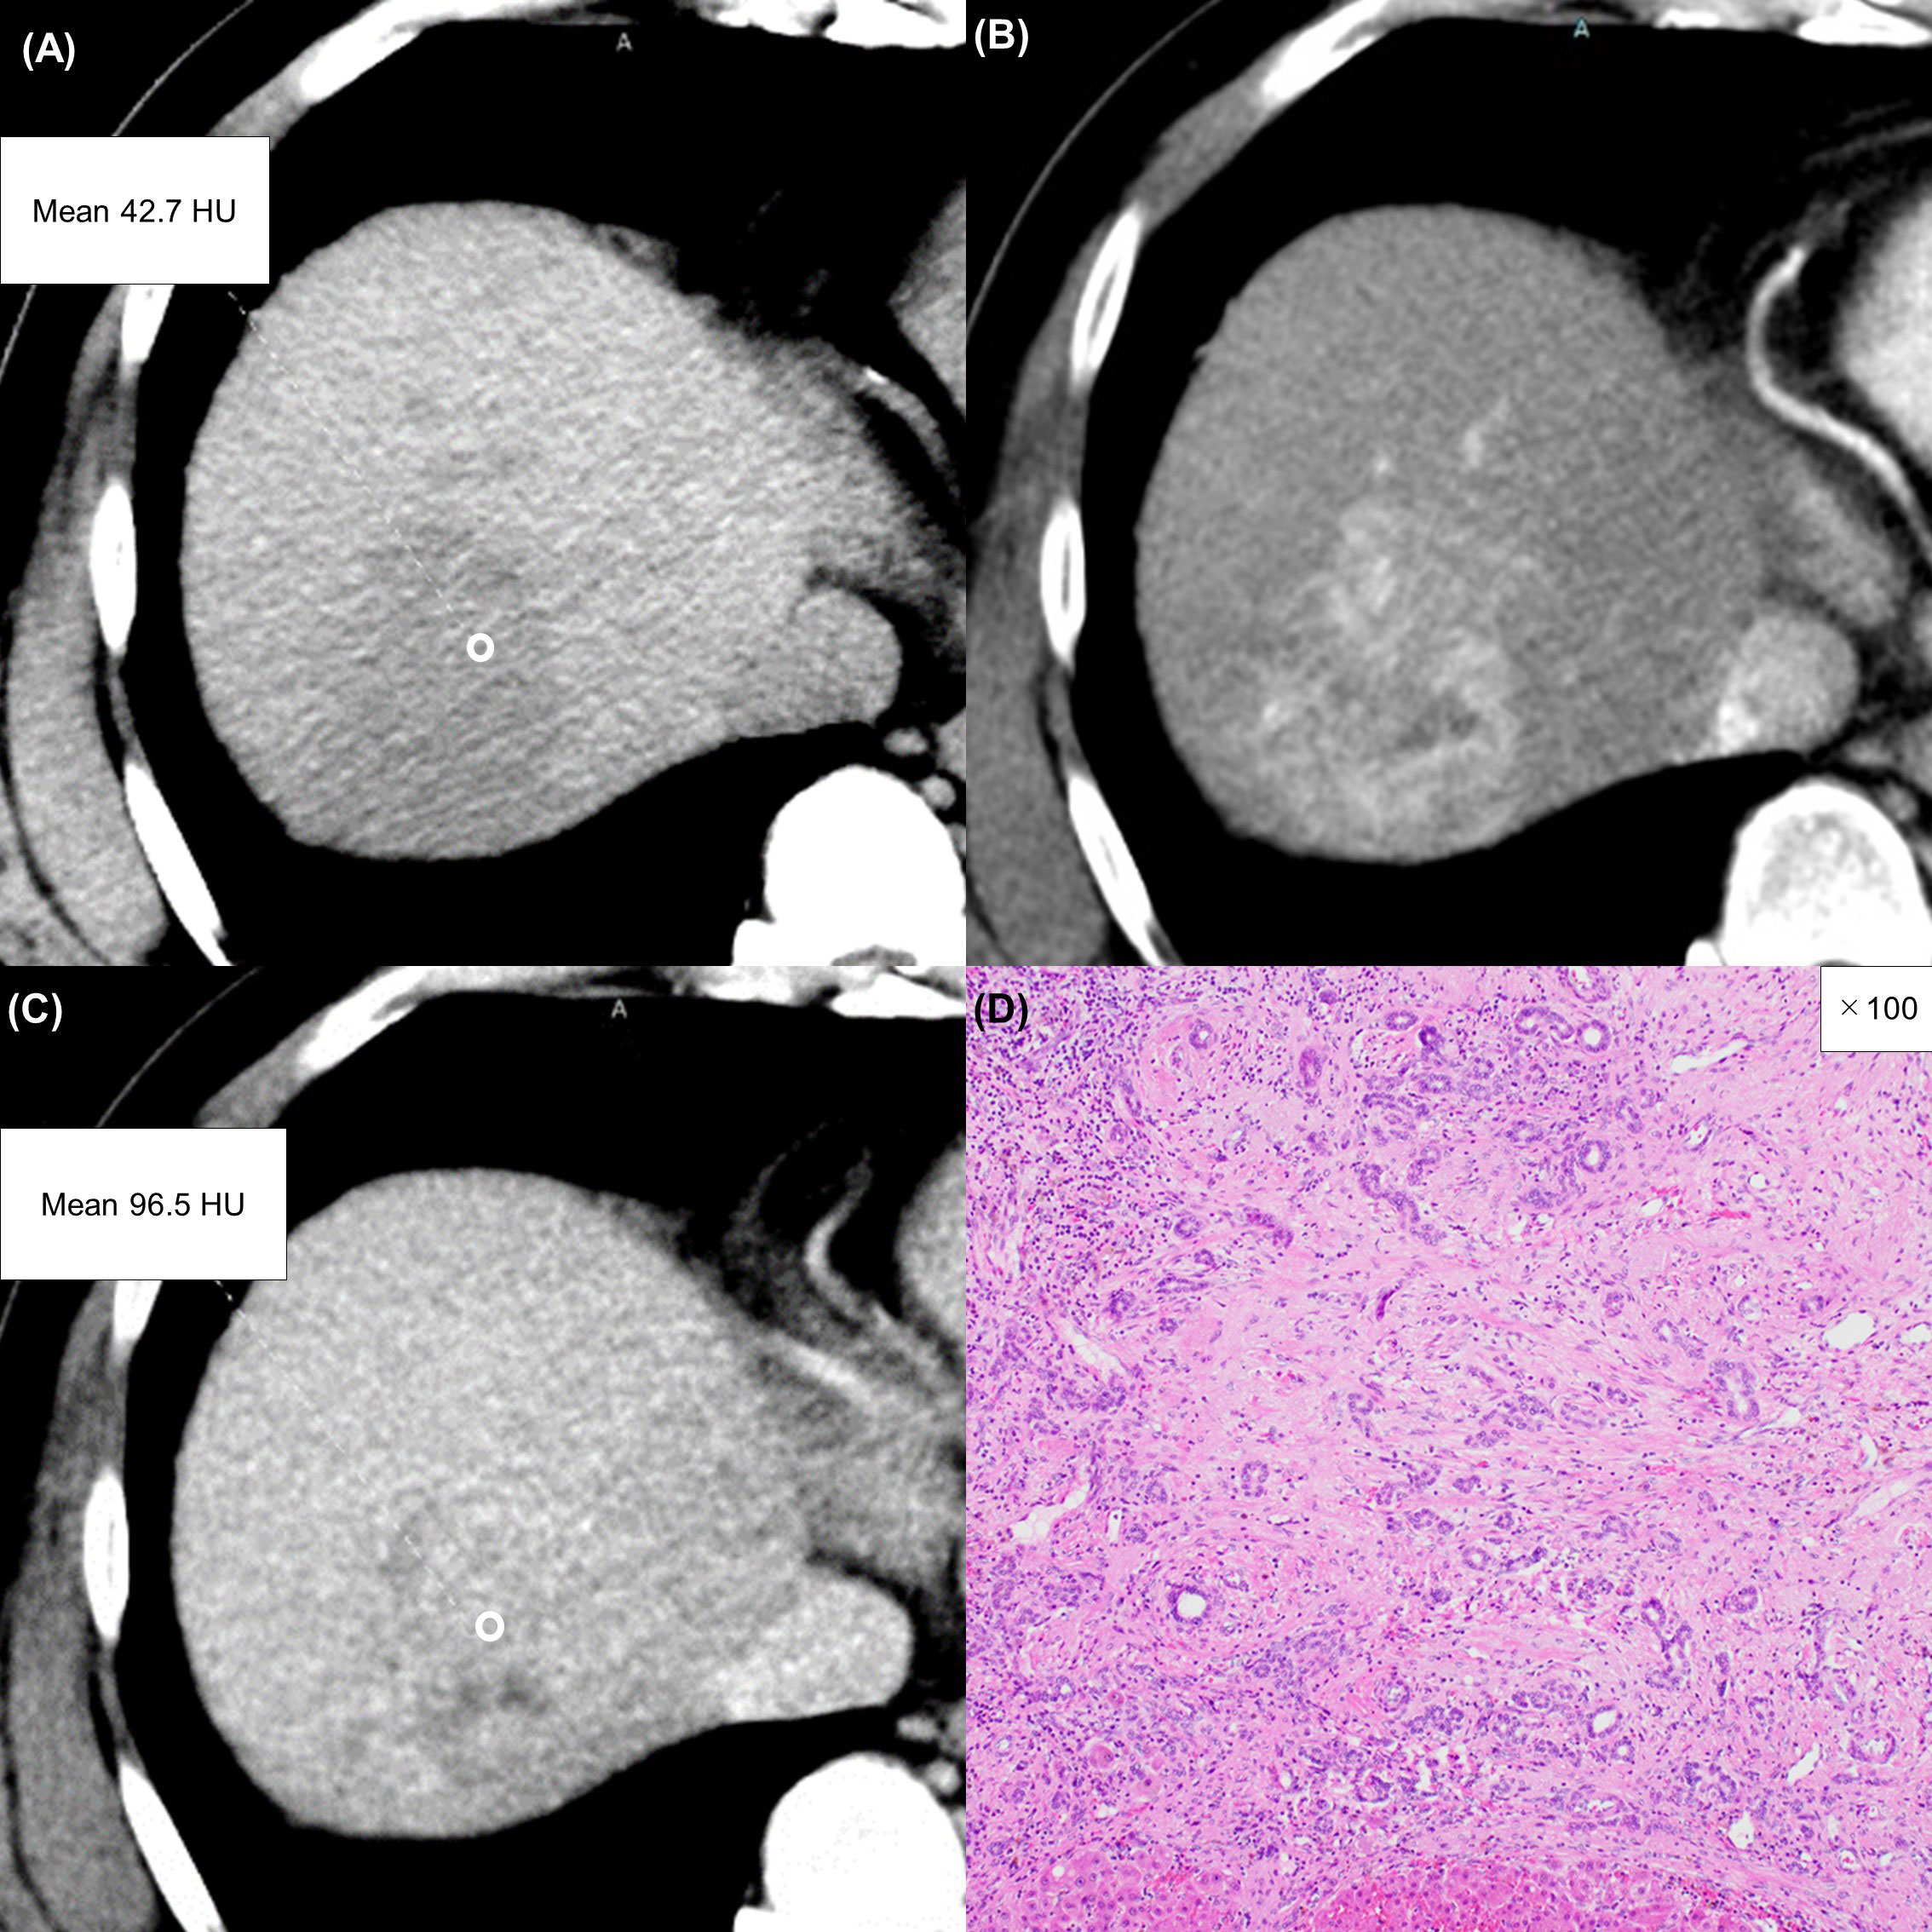
Figure 6 A 57-year-old man with an atypical intrahepatic cholangiocarcinoma. Precontrast CT shows a hypodense lesion in the right lobe of the liver (A). The lesion shows inhomogeneous enhancement during the arterial phase (B) and slight washout during the equilibrium phase (C). These imaging findings can lead to a misdiagnosis of hepatocellular carcinoma. A round region of interest was placed in the solid part of the tumor that showed the most remarkable enhancement. Tumor extracellular volume fraction (fECV) is 49.1%, which exceeds the cutoff value (41.5%). Fibrosis is observed in the tumor histopathologically (D, ×100, hematoxylin-eosin stain).
Discussion
ICC is well known as a representative liver tumor that is rich in fibrous tissue (1, 42, 43). In contrast, with the exception of special types, intratumoral fibrosis is rarely seen in HCC (44). In the present study, fECV values were significantly higher in ICCs than those in HCCs. This finding is thought to be caused by expansion of the third space due to proliferation of intratumoral fibrosis in ICC. Using this difference in fECV between ICC and HCC to differentiate ICC from HCC resulted in a sensitivity and a specificity of 59.0% and 90.5%, respectively. The results of the subgroup analysis suggest that fECV appears to be useful regardless of whether the patient is at risk for HCC or not. Compared to the differentiating ability using MR imaging or LI-RADS in previous articles (23, 27, 49), the use of fECV alone seems to have provided the comparable or slightly inferior differential ability. The present intraclass correlation coefficient analysis for fECV measurement by the two radiologists showed excellent agreement (0.82). Furthermore, fECV can be easily obtained without dedicated instruments or special skills.
LI-RADS is already widely used and is a method that has gained the consensus of many radiologists. Its diagnostic accuracy is also excellent, and the balance between sensitivity and specificity is well adjusted. However, LI-RADS has the disadvantage that its applicable indications are limited to patients with chronic hepatitis B and those with cirrhosis due to certain etiologies and cannot be applied to other patients. In addition, there are many imaging findings to evaluate and the algorithm is relatively complicated. Differentiation by fECV can be used regardless of the presence or absence of HCC risk, according to the results of the subgroup analysis of the current study. Furthermore, this analysis can be performed when precontrast and equilibrium phase images are available, even when arterial phase images are not available due to inappropriate timing or respiratory artifacts.
The multivariate analysis revealed enhancement pattern in the arterial phase, absence of washout finding, and high fECV as significant factors predictive of ICC. Because the fECV value is independent of enhancement pattern in the arterial phase and the washout findings, adding the fECV value to conventional image evaluation may potentially improve diagnostic accuracy for ICC and HCC. Adding fECV evaluation to current LI-RADS decisions as an ancillary feature might also improve diagnostic accuracy for HCC.
Areas of delayed or prolonged enhancement inside a liver tumor on CT are widely considered to correspond histopathologically to fibrotic stroma (42, 43). The cause of this appearance has been reported to be the slow wash-in and washout of the extravascular flux of iodinated contrast material in fibrous tissue (50). From this fact, it had been inferred that the fECV value might correlate to the washout finding and these might not be independent factors, as both demonstrate the behavior of contrast medium in the fibrous tissue of a tumor during the equilibrium phase. However, the present multivariate analysis revealed washout finding and fECV value as independent factors for the following reason. Unlike washout pattern, the fECV value is not affected by the CT value of the surrounding liver parenchyma. Also, unlike washout pattern, the fECV value is affected by the CT value on the precontrast image. We consider that these differences enable the fECV value and washout finding to be used as independent factors. There are two possible causes of washout despite high fECV, or vice versa. The first of these is fatty liver and tumor fatty deposits (51). The determination of washout by LI-RADS indicates that the mass has visually lower attenuation than the surrounding liver parenchyma during the portal venous and/or equilibrium phases. Therefore, visual contrast is affected when the CT value of the hepatic parenchyma is low or when the CT value of the tumor is low. Similarly, visual contrast is also affected in pathologies that cause an increase in CT values, such as metal deposits in hepatic parenchyma or tumors. Visual contrast can additionally be affected when the degree of contrast of the liver parenchyma is influenced by body size or the amount of contrast agent administered. The calculated fECV value appears to indicate the contrast effect in a tumor independently of the visual contrast between the tumor and the liver parenchyma. The second cause is that even if a tumor shows partial washout (determined to have washout), the fECV can be high in tumors that have a partial high contrast portion in the equilibrium phase.
To accurately detect the characteristics of fibrosis, the present ROIs were set and measured at portions of the tumor where fibrosis was most likely to be rich, i.e., in areas with a high contrast enhancement during the equilibrium phase. We also considered contouring the entire tumor as the ROI, but this method was not adopted due to the risk of contamination by necrotic areas adversely affecting the evaluation of fibrosis. We were concerned that the subjectivity of the measurer could affect reproducibility when the ROIs were placed in areas that appeared visually to have high contrast enhancement; however, the present interobserver agreement was excellent (intraclass correlation coefficient, 0.82). This result indicates adequate reproducibility.
This retrospective cohort study has several limitations. First, CT values during the equilibrium phases can be influenced by various factors, including the type of CT scanner, scan protocol, and contrast enhancement protocol (52, 53). As the present CT images were obtained by three different scanners, differences among the scanners may not have had a significant influence on CT values. Second, our study did not include other hepatic tumors such as combined hepatocellular cholangiocarcinoma. Further investigations are required that include other entities. Finally, in the present study, we evaluated only arterial rim enhancement, washout pattern, and peripheral bile duct dilation as representative imaging findings in the multivariate analysis due to the small number of cases. We would like to emphasize that other findings, including enhancing capsule, are also important findings in the differentiation of HCC and ICC.
In conclusion, multivariate analysis identified a higher value of fECV, peripheral rim enhancement in the arterial phase, and absence of washout pattern as independent factors for distinguishing ICC from HCC. The addition of fECV analysis to the evaluation of imaging features on contrast-enhanced CT could potentially improve the accuracy of differentiating between ICC and HCC.
Data availability statement
The raw data supporting the conclusions of this article will be made available by the authors, without undue reservation.
Ethics statement
The studies involving human participants were reviewed and approved by Graduate School of Medicine, Osaka University. Written informed consent for participation was not required for this study in accordance with the national legislation and the institutional requirements.
Author contributions
TH, HO, and NT contributed to conception and design of the study. HF, KY, KK, AN, TT, TO, MT, ST, SK, and HE organized the database. TH and HO performed the statistical analysis, wrote the manuscript. All authors contributed to manuscript revision, read, and approved the submitted version.
Conflict of interest
The authors declare that the research was conducted in the absence of any commercial or financial relationships that could be construed as a potential conflict of interest.
Publisher’s note
All claims expressed in this article are solely those of the authors and do not necessarily represent those of their affiliated organizations, or those of the publisher, the editors and the reviewers. Any product that may be evaluated in this article, or claim that may be made by its manufacturer, is not guaranteed or endorsed by the publisher.
Abbreviations
HCC, hepatocellular carcinoma; ICC, intrahepatic cholangiocarcinoma; CT, computed tomography; MR, magnetic resonance; LI-RADS, Liver Imaging Reporting and Data System; fECV, extracellular volume fraction; HU, Hounsfield units; ROI, region of interest; AUC, area under the curve; ROC, receiver operating characteristic.
References
1. Bosman FT, Carneiro F, Hruban RH. WHO classification of tumours of the digestive system. 4th edition. Lyon: World Health Organization (2010).
2. Khan SA, Thomas HC, Davidson BR, Taylor-Robinson SD. Cholangiocarcinoma. Lancet (2005) 366:1303–14. doi: 10.1016/S0140-6736(05)67530-7
3. Amini N, Ejaz A, Spolverato G, Maithel S, Kim Y, Pawlik T. Management of lymph nodes during resection of hepatocellular carcinoma and intrahepatic cholangiocarcinoma: a systematic review. J Gastrointest Surg (2014) 18:2136–48. doi: 10.1007/s11605-014-2667-1
4. Tsunematsu S, Chuma M, Kamiyama T, Miyamoto N, Yabusaki S, Hatanaka K, et al. Intratumoral artery on contrast-enhanced computed tomography imaging: differentiating intrahepatic cholangiocarcinoma from poorly differentiated hepatocellular carcinoma. Abdom Imag (2015) 40:1492–9. doi: 10.1007/s00261-015-0352-9
5. Tsukamoto M, Yamashita YI, Imai K, Umezaki N, Yamao T, Okabe H, et al. Predictors of cure of intrahepatic cholangiocarcinoma after hepatic resection. Anticancer Res (2017) 37:6971–5. doi: 10.21873/anticanres.12164
6. Miyata T, Yamashita YI, Yamao T, Umezaki N, Tsukamoto M, Kitano Y, et al. Clinical benefits of lymph node dissection in intrahepatic cholangiocarcinoma: a retrospective single-institution study. Anticancer Res (2017) 37:2673–7. doi: 10.21873/anticanres.11615
7. Luh F, Kuei A, Fann P, Chu P, Yen Y. Intrahepatic cholangiocarcinoma and hepatitis: case study and literature review. Anticancer Res (2009) 29:3239–43.
8. Li F, Jiang Y, Jiang L, Li Q, Yan X, Huang S, et al. Effect of lymph node resection on prognosis of resectable intrahepatic cholangiocarcinoma: a systematic review and meta-analysis. Front Oncol (2022) 12:957792. doi: 10.3389/fonc.2022.957792
9. Ke Q, Wang L, Lin Z, Lou J, Zheng S, Bi X, et al. Prognostic value of lymph node dissection for intrahepatic cholangiocarcinoma patients with clinically negative lymph node metastasis: a multi-center study from China. Front Oncol (2021) 11:585808. doi: 10.3389/fonc.2021.585808
10. Klempnauer J, Ridder GJ, Werner M, Weimann A, Pichlmayr R. What constitutes long-term survival after surgery for hilar cholangiocarcinoma? Cancer (1997) 79(1):26–34. doi: 10.1002/(SICI)1097-0142(19970101)79:1<26::AID-CNCR5>3.0.CO;2-K
11. Miyazaki M, Ito H, Nakagawa K, Ambiru S, Shimizu H, Shimizu Y, et al. Aggressive surgical approaches to hilar cholangiocarcinoma: hepatic or local resection? Surgery (1998) 123(2):131–6. doi: 10.1016/S0039-6060(98)70249-1
12. Guglielmi A, Ruzzenente A, Campagnaro T, Pachera S, Valdegamberi A, Nicoli P, et al. Intrahepatic cholangiocarcinoma: prognostic factors after surgical resection. World J Surg (2009) 33(6):1247–54. doi: 10.1007/s00268-009-9970-0
13. Xiang X, Hu D, Jin Z, Liu P, Lin H. Radiofrequency ablation vs. surgical resection for small early-stage primary intrahepatic cholangiocarcinoma. Front Oncol (2020) 10:540662. doi: 10.3389/fonc.2020.540662
14. Choi JY, Lee JM, Sirlin CB. CT and MR imaging diagnosis and staging of hepatocellular carcinoma: part II–extracellular agents, hepatobiliary agents, and ancillary imaging features. Radiology (2014) 273(1):30–50. doi: 10.1148/radiol.14132362
15. Joo I, Lee JM. Recent advances in the imaging diagnosis of hepatocellular carcinoma: value of gadoxetic acid-enhanced MRI. Liver Cancer (2016) 5(1):67–87. doi: 10.1159/000367750
16. Nanashima A, Sumida Y, Abo T, Oikawa M, Murakami G, Takeshita H, et al. Relationship between pattern of tumor enhancement and clinicopathologic characteristics in intrahepatic cholangiocarcinoma. J Surg Oncol (2008) 98:535–9. doi: 10.1002/jso.21142
17. Reichert CM, Weisenthal LM, Klein HG. Delayed hemorrhage after percutaneous liver biopsy. J Clin Gastroenterol (1983) 5:263–6. doi: 10.1097/00004836-198306000-00014
18. Silva MA, Hegab B, Hyde C, Guo B, Buckels JAC, Mirza DF. Needle track seeding following biopsy of liver lesions in the diagnosis of hepatocellular cancer: a systematic review and meta-analysis. Gut (2008) 57:1592–6. doi: 10.1136/gut.2008.149062
19. Heimbach J, Sanchez W, Rosen C, Gores G. Trans-peritoneal fine needle aspiration biopsy of hilar cholangiocarcinoma is associated with disease dissemination. HPB (2011) 13(5):356–60. doi: 10.1111/j.1477-2574.2011.00298.x
20. Weber S, Ribero D, O’Reilly E, Kokudo N, Miyazaki M, Pawlik TM. Intrahepatic cholangiocarcinoma: expert consensus statement. HPB (2015) 17(8):669–80. doi: 10.1111/hpb.12441
21. Wu JS, Feng JL, Zhu RD, Liu SG, Zhao DW, Li N. Histopathological characteristics of needle core biopsy and surgical specimens from patients with solitary hepatocellular carcinoma or intrahepatic cholangiocarcinoma. World J Gastrointest Oncol (2019) 11(5):404–15. doi: 10.4251/wjgo.v11.i5.404
22. Lubner M, Larison W, Watson R, Wells S, Ziemlewicz T, Lubner S, et al. Efficacy of percutaneous image-guided biopsy for diagnosis of intrahepatic cholangiocarcinoma. Abdom Radiol (2022) 47(8):2647–57. doi: 10.1007/s00261-021-03278-3
23. Liang Y, Xu F, Guo Y, Lai L, Jiang X, Wei X, et al. Diagnostic performance of LI-RADS for MRI and CT detection of HCC: a systematic review and diagnostic meta-analysis. Eur J Radiol (2021) 134:109404. doi: 10.1016/j.ejrad.2020.109404
24. Mitchell DG, Bruix J, Sherman M, Sirlin CB. LI-RADS (Liver imaging reporting and data system): summary, discussion, and consensus of the LI-RADS management working group and future directions. Hepatology (2015) 61(3):1056–65. doi: 10.1002/hep.27304
25. Joo I, Lee JM, Lee SM, Lee JS, Park JY, Han JK. Diagnostic accuracy of liver imaging reporting and data system (LI-RADS) v2014 for intrahepatic massforming cholangiocarcinomas in patients with chronic liver disease on gadoxetic acid-enhanced MRI. J Magn Reson Imag (2016) 44(5):1330–8. doi: 10.1002/jmri.25287
26. Liu X, Ni X, Li Y, Yang C, Wang Y, Ma C, et al. Diagnostic performance of LI-RADS version 2018 for primary liver cancer in patients with liver cirrhosis on enhanced MRI. Front Oncol (2022) 12:934045. doi: 10.3389/fonc.2022.934045
27. Wengert G, Baltzer P, Bickel H, Thurner P, Breitenseher J, Lazar M, et al. Differentiation of intrahepatic cholangiocellular carcinoma from hepatocellular carcinoma in the cirrhotic liver using contrast-enhanced MR imaging. Acad Radiol (2017) 24(12):1491–500. doi: 10.1016/j.acra.2017.06.005
28. Varenika V, Fu Y, Maher JJ, Gao D, Kakar S, Cabarrus MC, et al. Hepatic fibrosis: evaluation with semiquantitative contrast-enhanced CT. Radiology (2013) 266(1):151–8. doi: 10.1148/radiol.12112452
29. Nacif MS, Kawel N, Lee JJ, Chen X, Yao J, Zavodni A, et al. Interstitial myocardial fibrosis assessed as extracellular volume fraction with low-radiationdose cardiac CT. Radiology (2012) 264(3):876–83. doi: 10.1148/radiol.12112458
30. Banypersad SM, Sado DM, Flett AS, Gibbs SDJ, Pinney JH, Maestrini V, et al. Quantification of myocardial extracellular volume fraction in systemic AL amyloidosis: an equilibrium contrast cardiovascular magnetic resonance study. Circ Cardiovasc Imag (2013) 6(1):34–9. doi: 10.1161/CIRCIMAGING.112.978627
31. Flett AS, Hayward MP, Ashworth MT, Hansen MS, Taylor AM, Elliott PM, et al. Equilibrium contrast cardiovascular magnetic resonance for the measurement of diffuse myocardial fibrosis: preliminary validation in humans. Circulation (2010) 122(2):138–44. doi: 10.1161/CIRCULATIONAHA.109.930636
32. Choi BK, Katoch N, Park JA, Kim JW, Oh TI, Kim HJ, et al. Measurement of extracellular volume fraction using magnetic resonance-based conductivity tensor imaging. Front Physiol (2023) 14:1132911. doi: 10.3389/fphys.2023.1132911
33. Yang S, Du Y, Liu Z, Zhang R, Lin X, Ouyang Y, et al. Triglyceride–glucose index and extracellular volume fraction in patients with heart failure. Front Cardiovasc Med (2021) 8:704462. doi: 10.3389/fcvm.2021.704462
34. Sofue K, Ueshima E, Masuda A, Shirakawa S, Zen Y, Ueno Y, et al. Estimation of pancreatic fibrosis and prediction of postoperative pancreatic fistula using extracellular volume fraction in multiphasic contrast-enhanced CT. Eur Radiol (2022) 32(3):1770–80. doi: 10.1007/s00330-021-08255-4
35. Noid G, Godfrey G, Hall W, Shah J, Paulson E, Knechtges P, et al. Predicting treatment response from extracellular volume fraction for chemoradiation therapy of pancreatic cancer. Int J Radiat Oncol Biol Phys (2023) 115(3):803–8. doi: 10.1016/j.ijrobp.2022.09.084
36. Fukui H, Onishi H, Nakamoto A, Tsuboyama T, Ota T, Yano K, et al. Pancreatic fibrosis by extracellular volume fraction using contrast-enhanced computed tomography and relationship with pancreatic cancer. Eur J Radiol (2022) 156:110522. doi: 10.1016/j.ejrad.2022.110522
37. Zhou Y, Geng D, Su G-Y, Chen X-B, Si Y, Shen M-P, et al. Extracellular volume fraction derived from dual-layer spectral detector computed tomography for diagnosing cervical lymph nodes metastasis in patients with papillary thyroid cancer: a preliminary study. Front Oncol (2022) 12:851244. doi: 10.3389/fonc.2022.851244
38. Bandula S, Punwani S, Rosenberg W, Jalan R, Hall A, Dhillon A, et al. Equilibrium contrast-enhanced CT imaging to evaluate hepatic fibrosis: initial validation by comparison with histopathologic sampling. Radiology (2015) 275(1):136–43. doi: 10.1148/radiol.14141435
39. Guo S, Su L, Zhai Y, Chirume W, Lei J, Zhang H, et al. The clinical value of hepatic extracellular volume fraction using routine multiphasic contrast-enhanced liver CT for staging liver fibrosis. Clin Radiol (2017) 72(3):242–6. doi: 10.1016/j.crad.2016.10.003
40. Yoon J, Lee J, Klotz E, Jeon J, Lee K-B, Han J, et al. Estimation of hepatic extracellular volume fraction using multiphasic liver computed tomography for hepatic fibrosis grading. Invest Radiol (2015) 50(4):290–6. doi: 10.1097/RLI.0000000000000123
41. Sofue K, Tsurusaki M, Mileto A, Hyodo T, Sasaki K, Nishii T, et al. Dual-energy computed tomography for non-invasive staging of liver fibrosis: accuracy of iodine density measurements from contrast-enhanced data. Hepatol Res (2018) 48(12):1008–19. doi: 10.1111/hepr.13205
42. Lacomis J, Baron R, Oliver JH, Nalesnik MA, Federle MP. Cholangiocarcinoma: delayed CT contrast enhancement patterns. Radiology (1997) 203:98–104. doi: 10.1148/radiology.203.1.9122423
43. Asayama Y, Yoshimitsu K, Irie H, Tajima T, Nishie A, Hirakawa M, et al. Delayed-phase dynamic CT enhancement as a prognostic factor for mass-forming intrahepatic cholangiocarcinoma. Radiology (2006) 238:150–5. doi: 10.1148/radiol.2381041765
44. Iacobuzio-Donahue C, Montgomery E. Gastrointestinal and liver pathology: a volume in the foundations in diagnostic pathology series. 1st edn. Churchill Livingstone (2005).
45. Zhao Y, Chen W, Wu D, Zhang W-Y, Zheng L-R. Differentiation of mass-forming intrahepatic cholangiocarcinoma from poorly differentiated hepatocellular carcinoma: based on the multivariate analysis of contrast-enhanced computed tomography findings. Abdom Radiol (2016) 41:978–89. doi: 10.1007/s00261-015-0629-z
46. Lee J, Lee J, Kim S, Baek J, Yun S, Kim K, et al. Enhancement patterns of hepatocellular carcinomas on multiphasicmultidetector row CT: comparison with pathological differentiation. Br J Radiol (2012) 85:573–83. doi: 10.1259/bjr/86767895
47. Cohen J. A coefficient of agreement for nominal scales. Educ psychol Measurement (1960) 20(1):37–46. doi: 10.1177/001316446002000104
48. Cicchetti DV. Guidelines, criteria, and rules of thumb for evaluating normed and standardized assessment instruments in psychology. psychol Assessment (1994) 6(4):284–90. doi: 10.1037/1040-3590.6.4.284
49. Zhang S, Huo L, Feng Y, Zhang J, Wu Y, Liu Y, et al. Preoperative differentiation of hepatocellular carcinoma with peripheral rim-like enhancement from intrahepatic mass-forming cholangiocarcinoma on contrast-enhanced MRI. Front Oncol (2022) 12:986713. doi: 10.3389/fonc.2022.986713
50. Baron RL. Understanding and optimizing use of contrast material for CT of the liver. Am J Roentgenol (1994) 163:323–31. doi: 10.2214/ajr.163.2.8037023
51. Hwang J, Min J, Kang T, Jeong W, Kim Y, Ko S, et al. Assessment of factors affecting washout appearance of hepatocellular carcinoma on CT. Eur Radiol (2021) 31(10):7760–70. doi: 10.1007/s00330-021-07897-8
52. Lamba R, McGahan JP, Corwin MT, Li C-S, Tran T, Seibert JA, et al. CT hounsfield numbers of soft tissues on unenhanced abdominal CT scans: variability between two different manufacturers’ MDCT scanners. Am J Roentgenol (2014) 203:1013–20. doi: 10.2214/AJR.12.10037
Keywords: extracellular space, carcinoma, hepatocellular, cholangiocarcinoma, multidetector computed tomography, contrast media
Citation: Honda T, Onishi H, Fukui H, Yano K, Kiso K, Nakamoto A, Tsuboyama T, Ota T, Tatsumi M, Tahara S, Kobayashi S, Eguchi H and Tomiyama N (2023) Extracellular volume fraction using contrast-enhanced CT is useful in differentiating intrahepatic cholangiocellular carcinoma from hepatocellular carcinoma. Front. Oncol. 13:1214977. doi: 10.3389/fonc.2023.1214977
Received: 01 May 2023; Accepted: 19 June 2023;
Published: 06 July 2023.
Edited by:
Christian Cotsoglou, Ospedale di Vimercate - ASST Brianza, ItalyReviewed by:
Yandong Wang, Tianjin Third Central Hospital, ChinaNittaya Chamadol, Khon Kaen University, Thailand
Copyright © 2023 Honda, Onishi, Fukui, Yano, Kiso, Nakamoto, Tsuboyama, Ota, Tatsumi, Tahara, Kobayashi, Eguchi and Tomiyama. This is an open-access article distributed under the terms of the Creative Commons Attribution License (CC BY). The use, distribution or reproduction in other forums is permitted, provided the original author(s) and the copyright owner(s) are credited and that the original publication in this journal is cited, in accordance with accepted academic practice. No use, distribution or reproduction is permitted which does not comply with these terms.
*Correspondence: H. Onishi, aC1vbmlzaGlAcmFkaW9sLm1lZC5vc2FrYS11LmFjLmpw
 T. Honda
 H. Onishi1*
 K. Kiso
 M. Tatsumi