 Yue Wang
 Longfei Dai
 Ran Huang4
- 1Anhui No.2 Provinicial People's Hospital Clinical College of Anhui Medical University, Hefei, China
- 2Department of General Surgery, Anhui No.2 Provinicial People's Hospital, Hefei, China
- 3The Fifth Clinical Medical College of Anhui Medical University, Hefei, China
- 4Department of Pediatric Surgery, The First Affiliated Hospital of Anhui Medical University, Hefei, China
- 5Department of General Surgery, The First Affiliated Hospital of Anhui Medical University, Hefei, China
Background: Cellular senescence occurs throughout life and can play beneficial roles in a variety of physiological processes, including embryonic development, tissue repair, and tumor suppression. However, the relationship between cellular senescence-related genes (CSRGs) and immunotherapy in esophageal carcinoma (ECa) remains poorly defined.
Methods: The data set used in the analysis was retrieved from TCGA (Research Resource Identifier (RRID): SCR_003193), GEO (RRID: SCR_005012), and CellAge databases. Data processing, statistical analysis, and diagram formation were conducted in R software (RRID: SCR_001905) and GraphPad Prism (RRID: SCR_002798). Based on CSRGs, we used the TCGA database to construct a prognostic signature for ECa and then validated it in the GEO database. The predictive efficiency of the signature was evaluated using receiver operating characteristic (ROC) curves, Cox regression analysis, nomogram, and calibration curves. According to the median risk score derived from CSRGs, patients with ECa were divided into high- and low-risk groups. Immune infiltration and immunotherapy were also analyzed between the two risk groups. Finally, the hub genes of the differences between the two risk groups were identified by the STRING (RRID: SCR_005223) database and Cytoscape (RRID: SCR_003032) software.
Results: A six-gene risk signature (DEK, RUNX1, SMARCA4, SREBF1, TERT, and TOP1) was constructed in the TCGA database. Patients in the high-risk group had a worse overall survival (OS) was disclosed by survival analysis. As expected, the signature presented equally prognostic significance in the GSE53624 cohort. Next, the Area Under ROC Curve (AUC=0.854) and multivariate Cox regression analysis (HR=3.381, 2.073-5.514, P<0.001) also proved that the risk signature has a high predictive ability. Furthermore, we can more accurately predict the prognosis of patients with ECa by nomogram constructed by risk score. The result of the TIDE algorithm showed that ECa patients in the high-risk group had a greater possibility of immune escape. At last, a total of ten hub genes (APOA1, MUC5AC, GC, APOA4, AMBP, FABP1, APOA2, SOX2, MUC8, MUC17) between two risk groups with the highest interaction degrees were identified. By further analysis, four hub genes (APOA4, AMBP, FABP1, and APOA2) were related to the survival differences of ECa.
Conclusions: Our study reveals comprehensive clues that a novel signature based on CSRGs may provide reliable prognosis prediction and insight into new therapy for patients with ECa.
Introduction
Esophageal carcinoma (ECa) is a highly aggressive malignancy and a healthcare problem with global impact. It ranks tenth in the incidence of malignancies worldwide and sixth in deaths from cancer (1). In 2020, 604,100 people (3.1% of new cancer cases) worldwide were diagnosed with ECa and 544,076 people (5.5% of new death cases) died from this disease (1). The course of treatment for ECa has changed significantly over the past decades. Early ECa is generally treated by endoscopy, and locally advanced ECa is routinely treated with neoadjuvant chemoradiotherapy before surgical treatment (2). However, for cervical ECa, chemotherapy and radiotherapy are the preferred treatment options (2). Despite the diversity of treatment options for ECa, the survival rates for ECa remains poor, mainly due to the late stage of the disease when first diagnosed and the high recurrence rate even in cases of localized disease. Consequently, it is vital for us to explore the appropriate therapeutic targets and novel prognostic biomarkers for ECa patients to enhance the clinical outcome.
Cellular senescence is characterized by a state of persistent cell cycle arrest in which cells remain merely metabolically active (3, 4). It is not only related to the aging process of organisms but also plays an important role in the whole life process from embryonic development to the end of life (5–7). One of the key features of senescent cells is the senescence-associated secretory phenotype (SASP), comprising three main features such as loss of proliferative or regenerative capacity, resistance to apoptosis, and accumulation of pathological metabolic wastes (8, 9). In recent years, more and more scholars have shown great interest in the intricate relationship between cellular senescence and cancers (10, 11). Previous studies have shown that cellular senescence acts as a double-edged sword at different stages of malignancy development (7, 12, 13). Consequently, abolishing accumulated deleterious cellular senescence and inducing acute cellular senescence are now being investigated as targets for treating disease. Recent research indicates that tumor cells might experience senescence as an evolutionary process, which involves both tumor intrinsic traits and external immunological load (14, 15). Notably, the negative consequences of SASP outweigh its positive features (16). Therefore, we hypothesized that with the accumulation of senescent cells, SASP remodels the tumor microenvironment by recruiting immunosuppressive cells, thereby promoting tumor cell evasion of immune surveillance, leading to poor clinical prognosis in tumors. To facilitate studies focused on cell senescence, the researchers developed CellAge, a database of genes associated with cell senescence. Developer manually-curated data is based on gene manipulation experiments in different human cell types. A gene expression signature of cellular senescence is also available. By integrating these and other datasets developers performed a systems biology analysis of cell senescence. At present, there are few studies on CSRGs in ECa, but a number of studies have shown that CSRGs signature can play a prognostic role in hepatocellular carcinoma, gastric cancer, bladder cancer, renal cell carcinoma, and colon cancer (17–21). However, the expression characteristics and prognostic significance of CSRGs in ECa remain unclear. Therefore, the study of cellular senescence in ECa is crucial.
In our study, a risk signature based on six CSRGs was constructed and validated in The Cancer Genome Atlas (TCGA) cohort and Gene Expression Omnibus (GEO) cohort, respectively. The actual prognostic value of risk signature in patients with ECa has also been fully explored. Based on the risk groupings, we next focused on the differences in clinical features, immune infiltration, and immunotherapy response between the two risk groups. Finally, we hope that our study can broaden the mind for prognostic prediction and individualizing immunotherapy of ECa.
Materials and methods
Data collection
The gene expression profiles and clinical data of patients with ECa were extracted from the TCGA public database (https://portal.gdc.cancer.gov) and used as the training cohort. A total of 194 patients (12 normal esophageal tissue samples and 182 ECa samples) were included in the TCGA database. Independent probe matrix file (GSE53624) and platform file (GPL18109) containing 179 samples were derived from the GEO database (https://www.ncbi.nlm.nih.gov/geo/) and served as validation sets. According to the probe sequence of the platform file, the gene names were obtained by chip re-annotation technology, to obtain the corresponding relationship between the probe matrix and the gene names. Finally, we selected a list of 279 CSRGs (Supplementary Table S1) from the CellAge database (https://genomics.senescence.info/cells/). The flow diagram of this study is depicted in Figure 1.
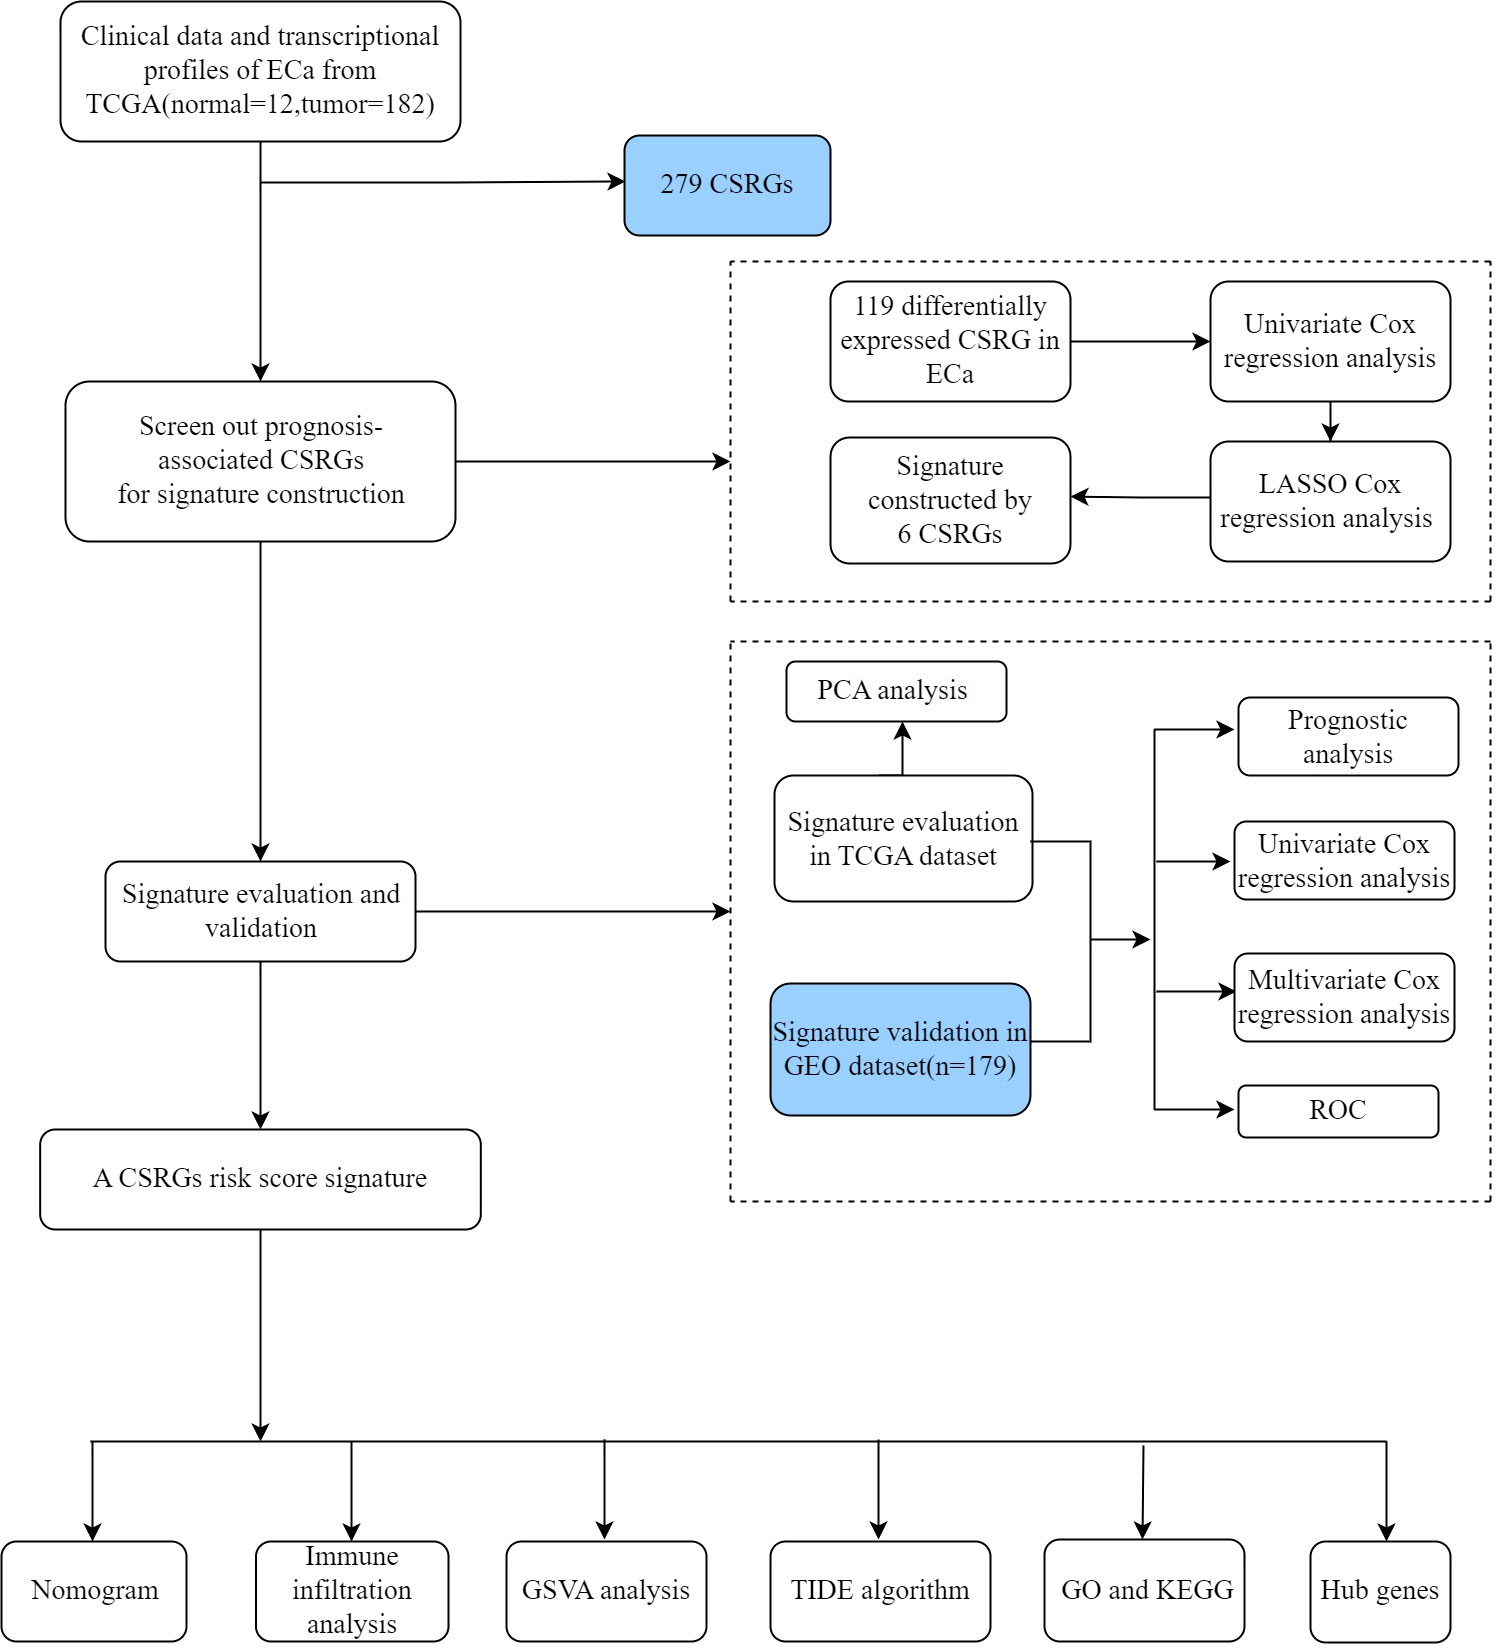
Figure 1 The detailed flow diagram in our study.
Identification of differentially expressed CSRGs in ECa
The expression differences of CSRGs between 12 normal esophageal tissues and 182 ECa tissues were analyzed by the “limma” R package. The data were analyzed strictly according to the screening criteria of false discovery rate (FDR)<0.05 and |log2 (fold change, FC)|>0.585. Next, differentially expressed CSRGs were visualized by plotting heat map and volcano map with the “pheatmap” package of the R software system.
Development and verification of a prognostic-related CSRGs signature
We first combined the expression data in TCGA-ECa with the survival data and then analyzed and obtained the expression levels of differentially expressed CSRGs in ECa samples. Then, the CSRGs related to the prognosis of ECa were obtained by univariate Cox regression analysis, and the screening criteria was P<0.05. Finally, the Least Absolute Shrinkage and Selection Operator (lasso) regression analysis with the “glmnet” package in R was executed to pick up the preliminary hub CSRGs. The calculation formula of CSRGs-related risk scores was as follows: risk scores =Σi(Lasso_Coefi*GeneExpi). “Lasso_Coef”, Lasso regression coefficient; “GeneExp”, amount of gene expression. According to the median risk score derived from CSRGs, patients with ECa were divided into high- and low-risk groups.
The effectiveness of the risk signature was demonstrated by principal component analysis (PCA), Kaplan–Meier survival curves, and receiver operating characteristic (ROC) curves. In order to verify the independence of the risk signature in prediction, univariate and multivariate Cox analyses on clinical variables and risk scores were generated using the “survival” package of R. The selected clinical variables are mainly indicators that have important prognostic significance for patients with ECa, such as age, gender, clinicopathological grade, and TNM stage. The “ggpubr” package of R was used to investigate whether there were differences in clinical variables and immune subtypes among different risk groups.
RNA isolation and quantitative real-time PCR
Total RNA was extracted from 12 paired human ECa tissues and adjacent non-tumorous esophageal tissues using TRIzol Reagent (Abcam, China). The reverse transcription was conducted with TransScrip All-in-One SuperMix for qPCR reagent Kit (TaKaRa, Japan). Real-time fluorescent PCR was performed by SYBR Green assay. The experiment adopted a 20μL reaction system, Tip Green qPCR SuperMix (TaKaRa, Japan), cDNA template, upstream and downstream primers were successively added into 8 reaction tubes, and 3 repeated experiments were performed for each sample. We used glyceraldehyde-3-phosphate dehydrogenase (GAPDH) as the internal reference, and the data were analyzed using the 2–ΔΔCt approach. The sequences of primers were listed in Supplementary Table S2.
Construction of a nomogram
In order to predict the survival rate of patients with ECa at 1, 2, and 3 years, clinicopathological factors and risk score integrated nomogram was generated using the”regplot” and “rms” packages in R. Subsequently, by generating a calibration curve, we evaluated the preliminary consistency between the survival rate of ECa predicted by the nomogram and the actual survival rate. The ROC curve was utilized to explore the accuracy of the nomogram and clinical features in predicting the survival rate of patients with ECa. At last, univariate and multivariate Cox analyses were utilized to explore the potential of the nomogram to independently predict prognosis in ECa.
Investigation of the immunotherapy response
R software combined with the CIBERSORT algorithm was used to explore the differences of 22 kinds of human immune cell subpopulations between the two risk groups in TCGA-ECa. Immediately after, we explored the differences in pathway enrichment between the two risk groups by gene set variation analysis (GSVA). The TIDE (Tumor Immune Dysfunction and Exclusion) algorithm was used to evaluate the weight of immunological rejection in two risk groups via an online website (http://tide.dfci.harvard.edu/).
Functional and pathway enrichment analysis
Firstly, the “limma” package of R software was used to screen the differentially expressed genes (DEGs) between different groups, and the screening criteria were FDR<0.05 and |log2FC|>1. Subsequently, we performed GO and KEGG analysis on the two risk groups to explore the differences in their potential biological functions and pathways.
Gene set enrichment analysis
Using the curated gene set (kegg.v7.4.symbols.gmt), broad GSEA v.4.2.3 was applied to detect high- and low-risk group correlation pathways with the criteria: NOM P<0.05 and |NES|>1 (22).
Construction of the PPI network
The STRING online database (https://string-db.org/) was first applied to obtain the PPI (protein-protein interaction) information (interaction score >0.70) of the DEGs between different groups. Next, we visualized the PPI network using the Cytoscape software (version 3.9.1). In addition, the plugin of cytoHubba in Cytoscape was utilized to screen the hub genes with the most complex connections in the PPI network. Finally, the clinical significance of hub genes in ECa was further explored.
Statistical analysis
Data processing, statistical analysis, and diagram formation were all conducted in R software (version R-4.2.2), GraphPad Prism (version 9.0), and Cytoscape software (version 3.9.1). The Kaplan–Meier curve plotted by the “survminer” package of R was used to compare differential survival probability. Univariate and multivariate Cox regression analyses of independent prognostic factors were performed using the “forestplot” package of R. ROC curve plotted by the “timeROC” package of R was used to assess the predictive efficacy of the CSRGs prognostic signature and nomogram. Results with two-sided P<0.05 were deemed statistically significant.
Results
Identification of differential CSRGs in ECa
In TCGA data, among 279 CSRGs, 119 were differentially expressed between ECa samples and normal esophageal samples (FDR <0.05, |log2FC| > 0.585), including 15 downregulated genes and 104 upregulated genes in the ECa tissue samples. These above differences are displayed in the heat map and volcano map (Figures 2A, B).
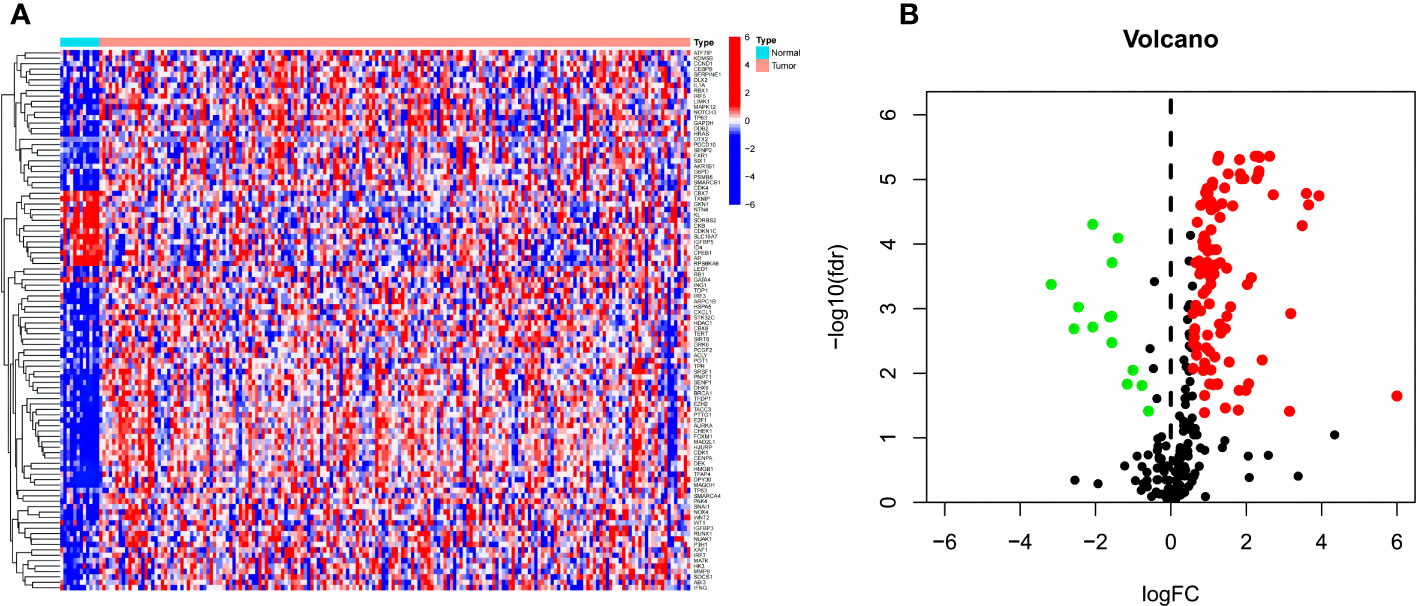
Figure 2 (A, B) Heat map and volcano map of differential CSRGs in ECa and normal esophageal tissues. Green, downregulated; red, upregulated.
Construction of a prognostic signature and signature gene analysis
Based on univariate Cox regression analysis of the TCGA-ECa cohort, 7 CSRGs that significantly affect the prognosis of ECa were disclosed, such as TERT (Figure 3A). Subsequently, in order to develop a CSRGs signature for survival prediction of ECa, the 6 OS (overall survival)-associated CSRGs were analyzed using the LASSO analysis. Finally, a total of 6 genes (DEK, RUNX1, SMARCA4, SREBF1, TERT, TOP1) were built (Figures 3B, C). The risk scores for all patients were calculated as follows: risk score = (0.486102936551265×DEK level) + (-0.466577382724787×RUNX1 level) + (-0.379803436002195×SMARCA4 level) + (-0.216260668499574×SREBF1 level) + (0.326358456240447×TERT level) + (0.126266167208409×TOP1 level) (Supplementary Table S3). The results of our further analysis of the expression levels of signature genes in ECa and normal esophageal tissues are as follows. Compared with the normal esophageal tissues group, DEK, RUNX1, SMARCA4, SREBF1, TERT, and TOP1 all showed elevated expression abundance in the ECa tissues group (Figures 3D-I).
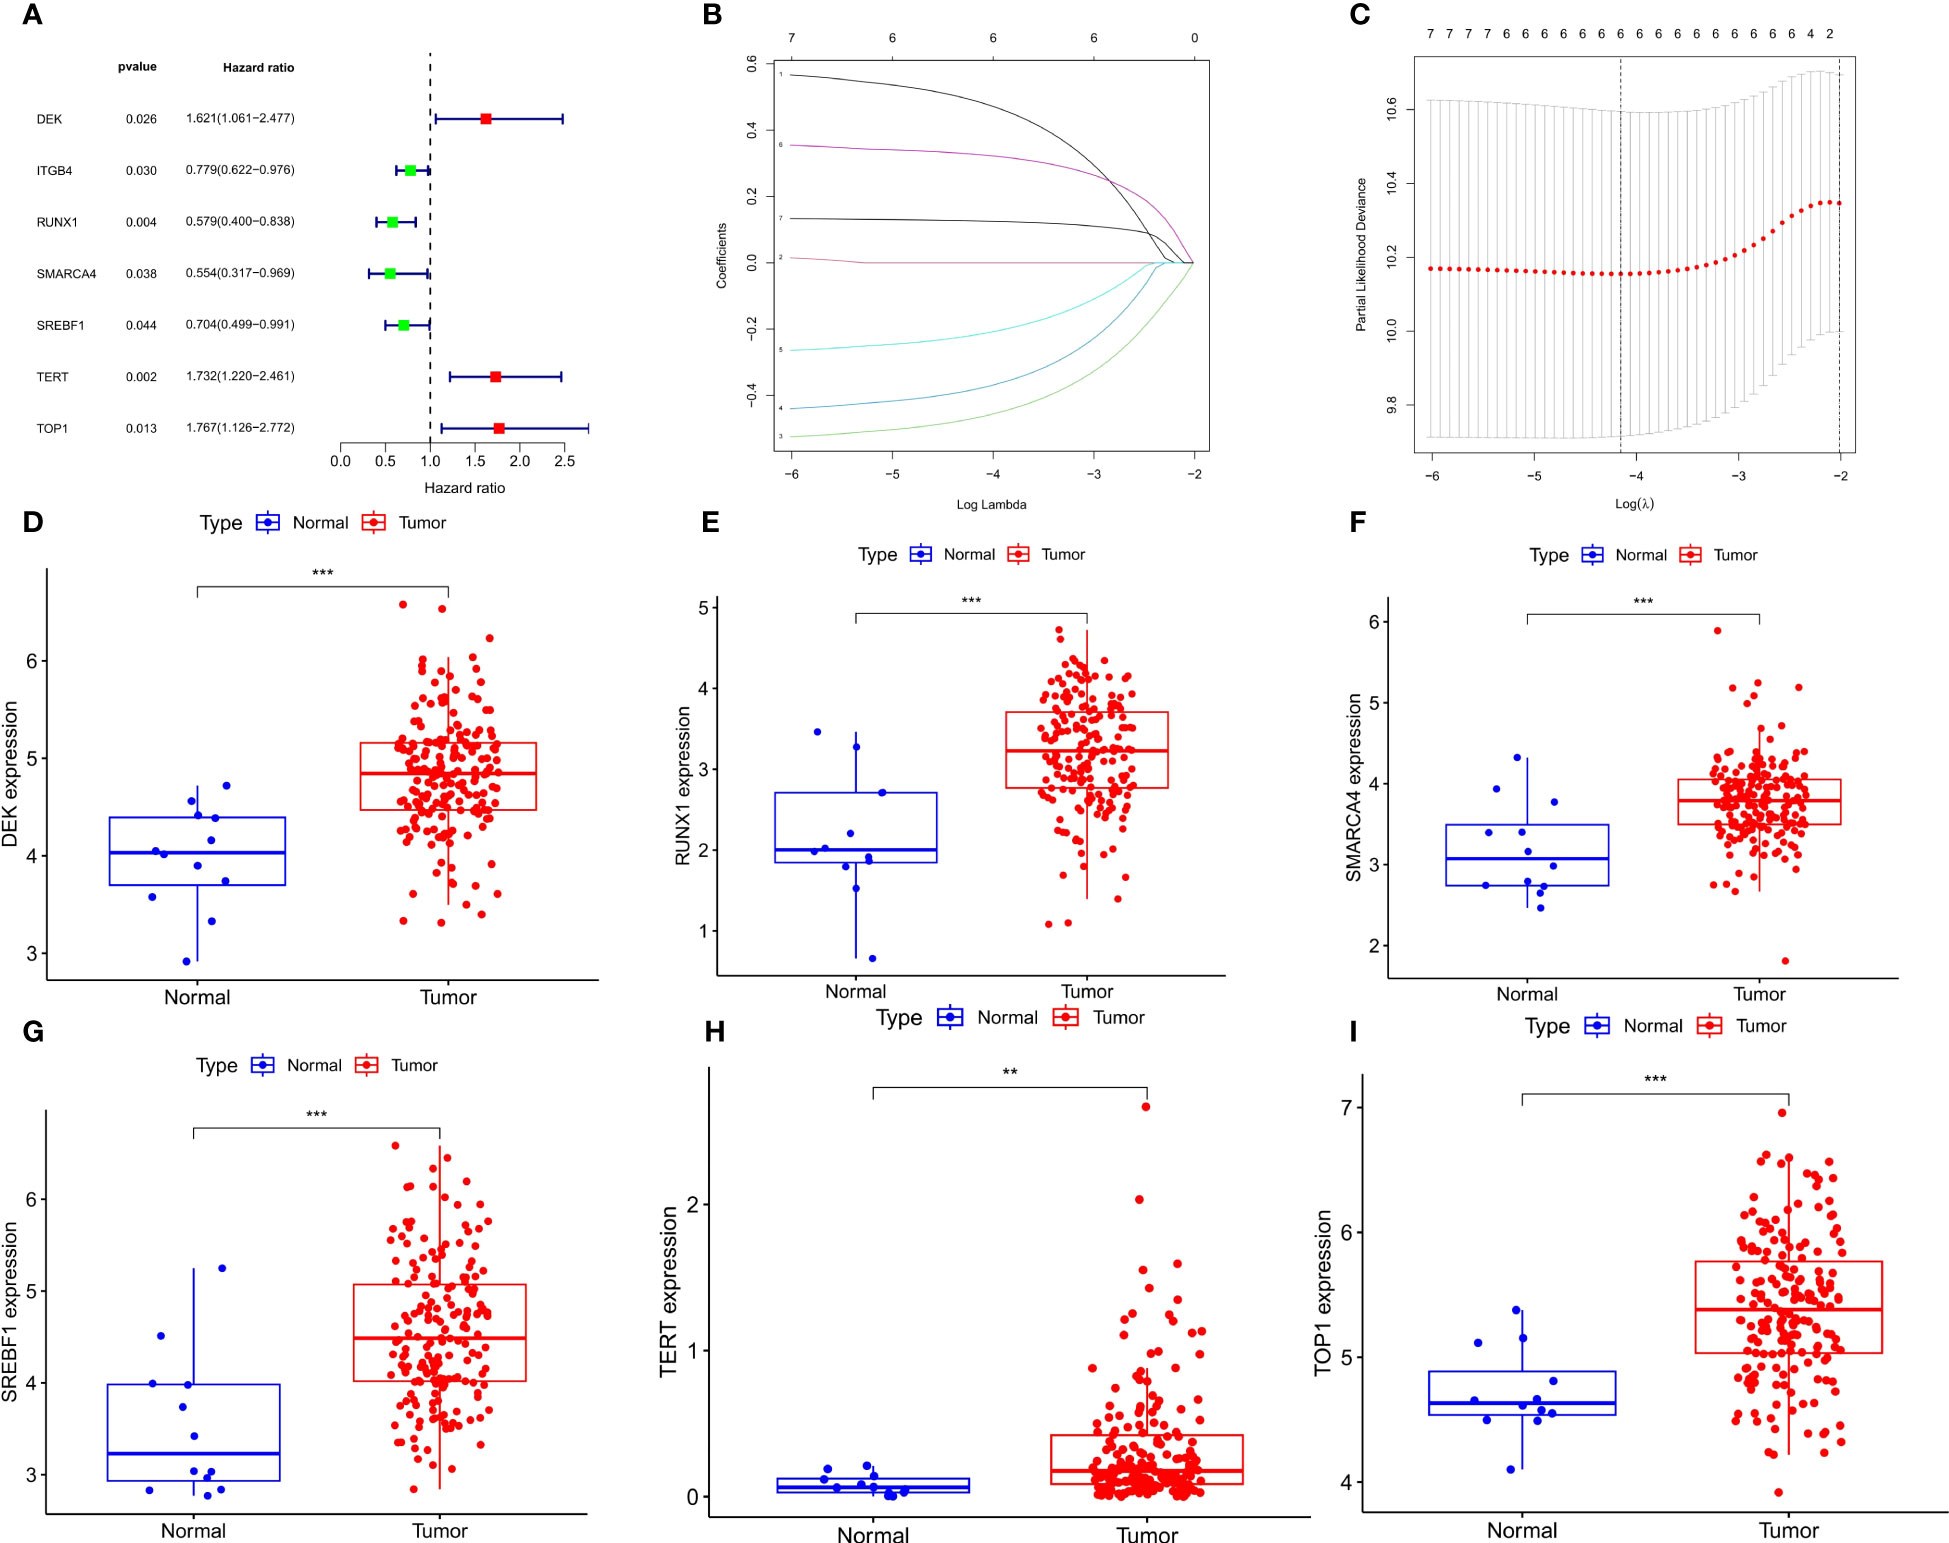
Figure 3 Develop a prognostic signature and signature gene analysis. (A) Forest plot. The 7 CSRGs associated with ECa prognosis. (B) LASSO coefficient profiles of 7 CSRGs. (C) The numbers on the graph represent the number of genes associated with the prognosis of ECa; Cross-validation for tuning parameter selection to filter the key genes. (D-I) Expressed divergence of signature genes between ECa tissues and normal esophageal tissues. **P < 0.01, *** P < 0.001.
Validating the expression levels of signature genes in ECa patients
Real-time fluorescence quantitative PCR (RT-qPCR) was performed to verify the mRNA level of the six signature genes in 12 paired ECa tissues and adjacent normal esophageal tissues. The results indicated that the expression of DEK, RUNX1, SMARCA4, SREBF1, TERT, and TOP1 were all up-regulated in ECa tissues than that in adjacent normal tissues (Figures 4A-F). These results were consistent with the expression tendencies of the previous signature genes in esophageal cancer and normal esophageal tissues.
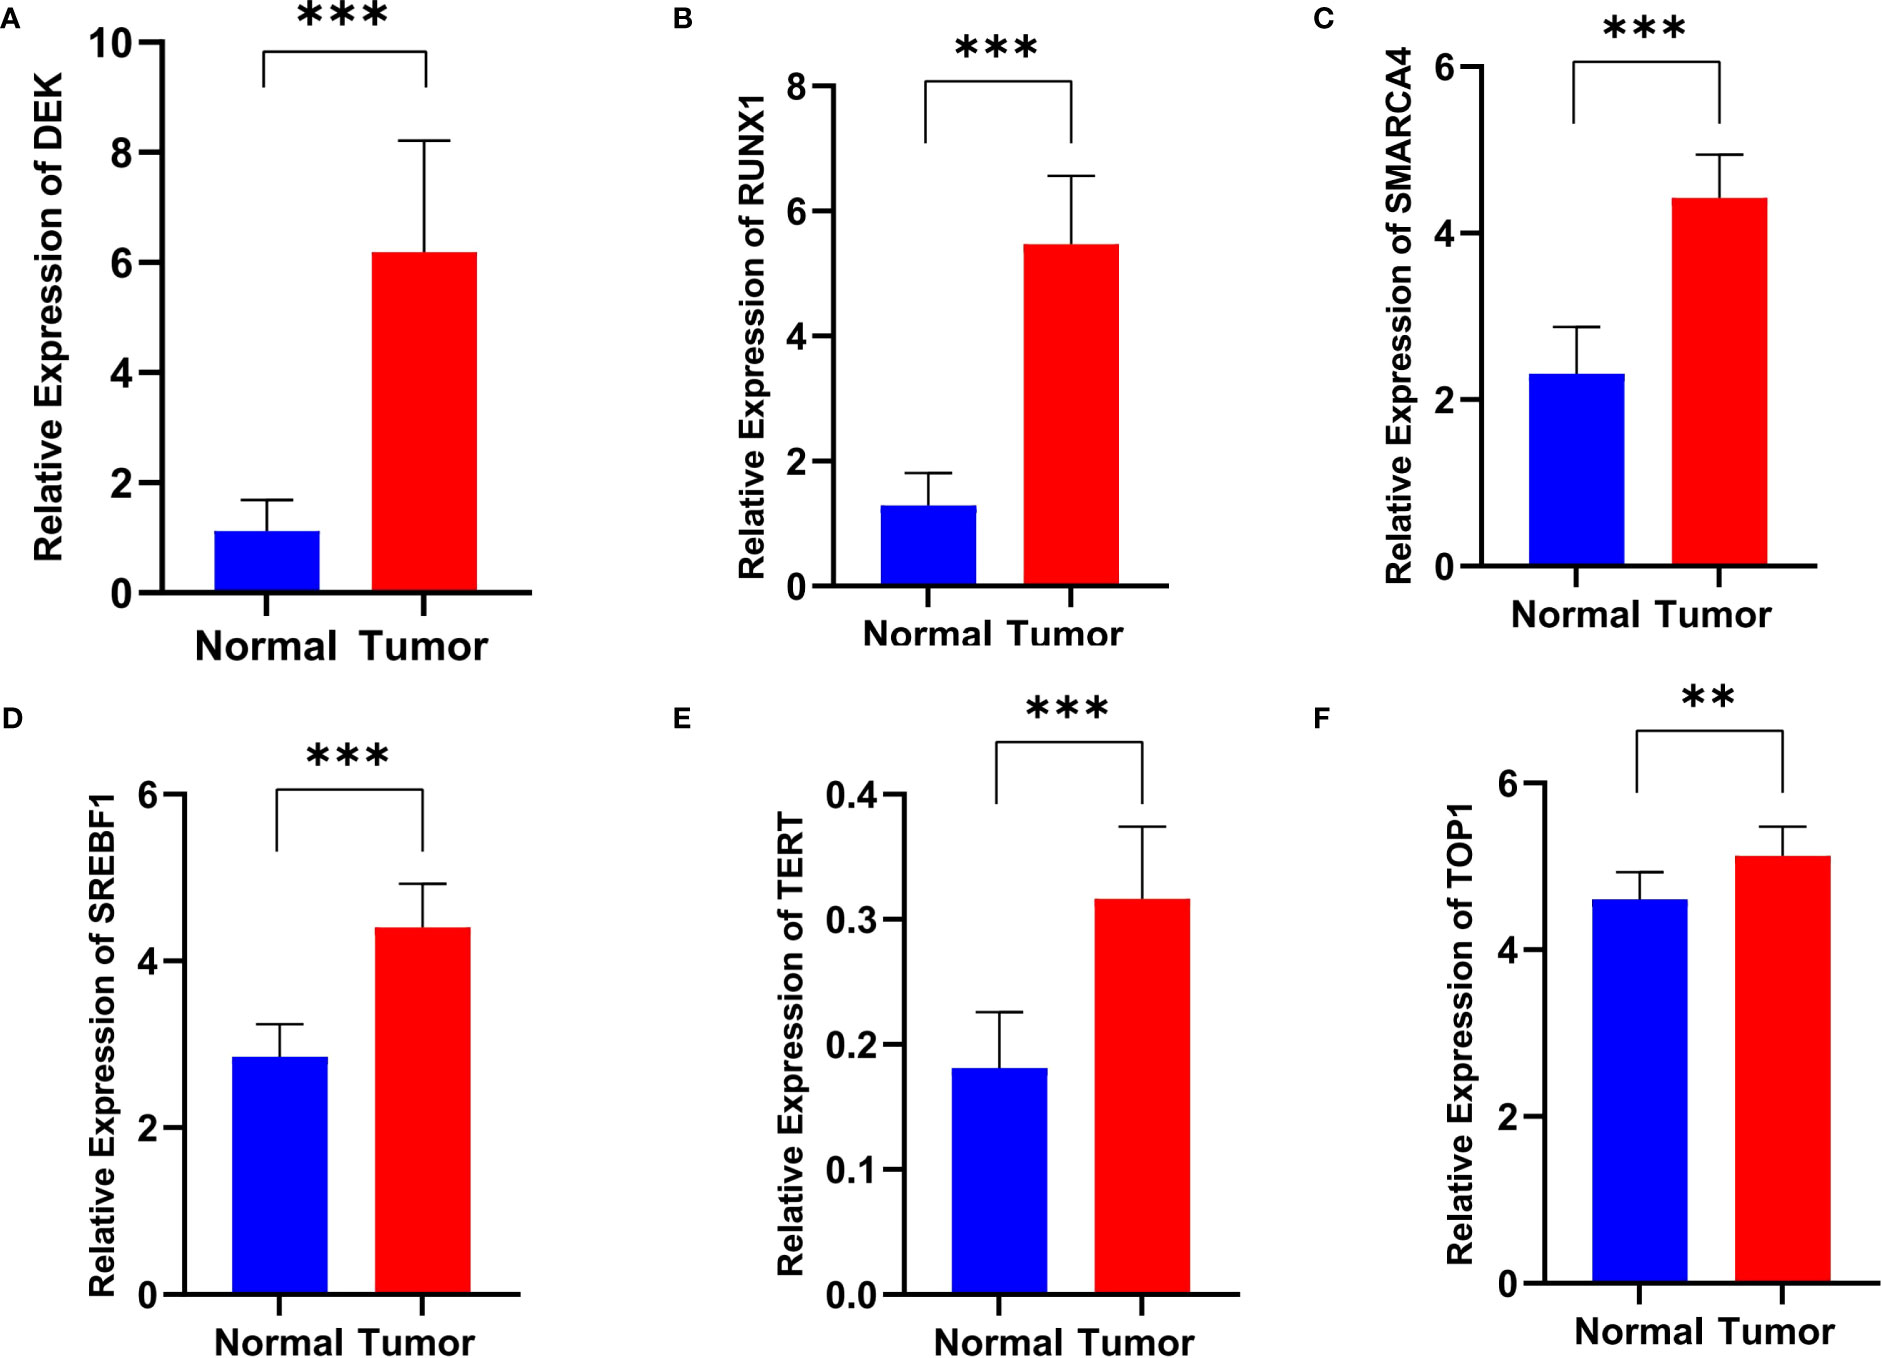
Figure 4 The relative RNA level of DEK (A), RUNX1 (B), SMARCA4 (C), SREBF1 (D), TERT (E), and TOP1 (F) in ECa tissues and adjacent normal esophageal tissues. Data are presented as Mean with SD, **P < 0.01, *** P < 0.001.
Validation of a CSRGs prognostic signature
It was found by PCA that our constructed CSRGs signature can accurately divide ECa samples into high- and low-risk groups (Figures 5A, B). Similar to the results obtained from the training cohort, patients in the high-risk group of the testing cohort were more likely to encounter a worse prognosis (Figure 5C). The results of univariate Cox regression analysis combined with multivariate Cox regression analysis in the TCGA-ECa cohort and GEO-ECa cohort suggested that the risk score based on CSRGs remained an independent risk factor affecting the prognosis of ECa (Figures 5D, E). In predicting survival, the risk score had a larger area under the ROC curve than other clinical features in the TCGA-ECa cohort and GEO-ECa cohort, suggesting that the risk score could serve as a more accurate prognostic factor (Figure 5F). Afterward, ROC analysis was employed to assess the risk signature in OS, with AUC values of 0.779, 0.720, and 0.761 at the 1-, 2-, and 3-year in TCGA-ECa cohort and 0.705, 0.721, and 0.745 at the 1-, 2-, and 3-year in the GEO-ECa cohort, respectively (Figure 5G).
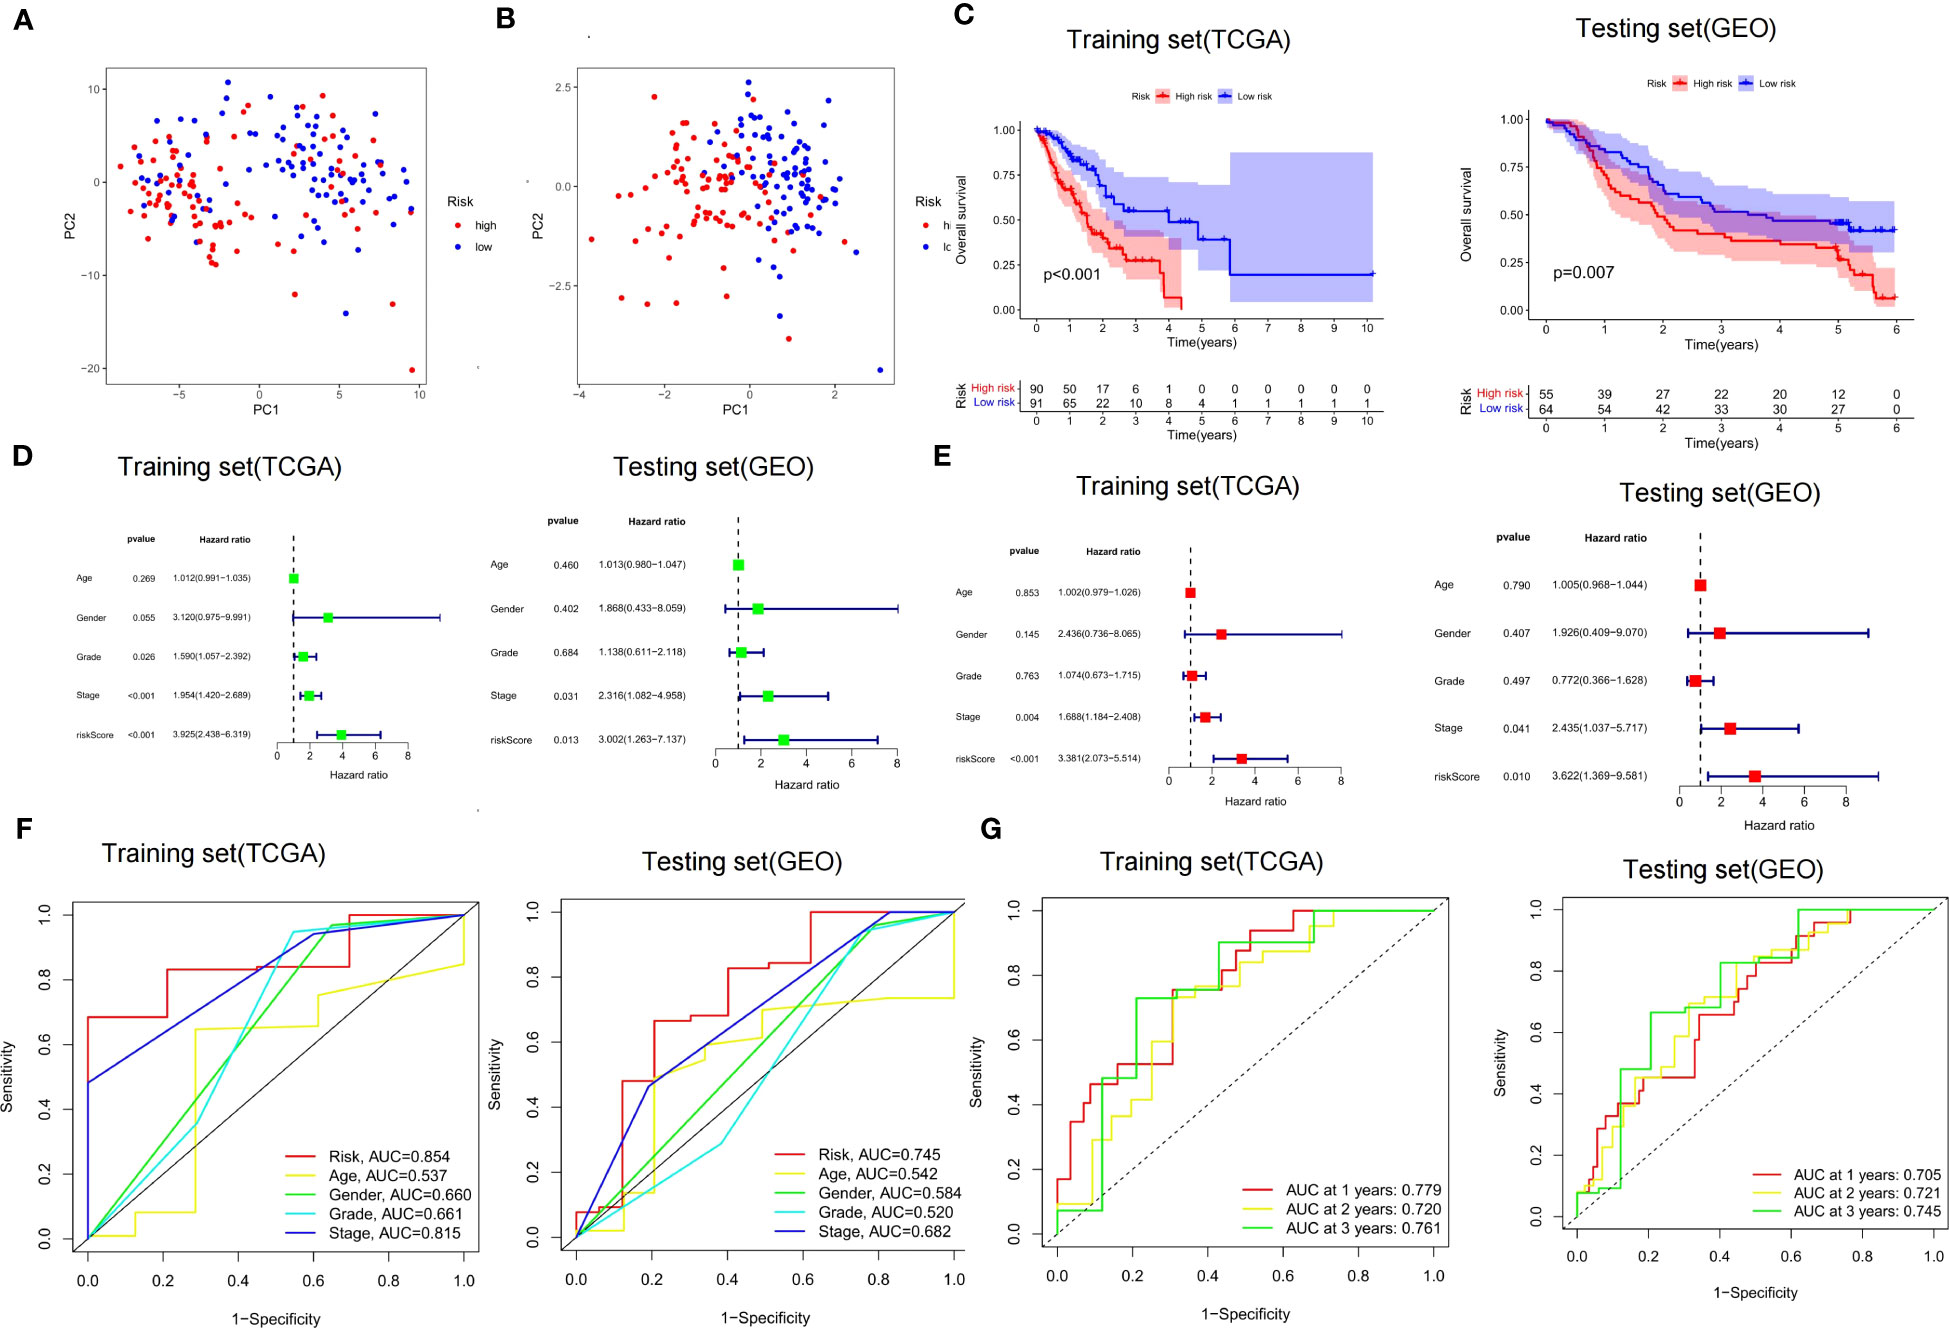
Figure 5 Validation of risk score signature and implications for prognosis. (A, B) PCA chart. High- and low-risk groups were differentiated by CSRGs and signature genes, respectively. (C) K-M curves for the OS of the prognostic signature in the TCGA-ECa cohort and GEO-ECa cohort, respectively. (D, E) Univariate and multivariate Cox regression analyses of prognostic factors in TCGA-ECa cohort and GEO-ECa cohort, respectively. (F) The AUC values of the risk signature were the highest in the TCGA-ECa cohort and GEO-ECa cohort. (G) ROC analysis was employed to evaluate the capacity of the risk signature in OS in the TCGA-ECa cohort and GEO-ECa cohort.
Clinicopathological characteristics and prognostic value in different risk groups
Based on the results of risk grouping, we are interested in whether there are differences in clinical features among different risk groups and conducting further analysis. We found a significantly increased risk in patients older than 65 years and in patients with grade G3 (Figures 6A, B). However, other clinical features did not show statistical significance between the different risk score groups (Supplementary Figure S1). Thorsson et al. performed an extensive immunogenomic analysis of over 10,000 tumors comprising 33 diverse cancer types utilizing data compiled by TCGA (23). Across cancer types, they identified six immune subtypes by RNA sequencing: C1-Wound Healing, C2-IFN-γ Dominant, C3-Inflammatory, C4-Lymphocyte Depleted, C5-Immunologically Quiet, and C6-TGF-β Dominant (23). Next, we also found that the risk score between the different immune subtypes was also not statistically different (Figure 6C). Finally, we investigated the prognostic value of CSRGs risk score signature in different subgroups of patients with ECa (Figures 6D–H). CSRGs risk score can accurately determine prognosis in ECa patients with either aged less than 65 years (P<0.001) or M0 stage (P<0.001), as well as in patients with ECa in T1&T2 stages (P=0.007) or T3&T4 stages (P=0.003) or N0 stage (P=0.015) or N1&N2&N3 stages (P=0.006) or pathological stage I & II (P=0.003) or pathological stage III & IV (P=0.004). However, CSRGs risk score signature was not a good predictor of prognostic outcome for ECa patients aged more than 65 years (P=0.170).
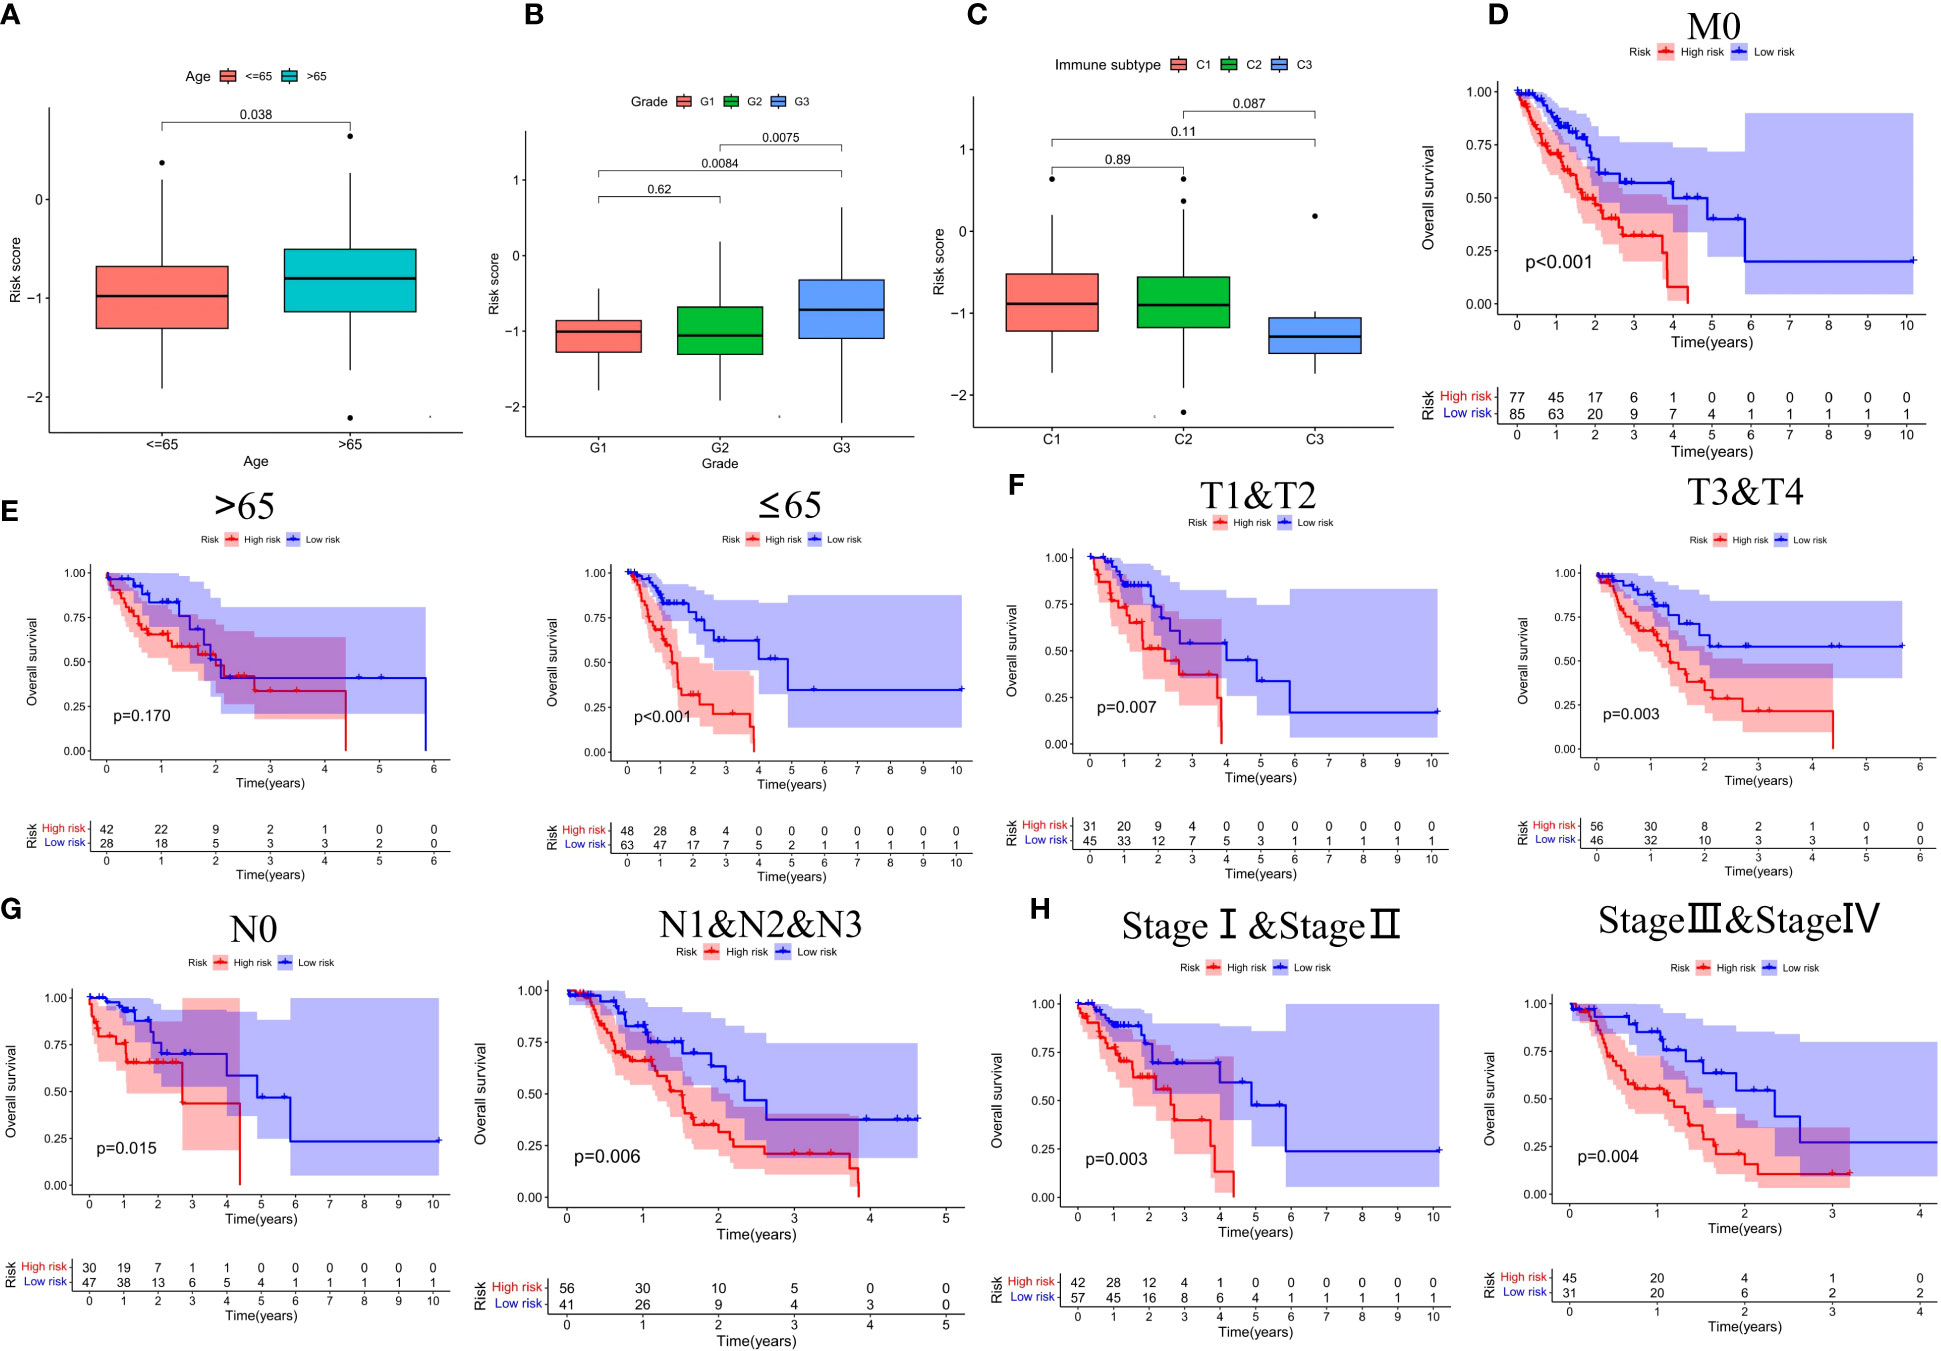
Figure 6 (A-C) Box plots of different risk groups at different ages, grades and, immune subtypes. Subgroup survival analysis of M0 stage (D), age (E), T stage (F), N stage (G), and pathological staging (H) between high- and low-risk score groups.
Construction of a clinical nomogram
In order to broaden the application of the CSRGs in ECa patients, we developed a quantitative nomogram to compute OS at 1, 2, and 3 years in the TCGA-ECa cohort and GEO-ECa cohort (Figure 7A). In the TCGA-ECa cohort, when the prognostic parameters’ point is 255, the predicted OS of patients with ECa is 0.544 at 1 year, 0.186 at 2 years, and 0.054 at 3 years. The OS prediction lines of the nomogram are close to the 45° standard curve of the calibration analysis in the TCGA-ECa cohort and GEO-ECa cohort, demonstrating that the established clinical nomogram performs excellent (Figure 7B). It confirmed the high predictive efficiency of the nomogram in OS of patients with ECa. We also found that the AUC value of the nomogram in the ROC curve reached 0.808, suggesting that the nomogram was a better predictor of survival than other prognostic indicators of ECa patients in the TCGA cohort (Figure 7C). In addition, the results of univariate Cox regression analysis combined with multivariate Cox regression analysis (Figures 7D, E) suggested that the nomogram (HR=1.164, 1.097-1.235, P<0.001) based on risk score remained an independent risk factor affecting the prognosis of ECa in TCGA cohort.
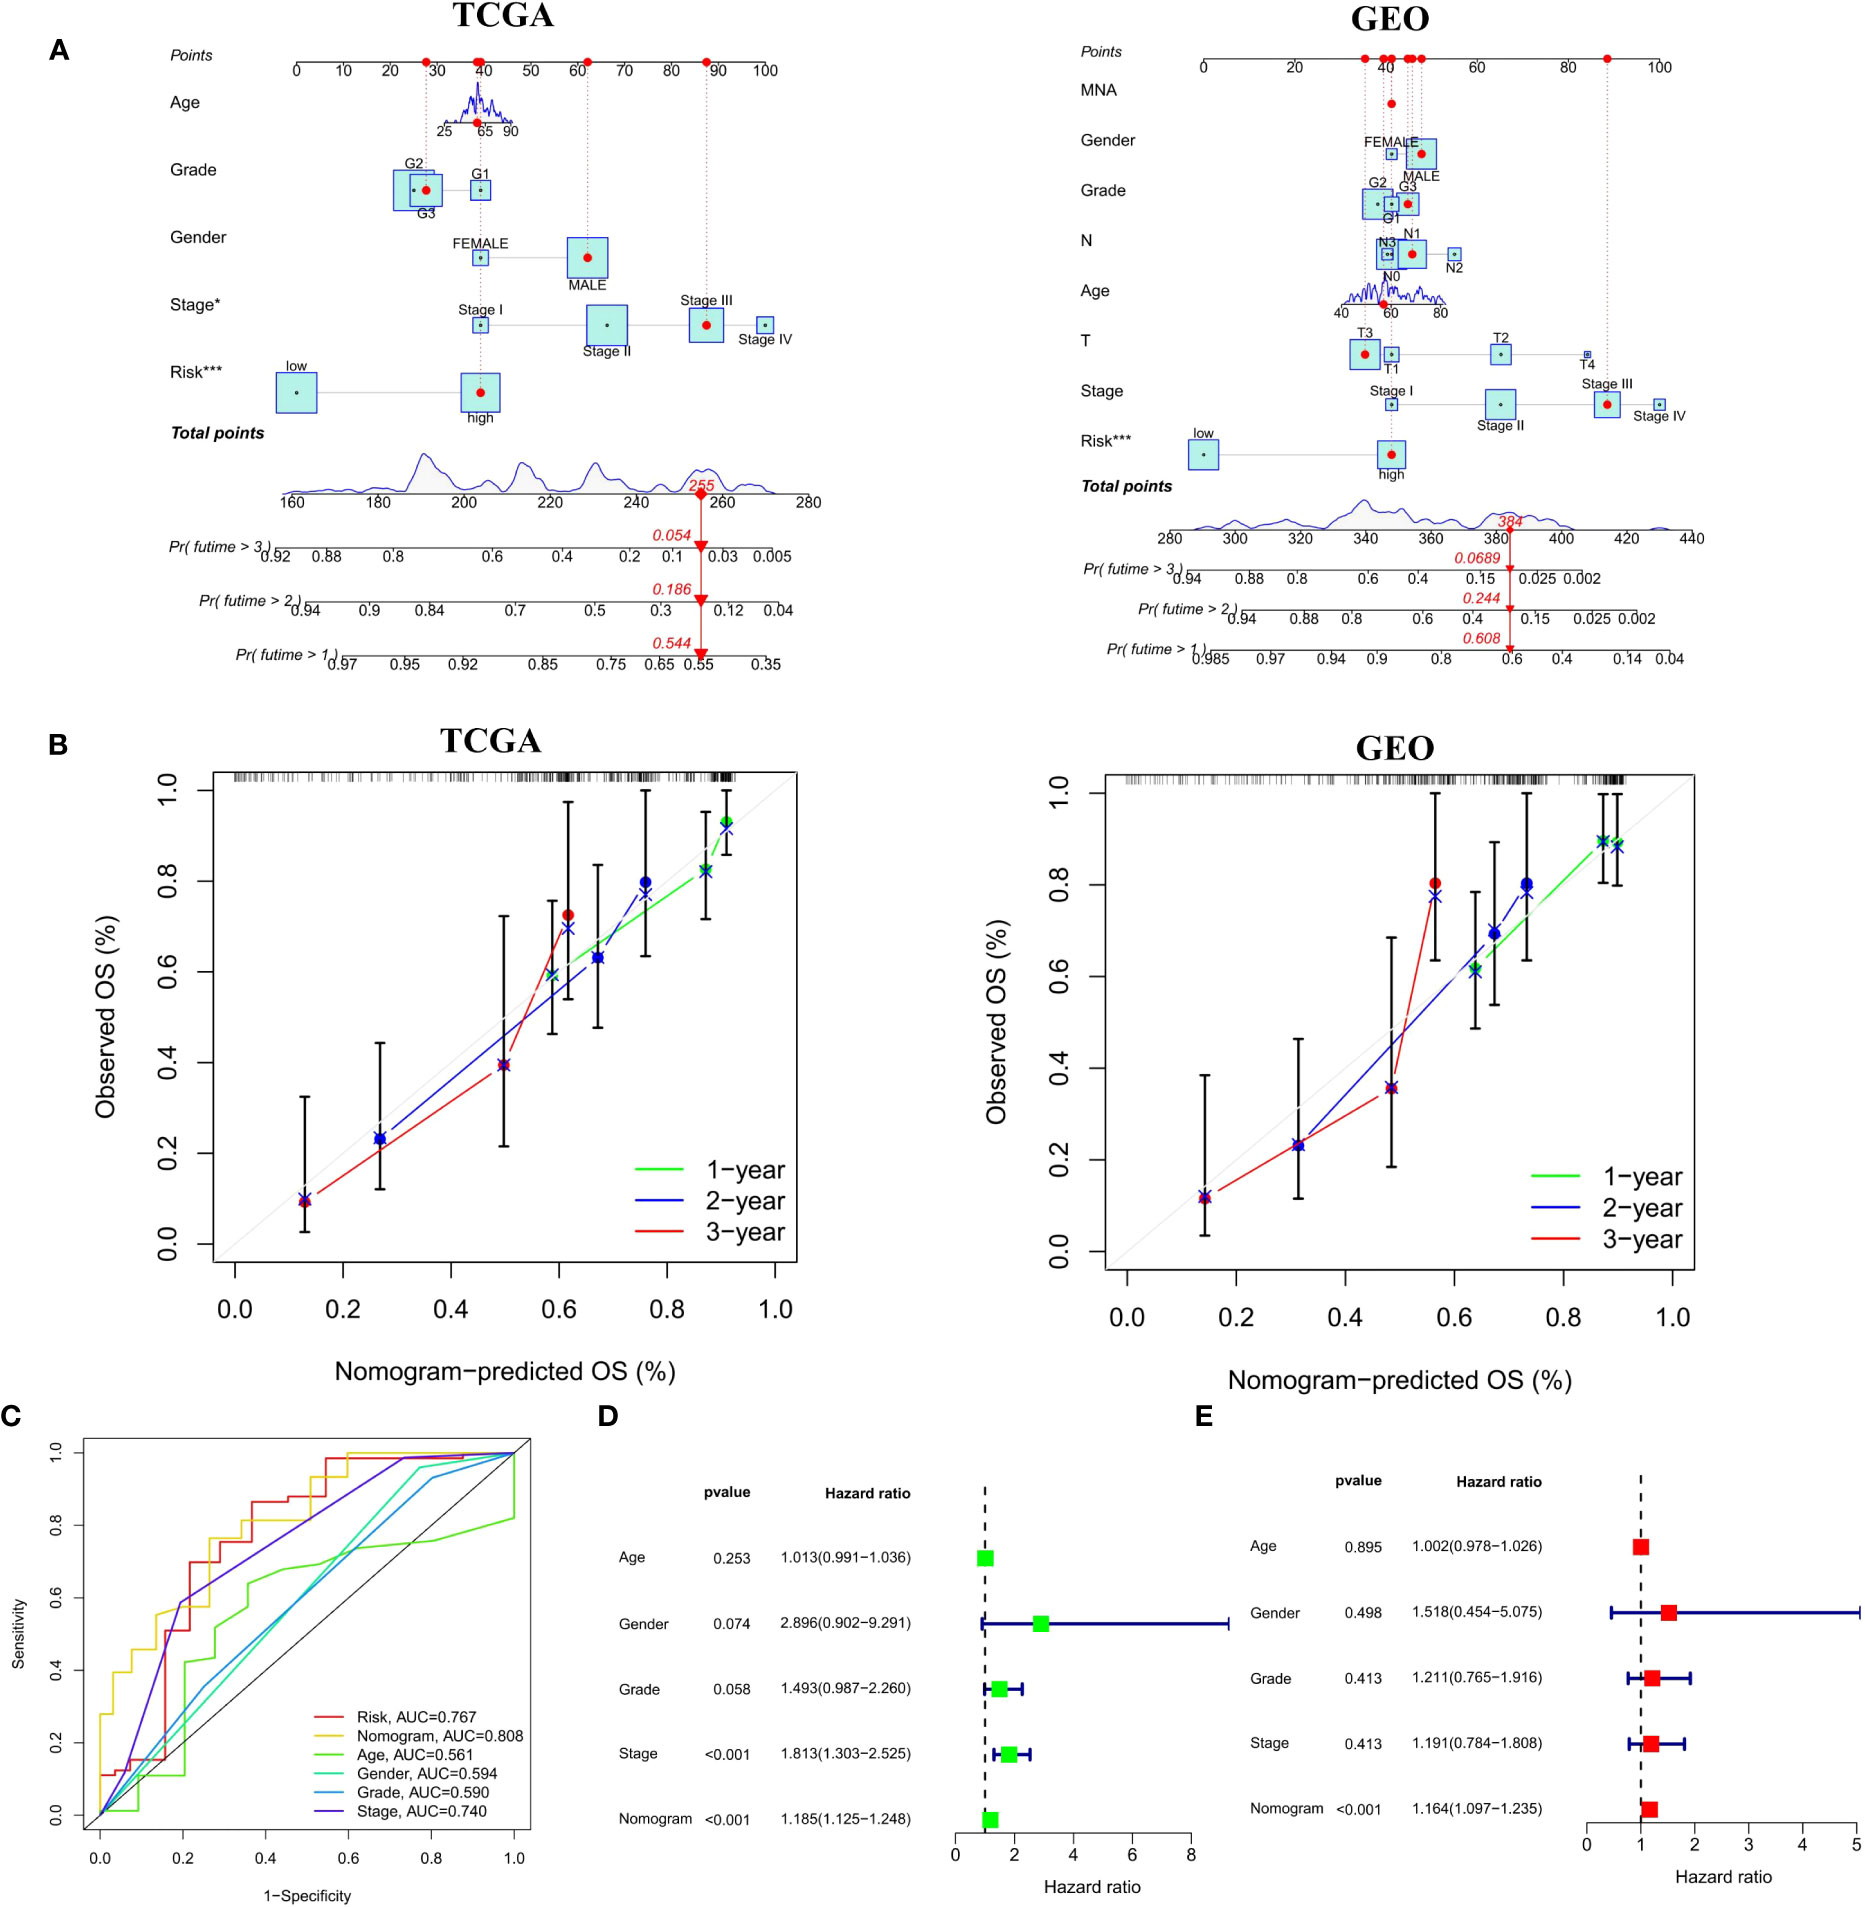
Figure 7 Construction and verification of a Nomogram. (A) Nomogram for forecasting the 1-, 2-, and 3-year mortality in the TCGA-ECa cohort and GEO-ECa cohort. (B) Calibration curve of the prediction efficiency of Nomogram in TCGA-ECa cohort and GEO-ECa cohort. (C) The AUC value of the nomogram was the highest at 0.808 in the TCGA cohort. (D, E) Univariate and multivariate Cox regression analyses of prognostic factors associated with OS in TCGA cohort, including Nomogram.
Relationship of the CSRGs signature with tumor immunotherapy
By performing GSVA (Gene Set Variation Analysis), we evaluate the relative expression difference of the pathways between two risk groups. Many differentially expressed pathways were enriched by GSVA analysis and finally visualized by heatmap (Figure 8A). Compared with the low-risk group, the expression of pathways associated with metabolism and transport of cellular processes were remarkably activated in the high-risk group, whereas the expression of tumor and genetic information processing associated pathways were significantly lower. Analysis of immune cell infiltration revealed higher naïve B cells and regulatory T cells (Tregs) in the high-risk group, however, activation of M0 macrophages and activated memory CD4+ T cells was higher in the low-risk group (Figure 8B). In addition, compared with the high-risk group, immune function analysis displayed that APC_co_inhibition and type_II_IFN_response were more activated in the low-risk group (Figure 8C). Finally, the TIDE algorithm showed that the high-risk group has a greater risk of immune escape during immunotherapy, which also implied that the low-risk group of ECa patients may benefit from immunotherapy (Figure 8D).
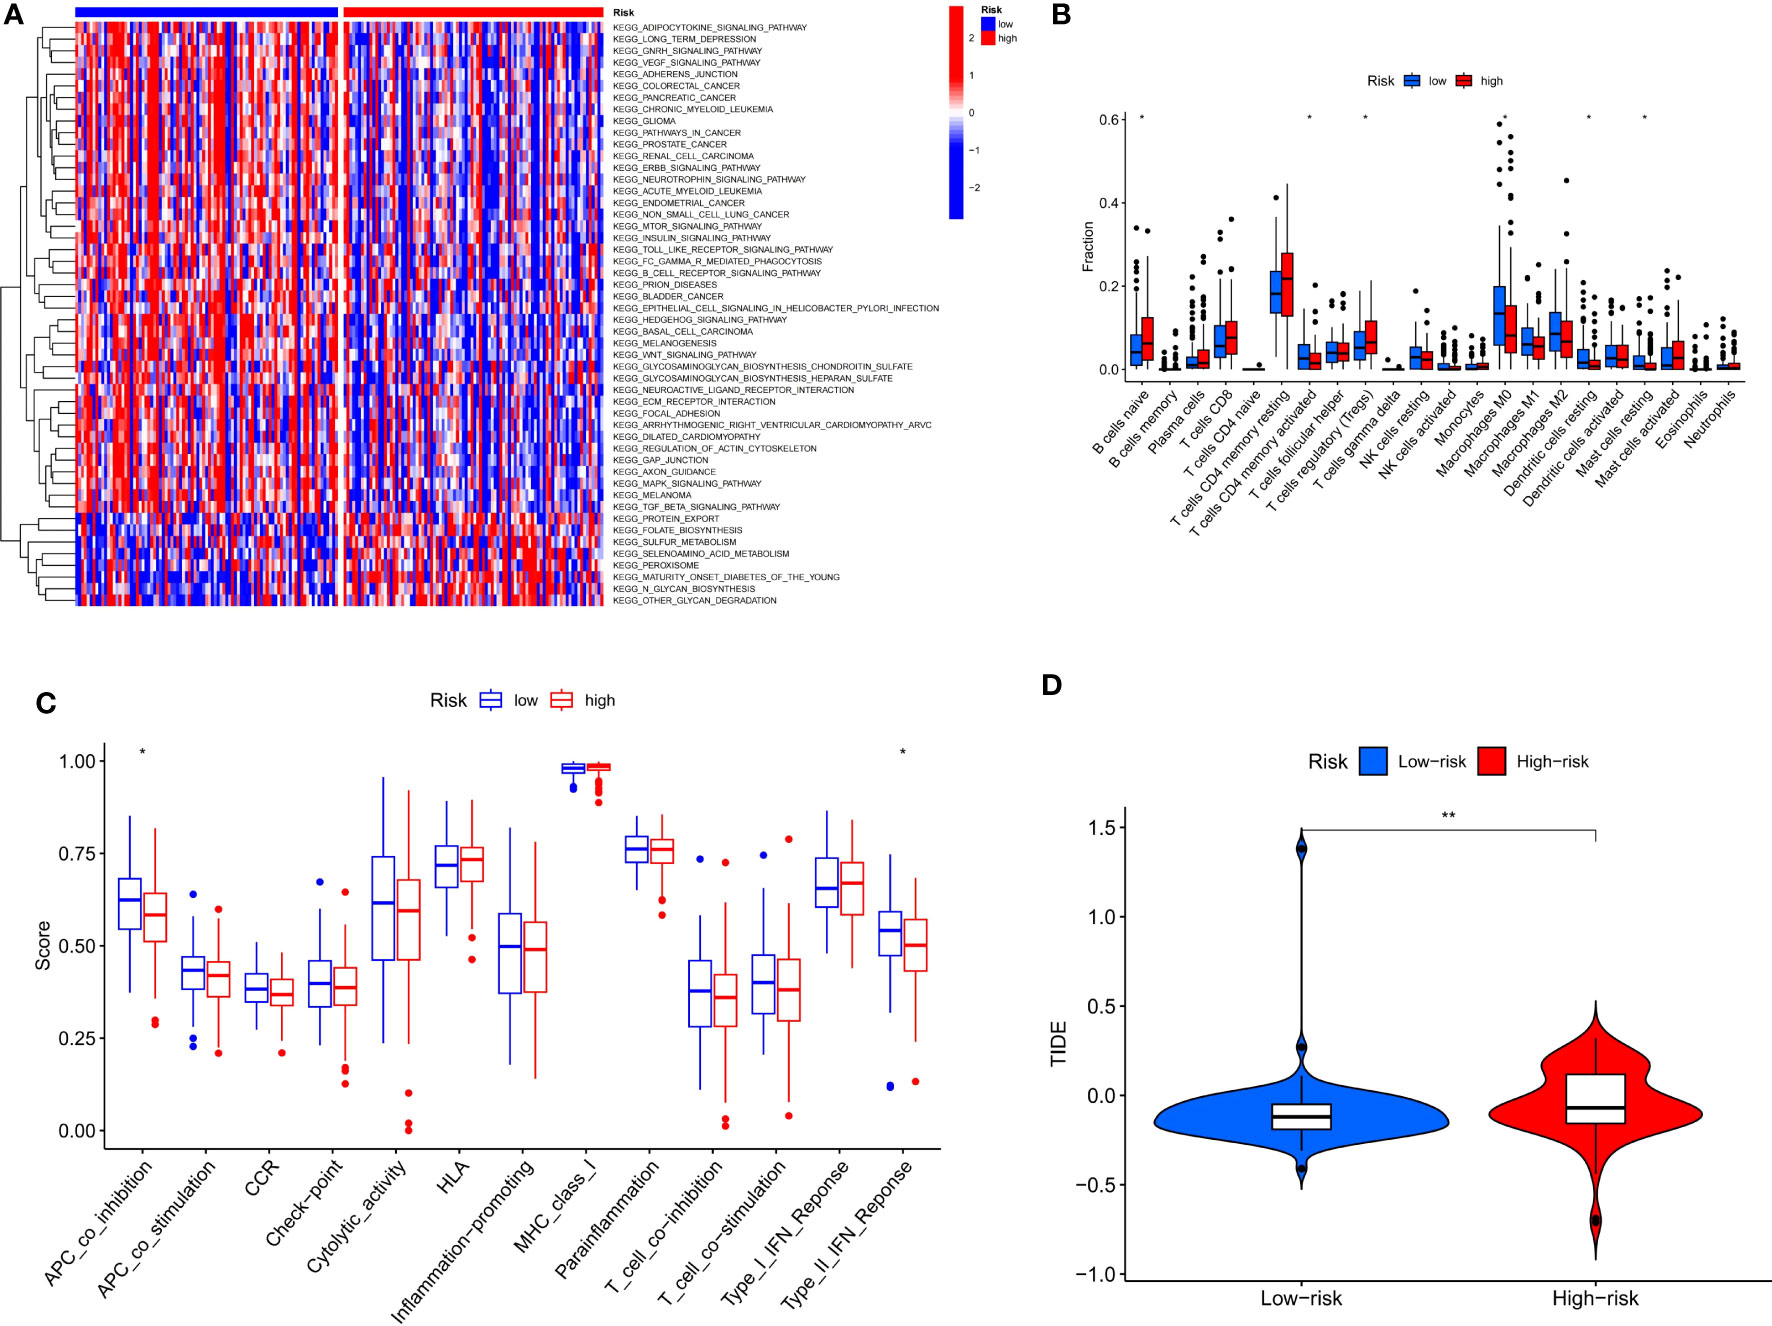
Figure 8 Risk score guides immunotherapy. (A) Heat map of GSVA analysis for two risk groups. (B, C) Box plot of immune signature analysis between two risk groups. (D) Violin plot of TIDE score distribution between two risk groups. * P < 0.05, **P < 0.01.
Functional enrichment analysis and gene set enrichment analysis
We screened 747 DEGs between the two risk groups. GO and KEGG analysis further elucidated differences in biological functions and pathways between the two risk groups. The biological process (BP) modules of GO analysis are mainly focused on epidermis development, digestion, epidermal cell differentiation, digestive system process, and so on (Figures 9A, B). However, the human papillomavirus infection, protein digestion and absorption, metabolism of xenobiotics by cytochrome P450, and tight junction pathways were observably enriched in the KEGG analysis (Figures 9C, D). To explore the different biological functions of 6 cellular senescence-related signature genes in two risk groups, the GSEA (gene set enrichment analysis) analysis was used to identify the top five pathways. GSEA analysis showed that complement and coagulation cascades, glycerolipid metabolism, maturity-onset diabetes of the young, PPAR signaling pathway, and tryptophan metabolism were enriched in high-risk groups (Figure 9E). However, dilated cardiomyopathy, ECM receptor interaction, hedgehog signaling pathway, pathways in cancer, and regulation of actin cytoskeleton were enriched in low-risk groups (Figure 9F).
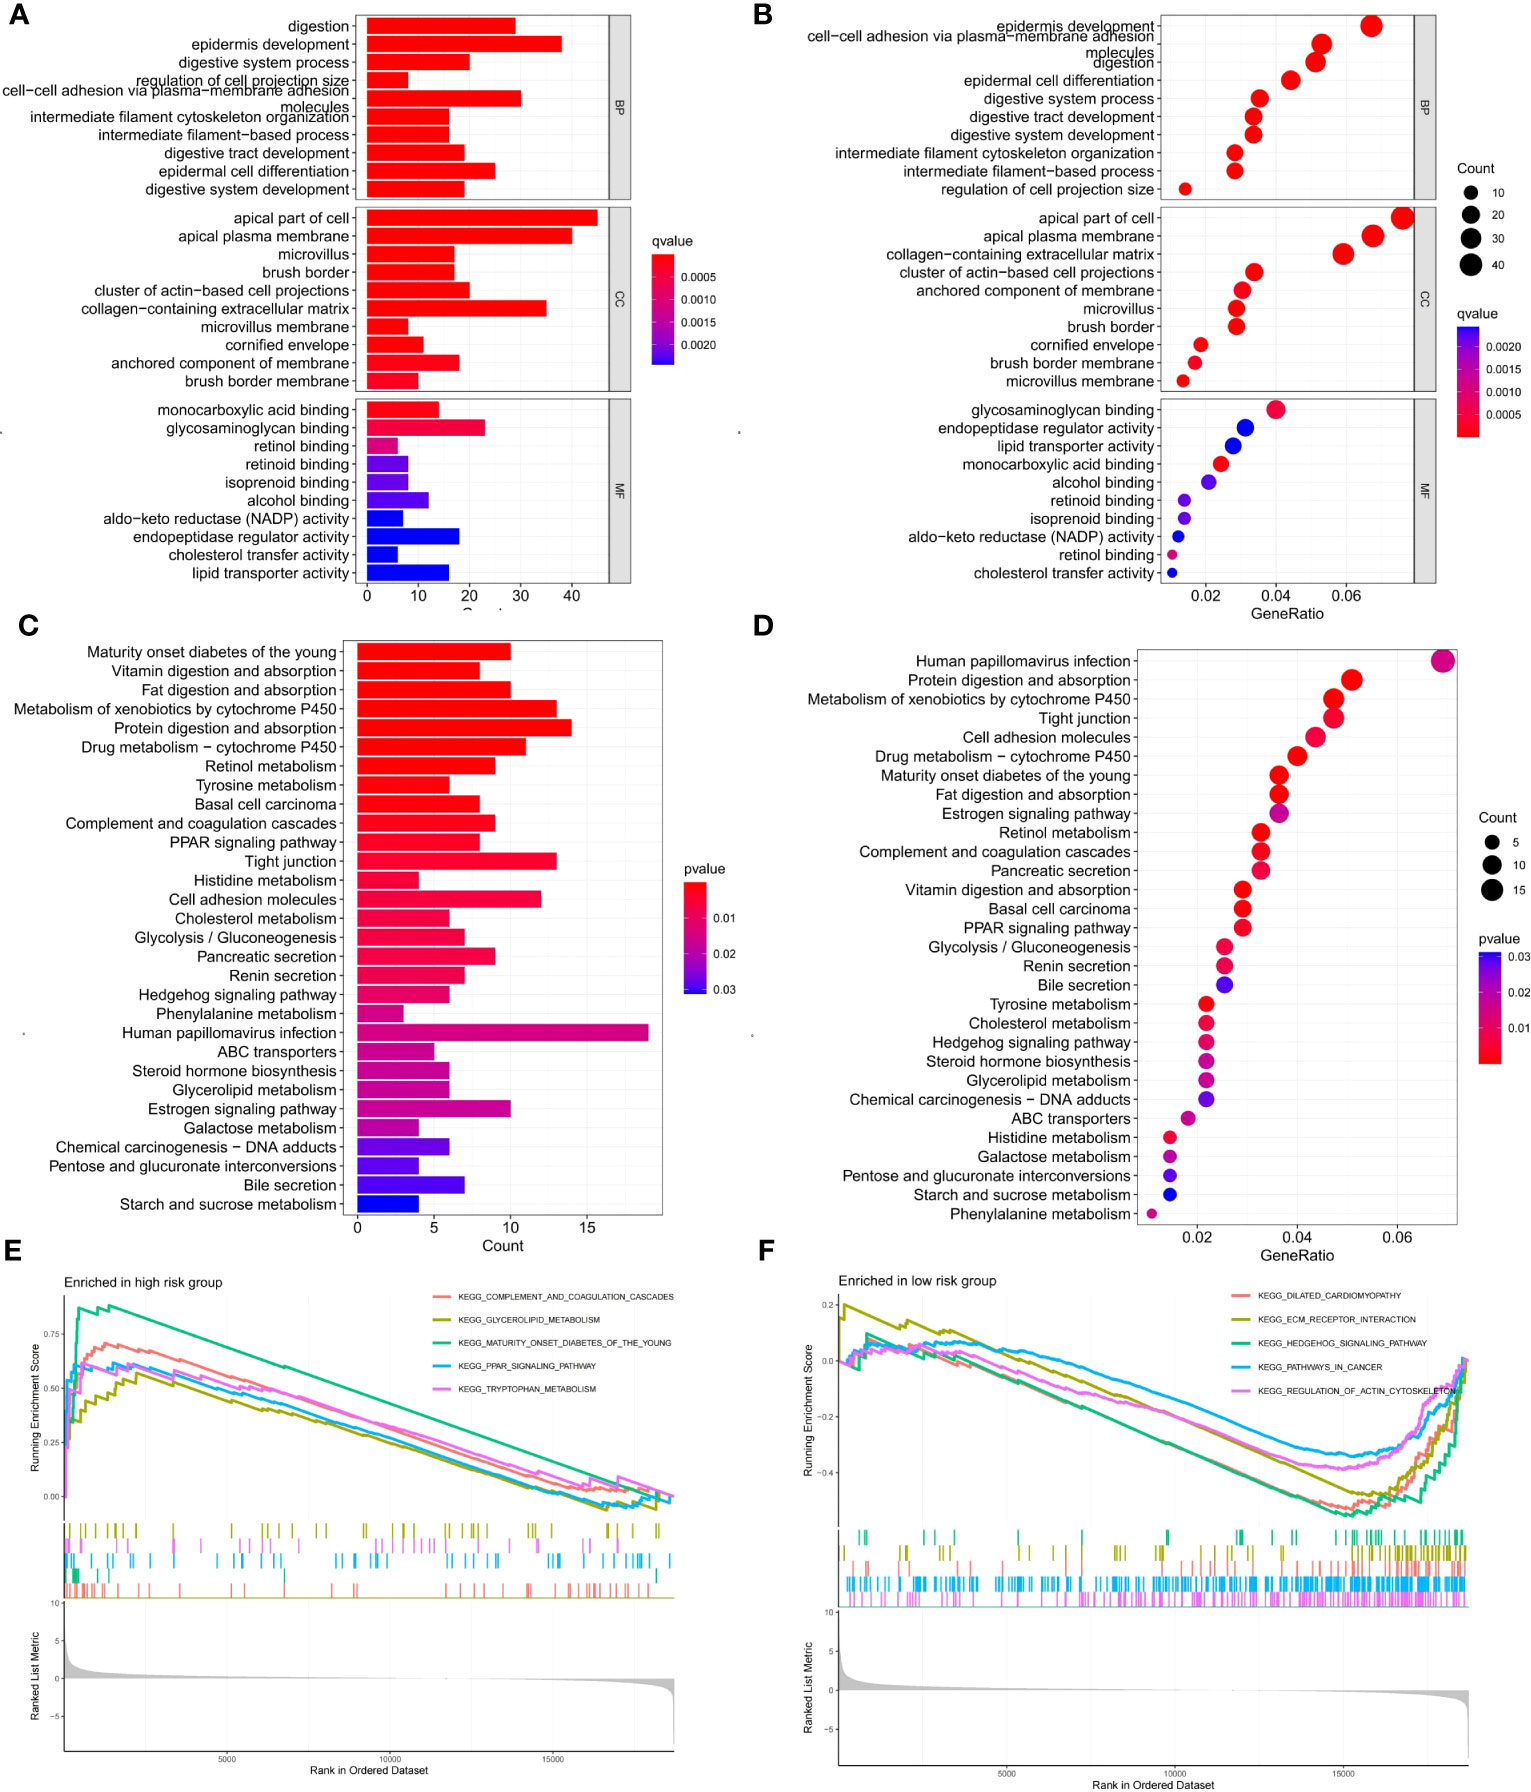
Figure 9 Enrichment analysis of DEGs between two risk groups and GSEA analysis of 6 signature genes in high- and low-risk groups. (A, B) GO enrichment analysis of DEGs between two risk groups. (C, D) KEGG enrichment analysis of DEGs between two risk groups. (E, F) GSEA analysis of the top five pathways enriched by 6 signature genes in high- and low-risk groups.
Identification of 10 hub candidate genes with the PPI network
In order to screen the differential hub genes that are involved in two risk score groups from the interaction level, the expression profiles of DEGs were visualized by the STRING database and Cytoscape software. Proteins encoded by 293 differential genes were used to construct the PPI network, which included the interaction relationship of 177 up-regulated genes and 116 down-regulated genes (Figure 10A). Finally, the 10 hub genes (APOA1, MUC5AC, GC, APOA4, AMBP, FABP1, APOA2, SOX2, MUC8, MUC17) with the highest interaction degrees were identified by Cytoscape (Figure 10B). By further analysis, 4 hub genes (APOA4, AMBP, FABP1, and APOA2) with survival differences were identified (Figure 10C; Supplementary Figure S2). The results demonstrated that patients with ECa with high expression of the above 4 genes had a lower probability of survival.
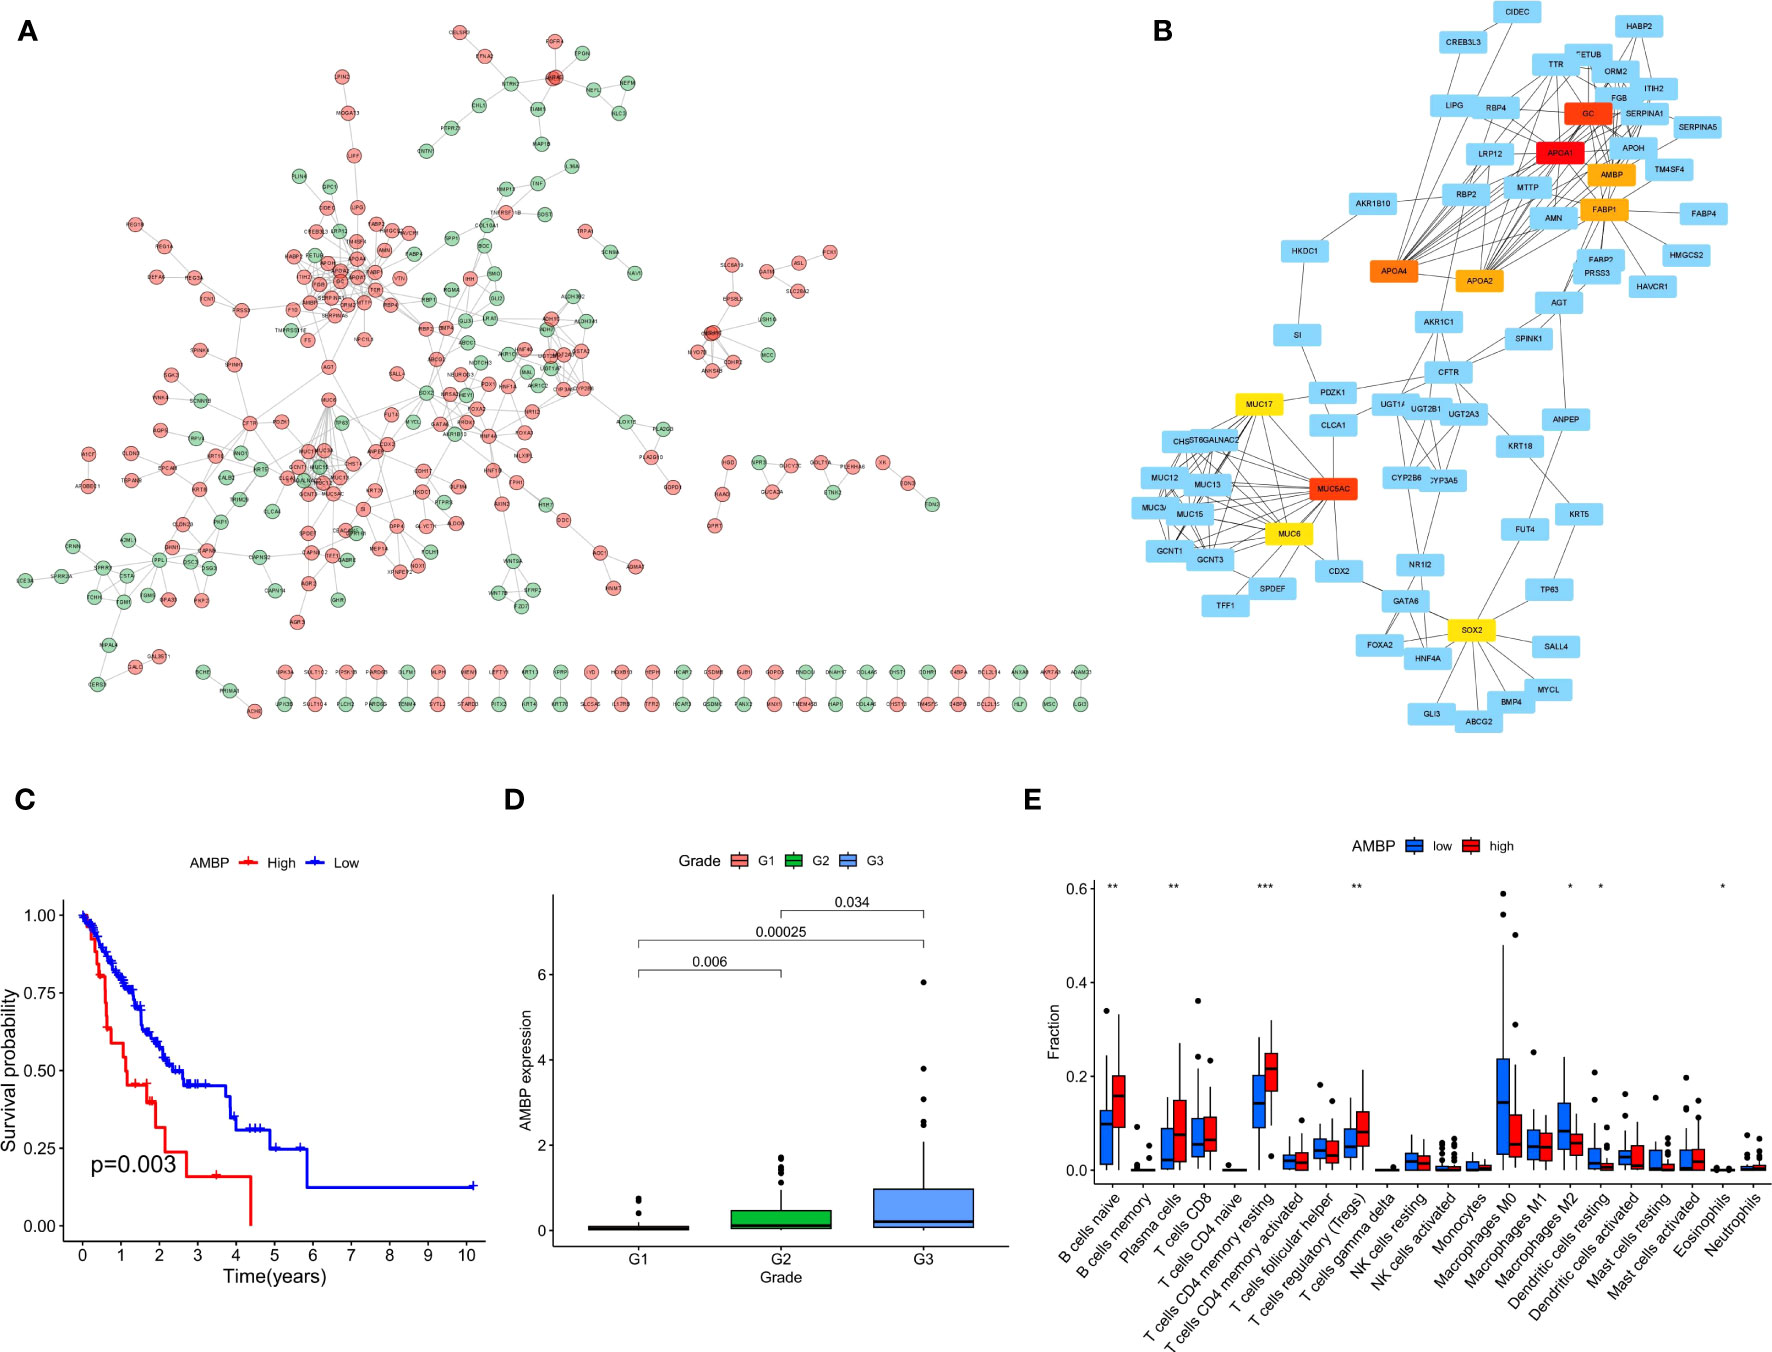
Figure 10 The PPI network complex for the DEGs and expression levels of hub genes among different clinical characteristics. (A) Proteins encoded by 293 DEGs were used to construct the PPI network. (B) A total of 10 hub genes were identified using Cytoscape. (C) K-M curves based on AMBP level in ECa patients. (D) Box plot of the relationship between the expression of AMBP and different grades. (E) Box plot of the relationship between the expression of AMBP and different immune cells. * P < 0.05, ** P < 0.01, *** P < 0.001.
We further analyzed the relationship between the expression level of these 4 genes and the clinical features of ECa. In ECa patients with grade G2 and G3, the expression level of APOA4 was significantly higher than that in grade G1 patients (Supplementary Figure S3). With the increase of G grade level in patients with ECa, the expression of AMBP gradually increased with statistical significance (Figure 10D). In ECa patients over 65 years old, the FABP1 expression level was significantly higher than that below 65 years old (Supplementary Figure S4). Finally, the relationship between the expression levels of these 4 genes and different immune cells was further explored. The AMBP and FABP1 high expression groups had higher resting CD4 memory T cells infiltration, suggesting that those groups of patients are more suitable for immunotherapy (Figure 10E; Supplementary Figure S5).
Discussion
Because patients with ECa do not feel any discomfort early on, the prognosis of patients with ECa is relatively poor. In the past diagnosis of ECa, early-stage cancer only accounts for about 5% (24). Due to the strong aggressiveness of ECa, when symptoms such as dysphagia appear, most of the patients are already at an advanced stage, resulting in a very poor prognosis for patients. However, despite the diversity of treatment options for ECa, the 3- and 5-year survival rates of patients fluctuate between 6% to 35% (24). Although the treatment strategy and individualized treatment of patients with ECa have improved, a considerable proportion of patients who receive comprehensive treatment still gained disappointing improvements in survival (25). It can be seen that the current effective clinical treatment for patients with ECa is quite limited. Therefore, it is greatly important to develop models for optimizing decision-making strategies for ECa management.
Cellular senescence refers to a state of persistent growth arrest induced by a variety of endogenous and exogenous stress (26). Accumulative evidence points to several common hallmarks of cellular senescence including high expression of the cell cycle inhibitor p16Ink4a, and a unique SASP involving matrix metalloproteinases, cytokines, growth factors, chemokines, and angiogenic factors (27). An increasing number of investigations have indicated that cellular senescence plays a considerable role in tumor microenvironment remodeling and tumor proliferation (28, 29). Considering that there are few studies on cellular senescence in ECa, this study explores the value of CSRGs in the prognosis and treatment of ECa. Finally, six genes, including DEK, RUNX1, SMARCA4, SREBF1, TERT, and TOP1 were filtered out to construct the prognostic signature. Intriguingly, previous studies have found that these landmark genes have been identified as playing an important role in the biological processes of various malignancies.
DEK encodes a protein consisting of 275 amino acids with a molecular weight of about 43 kDa (30). Multiple studies have shown that DEK is upregulated in a variety of malignant conditions, such as acute myelocytic leukemia(AML) (31–33), melanoma (34), hepatocellular carcinoma (35), retinoblastoma (36, 37), urinary bladder cancer (38, 39), glioblastoma (40), and oral squamous cell carcinoma (SCC) (41). Matrka et al. revealed for the first time that overexpression of DEK in mice contributes to an increase in the overall incidence of ECa and a trend toward increased cell proliferation was detected in adjacent normal esophageal tissues (42). There are three RUNX (including RUNX1, 2, and 3) family members in mammals, and different RUNX proteins have different tissue-specific expressions and exhibit different biological significance (43). Many studies in the past have confirmed that RUNX1 played a central role in epithelial tumorigenesis through the RUNX1-Stat3 axis (44, 45). SMARCA4 is considered to play a critical role in cell growth arrest and cellular senescence and is hypothesized to be a tumor suppressor gene in lung cancer (46, 47). SREBF1 has been shown to have a strong tumorigenic role in many malignant types including hepatocellular carcinoma, prostate cancer, and breast cancer (48). Li et al. also found that SREBF1 is an underlying therapeutic target and prognostic indicator in ECa (49). TERT gene, located in human chromosome 5p15.33, is the catalytic subunit of telomerase, is an indispensable and important part of telomerase-holoenzyme, and can play a crucial role in the formation of carcinoma through telomere-dependent or independent mechanism (50). Topoisomerase 1 (TOP1) can release topological stress due to natural processes such as replication and transcription and is an essential enzyme for life processes (51). If endogenous or exogenous DNA damage is not repaired by TOP1, it will ultimately contribute to cell death resulting from the accumulation of cytotoxic double-strand breaks (DSB) (52, 53). This regulatory mechanism has also been used in the anti-cancer treatment of various tumors, such as colorectal cancer (54), lung cancer (55), and ovarian cancer (56). Based on the evidence of the above findings, it further indicates that CSRGs may predict the prognosis of ECa.
By searching the TCGA database, we developed a prognostic risk signature for patients with ECa using CSRGs. In order to comprehend the underlying function of the signature in ECa, PCA analysis was first performed by us. The results revealed that patients with ECa could be more accurately segmented into two risk groups based on six CSRGs, which further proved the superiority of the signature. Survival analysis demonstrated that patients in the high-risk score group had a significantly poorer OS. We further rebuilt the signature with the same criteria in the validation cohort to verify the stability of the previously constructed risk signature. As expected, consistent with the prognostic result obtained in the TCGA, patients with higher risk scores of the GEO also exhibited worse OS. Furthermore, the results of multivariate Cox analysis verified that the risk signature based on CSRGs remained an independent risk factor affecting the prognosis of ECa in the TCGA-ECa cohort and GEO-ECa cohort. The CSRGs risk score can accurately determine prognosis in ECa patients with either aged less than 65 years or M0 stage, as well as in patients with ECa in T1&T2 stages or T3&T4 stages or N0 stage or N1&N2&N3 stages or pathological stage I & II or pathological stage III & IV. These results further demonstrate the practicability of our signature in the clinic. Immediately afterward, in order to broaden the application of the CSRGs in ECa patients, we developed a quantitative nomogram to compute OS at 1, 2, and 3 years. The OS prediction lines of the nomogram are close to the 45° standard curve of the calibration analysis, demonstrating that the established clinical nomogram performs excellent. Encouragingly, we also found that the AUC value of the nomogram in the ROC curve reached 0.808 in the TCGA cohort, suggesting that the nomogram was a better predictor of survival than other prognostic indicators of ECa patients. At last, the results of univariate Cox regression analysis combined with multivariate Cox regression analysis suggested that the nomogram based on risk score remained an independent risk factor affecting the prognosis of ECa.
With the development of medicine, more and more treatments are available for ECa (57). The core of tumor immunotherapy is to regulate the disordered immune function of the body, relying on the immune system to function to kill cancer cells and tumor tissues (58). This often leads to the abuse of immunotherapy drugs as it is currently unclear which patients with ECa benefit from immunotherapy in practice. Therefore, we conducted a further analysis using the available signature to distinguish which patients with ECa would benefit more from immunotherapy. Analysis of immune cell infiltration revealed higher regulatory T cells (Tregs) (tumor-promoting cells) in the high-risk group, however (59), activation of M0 macrophages and memory CD4+ T cells (anti-tumor cells) activated was higher in the low-risk group (60). In addition, compared with the high-risk group, immune function analysis displayed that APC_co_inhibition and type_II_IFN_response were more activated in the low-risk group. APC-co-inhibition describes an important mechanism of interaction between antigen-presenting cells (APC) and T cells. In this interaction, co-stimulatory molecules on the surface of antigen-presenting cells, such as CD80/86, bind to CD28 on the surface of T cells, initiating a T-cell immune response (61). Other molecules, such as CTLA-4, competitively bind CD80/86 to inhibit the T-cell immune response, known as APC-co-inhibition (61). Therefore, APC-CO-inhibition is not an independent immune pathway, but an immunomodulatory mechanism that can play a role in a variety of immune pathways, such as the TCR signaling pathway and NF-kB signaling pathway (61). The research results of Liu et al. revealed that “type_II_IFN_response” is an immune-related function associated with anti-tumor (62), which coincides with the results of our study. Based on these findings, we speculated that the low-risk group had a more effective response to immunotherapy than the high-risk group. Finally, the TIDE algorithm showed that the high-risk group had a greater risk of immune escape during immunotherapy, which also implied that the low-risk group of ECa patients may benefit from immunotherapy. On the whole, the prognostic signature of CSRGs that we constructed can not only predict the prognosis of ECa patients but also identify immunotherapy-sensitive patients.
In view of the significant differences in prognosis between the two risk groups, it is necessary to conduct in-depth research on the differential genes. We screened out 10 hub genes (APOA1, MUC5AC, GC, APOA4, AMBP, FABP1, APOA2, SOX2, MUC8, MUC17) by constructing a PPI network. Subsequently, by survival analysis, we observed that AMBP, APOA2, APOA4, and FABP1 were negatively correlated with the prognosis of ECa. At last, we also found higher immune infiltration (resting CD4 memory T cells) in the high-expression group of AMBP and FABP1, while macrophages M2 showed higher infiltration in the low-expression group of AMBP and FABP1. M2 macrophages, contrary to M1 cells that are pro-inflammatory and cytotoxic, are immunosuppressive and favor angiogenesis and tissue repair (63). Many studies have shown that tumor-associated M2 macrophages improve tumor cell growth and survival and stimulate angiogenesis and metastases (63, 64). A recent study has demonstrated that resting CD4 memory T cells were the protective factor for CRC (colorectal cancer) and could act as an independent prognostic factor based on a large sample analysis of 879 CRC patients (65). Moreover, some studies showed that resting CD4 memory T cells were associated with increased overall survival in various cancers (66, 67). It suggested that patients with high expression of AMBP and FABP1 might be more suitable for immunotherapy.
Conclusion
In the present study, our work identified and validated a CSRGs signature with independent prognostic significance for patients with ECa. The prognostic signature based on CSRGs established in this study is helpful to predict the survival rate of patients with ECa and guide clinical treatment. Patients with a low-risk group of the CSRGs signature may have a better immunotherapy effect. Therefore, our findings might facilitate the understanding of cellular senescence in ECa and provide certain guiding significance for immunotherapy. However, the current signature should be further explored and may provide some new insights into the mechanisms behind CSRGs in ECa.
Data availability statement
The datasets presented in this study can be found in online repositories. The names of the repository/repositories and accession number(s) can be found in the article/Supplementary Material.
Ethics statement
The studies involving human participants were reviewed and approved by The First Affiliated Hospital of Anhui Medical University. The patients/participants provided their written informed consent to participate in this study. Written informed consent was obtained from the individual(s) for the publication of any potentially identifiable images or data included in this article.
Author contributions
Experimental design: YW, and WW. Data collection: YW, LD, and RH. Methodology: YW, LD, WL, and WW. Writing-original draft: YW, LD, and WW. Writing-review and editing: YW, LD, RH, and WW. All authors read and approved the final manuscript. All authors contributed to the article and approved the submitted version.
Acknowledgments
Authors thank the following databases for supporting this article: TCGA, GEO, CellAge, and STRING databases.
Conflict of interest
The authors declare that the research was conducted in the absence of any commercial or financial relationships that could be construed as a potential conflict of interest.
Publisher’s note
All claims expressed in this article are solely those of the authors and do not necessarily represent those of their affiliated organizations, or those of the publisher, the editors and the reviewers. Any product that may be evaluated in this article, or claim that may be made by its manufacturer, is not guaranteed or endorsed by the publisher.
Supplementary material
The Supplementary Material for this article can be found online at: https://www.frontiersin.org/articles/10.3389/fonc.2023.1203351/full#supplementary-material
References
1. Sung H, Ferlay J, Siegel RL, Laversanne M, Soerjomataram I, Jemal A, et al. Global cancer statistics 2020: GLOBOCAN estimates of incidence and mortality worldwide for 36 cancers in 185 countries. CA: Cancer J Clin (2021) 71(3):209–49. doi: 10.3322/caac.21660
2. Waters JK, Reznik SI. Update on management of squamous cell esophageal cancer. Curr Oncol Rep (2022) 24(3):375–85. doi: 10.1007/s11912-021-01153-4
3. Salama R, Sadaie M, Hoare M, Narita M. Cellular senescence and its effector programs. Genes Dev (2014) 28(2):99–114. doi: 10.1101/gad.235184.113
4. Campisi J, Kapahi P, Lithgow GJ, Melov S, Newman JC, Verdin E. From discoveries in ageing research to therapeutics for healthy ageing. Nature (2019) 571(7764):183–92. doi: 10.1038/s41586-019-1365-2
5. Gorgoulis V, Adams PD, Alimonti A, Bennett DC, Bischof O, Bishop C, et al. Cellular senescence: defining a path forward. Cell (2019) 179(4):813–27. doi: 10.1016/j.cell.2019.10.005
6. Rhinn M, Ritschka B, Keyes WM. Cellular senescence in development, regeneration and disease. Development (2019) 146(20). doi: 10.1242/dev.151837
7. Calcinotto A, Kohli J, Zagato E, Pellegrini L, Demaria M, Alimonti A. Cellular senescence: aging, cancer, and injury. Physiol Rev (2019) 99(2):1047–78. doi: 10.1152/physrev.00020.2018
8. Campisi J, d'Adda di Fagagna F. Cellular senescence: when bad things happen to good cells. Nat Rev Mol Cell Biol (2007) 8(9):729–40. doi: 10.1038/nrm2233
9. Khosla S, Farr JN, Tchkonia T, Kirkland JL. The role of cellular senescence in ageing and endocrine disease. Nat Rev Endocrinol (2020) 16(5):263–75. doi: 10.1038/s41574-020-0335-y
10. Loo TM, Miyata K, Tanaka Y, Takahashi A. Cellular senescence and senescence-associated secretory phenotype via the cGAS-STING signaling pathway in cancer. Cancer Sci (2020) 111(2):304–11. doi: 10.1111/cas.14266
11. Milanovic M, Fan DNY, Belenki D, Dabritz JHM, Zhao Z, Yu Y, et al. Senescence-associated reprogramming promotes cancer stemness. Nature (2018) 553(7686):96–100. doi: 10.1038/nature25167
12. Toso A, Di Mitri D, Alimonti A. Enhancing chemotherapy efficacy by reprogramming the senescence-associated secretory phenotype of prostate tumors: A way to reactivate the antitumor immunity. Oncoimmunology (2015) 4(3):e994380. doi: 10.4161/2162402X.2014.994380
13. Lau L, David G. Pro- and anti-tumorigenic functions of the senescence-associated secretory phenotype. Expert Opin Ther Targets (2019) 23(12):1041–51. doi: 10.1080/14728222.2019.1565658
14. Berben L, Floris G, Wildiers H, Hatse S. Cancer and aging: two tightly interconnected biological processes. Cancers (2021) 13(6). doi: 10.3390/cancers13061400
15. Kumari R, Jat P. Mechanisms of cellular senescence: cell cycle arrest and senescence associated secretory phenotype. Front Cell Dev Biol (2021) 9:645593. doi: 10.3389/fcell.2021.645593
16. Cuollo L, Antonangeli F, Santoni A, Soriani A. The senescence-associated secretory phenotype (SASP) in the challenging future of cancer therapy and age-related diseases. Biology (2020) 9(12). doi: 10.3390/biology9120485
17. Luo Y, Liu H, Fu H, Ding GS, Teng F. A cellular senescence-related classifier based on a tumorigenesis- and immune infiltration-guided strategy can predict prognosis, immunotherapy response, and candidate drugs in hepatocellular carcinoma. Front Immunol (2022) 13:974377. doi: 10.3389/fimmu.2022.974377
18. Dai L, Wang X, Bai T, Liu J, Chen B, Yang W. Cellular senescence-related genes: predicting prognosis in gastric cancer. Front Genet (2022) 13:909546. doi: 10.3389/fgene.2022.909546
19. Luo L, Li F, Gong B, Xi P, Xie W. A novel prognostic model based on cellular senescence-related gene signature for bladder cancer. Front Oncol (2022) 12:937951. doi: 10.3389/fonc.2022.937951
20. Lu C, Wang Y, Nie L, Chen L, Li M, Qing H, et al. Comprehensive analysis of cellular senescence-related genes in the prognosis, tumor microenvironment, and immunotherapy/chemotherapy of clear cell renal cell carcinoma. Front Immunol (2022) 13:934243. doi: 10.3389/fimmu.2022.934243
21. Dai L, Wang X, Bai T, Liu J, Chen B, Li T, et al. Identification of a novel cellular senescence-related signature for the prediction of prognosis and immunotherapy response in colon cancer. Front Genet (2022) 13:961554. doi: 10.3389/fgene.2022.961554
22. Subramanian A, Tamayo P, Mootha VK, Mukherjee S, Ebert BL, Gillette MA, et al. Gene set enrichment analysis: a knowledge-based approach for interpreting genome-wide expression profiles. Proc Natl Acad Sci U States America (2005) 102(43):15545–50. doi: 10.1073/pnas.0506580102
23. Thorsson V, Gibbs DL, Brown SD, Wolf D, Bortone DS, Ou Yang TH, et al. The immune landscape of cancer. Immunity (2018) 48(4):812–830 e814. doi: 10.1016/j.immuni.2018.03.023
24. Liu GF, Chang H, Li BT, Zhang Y, Li DD, Liu Y, et al. Effect of recombinant human endostatin onradiotherapy for esophagus cancer. Asian Pacif J Trop Med (2016) 9(1):86–90. doi: 10.1016/j.apjtm.2015.12.017
25. Imai T, Tanaka Y, Sato Y, Mase J, Suetsugu T, Fukada M, et al. The role of adjuvant chemotherapy for esophageal squamous cell carcinoma patients with pathological positive lymph nodes after neoadjuvant chemotherapy followed by esophagectomy: a single institute retrospective analysis. Indian J Surg Oncol (2021) 12(4):776–84. doi: 10.1007/s13193-021-01419-0
26. Casella G, Munk R, Kim KM, Piao Y, De S, Abdelmohsen K, et al. Transcriptome signature of cellular senescence. Nucleic Acids Res (2019) 47(21):11476. doi: 10.1093/nar/gkz555
27. Bussian TJ, Aziz A, Meyer CF, Swenson BL, van Deursen JM, Baker DJ. Clearance of senescent glial cells prevents tau-dependent pathology and cognitive decline. Nature (2018) 562(7728):578–82. doi: 10.1038/s41586-018-0543-y
28. Eggert T, Wolter K, Ji J, Ma C, Yevsa T, Klotz S, et al. Distinct functions of senescence-Associated immune responses in liver tumor surveillance and tumor progression. Cancer Cell (2016) 30(4):533–47. doi: 10.1016/j.ccell.2016.09.003
29. Prieto LI, Baker DJ. Cellular senescence and the immune system in cancer. Gerontology (2019) 65(5):505–12. doi: 10.1159/000500683
30. Shibata T, Kokubu A, Miyamoto M, Hosoda F, Gotoh M, Tsuta K, et al. DEK oncoprotein regulates transcriptional modifiers and sustains tumor initiation activity in high-grade neuroendocrine carcinoma of the lung. Oncogene (2010) 29(33):4671–81. doi: 10.1038/onc.2010.217
31. Wise-Draper TM, Mintz-Cole RA, Morris TA, Simpson DS, Wikenheiser-Brokamp KA, Currier MA, et al. Overexpression of the cellular DEK protein promotes epithelial transformation in vitro and in vivo. Cancer Res (2009) 69(5):1792–9. doi: 10.1158/0008-5472.CAN-08-2304
32. Larramendy ML, Niini T, Elonen E, Nagy B, Ollila J, Vihinen M, et al. Overexpression of translocation-associated fusion genes of FGFRI, MYC, NPMI, and DEK, but absence of the translocations in acute myeloid leukemia. A microarray analysis. Haematol (2002) 87(6):569–77.
33. Casas S, Nagy B, Elonen E, Aventin A, Larramendy ML, Sierra J, et al. Aberrant expression of HOXA9, DEK, CBL and CSF1R in acute myeloid leukemia. Leuk Lymph (2003) 44(11):1935–41. doi: 10.1080/1042819031000119299
34. Khodadoust MS, Verhaegen M, Kappes F, Riveiro-Falkenbach E, Cigudosa JC, Kim DS, et al. Melanoma proliferation and chemoresistance controlled by the DEK oncogene. Cancer Res (2009) 69(16):6405–13. doi: 10.1158/0008-5472.CAN-09-1063
35. Kondoh N, Wakatsuki T, Ryo A, Hada A, Aihara T, Horiuchi S, et al. Identification and characterization of genes associated with human hepatocellular carcinogenesis. Cancer Res (1999) 59(19):4990–6.
36. Grasemann C, Gratias S, Stephan H, Schuler A, Schramm A, Klein-Hitpass L, et al. Gains and overexpression identify DEK and E2F3 as targets of chromosome 6p gains in retinoblastoma. Oncogene (2005) 24(42):6441–9. doi: 10.1038/sj.onc.1208792
37. Paderova J, Orlic-Milacic M, Yoshimoto M, da Cunha Santos G, Gallie B, Squire JA. Novel 6p rearrangements and recurrent translocation breakpoints in retinoblastoma cell lines identified by spectral karyotyping and mBAND analyses. Cancer Genet Cytogen (2007) 179(2):102–11. doi: 10.1016/j.cancergencyto.2007.08.014
38. Datta A, Adelson ME, Mogilevkin Y, Mordechai E, Sidi AA, Trama JP. Oncoprotein DEK as a tissue and urinary biomarker for bladder cancer. BMC Cancer (2011) 11:234. doi: 10.1186/1471-2407-11-234
39. Han S, Xuan Y, Liu S, Zhang M, Jin D, Jin R, et al. Clinicopathological significance of DEK overexpression in serous ovarian tumors. Pathol Int (2009) 59(7):443–7. doi: 10.1111/j.1440-1827.2009.02392.x
40. Kroes RA, Jastrow A, McLone MG, Yamamoto H, Colley P, Kersey DS, et al. The identification of novel therapeutic targets for the treatment of Malignant brain tumors. Cancer Lett (2000) 156(2):191–8. doi: 10.1016/S0304-3835(00)00462-6
41. Nakashima T, Tomita H, Hirata A, Ishida K, Hisamatsu K, Hatano Y, et al. Promotion of cell proliferation by the proto-oncogene DEK enhances oral squamous cell carcinogenesis through field cancerization. Cancer Med (2017) 6(10):2424–39. doi: 10.1002/cam4.1157
42. Matrka MC, Cimperman KA, Haas SR, Guasch G, Ehrman LA, Waclaw RR, et al. Dek overexpression in murine epithelia increases overt esophageal squamous cell carcinoma incidence. PloS Genet (2018) 14(3):e1007227. doi: 10.1371/journal.pgen.1007227
43. Ito Y, Bae SC, Chuang LS. The RUNX family: developmental regulators in cancer. Nat Rev Cancer (2015) 15(2):81–95. doi: 10.1038/nrc3877
44. Hong D, Fritz AJ, Gordon JA, Tye CE, Boyd JR, Tracy KM, et al. RUNX1-dependent mechanisms in biological control and dysregulation in cancer. J Cell Physiol (2019) 234(6):8597–609. doi: 10.1002/jcp.27841
45. Mevel R, Draper JE, Lie ALM, Kouskoff V, Lacaud G. RUNX transcription factors: orchestrators of development. Development (2019) 146(17). doi: 10.1242/dev.148296
46. Chatzopoulos K, Boland JM. Update on genetically defined lung neoplasms: NUT carcinoma and thoracic SMARCA4-deficient undifferentiated tumors. Virchows Archiv an Int J Pathol (2021) 478(1):21–30. doi: 10.1007/s00428-020-03011-3
47. Medina PP, Carretero J, Fraga MF, Esteller M, Sidransky D, Sanchez-Cespedes M. Genetic and epigenetic screening for gene alterations of the chromatin-remodeling factor, SMARCA4/BRG1, in lung tumors. Genes Chromosomes Cancer (2004) 41(2):170–7. doi: 10.1002/gcc.20068
48. Shimano H, Sato R. SREBP-regulated lipid metabolism: convergent physiology - divergent pathophysiology. Nat Rev Endocrinol (2017) 13(12):710–30. doi: 10.1038/nrendo.2017.91
49. Li LY, Yang Q, Jiang YY, Yang W, Jiang Y, Li X, et al. Interplay and cooperation between SREBF1 and master transcription factors regulate lipid metabolism and tumor-promoting pathways in squamous cancer. Nat Commun (2021) 12(1):4362. doi: 10.1038/s41467-021-24656-x
50. Akincilar SC, Unal B, Tergaonkar V. Reactivation of telomerase in cancer. Cell Mol Life Sci CMLS (2016) 73(8):1659–70. doi: 10.1007/s00018-016-2146-9
51. Wang JC. Cellular roles of DNA topoisomerases: a molecular perspective. Nat Rev Mol Cell Biol (2002) 3(6):430–40. doi: 10.1038/nrm831
52. Champoux JJ. DNA topoisomerases: structure, function, and mechanism. Annu Rev Biochem (2001) 70:369–413. doi: 10.1146/annurev.biochem.70.1.369
53. Pourquier P, Pilon AA, Kohlhagen G, Mazumder A, Sharma A, Pommier Y. Trapping of mamMalian topoisomerase I and recombinations induced by damaged DNA containing nicks or gaps. Importance of DNA end phosphorylation and camptothecin effects. J Biol Chem (1997) 272(42):26441–7. doi: 10.1074/jbc.272.42.26441
54. Van Cutsem E, Verslype C, Demedts I. The treatment of advanced colorectal cancer: where are we now and where do we go? Best Pract Res Clin Gastroenterol (2002) 16(2):319–30. doi: 10.1053/bega.2002.0288
55. Hartwell D, Jones J, Loveman E, Harris P, Clegg A, Bird A. Topotecan for relapsed small cell lung cancer: a systematic review and economic evaluation. Cancer Treat Rev (2011) 37(3):242–9. doi: 10.1016/j.ctrv.2010.07.005
56. Naumann RW, Coleman RL. Management strategies for recurrent platinum-resistant ovarian cancer. Drugs (2011) 71(11):1397–412. doi: 10.2165/11591720-000000000-00000
57. Rogers JE, Sewastjanow-Silva M, Waters RE, Ajani JA. Esophageal cancer: emerging therapeutics. Expert Opin Ther Targets (2022) 26(2):107–17. doi: 10.1080/14728222.2022.2036718
58. Kawazoe A, Shitara K, Boku N, Yoshikawa T, Terashima M. Current status of immunotherapy for advanced gastric cancer. Japanese J Clin Oncol (2021) 51(1):20–7. doi: 10.1093/jjco/hyaa202
59. Peng LS, Zhuang Y, Shi Y, Zhao YL, Wang TT, Chen N, et al. Increased tumor-infiltrating CD8(+)Foxp3(+) T lymphocytes are associated with tumor progression in human gastric cancer. Cancer Immunol Immunother CII (2012) 61(11):2183–92. doi: 10.1007/s00262-012-1277-6
60. Zhang H, Zhu Z, Modrak S, Little A. Tissue-resident memory CD4(+) T cells play a dominant role in the initiation of antitumor immunity. J Immunol (2022) 208(12):2837–46. doi: 10.4049/jimmunol.2100852
61. Rudd CE, Taylor A, Schneider H. CD28 and CTLA-4 coreceptor expression and signal transduction. Immunol Rev (2009) 229(1):12–26. doi: 10.1111/j.1600-065X.2009.00770.x
62. Liu M, Kuo F, Capistrano KJ, Kang D, Nixon BG, Shi W, et al. TGF-beta suppresses type 2 immunity to cancer. Nature (2020) 587(7832):115–20. doi: 10.1038/s41586-020-2836-1
63. Genin M, Clement F, Fattaccioli A, Raes M, Michiels C. M1 and M2 macrophages derived from THP-1 cells differentially modulate the response of cancer cells to etoposide. BMC Cancer (2015) 15:577. doi: 10.1186/s12885-015-1546-9
64. Tariq M, Hussain N, Rehman K, Akash MSH, Al Haddad AHI, Said ASA, et al. Macrophages M2 polarization is involved in lapatinib-mediated chemopreventive effects in the lung cancer. Biomed Pharmacother = Biomed Pharmacother (2023) 161:114527. doi: 10.1016/j.biopha.2023.114527
65. Zhang X, Quan F, Xu J, Xiao Y, Li X, Li Y. Combination of multiple tumor-infiltrating immune cells predicts clinical outcome in colon cancer. Clin Immunol (2020) 215:108412. doi: 10.1016/j.clim.2020.108412
66. Tamminga M, Hiltermann TJN, Schuuring E, Timens W, Fehrmann RS, Groen HJ. Immune microenvironment composition in non-small cell lung cancer and its association with survival. Clin Trans Immunol (2020) 9(6):e1142. doi: 10.1002/cti2.1142
Keywords: cellular senescence, esophageal carcinoma, prognosis signature, immunotherapy, bioinformatic analysis
Citation: Wang Y, Dai L, Huang R, Li W and Wu W (2023) Prognosis signature for predicting the survival and immunotherapy response in esophageal carcinoma based on cellular senescence-related genes. Front. Oncol. 13:1203351. doi: 10.3389/fonc.2023.1203351
Received: 10 April 2023; Accepted: 28 July 2023;
Published: 17 August 2023.
Edited by:
Liang Qiao, Westmead Institute for Medical Research, AustraliaReviewed by:
Rongyu Zhang, University of Washington, United StatesZhangyuan Yin, Broad Institute, United States
Song Jiang, Huzhou Institute of Biological Products Co., Ltd., China
Yile Dai, Yale University, United States
Copyright © 2023 Wang, Dai, Huang, Li and Wu. This is an open-access article distributed under the terms of the Creative Commons Attribution License (CC BY). The use, distribution or reproduction in other forums is permitted, provided the original author(s) and the copyright owner(s) are credited and that the original publication in this journal is cited, in accordance with accepted academic practice. No use, distribution or reproduction is permitted which does not comply with these terms.
*Correspondence: Wenyong Wu, YWhmeXd3eUAxNjMuY29t