 Yaqi Wu
 Jun Zhou
 Jun Zhang
 Zhijian Tang
 Xi Chen
 Lulu Huang
 Shengwen Liu
 Hong Chen
 Yu Wang
- 1Department of Neurosurgery, Tongji Hospital, Tongji Medical College, Huazhong University of Science and Technology, Wuhan, China
- 2School of Health, Brooks College, Sunnyvale, CA, United States
- 3Department of Epidemiology and Statistics, School of Public Health, Medical College, Zhejiang University, Hangzhou, China
- 4Medical Affairs, the Department of ICON Pharma Development Solutions (IPD), ICON Public Limited Company (ICON Plc), Beijing, China
- 5Dediatric Department, School of Clinical Medicine for Women and Children, China Three Gorges University, Yichang Maternal and Child Health Hospital, Yichang, China
Background: Previous genetic-epidemiological studies considered TERT (rs2736100), CCDC26 (rs4295627), CDKN2A/B (rs4977756) and RTEL1 (rs6010620) gene polymorphisms as the risk factors specific to glioma. However, the data samples of previous genetic-epidemiological studies are modest to determine whether they have definite association with glioma.
Method: The study paid attention to systematically searching databases of PubMed, Embase, Web of Science (WoS), Scopus, Cochrane Library and Google Scholars. Meta-analysis under 5 genetic models, namely recessive model (RM), over-dominant model (O-DM), allele model (AM), co-dominant model (C-DM) and dominant model (DM) was conducted for generating odds ratios (ORs) and 95% confidence intervals (CIs). That was accompanied by subgroup analyses according to various racial groups. The software STATA 17.0 MP was implemented in the study.
Result: 21 articles were collected. According to data analysis results, in four genetic models (AM, RM, DM and C-DM) TERT gene rs2736100 polymorphism, CCDC26 gene rs4295627 polymorphism, CDKN2A/B gene rs4977756 polymorphism and RTEL1 gene rs6010620 polymorphisms increased the risk of glioma in Caucasians to different degrees. In Asian populations, the CCDC26 gene rs4295627 polymorphism and CDKN2A/B gene rs4977756 polymorphism did not exhibit a relevance to the risk of glioma. It is suggested to cautiously explain these results as the sample size is small.
Conclusion: The current meta-analysis suggested that the SNP of TERT (rs2736100), CCDC26 (rs4295627), CDKN2A/B (rs4977756) and RTEL1 (rs6010620) genes in glioma might increase risk of glioma, but there are ethnic differences. Further studies evaluating these polymorphisms and glioma risk are warranted.
1 Introduction
Gliomas, which occupy more than 80% primary malignant tumors of central nervous system, are presumably caused by the aberrant growth of glial cells, mostly in the brain and spinal cord (1). Based on the cell type from which they originate, gliomas may be divided into several categories such astrocytomas, oligodendrogliomas, and ependymomas. The World Health Organization first used molecular pathology in the diagnostic classification of gliomas in 2016(2). Adult diffuse glioma currently has 3 molecular subtypes, according to the most recent 2021 version: glioblastoma multiforme (GBM), isocitrate dehydrogenase-wild-type (IDH-W-T); astrocytoma, IDH-mutant; and oligodendroglioma, IDH-mutant and 1p/19q-codeleted (3). Major current treatment of glioma is the combination of surgery with radiotherapy and chemotherapy, and for certain patients, immunotherapy and targeted therapy were implemented additionally (4–8). Nevertheless, the median survival time for gliomas is approximate 12 to 15 months merely, and both mortality and morbidity are tremendous (9).
Glioma occurs due to both environmental factors and genetic factors, and its precise pathogenesis remains opaque (10, 11). Risk factors for glioma may include smoking, nitrosamines, race, ionizing radiation, and brain injuries (12). Single nucleotide polymorphisms (SNPs) in genetic variables partially increase glioma risk to some extent (10). Genome-related studies have materialized some advancements in the identification of the risk of glioma with the development of genomic research, which reveal the link between numerous SNPs and glioma risk, including 5p15.33 (rs2736100, TERT), 8q24.21 (rs4295627, CCDC26), 9p21.3 (rs4977756, CDKN2A/B), and 20q13.33 (rs6010620, RTEL1) (10, 13, 14). Telomerase reverse transcriptase (TERT) is crucial for telomerase activity in preserving telomeres and cellular immortality (15). In contrast, coiled-coil domain containing 26 (CCDC26) downregulates telomerase activity and increases apoptosis. Cyclin-dependent kinase inhibitor 2A/B (CDKN2A/B) can partially control the cell cycle. Regulator of telomere elongation helicase 1 (RTEL1), as a DNA helicase, can inhibit homologous recombination for directly maintaining the genomic stability (16). These genes all have varied degrees of influence on glioma pathogenesis. Due to limited sample sizes or relatively homogeneous ethnicities, current literature investigating the relationship between glioma and SNPs susceptibility frequently resulted in inconsistent findings.
In this meta-analysis, we expanded sample size by enrolling up 21 articles and used five genetic models to examine the relationship between glioma and SNPs of TERT (RS2736100), CCDC26 (RS4295627), CDKN2A/B (RS497756), and RTEL1 (rs6010620).
2 Materials and methods
The meta-analysis in the study was performed as per the Preferred Reporting Items for Systematic reviews and Meta-Analysis version.
2.1 Literature retrieval
Literature search was carried out comprehensively in eight databases, namely PubMed, Embase, WoS, Scopus, Cochrane Library, and Google Scholars. The MeSH term were as follows: “((Nucleotide Polymorphism, Single) OR (SNP) OR (Polymorphisms, Single Nucleotide) OR (SNP) OR (SNP) OR (SNPs) OR (variation) OR (mutation)) AND ((Gliomas) OR (Glioma) OR (Glial Cell Tumors) OR (Glial Cell Tumor) OR (Tumor, Glial Cell) OR (Tumors, Glial Cell) OR (Mixed Glioma) OR (Glioma, Mixed) OR (Malignant Glioma) OR (Glioma, Malignant) OR (Astrocytoma) OR (Glioblastoma) OR (Diffuse Intrinsic Pontine Glioma) OR (Ependymoma) OR (Glioma, Subependymal) OR (Ganglioglioma) OR (Medulloblastoma) OR (Oligodendroglioma) OR (Optic Nerve Glioma)) AND (rs xxxxxxx)”. In addition, we screened relevant reviews and references from previous meta-analyses to increase the number of other eligible studies. The retrieval process was performed by two researchers independently. Any discrepancy was adjudicated by a senior investigator.
2.2 Inclusion criteria
(1) case-control or cohort study and genome-related study regarding the association of rs2736100 polymorphism of TERT gene, rs4295627 polymorphism of CCDC26 gene, rs4977756 polymorphism of CDKN2A/B gene and rs6010620 polymorphism of RTEL gene with glioma susceptibility;
(2) studies containing allelic and genotypic data or ORs and 95% CIs for susceptibility;
(3) appropriate statistical methods and reliable data with clear and unambiguous expression of results, allowing calculation of the ORs and 95% CIs;
(4) no overlapped data, and studies involving the same data or overlapped by the same authors, only the one that had the largest sample size or the most recently published.
2.3 Exclusion criteria
(1) review, commentary, abstract, and case report types;
(2) articles with original literature content did not involve TERT (rs2736100), CCDC26 (rs4295627), CDKN2A/B (rs4977756) and RTEL1 (rs6010620);
(3) articles were unrelated to glioma research;
(4) articles with insufficient data, such as those lacking gene frequency information or ORs with 95% CIs;
(5) articles with non-human study subjects.
2.4 Data extraction and literature quality evaluation
Each study covered the data of: the first author’s name, publication year, ethnicity (Caucasian, Asian, Multiple), number of cases and controls with relevant genotypes, ORs and 95% CIs. In addition, the genetic model used in the article was checked. We applied the Newcastle-Ottawa Scale for evaluating the literature quality. Two researchers performed independent data extraction and evaluated the literature quality. A senior investigator took charge of discrepancy arbitration.
2.5 Statistical analysis
STATA 17.0 MP was implemented for all statistical analyses in this study. First, we performed the Hardy-Weinberg Equilibrium (HWE) test (p<0.05 reported statistical significance). Second, we measured the association degree of TERT (rs2736100), CCDC26 (rs4295627), TERT (rs2736100) and RTEL1 (rs6010620) with glioma risk under five genetic models using the ORs and 95% CIs, which were the RM, O-DM, AM, C-DM and DM.
We merged the ORs and 95% CIs that satisfied the criteria under the same models. In addition, in all genetic models, subgroup analyses were carried out according to ethnic differences and the I2 values were adopted for evaluating study heterogeneity. When I2 ≤ 50%, a fixed effects model served for data analysis; when I2 =50%-75%, a random effects model served for data analysis; and when I2>75%, the Galbraith plot method was used to attenuate the heterogeneity of the study. In order to statistically analyze publication bias, we applied the Egger’s Test (p<0.05: statistical significance).
3 Result
3.1 Literature retrieval and quality evaluation
We initially searched 640 literature and eventually enrolled 21 eligible articles covering Caucasian, Asian, and others (10, 17–36). Twenty-one articles covered Caucasian, Asian, and multiracial studies. 15 out of the 21 studies were able to extract the complete genotype frequencies regarding the two groups, and we performed the HWE test on the control group (Table 1). Six studies were able to extract only ORs and 95% CIs under the correlation genetics model, as shown in Table 2. Figure 1 displays the entire search process. The included articles have a moderate quality (Table 3).
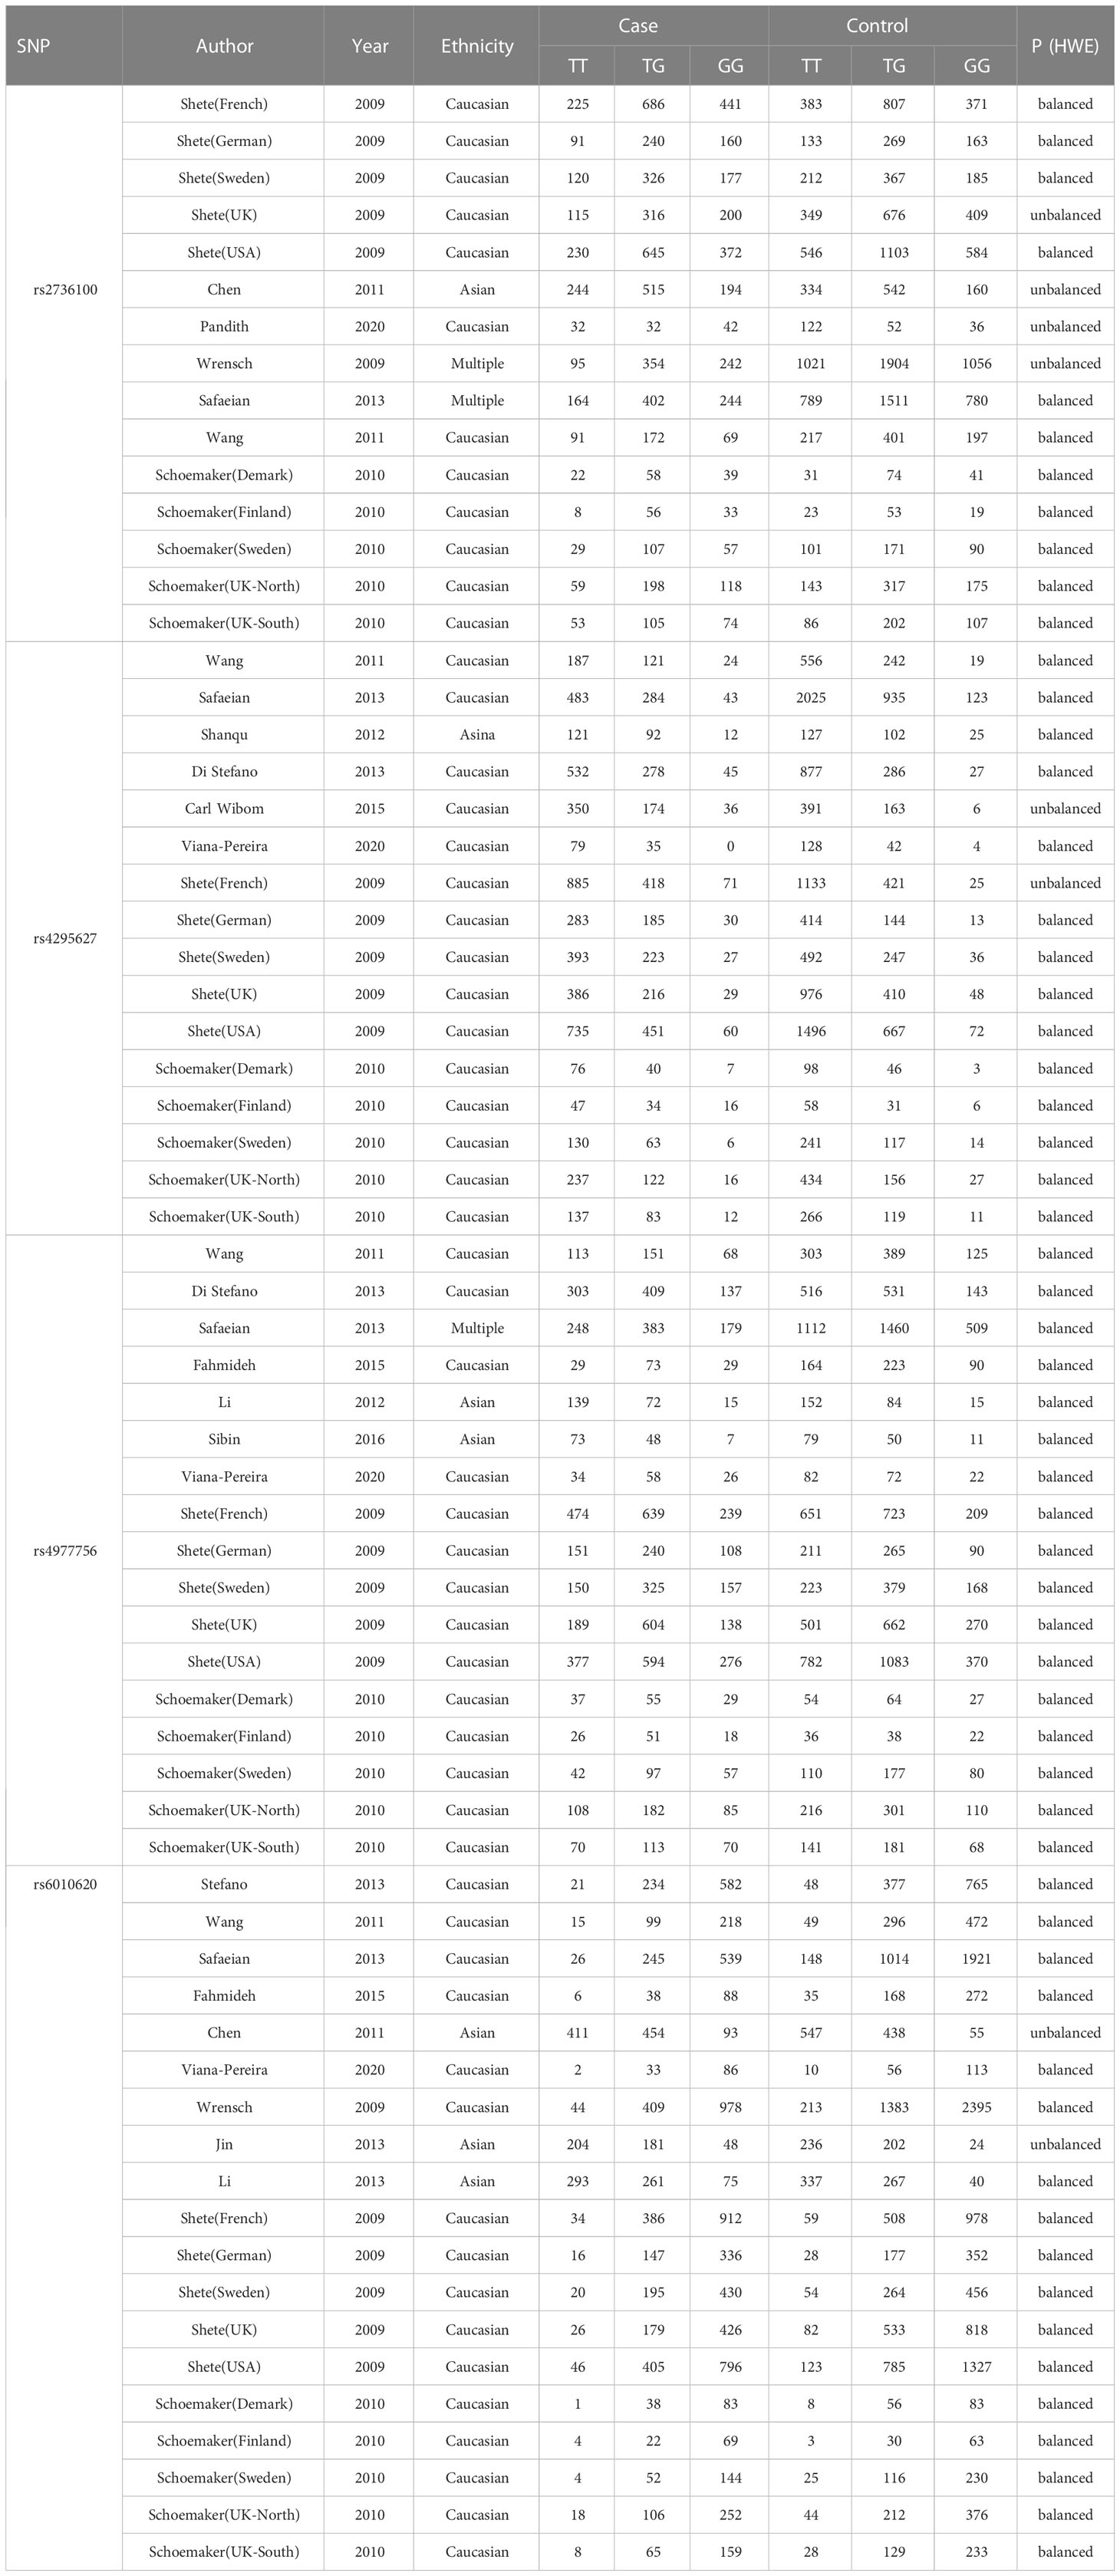
Table 1 Main characteristics of the studies that provided genotype frequencies and were included in the meta-analysis.
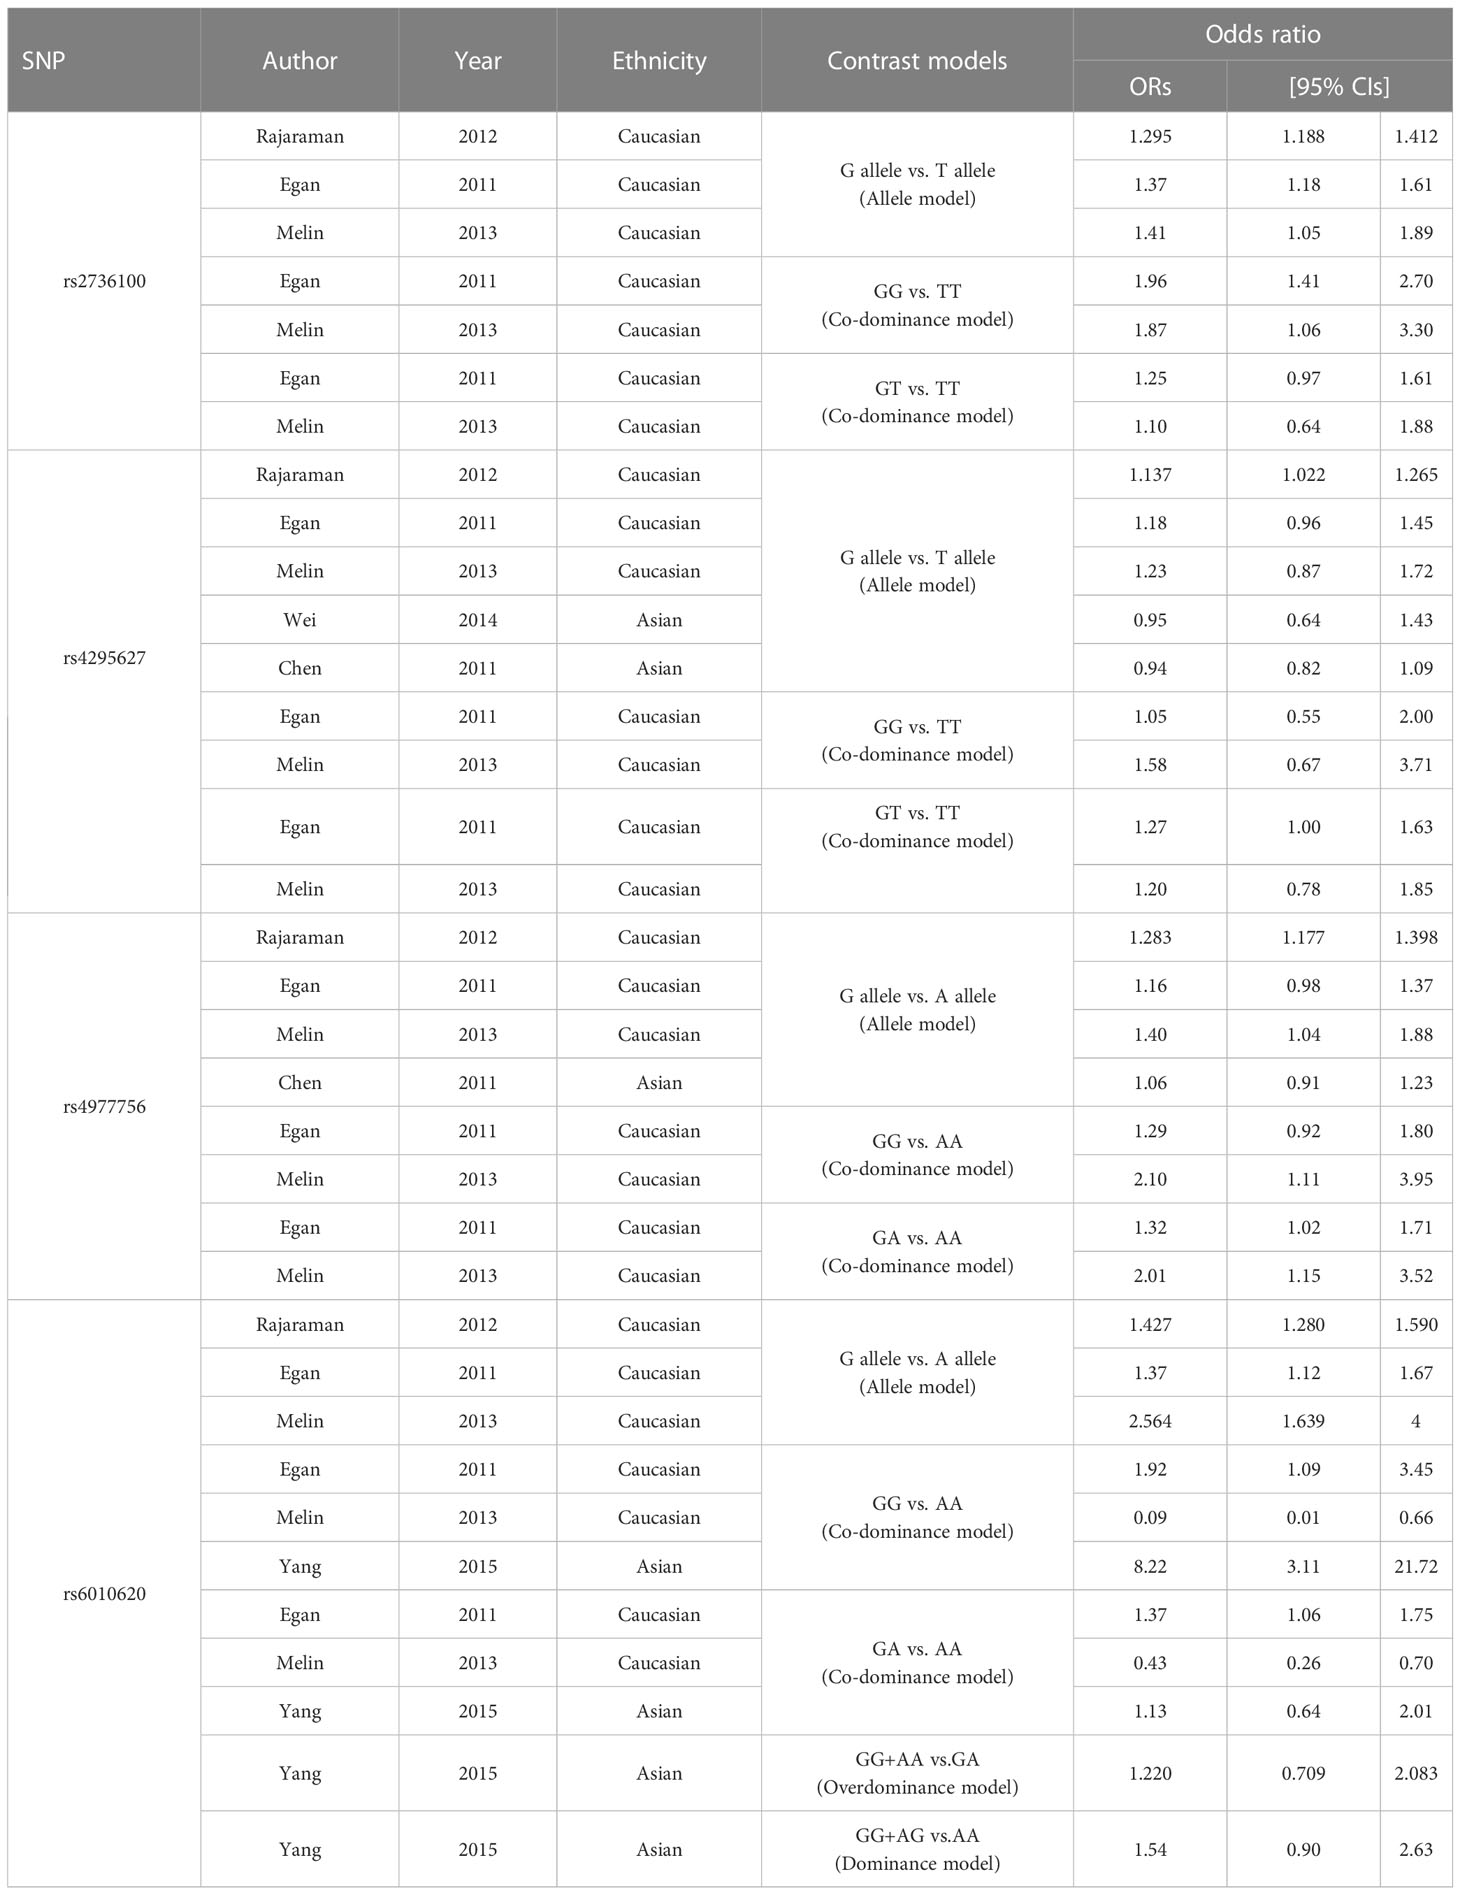
Table 2 Characteristics of the literature providing ORs and 95% CIs under the correlated genetic model.
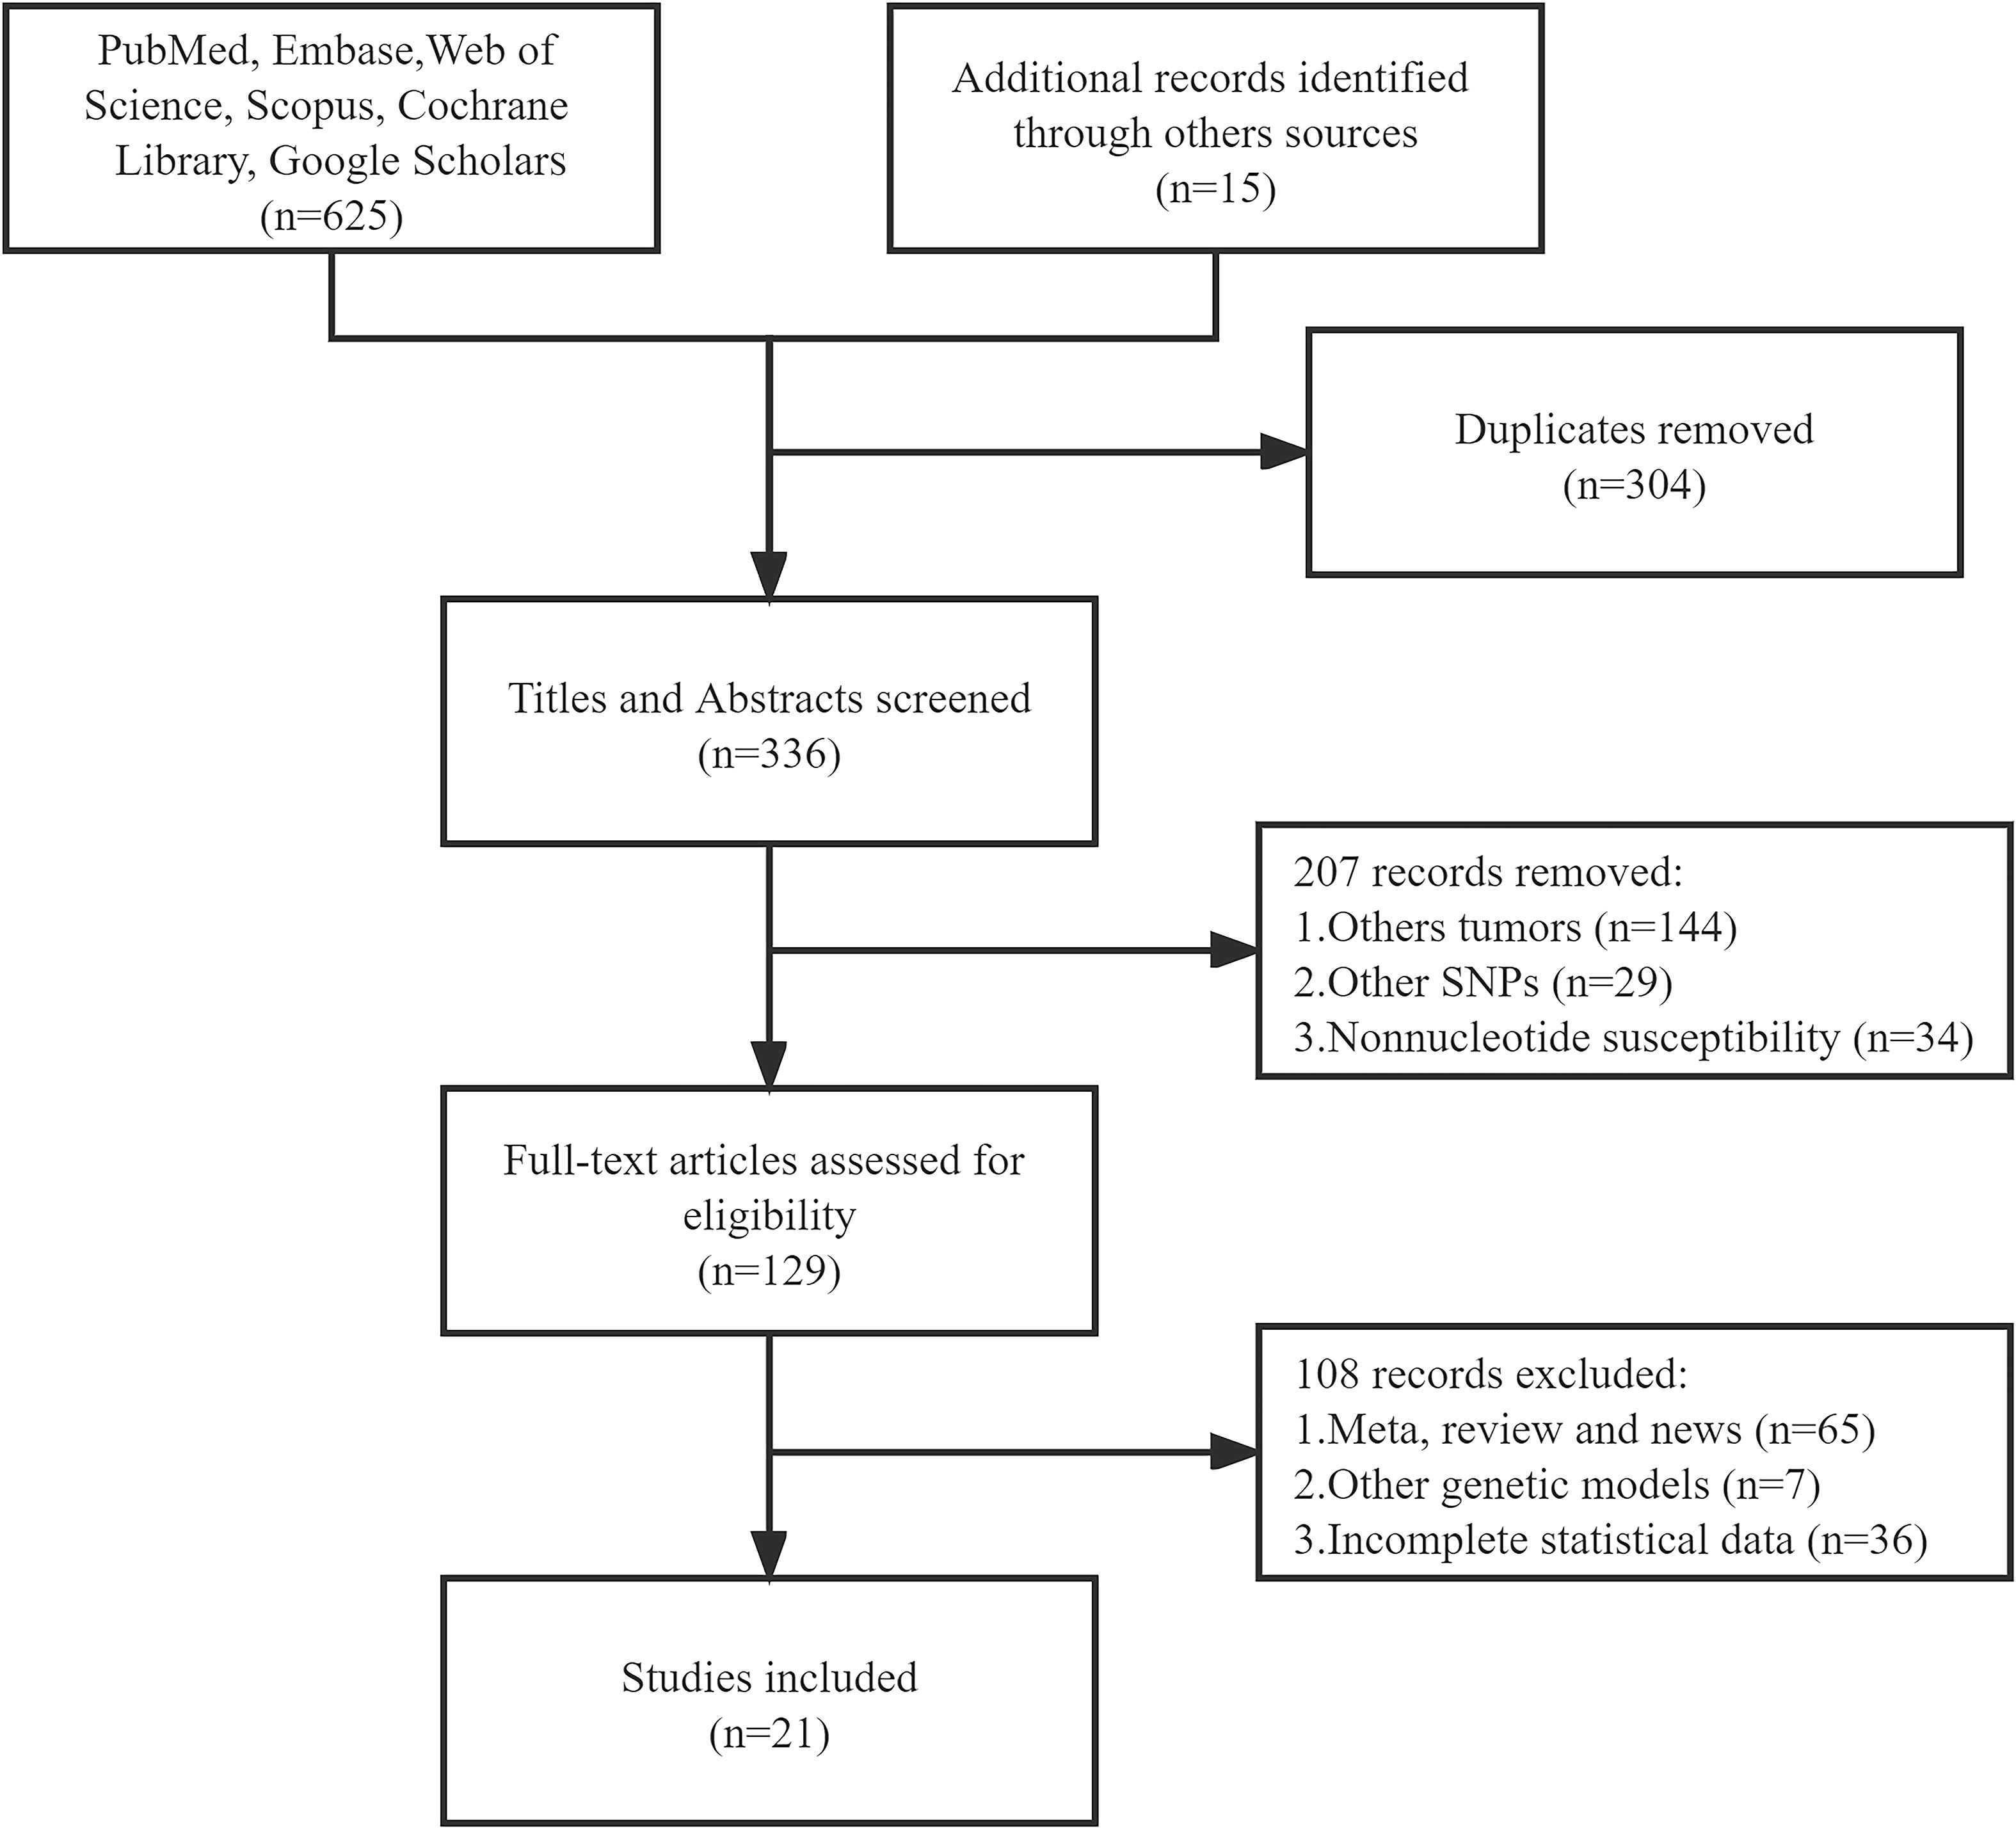
Figure 1 Flow chart of the study selection and exclusion criteria from this meta-analysis.
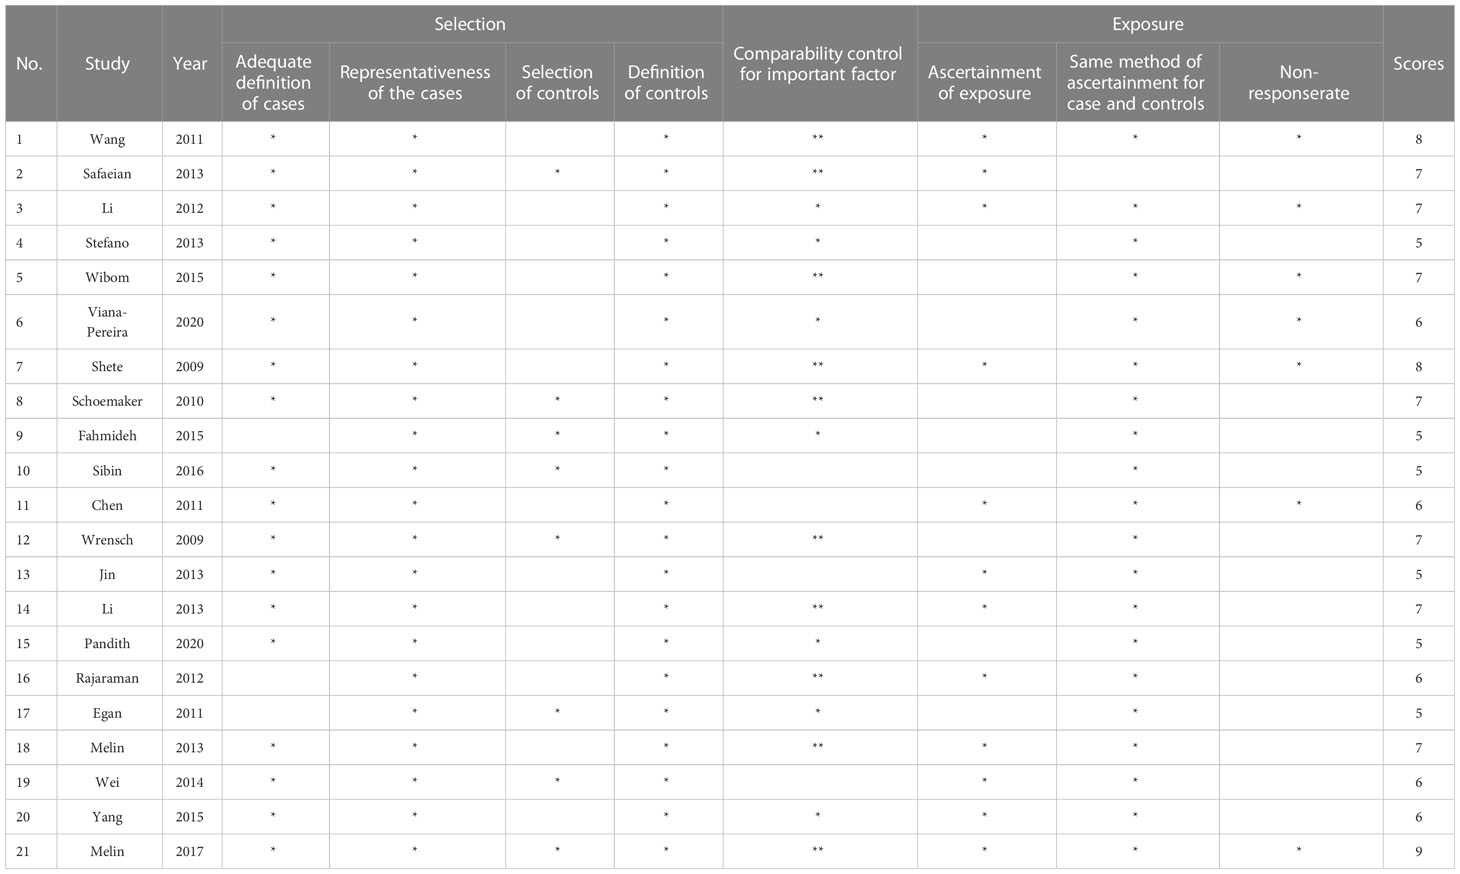
Table 3 Results of literature quality evaluation.
3.2 Meta-analysis results
3.2.1 rs2736100
In the TERT gene rs2736100 polymorphism, allele G is the risk gene (Figure 2). According to the meta-analysis analysis, the TERT gene rs2736100 polymorphism led to increased glioma risk in 5 genetic models (AM (G vs T): OR=1.29, 95% CI: 1.25 to 1.34; RM (GG vs TT+TG): OR=1.31, 95% CI: 1.18 to 1.44; DM (TG+GG vs TT): OR=1.52, 95% CI: 1.34 to 1.73; C-DM (GG vs TT): OR=1.69, 95% CI: 1.56 to 1.82; C-DM (GT vs TT): OR=1.40, 95% CI: 1.31 to 1.49; O-DM (TT+GG vs TG): OR=0.93, 95% CI: 0.88 to 0.98). When stratifying the analysis according to ethnicity, we obtained similar results in Caucasians, although in the O-DM results only showed a trend of association with glioma (AM (G vs T): OR=1.28, 95% CI: 1.23 to 1.33; RM (GG vs TT+TG): OR=1.29, 95%CI: 1.13 to 1.47; DM (TG+GG vs TT): OR=1.51, 95% CI: 1.29 to 1.76; C-DM (GG vs TT): OR=1.64, 95% CI: 1.50 to 1.80; C-DM (GT vs TT): OR=1.37, 95% CI: 1.27 to 1.49; O-DM (TT+GG vs TG): OR=0.93, 95% CI: 0.87 to 1.00). Among Asians, we included only one study, and the results were similar to those of Caucasians. In the study of a multi-ethnic population, we included the study of Wrensch and Safaeian which revealed the relevance of the TERT gene rs2736100 polymorphism to increased glioma risk.
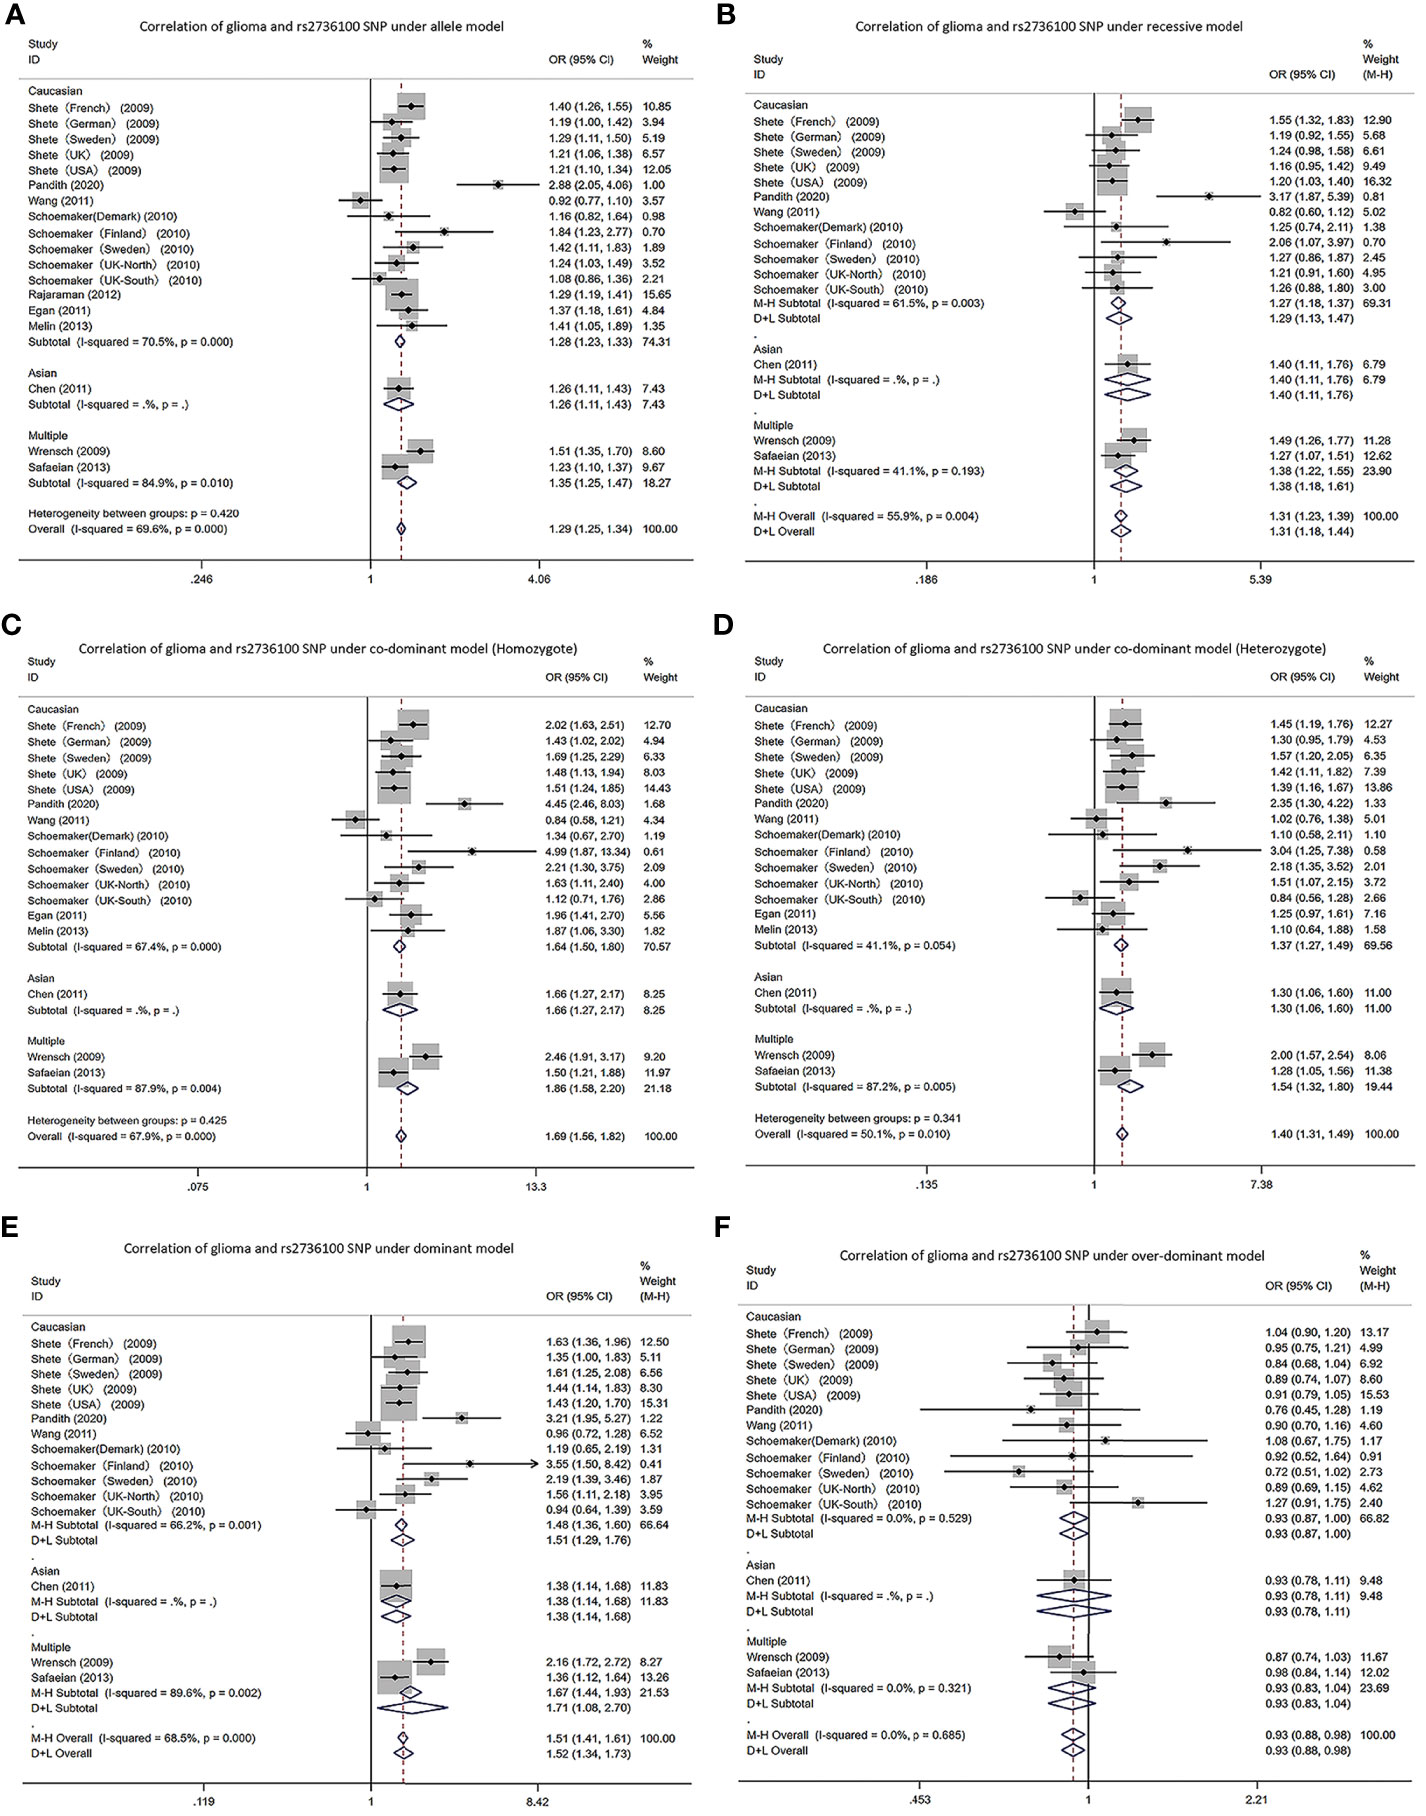
Figure 2 Forest plots of meta-analyses for correlation of glioma and rs2736100 SNP under all models. (A) allele model; (B) recessive model; (C) co-dominant model (Homozygote); (D) co-dominant model (Heterozygote); (E) dominant model; (F) over-dominant model.
3.2.2 rs4295627
In the CCDC26 gene rs4295627 polymorphism, allele T was the risk gene (Figure 3). Among Caucasians, according to the meta-analysis results: AM (G vs T): OR= 1.32; 95% CI: 1.26 to 1.38; RM (GG vs TT+TG): 1.86; 1.40 to 2.48; DM (TG+GG vs TT): 1.41; 1.33 to 1.49; C-DM (GG vs TT): 1.88; 1.63 to 2.17; C-DM (GT vs TT): 1.34; 1.26 to 1.42; O-DM (TT+GG vs TG): 0.77; 0.73 to 0.82.
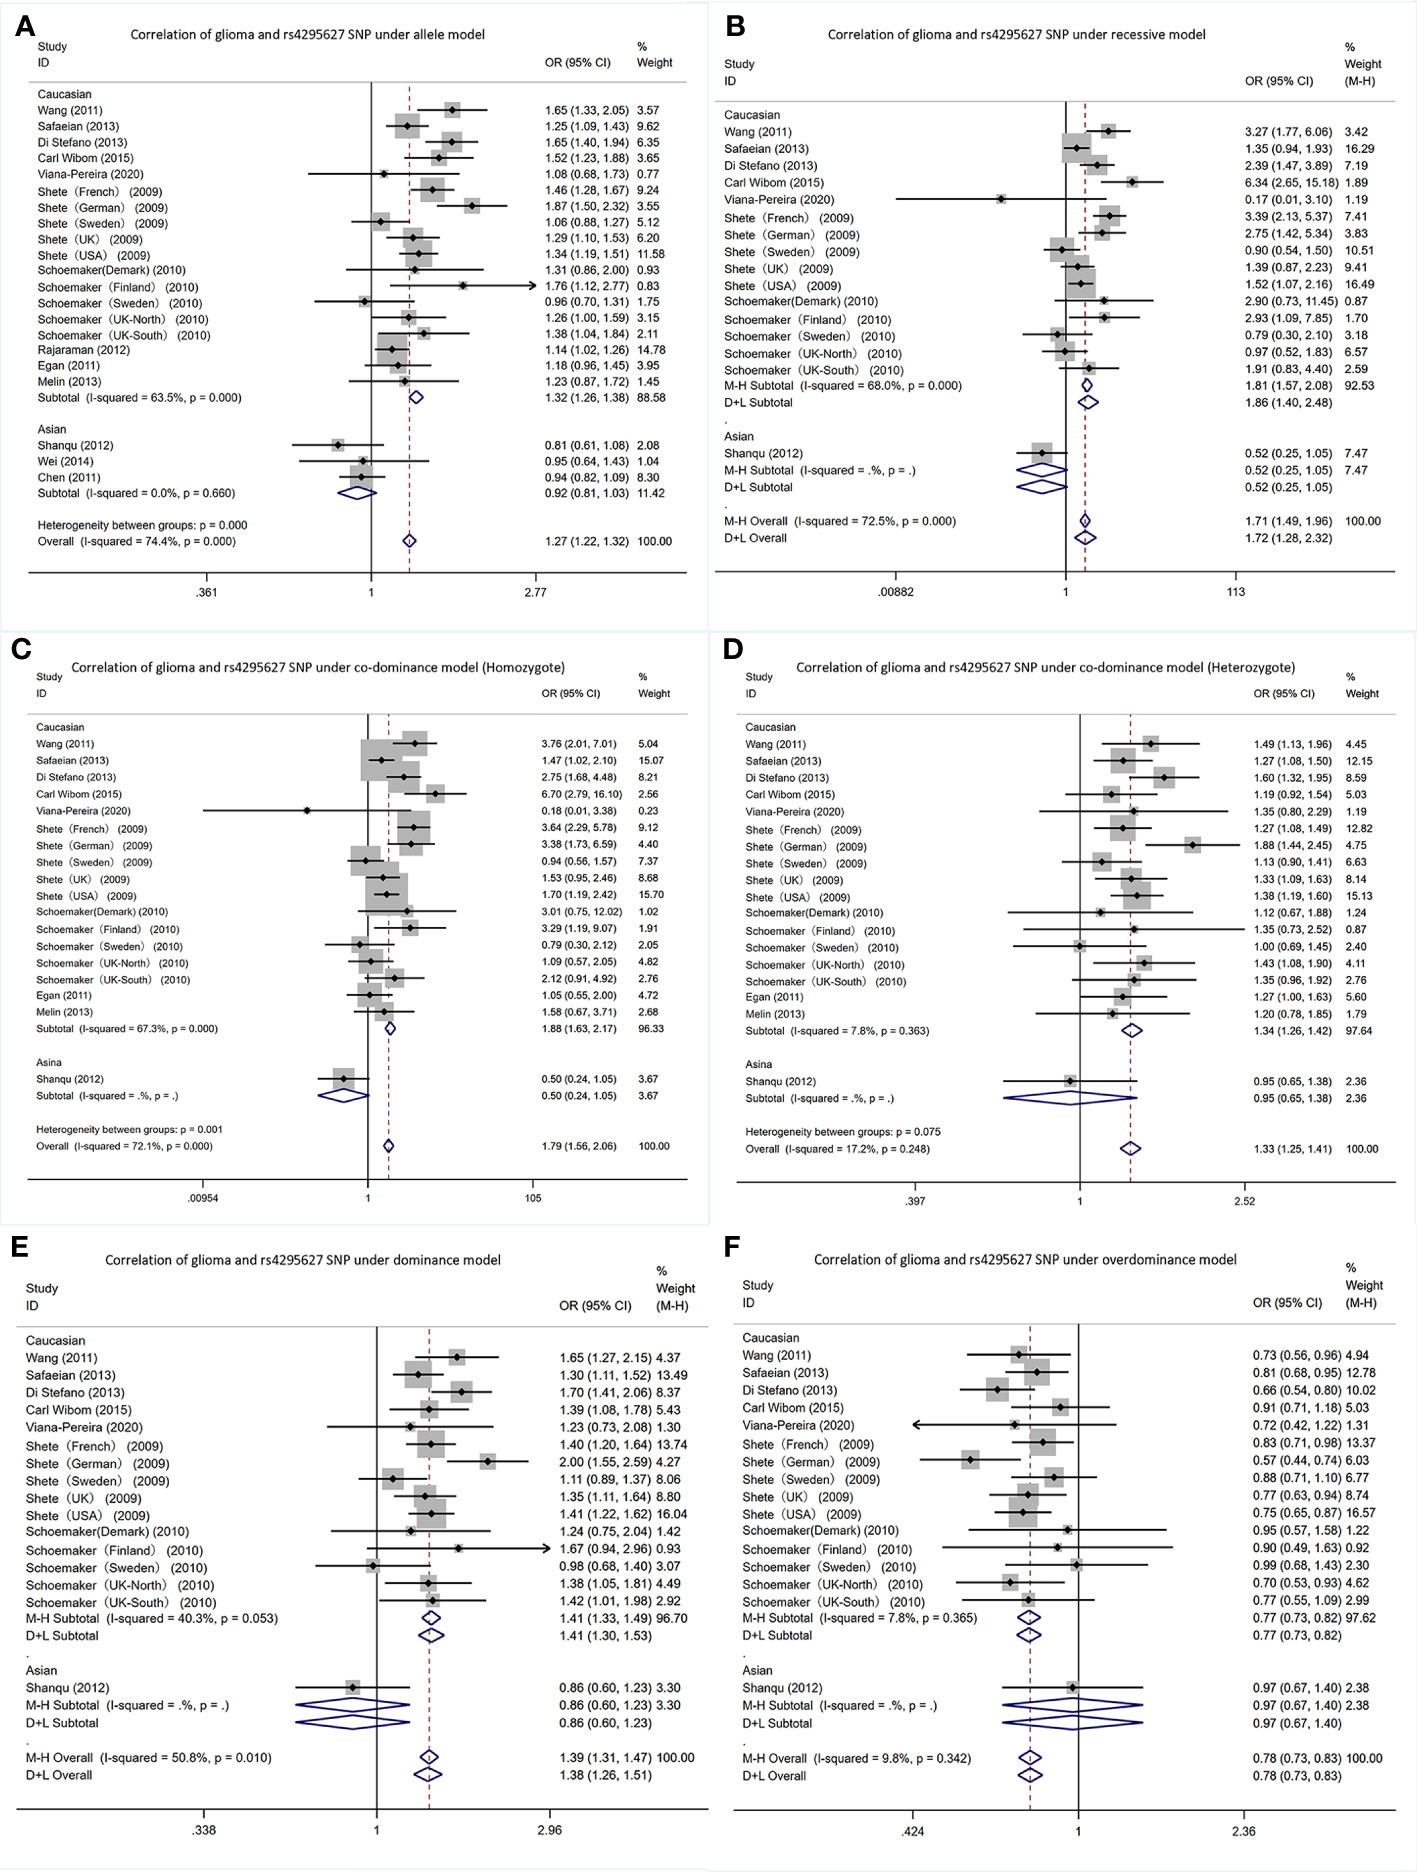
Figure 3 Forest plots of meta-analyses for correlation of glioma and rs4295627 SNP under all models. (A) allele model; (B) recessive model; (C) co-dominant model (Homozygote); (D) co-dominant model (Heterozygote); (E) dominant model; (F). over-dominant model.
In Asians, in the Shanqu, Wei and Chen AM (G vs T): OR=0.92, 95% CI: 0.81 to 1.03. In one study, the RM (GG vs TT+TG): 0.52; 0.25~1.05; DM (TG+GG vs TT): 0.86; 0.60 to 1.23; C-DM (GG vs TT): 0.50; 0.24 to 1.05; C-DM (GT vs TT): 0.95; 0.65 to 1.38; O-DM (TT + GG vs TG): 0.97; 0.67 to 1.40.
3.2.3 rs4977745
In the CDKN2A/B gene rs4977756 polymorphism, allele T was the risk gene (Figure 4). Among Caucasians, according to the meta-analysis results: AM (G vs A): OR=1.26, 95% CI: 1.22 to 1.31; RM (GG vs AA+AG): 1.32; 1.15 to 1.51; DM (AG+GG vs AA): 1.44; 1.29 to 1.60; C-DM (GG vs AA): 1.56; 1.43 to 1.70; C-DM (GA vs AA): 1.35; 1.27 to 1.45; O-DM (AA+GG vs AG): 0.95; 0.89 to 1.01.
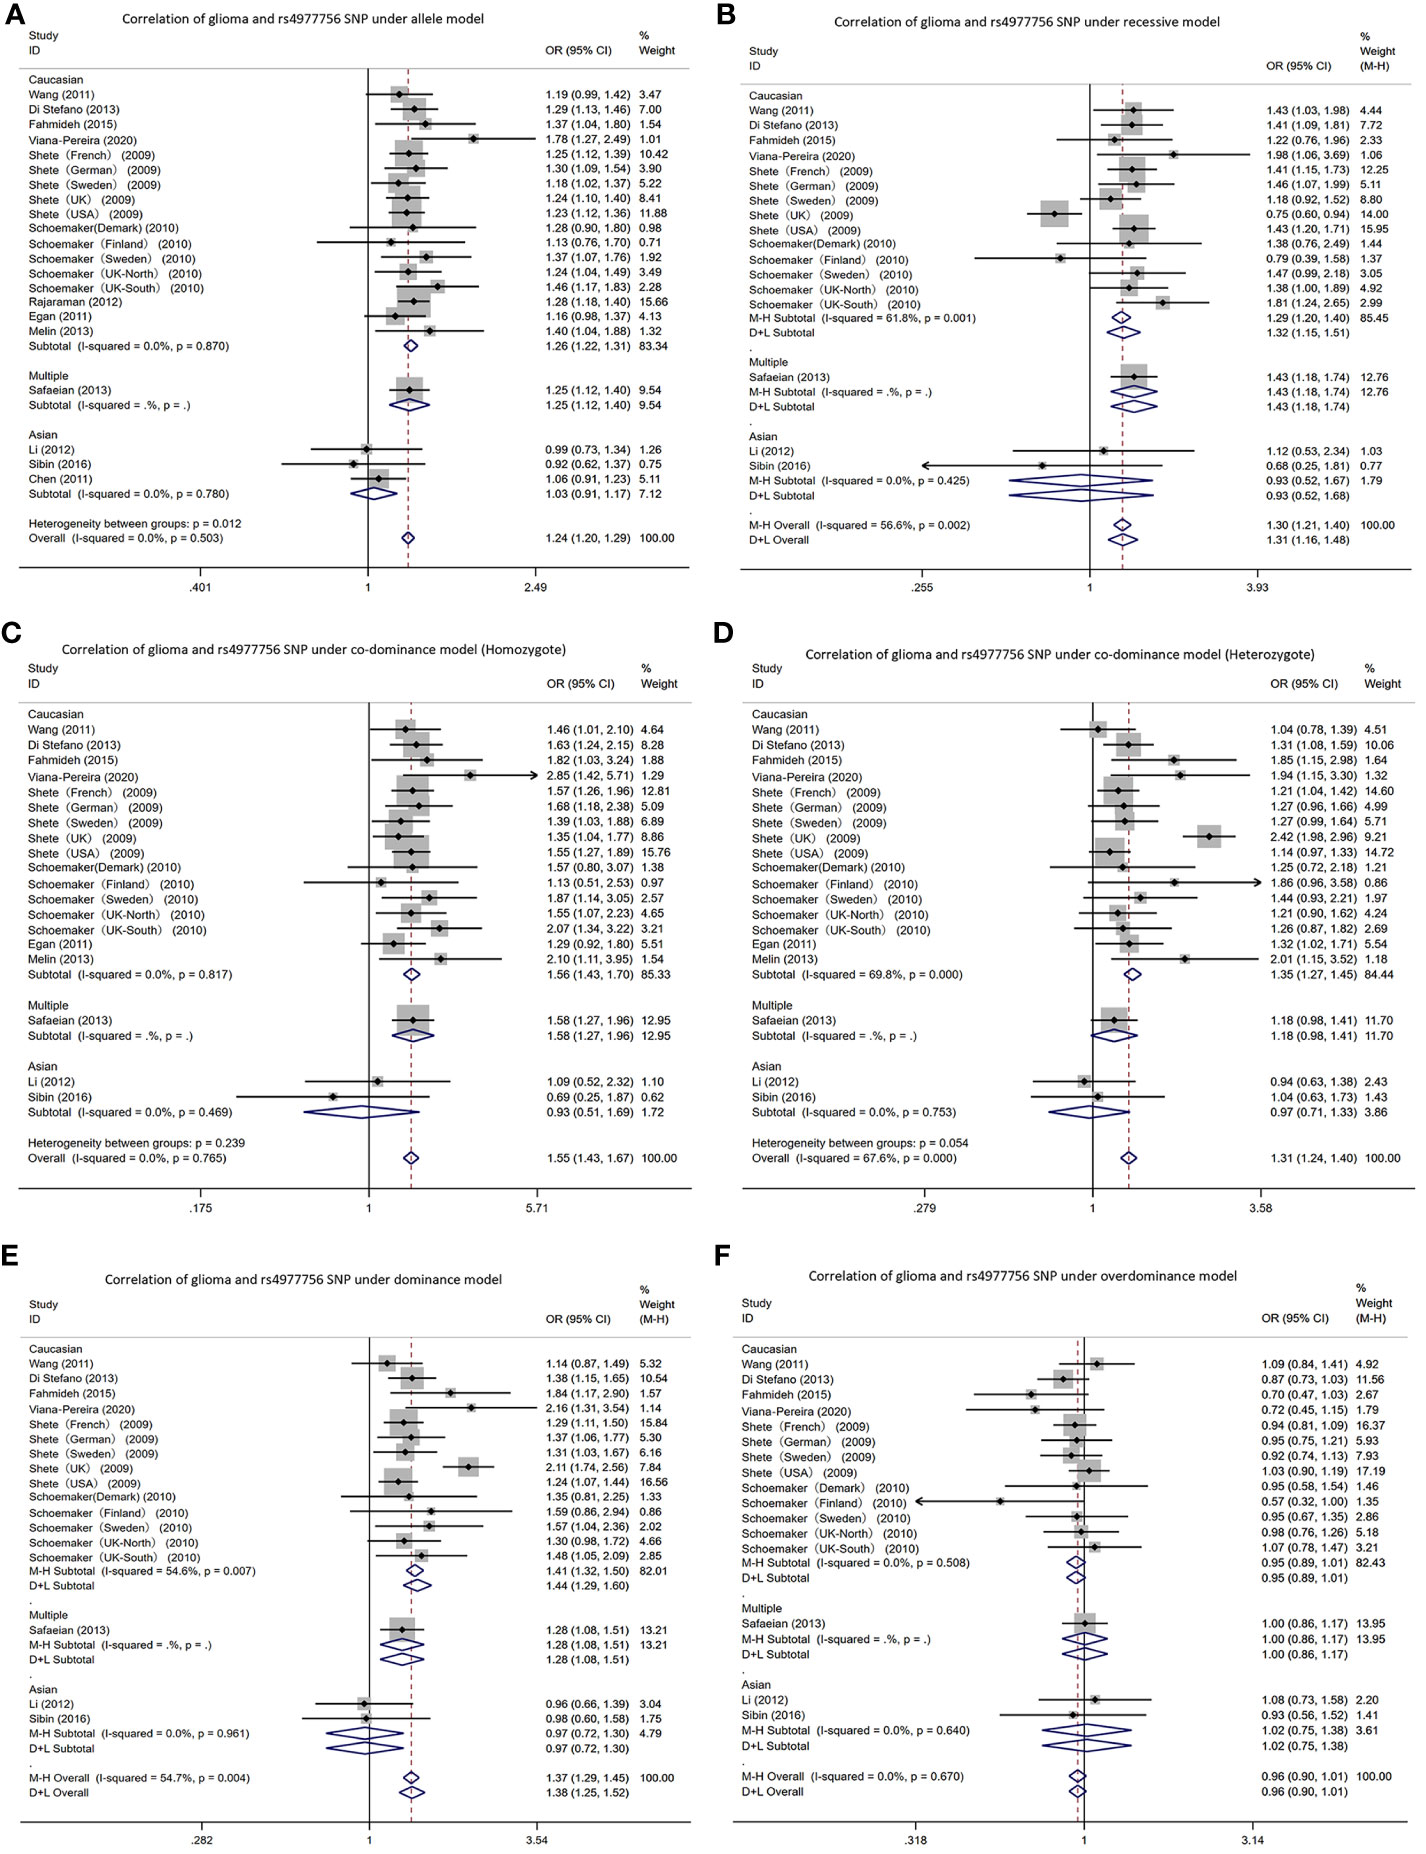
Figure 4 Forest plots of meta-analyses for correlation of glioma and rs4977756 SNP under all models. (A) allele model; (B) recessive model; (C) co-dominant model (Homozygote); (D) co-dominant model (Heterozygote); (E) dominant model; (F) over-dominant model.
In Asians, in the Li, Sibin and Chen AM (G vs A): OR=1.03, 95% CI: 0.91 to 1.17. In one study, the RM (GG vs AA+AG): 1.12; 0.53 to 2.34; DM (AG+GG vs AA): 0.96; 0.66 to 1.39; C-DM (GG vs AA): 1.09; 0.52 to 2.32; C-DM (GA vs AA): 0.94; 0.63 to 1.38; O-DM (AA+GG vs AG): 1.08; 0.73 to 1.58. In other study, RM (GG vs AA+AG): 0.68; 0.25 to 1.81; DM (AG+GG vs AA): 0.98; 0.60 to 1.58; C-DM (GG vs AA): 0.69; 0.25 to 1.87; C-DM (GA vs AA): 1.04; 0.63 to 1.73; O-DM (AA+GG vs AG): 0.93; 0.56 to 1.52.
3.2.4 rs6010620
In the RTEL1 gene rs6010620 polymorphism, allele T was the risk gene (Figure 5). Among Caucasians, according to the meta-analysis: AM (G vs A): OR=1.34, 95% CI: 1.28 to 1.39; RM (GG vs AA+AG): 1.34; 1.27 to 1.41; DM (AG+GG vs AA): 1.65; 1.44 to 1.89; C-DM (GG vs AA): 1.78; 1.56 to 2.03; C-DM (GA vs AA): 1.30; 1.15 to 1.46; O-DM (AA+GG vs AG): 1.24; 1.17 to 1.31.
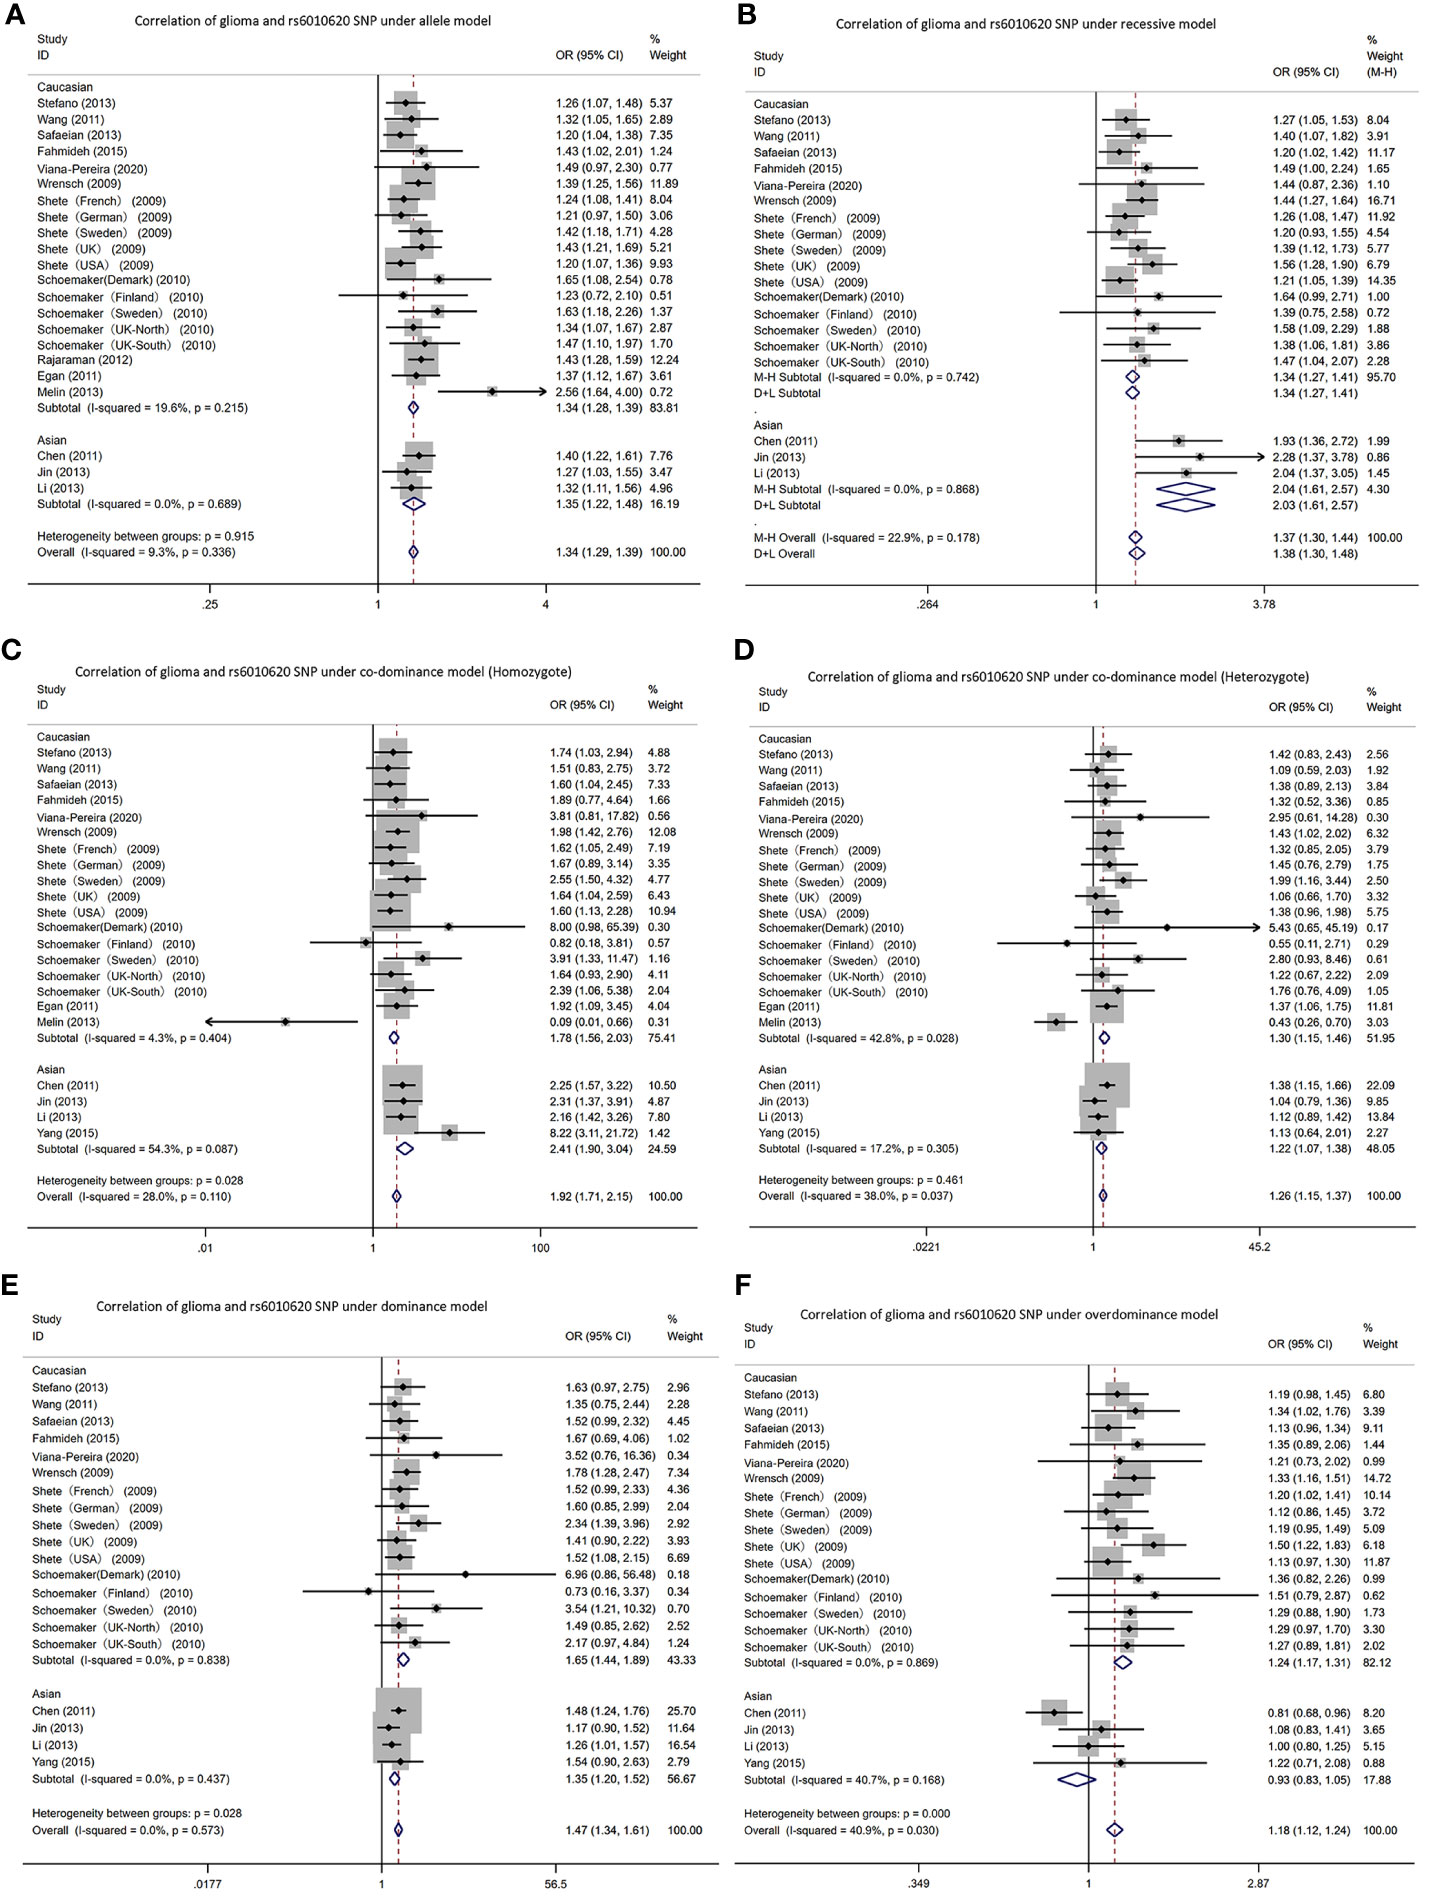
Figure 5 Forest plots of meta-analyses for correlation of glioma and rs6010620 SNP under all models. (A) allele model; (B) recessive model; (C) co-dominant model (Homozygote); (D) co-dominant model (Heterozygote); (E) dominant model; (F). over-dominant model.
In Asians, based on the meta-analysis results: AM (G vs A): OR=1.35, 95% CI: 1.22 to 1.48; RM (GG vs AA+AG): 2.04; 1.61 to 2.57; DM (AG+GG vs AA): 1.35; 1.20 to 1.52; C-DM (GG vs AA): 2.41; 1.09 to 3.04; C-DM (GA vs AA): 1.22; 1.07 to 1.38; O-DM (AA+GG vs AG): 0.93; 0.83 to 1.05.
3.3 Publication bias
Our study adopted Egger’s Test for evaluating the literature publication bias and the results are shown in Table 4. P > 0.05 indicates that publication bias did not exist.
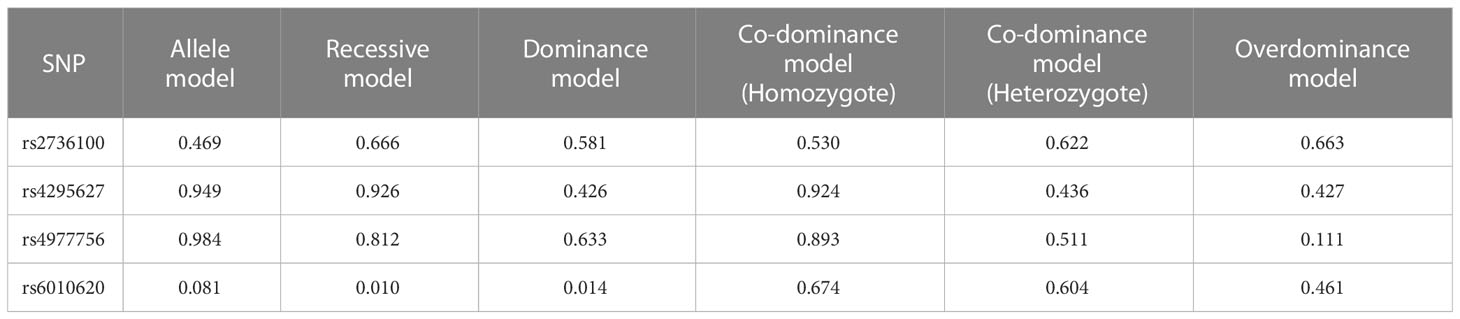
Table 4 Publication bias results of glioma SNPs under five genetic models.
In rs2376100, there was publication bias in AM (p=0.469). In rs4295627, publication bias existed in dominant, co-dominant and O-DM (DM (TG+GG vs TT): p=0.426; C-DM (GT vs TT): p=0.436; O-DM (TT+GG vs TG): p=0.427). In rs4977756, publication bias existed in O-DM (p=0.111). In rs6010620, publication bias existed in the recessive, dominant and O-DM (RM (GG vs AA+AG): p=0.010; DM (AG+GG vs AA): p=0.014; O-DM (AA+GG vs AG): p= 0.461).
4 Discussion
Our study is one of the first ones with conducting the first meta-analysis with the largest sample size as far as we concern and we performed detailed analyses of multiple associated SNPs under five genetic models. Besides, stratified analyses were carried out considering ethnicity. This indicates reliable meta-analysis results.
From the meta-analysis, allele G in the SNP at the rs2736100 locus differentially elevated glioma risk, which conforms to studies by Di Stefano (24). In particular, in the C-DM (GG vs TT), it elevated the risk by 69% (95% CI: 1.56 to 1.82). However, in the O-DM (TT+GG vs TG), the risk of glioma was reduced by 7% (95% CI: 0.88 to 0.98). We obtained basically identical results in Caucasians after stratification by ethnicity. Nevertheless, in the Asian O-DM, the risk of glioma was not associated with the SNP of the gene. Nevertheless, there is only one study on Asian populations and it is necessary to cautiously interpret the obtained results. Caucasians and Asians showed significant differences in the SNPs at the rs4295627 locus versus the rs4977756 locus. In the allele, recessive, dominant and C-DMs, all increased the risk of glioma. But in Asian populations, SNPs at both loci did not present relevance to glioma risk. This suggests the existence of significant racial differences. However, the amount of research literature on Asian populations is too small and further studies are needed to verify this conclusion. Among the SNPs at the rs6010620 locus, according to analysis of all five models, allele G elevated the risk, with the C-DM (GG vs AA) increasing the risk by 92% (95% CI: 1.71 to 2.15). However, in Chen’s study, the risk of glioma was reduced by 19% (95% CI: 0.68 to 0.96) in the O-DM, which was possibly because the sample size in Chen’s study was small (19).
Telomere refers to a small fragment of DNA-protein complex located at the end of eukaryotic chromosome, consisting of a six-base repeat sequence -TTAGGG- and binding proteins, which have important roles in localizing, replicating and protecting chromosome and controlling cell growth, and exert a close relevance to apoptosis, transformation and immortalization of cells. Telomere shortening may also increase susceptibility to cancer (37). TERT is the most important component in regulating telomerase activity. A few scholars found the relevance of TERT expression to glioma grade and patients’ prognosis (38). Located in intron 2 in TERT, the SNP can impact the telomerase activity or clearly relates to a functional variant in TERT (39). In the study by Codd, people who possessed TT genotype (hTERT rs2736100 T > G) presented shorter telomeres relative to people who possessed TG genotype (40). Oppositely, a larger number of cell divisions may be supported at long telomeres, which makes it easier to achieve abnormalities and thereby contributes to the development of cancers (41). However, in our study, in the SNP of TERT rs2736100, allele G increases the risk of developing glioma. This implicates that telomere length possibly plays a double-edged role in cancer development. In 2019, Yuan conducted a detailed review of TERT mutation-related cancers, with the highest frequency of TERT mutation reaching 80% in glioma, and more than a dozen tumors such as hepatocellular carcinoma, thyroid cancer, and skin melanoma are also closely related to this gene mutation (42). Hence, it is necessary to conduct deep investigations on relevant function mechanisms in order to better treat clinical patients.
CCDC26 can be found on chromosome 8q24.21, and the rs4295627 single nucleotide polymorphism can only be found in the intron 3 region regarding the CCDC26 gene, where a G-T base mutation can increase glioma disease risk (31). This is consistent with the meta-analysis in the study. The explanation can be attributed to that retinoic acid phosphorylates cAMP response element binding proteins for the induction of caspase 8 transcription and downregulates the telomerase activity for enhancing the apoptosis in neuroblastoma and glioblastoma cells under death stimuli (43). In addition, clinical studies employ CCDC26 to predict glioma patients’ diagnosis and prognosis (22). Jenkins found that CCDC26 variants could remarkably elevate the risk of low-grade gliomas that underwent IDH1 or IDH2 mutations, suggesting the interaction between CCDC26 and IDH mutations and/or the downstream effects regarding above mutations for promoting glioma development (44). Wang studies showed that lncRNA CCDC26 silencing inhibits glioma cell growth and migration by targeting miR-203. It revealed the regulatory mechanism of CCDC26/miR-203 pathway in glioma pathogenesis and provided a new target for glioma treatment (45). In addition to gliomas, Homer-Bouthiette found that deletion of the gene reduced breast cancer incidence in a mouse model of breast cancer (46). This chromosomal region has also been studied in prostate, bladder and rectal cancers (47–50).
CDKN2A/B is a representative altered genes in human cancers, and expression deletion facilitates malignant behavior by dysregulating cell cycle and promoting cell proliferation (51). CDKN2A/B is localized at 9p21, encoding p14, p16 (CDKN2A) and p15 (CDKN2B) oncoproteins which play multiple roles in cellular stress recognition, senescence regulation, differentiation as well as apoptosis in the developmental and proliferative phases of cells (51, 52). As reported, an unknown antisense lncRNA is encoded at human CDKN2A/B locus at 9p21.3, i.e. ANRIL, which crucially impacts disease development. The rs4977756’s 59 kb telomere is also mapped to CDKN2B in the 122 kb region regarding LD 9p21.3. Based on the meta-analysis, the G allele elevates the glioma risk. It is suspected that this SNP alters the expression level of ANRIL and thus affects cell proliferation, apoptosis and metastasis to promote tumorigenesis (53). Interestingly, type 2 diabetes and cardiovascular disease also appear to be linked to this gene (54, 55).
RTEL1 is involved in deoxyribonucleic acid repair, regulation of replication and transcription, and maintenance of telomere length. RTEL1 can both promote and suppress tumorigenesis. RTEL1 SNPs associated with gliomas are mainly found in the non-coding (intron) regions of genes. Intron SNPs possibly facilitate aberrant exon inclusion or deletion by altering mRNA splicing and the formation and addition regarding nonsense transcripts (56, 57). The RTEL1 gene rs6010620 on 20q13.33 is a vital candidate genetic variant that has been widely reported (58). As reported by previous studies, mutations in the rs6010620 gene may cause gliomas, but these findings have not been confirmed. According to meta-analysis, in the five genetic models, rs6010620 increased glioma susceptibility, most significantly in the C-DM (GG vs AA), which increased the susceptibility by 92% (OR: 1.92; CI (1.71, 2.15). Also, miR-4530 underwent downregulation in glioma tissues as well as cell lines, and overexpression inhibited malignant biological behaviors like glioma cell migration, proliferation, invasion and colony formation. RTEL1 was a direct target of miR-4530. The abnormal expression of RTEL1 could lead to obvious reversion of the miR-4530 overexpression in glioma cell lines. The miR-4530/RTEL1 axis acts as a latent treating target specific to gliomas (59). Not only glioma, but also mutated RTEL1 has been linked to the development of astrocytoma and Hoyeraal-Hreidarsson syndrome (60). Although recent in-depth studies have confirmed that RTEL1 can maintain genomic stability by studying its ability to maintain telomere homeostasis and promote DNA replication, there are still a lot of questions that shall be highlighted. Nowadays, researches have not confirmed the regulation of RTEL1 and its recruitment to impact the replication forks and telomeres (60).
Studying the association between the risk of glioma and SNPs is definitive, because it could help clinicians use such polymorphisms as pragmatic molecular biomarkers of glioma risk, assist drug developers innovate relevant targeted therapeutic agents for the benefit of patients, and allow for basic researchers to explore the molecular mechanisms of glioma pathogenesis and accurately regulate glioma progression. According to meta-analysis results, racial differences exist in the risk of glioma, but there is a paucity of studies on Asian ethnicity, which requires researchers to conduct relevant studies. Exploration of SNPs at other loci and risk of glioma is also necessary.
5 Limitations
Some limitations should be noted when interpreting the current results. The study also presents some limitations, which shall be noted during the interpretation of current studies.
First, there were scarce studies on Asian populations. Studies on results in Asian populations should be interpreted with caution.
In addition, the absence of more specific individual information about interaction within genes and that between gene and environment prohibited us from conducting a more precise analysis.
Finally, some unavoidable publication bias in the results of meta-analysis should also be taken into account.
6 Conclusion
In summary, our study suggested that the TERT gene rs2736100 polymorphism, CCDC26 gene rs4295627 polymorphism, CDKN2A/B gene rs4977756 polymorphism and RTEL1 gene rs6010620 polymorphism might all increase the risk of glioma development, but there are ethnic differences. It is necessary to well develop case-control studies with large sample sizes and a focus on more races or glioma types to overcome the limitations described earlier to make the conclusions more accurate.
Author contributions
All authors contributed to the article and approved the submitted version. YQW: Writing articles, searching literature and extracting literature. JZho and ZT: Analyzing the quality of articles. JZha: Analyzing Data. XC: Providing methodology. SL: Editing of articles.
Funding
This work was supported by the National Natural Science Foundation of China (grant number 81901895 to SL).
Acknowledgments
The paper is completed with the support of NSFC (grant No. 81901895). The authors are grateful to YuW for his help with the preparation of figures in this paper.
Conflict of interest
Author LH was employed by ICON Plc.
The remaining authors declare the research was conducted in the absence of any commercial or financial relationships that could be construed as a potential conflict of interest.
Publisher’s note
All claims expressed in this article are solely those of the authors and do not necessarily represent those of their affiliated organizations, or those of the publisher, the editors and the reviewers. Any product that may be evaluated in this article, or claim that may be made by its manufacturer, is not guaranteed or endorsed by the publisher.
Supplementary material
The Supplementary Material for this article can be found online at: https://www.frontiersin.org/articles/10.3389/fonc.2023.1180099/full#supplementary-material
References
1. Kohler BA, Ward E, McCarthy BJ, Schymura MJ, Ries LA, Eheman C, et al. Annual report to the nation on the status of cancer 1975-2007, featuring tumors of the brain and other nervous system. J Natl Cancer Inst (2011) 103:714–36. doi: 10.1093/jnci/djr077
2. Louis DN, Perry A, Reifenberger G, von Deimling A, Figarella-Branger D, Cavenee WK, et al. The 2016 World Health Organization classification of tumors of the central nervous system: a summary. Acta Neuropathol (2016) 131:803–20. doi: 10.1007/s00401-016-1545-1
3. Louis DN, Perry A, Wesseling P, Brat DJ, Cree IA, Figarella-Branger D, et al. The 2021 WHO classification of tumors of the central nervous system: a summary. Neuro Oncol (2021) 23:1231–51. doi: 10.1093/neuonc/noab106
4. Bell EH, Zhang P, Fisher BJ, Macdonald DR, McElroy JP, Lesser GJ, et al. Association of MGMT promoter methylation status with survival outcomes in patients with high-risk glioma treated with radiotherapy and temozolomide: an analysis from the NRG oncology/RTOG 0424 trial. JAMA Oncol (2018) 4:1405–9. doi: 10.1001/jamaoncol.2018.1977
5. Cloughesy TF, Mochizuki AY, Orpilla JR, Hugo W, Lee AH, Davidson TB, et al. Neoadjuvant anti-PD-1 immunotherapy promotes a survival benefit with intratumoral and systemic immune responses in recurrent glioblastoma. Nat Med (2019) 25:477–86. doi: 10.1038/s41591-018-0337-7
6. Herrlinger U, Tzaridis T, Mack F, Steinbach JP, Schlegel U, Sabel M, et al. Lomustine-temozolomide combination therapy versus standard temozolomide therapy in patients with newly diagnosed glioblastoma with methylated MGMT promoter (CeTeG/NOA-09): a randomised, open-label, phase 3 trial. Lancet (2019) 393:678–88. doi: 10.1016/S0140-6736(18)31791-4
7. Molinaro AM, Hervey-Jumper S, Morshed RA, Young J, Han SJ, Chunduru P, et al. Association of maximal extent of resection of contrast-enhanced and non-contrast-enhanced tumor with survival within molecular subgroups of patients with newly diagnosed glioblastoma. JAMA Oncol (2020) 6:495–503. doi: 10.1001/jamaoncol.2019.6143
8. Platten M, Bunse L, Wick A, Bunse T, Le Cornet L, Harting I, et al. A vaccine targeting mutant IDH1 in newly diagnosed glioma. Nature (2021) 592:463–8. doi: 10.1038/s41586-021-03363-z
9. Van Meir EG, Hadjipanayis CG, Norden AD, Shu HK, Wen PY, Olson JJ. Exciting new advances in neuro-oncology: the avenue to a cure for Malignant glioma. CA Cancer J Clin (2010) 60:166–93. doi: 10.3322/caac.20069
10. Shete S, Hosking FJ, Robertson LB, Dobbins SE, Sanson M, Malmer B, et al. Genome-wide association study identifies five susceptibility loci for glioma. Nat Genet (2009) 41:899–904. doi: 10.1038/ng.407
11. Braganza MZ, Kitahara CM, Berrington de Gonzalez A, Inskip PD, Johnson KJ, Rajaraman P. Ionizing radiation and the risk of brain and central nervous system tumors: a systematic review. Neuro-oncology (2012) 14:1316–24. doi: 10.1093/neuonc/nos208
12. Grochans S, Cybulska AM, Siminska D, Korbecki J, Kojder K, Chlubek D, et al. Epidemiology of glioblastoma multiforme-literature review. Cancers (Basel) (2022) 14:P13–21. doi: 10.3390/cancers14102412
13. Visscher PM, Brown MA, McCarthy MI, Yang J. Five years of GWAS discovery. Am J Hum Genet (2012) 90:7–24. doi: 10.1016/j.ajhg.2011.11.029
14. Buniello A, MacArthur JAL, Cerezo M, Harris LW, Hayhurst J, Malangone C, et al. The NHGRI-EBI GWAS Catalog of published genome-wide association studies, targeted arrays and summary statistics 2019. Nucleic Acids Res (2019) 47:D1005–12. doi: 10.1093/nar/gky1120
15. Calado RT, Chen JC. Telomerase: not just for the elongation of telomeres. Bioessays (2006) 28:109–12. doi: 10.1002/bies.20365
16. Barber LJ, Youds JL, Ward JD, McIlwraith MJ, O’Neil NJ, Petalcorin MI, et al. RTEL1 maintains genomic stability by suppressing homologous recombination. Cell (2008) 135:261–71. doi: 10.1016/j.cell.2008.08.016
17. Wrensch M, Jenkins RB, Chang JS, Yeh RF, Xiao Y, Decker PA, et al. Variants in the CDKN2B and RTEL1 regions are associated with high-grade glioma susceptibility. Nat Genet (2009) 41:905–8. doi: 10.1038/ng.408
18. Schoemaker MJ, Robertson L, Wigertz A, Jones ME, Hosking FJ, Feychting M, et al. Interaction between 5 genetic variants and allergy in glioma risk. Am J Epidemiol (2010) 171:1165–73. doi: 10.1093/aje/kwq075
19. Chen H, Chen Y, Zhao Y, Fan W, Zhou K, Liu Y, et al. Association of sequence variants on chromosomes 20, 11, and 5 (20q13.33, 11q23.3, and 5p15.33) with glioma susceptibility in a Chinese population. Am J Epidemiol (2011) 173:915–22. doi: 10.1093/aje/kwq457
20. Egan KM, Thompson RC, Nabors LB, Olson JJ, Brat DJ, Larocca RV, et al. Cancer susceptibility variants and the risk of adult glioma in a US case-control study. J Neurooncol (2011) 104:535–42. doi: 10.1007/s11060-010-0506-0
21. Wang SS, Hartge P, Yeager M, Carreón T, Ruder AM, Linet M, et al. Joint associations between genetic variants and reproductive factors in glioma risk among women. Am J Epidemiol (2011) 174:901–8. doi: 10.1093/aje/kwr184
22. Li S, Jin T, Zhang J, Lou H, Yang B, Li Y, et al. Polymorphisms of TREH, IL4R and CCDC26 genes associated with risk of glioma. Cancer Epidemiol (2012) 36:283–7. doi: 10.1016/j.canep.2011.12.011
23. Rajaraman P, Melin BS, Wang Z, McKean-Cowdin R, Michaud DS, Wang SS, et al. Genome-wide association study of glioma and meta-analysis. Hum Genet (2012) 131:1877–88. doi: 10.1007/s00439-012-1212-0
24. Di Stefano AL, Enciso-Mora V, Marie Y, Desestret V, Labussière M, Boisselier B, et al. Association between glioma susceptibility loci and tumour pathology defines specific molecular etiologies. Neuro Oncol (2013) 15:542–7. doi: 10.1093/neuonc/nos284
25. Jin TB, Zhang JY, Li G, Du SL, Geng TT, Gao J, et al. RTEL1 and TERT polymorphisms are associated with astrocytoma risk in the Chinese Han population. Tumour Biol (2013) 34:3659–66. doi: 10.1007/s13277-013-0947-0
26. Li G, Jin T, Liang H, Zhang Z, He S, Tu Y, et al. RTEL1 tagging SNPs and haplotypes were associated with glioma development. Diagn Pathol (2013) 8:83. doi: 10.1186/1746-1596-8-83
27. Melin B, Dahlin AM, Andersson U, Wang Z, Henriksson R, Hallmans G, et al. Known glioma risk loci are associated with glioma with a family history of brain tumours – a case-control gene association study. Int J Cancer (2013) 132:2464–8. doi: 10.1002/ijc.27922
28. Safaeian M, Rajaraman P, Hartge P, Yeager M, Linet M, Butler MA, et al. Joint effects between five identified risk variants, allergy, and autoimmune conditions on glioma risk. Cancer Causes Control (2013) 24:1885–91. doi: 10.1007/s10552-013-0244-7
29. Wei XB, Jin TB, Li G, Geng TT, Zhang JY, Chen CP, et al. CCDC26 gene polymorphism and glioblastoma risk in the Han Chinese population. Asian Pac J Cancer Prev (2014) 15:3629–33. doi: 10.7314/apjcp.2014.15.8.3629
30. Adel Fahmideh M, Lavebratt C, Schuz J, Roosli M, Tynes T, Grotzer MA, et al. CCDC26, CDKN2BAS, RTEL1 and TERT Polymorphisms in pediatric brain tumor susceptibility. Carcinogenesis (2015) 36:876–82. doi: 10.1093/carcin/bgv074
31. Wibom C, Spath F, Dahlin AM, Langseth H, Hovig E, Rajaraman P, et al. Investigation of established genetic risk variants for glioma in prediagnostic samples from a population-based nested case-control study. Cancer Epidemiol Biomarkers Prev (2015) 24:810–6. doi: 10.1158/1055-9965.EPI-14-1106
32. Yang B, Heng L, Du S, Yang H, Jin T, Lang H, et al. Association between RTEL1, PHLDB1, and TREH polymorphisms and glioblastoma risk: A case-control study. Med Sci Monit (2015) 21:1983–8. doi: 10.12659/MSM.893723
33. Sibin MK, Dhananjaya IB, Narasingarao KV, Harshitha SM, Jeru-Manoj M, Chetan GK. Two gene polymorphisms (rs4977756 and rs11515) in CDKN2A/B and glioma risk in South Indian population. Meta Gene (2016) 9:215–8. doi: 10.1016/j.mgene.2016.07.010
34. Melin BS, Barnholtz-Sloan JS, Wrensch MR, Johansen C, Il’yasova D, Kinnersley B, et al. Genome-wide association study of glioma subtypes identifies specific differences in genetic susceptibility to glioblastoma and non-glioblastoma tumors. Nat Genet (2017) 49:789–94. doi: 10.1038/ng.3823
35. Pandith AA, Wani ZA, Qasim I, Afroze D, Manzoor U, Amin I, et al. Association of strong risk of hTERT gene polymorphic variants to Malignant glioma and its prognostic implications with respect to different histological types and survival of glioma cases. J Gene Med (2020) 22:e3260. doi: 10.1002/jgm.3260
36. Viana-Pereira M, Moreno DA, Linhares P, Amorim J, Nabiço R, Costa S, et al. Replication of GWAS identifies RTEL1, CDKN2A/B, and PHLDB1 SNPs as risk factors in Portuguese gliomas patients. Mol Biol Rep (2020) 47:877–86. doi: 10.1007/s11033-019-05178-8
37. Amano H, Chaudhury A, Rodriguez-Aguayo C, Lu L, Akhanov V, Catic A, et al. Telomere dysfunction induces sirtuin repression that drives telomere-dependent disease. Cell Metab (2019) 29(6):1274–90.e9. doi: 10.1016/j.cmet.2019.03.001
38. Wang L, Wei Q, Wang LE, Aldape KD, Cao Y, Okcu MF, et al. Survival prediction in patients with glioblastoma multiforme by human telomerase genetic variation. J Clin Oncol (2006) 24:1627–32. doi: 10.1200/JCO.2005.04.0402
39. Landi MT, Chatterjee N, Yu K, Goldin LR, Goldstein AM, Rotunno M, et al. A genome-wide association study of lung cancer identifies a region of chromosome 5p15 associated with risk for adenocarcinoma. Am J Hum Genet (2009) 85:679–91. doi: 10.1016/j.ajhg.2009.09.012
40. Codd V, Nelson CP, Albrecht E, Mangino M, Deelen J, Buxton JL, et al. Identification of seven loci affecting mean telomere length and their association with disease. Nat Genet (2013) 45:422–7. doi: 10.1038/ng.2528. 427e421-422.
41. Cesare AJ, Reddel RR. Alternative lengthening of telomeres: models, mechanisms and implications. Nat Rev Genet (2010) 11:319–30. doi: 10.1038/nrg2763
42. Yuan X, Larsson C, Xu D. Mechanisms underlying the activation of TERT transcription and telomerase activity in human cancer: old actors and new players. Oncogene (2019) 38:6172–83. doi: 10.1038/s41388-019-0872-9
43. Jiang M, Zhu K, Grenet J, Lahti JM. Retinoic acid induces caspase-8 transcription via phospho-CREB and increases apoptotic responses to death stimuli in neuroblastoma cells. Biochim Biophys Acta (2008) 1783:1055–67. doi: 10.1016/j.bbamcr.2008.02.007
44. Jenkins RB, Xiao YY, Sicotte H, Decker PA, Kollmeyer TM, Hansen HM, et al. A low-frequency variant at 8q24.21 is strongly associated with risk of oligodendroglial tumors and astrocytomas with IDH1 or IDH2 mutation. Nat Genet (2012) 44:1122. doi: 10.1038/ng.2388
45. Wang S, Hui Y, Li X, Jia Q. Silencing of lncRNA CCDC26 Restrains the Growth and Migration of Glioma Cells in vitro and in vivo via Targeting miR-203. Oncol Res (2018) 26:1143–54. doi: 10.3727/096504017X14965095236521
46. Homer-Bouthiette C, Zhao Y, Shunkwiler LB, Van Peel B, Garrett-Mayer E, Baird RC, et al. Deletion of the murine ortholog of the 8q24 gene desert has anti-cancer effects in transgenic mammary cancer models. BMC Cancer (2018) 18:1233. doi: 10.1186/s12885-018-5109-8
47. Tomlinson I, Webb E, Carvajal-Carmona L, Broderick P, Kemp Z, Spain S, et al. A genome-wide association scan of tag SNPs identifies a susceptibility variant for colorectal cancer at 8q24.21. Nat Genet (2007) 39:984–8. doi: 10.1038/ng2085
48. Yeager M, Orr N, Hayes RB, Jacobs KB, Kraft P, Wacholder S, et al. Genome-wide association study of prostate cancer identifies a second risk locus at 8q24. Nat Genet (2007) 39:645–9. doi: 10.1038/ng2022
49. Kiemeney LA, Thorlacius S, Sulem P, Geller F, Aben KK, Stacey SN, et al. Sequence variant on 8q24 confers susceptibility to urinary bladder cancer. Nat Genet (2008) 40:1307–12. doi: 10.1038/ng.229
50. Chen Y, Xie H, Gao Q, Zhan H, Xiao H, Zou Y, et al. Colon cancer associated transcripts in human cancers. BioMed Pharmacother (2017) 94:531–40. doi: 10.1016/j.biopha.2017.07.073
51. Sharpless NE. INK4a/ARF: a multifunctional tumor suppressor locus. Mutat Res (2005) 576:22–38. doi: 10.1016/j.mrfmmm.2004.08.021
52. Sherr CJ. The INK4a/ARF network in tumour suppression. Nat Rev Mol Cell Biol (2001) 2:731–7. doi: 10.1038/35096061
53. Yoshida. ANRIL is implicated in the regulation of nucleus and potential transcriptional target of E2F1. Oncol Rep (2010) 24. doi: 10.3892/or_00000910
54. Hannou SA, Wouters K, Paumelle R, Staels B. Functional genomics of the CDKN2A/B locus in cardiovascular and metabolic disease: what have we learned from GWASs? Trends Endocrinol Metab (2015) 26:176–84. doi: 10.1016/j.tem.2015.01.008
55. Kong Y, Sharma RB, Nwosu BU, Alonso LC. Islet biology, the CDKN2A/B locus and type 2 diabetes risk. Diabetologia (2016) 59:1579–93. doi: 10.1007/s00125-016-3967-7
56. Alonso CR, Akam M. A Hox gene mutation that triggers nonsense-mediated RNA decay and affects alternative splicing during Drosophila development. Nucleic Acids Res (2003) 31:3880. doi: 10.1093/nar/gkg482
57. Gallus GN, Cardaioli E, Rufa A, Da Pozzo P, Bianchi S, D’Eramo C, et al. Alu-element insertion in an OPA1 intron sequence associated with autosomal dominant optic atrophy. Mol Vis (2010) 16:178–83.
58. Wu Y, Tong X, Tang LL, Zhou K, Zhong CH, Jiang S. Associations between the rs6010620 polymorphism in RTEL1 and risk of glioma: a meta-analysis of 20,711 participants. Asian Pac J Cancer Prev (2014) 15:7163–7. doi: 10.7314/apjcp.2014.15.17.7163
59. Wang T, Zhang Y, Cui B, Wang M, Li Y, Gao K. miR-4530 inhibits the Malignant biological behaviors of human glioma cells by directly targeting RTEL1. Acta Biochim Biophys Sin (Shanghai) (2020) 52:1394–403. doi: 10.1093/abbs/gmaa126
Keywords: glioma, single nucleotide polymorphism, risk, meta-analysis, genetic model
Citation: Wu Y, Zhou J, Zhang J, Tang Z, Chen X, Huang L, Liu S, Chen H and Wang Y (2023) Pertinence of glioma and single nucleotide polymorphism of TERT, CCDC26, CDKN2A/B and RTEL1 genes in glioma: a meta-analysis. Front. Oncol. 13:1180099. doi: 10.3389/fonc.2023.1180099
Received: 13 March 2023; Accepted: 08 August 2023;
Published: 07 September 2023.
Edited by:
Parvin Mehdipour, Tehran University of Medical Sciences, IranReviewed by:
Ujjal Bhawal, Nihon University, JapanRakesh Kumar Sharma, University of Alabama at Birmingham, United States
Copyright © 2023 Wu, Zhou, Zhang, Tang, Chen, Huang, Liu, Chen and Wang. This is an open-access article distributed under the terms of the Creative Commons Attribution License (CC BY). The use, distribution or reproduction in other forums is permitted, provided the original author(s) and the copyright owner(s) are credited and that the original publication in this journal is cited, in accordance with accepted academic practice. No use, distribution or reproduction is permitted which does not comply with these terms.
*Correspondence: Hong Chen, OTk1NzMxMTI1QHFxLmNvbQ==; Yu Wang, MzMwNzIyNDc0QHFxLmNvbQ==