
95% of researchers rate our articles as excellent or good
Learn more about the work of our research integrity team to safeguard the quality of each article we publish.
Find out more
ORIGINAL RESEARCH article
Front. Oncol. , 29 August 2023
Sec. Radiation Oncology
Volume 13 - 2023 | https://doi.org/10.3389/fonc.2023.1175010
 Fen Liu1†Qingcheng Li1†Zhiqiang Xiang1Xiaofang Li2Fangting Li3Yingqiong Huang4Ye Zeng5
 Huashan Lin6
 Xiangjun Fang1*Qinglai Yang7*‡
Purpose: This study aimed to explore the efficacy of the computed tomography (CT) radiomics model for predicting the Ki-67 proliferation index (PI) of pure-solid non-small cell lung cancer (NSCLC).
Materials and methods: This retrospective study included pure-solid NSCLC patients from five centers. The radiomics features were extracted from thin-slice, non-enhanced CT images of the chest. The minimum redundancy maximum relevance (mRMR) and least absolute shrinkage and selection operator (LASSO) were used to reduce and select radiomics features. Logistic regression analysis was employed to build predictive models to determine Ki-67-high and Ki-67-low expression levels. Three prediction models were established: the clinical model, the radiomics model, and the nomogram model combining the radiomics signature and clinical features. The prediction efficiency of different models was evaluated using the area under the curve (AUC).
Results: A total of 211 NSCLC patients with pure-solid nodules or masses were included in the study (N=117 for the training cohort, N=49 for the internal validation cohort, and N=45 for the external validation cohort). The AUC values for the clinical models in the training, internal validation, and external validation cohorts were 0.73 (95% CI: 0.64–0.82), 0.75 (95% CI:0.62–0.89), and 0.72 (95% CI: 0.57–0.86), respectively. The radiomics models showed good predictive ability in diagnosing Ki-67 expression levels in the training cohort (AUC, 0.81 [95% CI: 0.73-0.89]), internal validation cohort (AUC, 0.81 [95% CI: 0.69-0.93]) and external validation cohort (AUC, 0.78 [95% CI: 0.64-0.91]). Compared to the clinical and radiomics models, the nomogram combining both radiomics signatures and clinical features had relatively better diagnostic performance in all three cohorts, with the AUC of 0.83 (95% CI: 0.76–0.90), 0.83 (95% CI: 0.71–0.94), and 0.81 (95% CI: 0.68–0.93), respectively.
Conclusion: The nomogram combining the radiomics signature and clinical features may be a potential non-invasive method for predicting Ki-67 expression levels in patients with pure-solid NSCLC.
Non-small cell lung cancer (NSCLC) is the most common pathological type of lung cancer, accounting for more than 85% of cases (1). On multi-slice spiral computed tomography (MSCT) images, early NSCLC may present as two subtypes: pure-solid or subsolid nodules (2). These two radiological subtypes of lung cancer may have different biological behaviors. NSCLC pure-solid nodules or masses usually exhibit more aggressive malignant behavior, while patients presenting with such radiological subtypes usually have a worse prognosis (3).
The treatment choice for NSCLC heavily relies on molecular biomarkers (4). Ki-67 PI is the most commonly used marker to assess the proliferation of tumor cells, and its expression closely correlates with tumor metastasis and poor prognosis (5). In lung cancer, expression levels of Ki-67 can indirectly indicate tumor invasion (1). According to a recent study, more than 90% of oncologists believe that lung cancer treatment might depend on Ki-67 expression (6).
Surgical and puncture biopsy samples are the gold standard for determining intratumoral Ki-67 expression levels. However, some tumors are inaccessible for biopsy collection, while certain patients cannot tolerate invasive examinations. Thus, finding a simple and non-invasive method that accurately predicts Ki-67 expression is an unmet clinical need.
Radiomics uses high-throughput technology to extract quantitative information from radiographic images, providing more clinically relevant information than traditional imaging analysis (7). Radiomics has demonstrated outstanding potential for lung cancer diagnosis, tumor classification, prognosis prediction, and tumor gene expression analysis (8–11). Ki-67 expression levels can also be predicted by radiomics, as shown in previous studies (8, 12–14). However, since pure-solid and subsolid NSCLC may have very different biological characteristics (3), the ability of radiomics to predict Ki-67 expression in pure-solid and subsolid NSCLC may also be different. To the best of our knowledge, few multicenter studies investigate whether radiomics can predict the expression level of Ki-67 in NSCLC of pure-solid nodules or masses. To address this knowledge gap, we performed a retrospective multicenter study to construct and validate a CT radiomics model for predicting Ki-67 expression in patients with pure-solid NSCLC.
This study was approved by the institutional ethics committee of the Second Affiliated Hospital, Hengyang Medical School, University of South China. A total of 211 patients who underwent surgical resection or puncture biopsy between January 2018 and June 2022 were enrolled from five centers (center 1:The Second Affiliated Hospital, Hengyang Medical School, University of South China; center 2:The First Affiliated Hospital, Hengyang Medical School, University of South China; center 3:The Affiliated Huaihua Hospital, Hengyang Medical School, University of South China; center 4: People’s Hospital of Zhengzhou; center 5:The Second Affiliated Hospital of Hainan Medical University).
The inclusion criteria were as follows: (1) Patients with NSCLC confirmed by puncture biopsy or surgical pathology with complete DICOM format CT thin-section images, Ki-67 test results, and clinicopathological data; (2) Puncture biopsy or surgical resection within one month after the thin-section CT examination; (3) The tumors presenting with pure-solid nodules or masses.
The exclusion criteria were as follows: (1) Unclear lesion boundary preventing accurate tumor outline; (2) Treatment or an invasive examination before CT examination; (3) Incomplete clinical data and/or pathological results; (4) Tumors contained ground-glass components; (5) History of other primary tumors unrelated to NSCLC.
A total of 211 patients were enrolled in this study, including 166 patients from Center 1 and 45 from Centers 2 to 5 (Figure 1). The patients with pure-solid nodules or masses from center 1 were randomly assigned to the training and internal validation cohorts at a 7:3 ratio; patients from centers 2 to 5 were assigned to an external validation cohort.
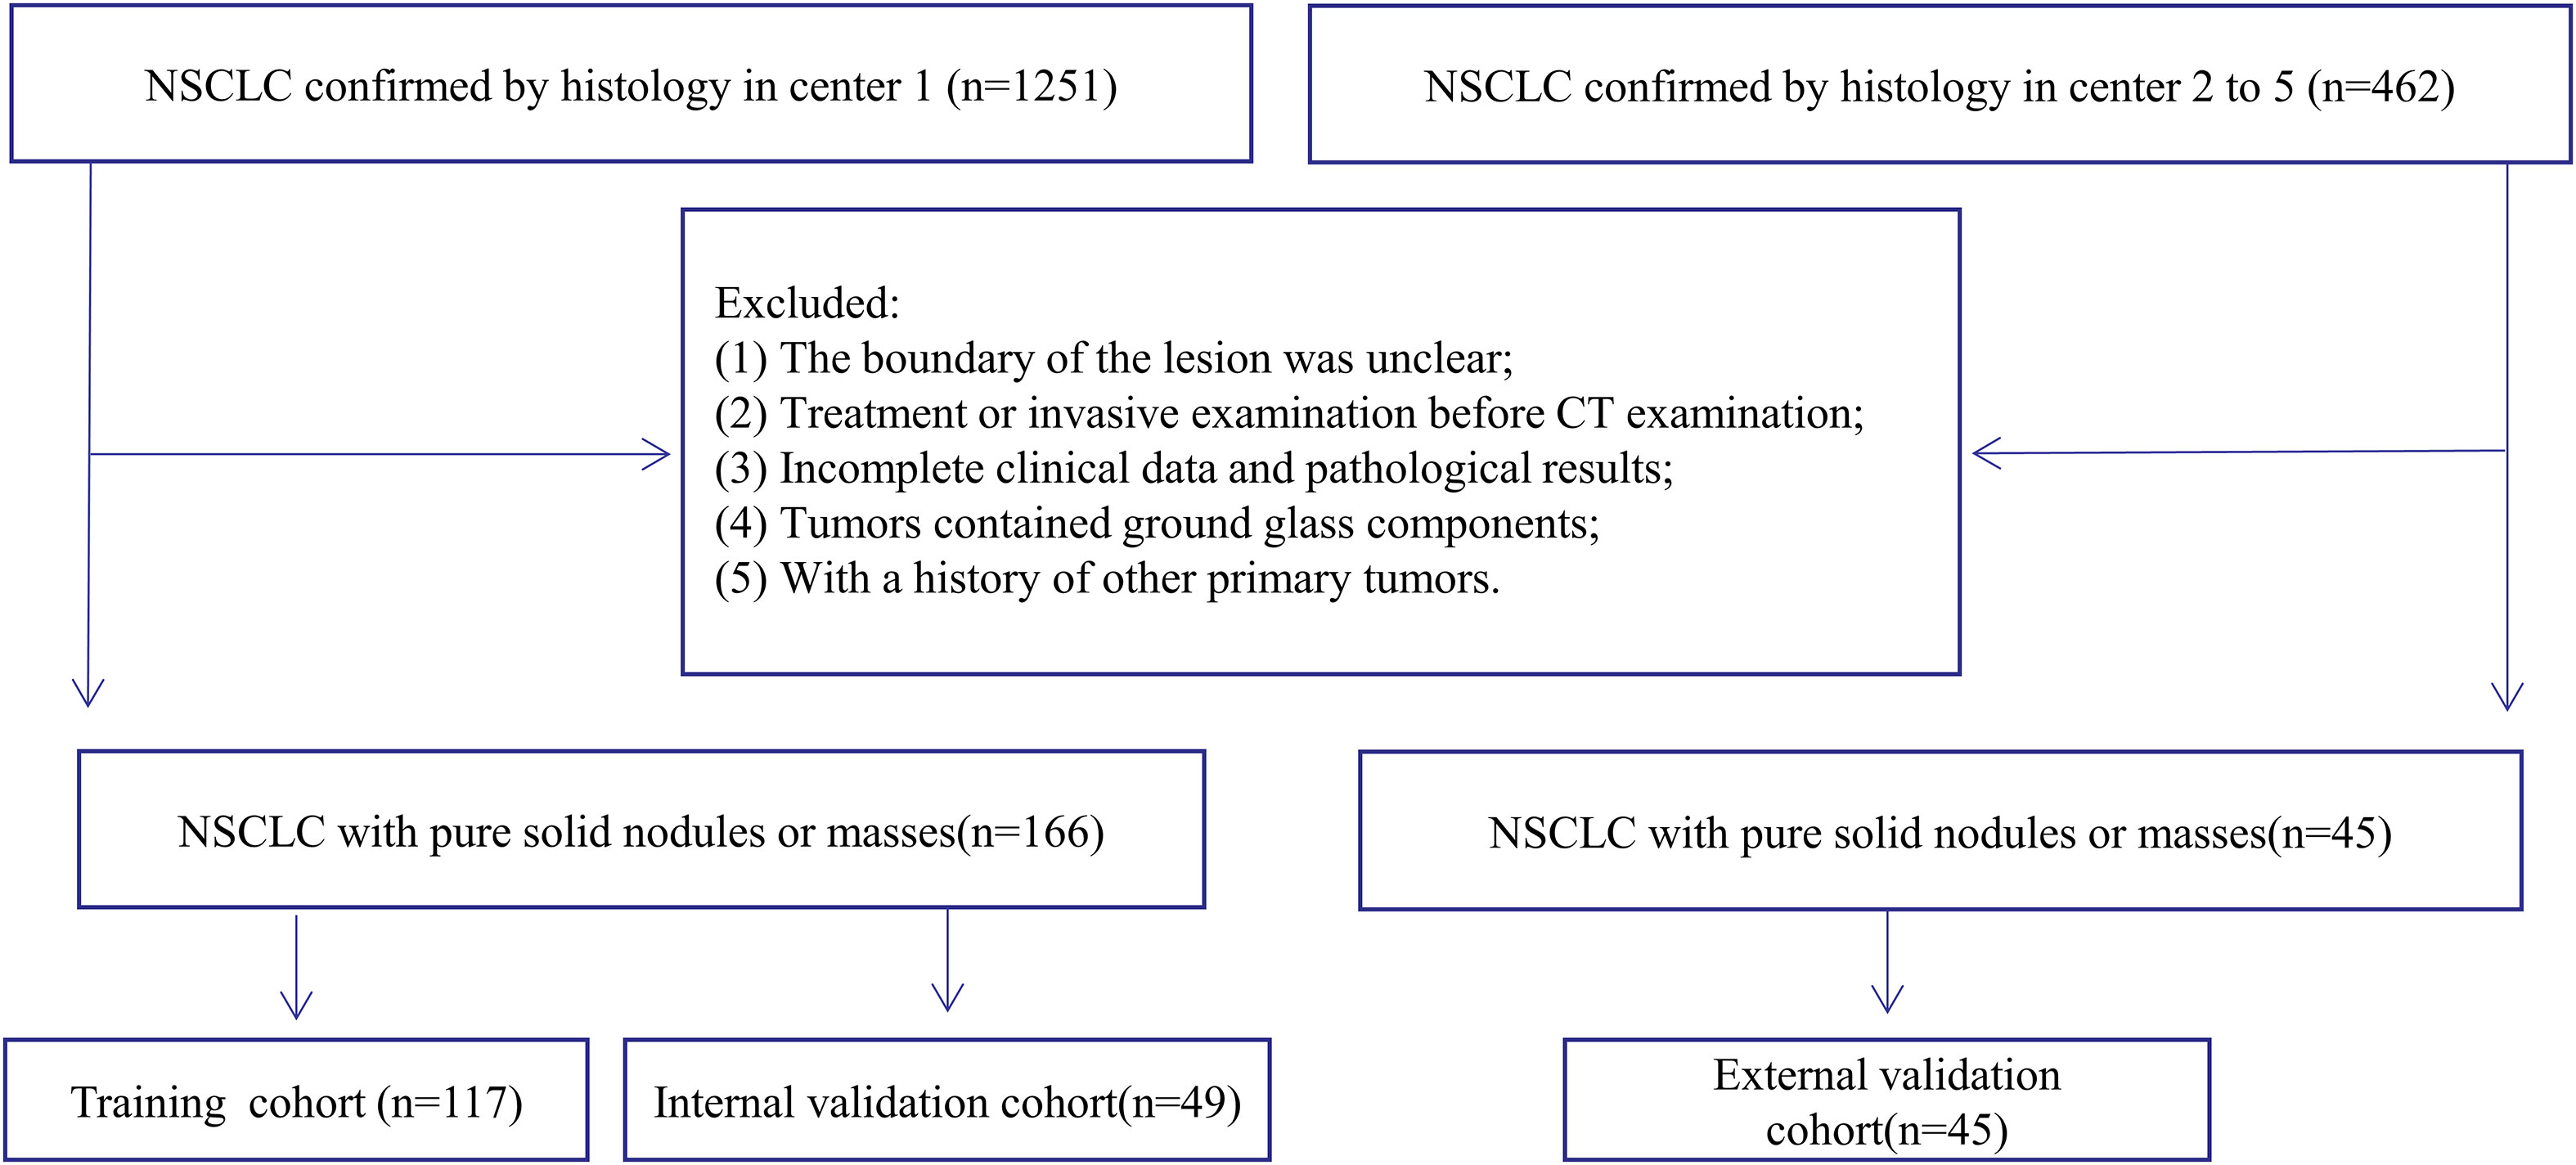
Figure 1 Flowchart showing the selection process of study subjects.
Spiral non-enhanced CT scans of the chest were performed on all patients participating in the study. Table 1 shows the details of the CT scanning routine and image reconstruction for each hospital participating in the study. The scanning range covered the chest entrance to the bilateral adrenal level.
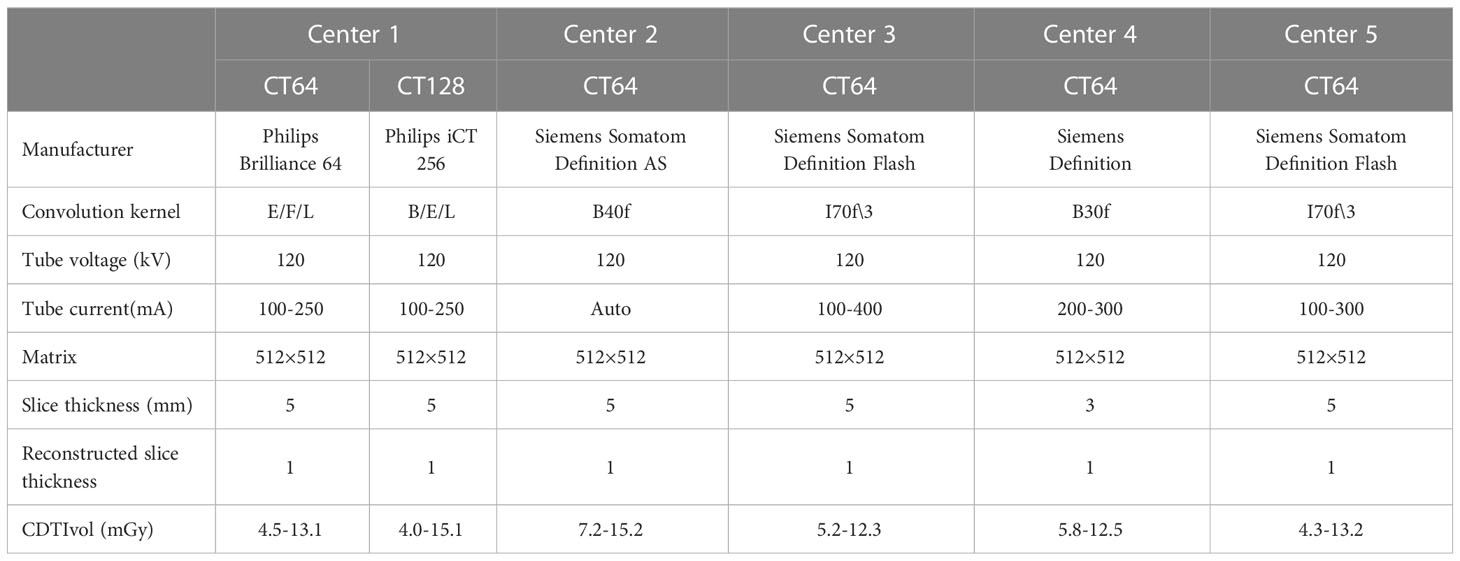
Table 1 CT scanning parameters for each hospital participating in the study.
A monoclonal mouse anti-human Ki-67 antibody was used in this study. The detection of Ki-67 was performed per the manufacturer’s instructions. For each glass slide, 1000 cells were randomly selected, and positive cells were counted. In accordance with previous studies, <40% positivity was defined as low Ki-67 expression, while >=40% positivity was defined as high Ki-67 expression (13, 15, 16).
In this study, all the CT images were independently evaluated by two diagnostic radiologists with more than three years of experience in standard lung windows (window width 1600 HU; window position - 600 HU). A third radiologist with ten years of experience resolved any disagreements. The following clinical information was evaluated: age, gender, smoking status, tumor pathological type, Ki-67 expression, and CT morphological and semantic features.
Using the ITK-SNAP software (version 3.8.0; www.itksnap.org), each DICOM image’s region of interest (ROI) was manually delineated in a 3D space. All ROIs were then outlined by two radiologists with more than three years of experience; all the lesions were labeled layer by layer, and the tumor boundaries were outlined to exclude non-tumor structures such as blood vessels, bronchi, and pleura. All the outlined ROIs were imported into the AK software (Analysis Kit, GE Healthcare, Chicago, IL, USA). The images were processed by pixel size normalization and resampling to extract the radiomics features. Altogether, 1316 features were extracted, including 18 first-order statistical features, 14 shape features, 75 texture features, and 1209 higher-order features. The workflow for radiomics is shown in Figure 2. The intraclass correlation coefficient (ICC) was used to analyze the consistency of the image features extracted by the radiologists.
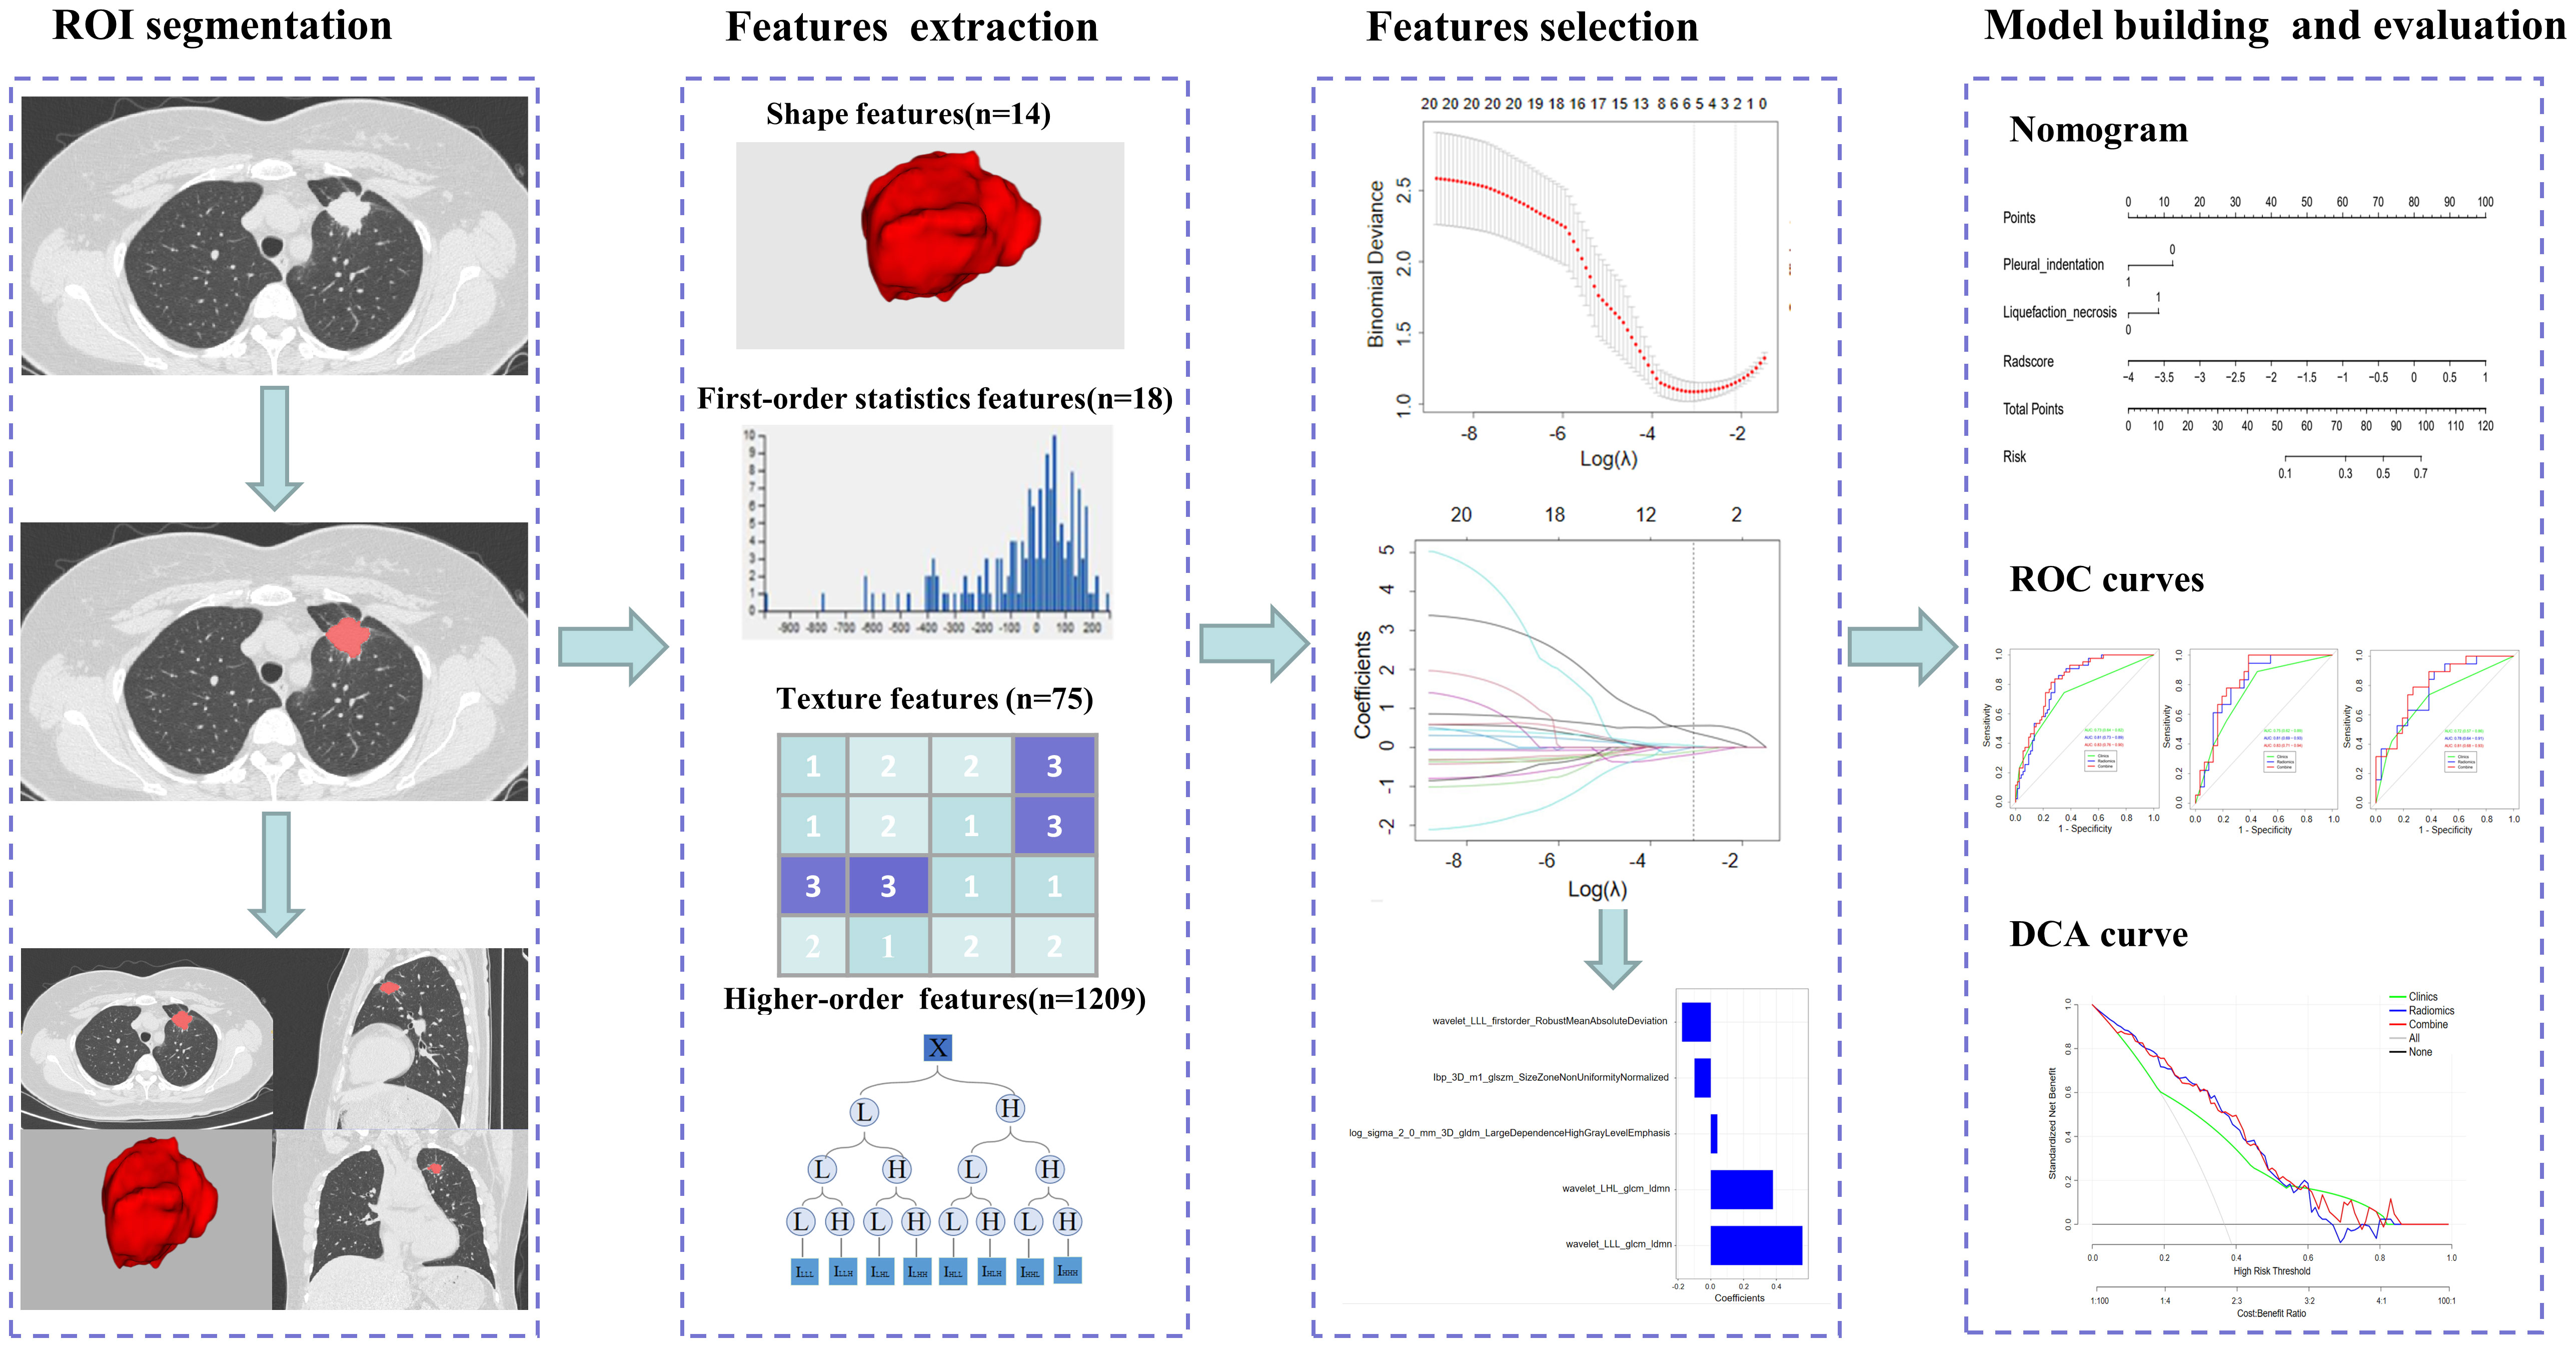
Figure 2 Overview of the radiomics workflow.
The minimum redundancy maximum relevance (mRMR), and least absolute shrinkage and selection operator (LASSO) were used to select the optimal radiomics features. The mRMR was used to eliminate redundant and irrelevant features. Subsequently, the LASSO was conducted to select the optimized subset to construct the radiomics score (rad-score). The rad-score calculation formula was obtained using the characteristics and their coefficients, followed by the computation of the rad-score value.
A Logistic regression model was developed based on the univariable and multivariable analyses of clinical characteristics. Three different prediction models were established to predict the diagnostic efficacy of Ki-67 PI: the clinical model, the radiomics model, and the nomogram combining radiomics signature and clinical features.
The R software version 4.0.2 and SPSS version 26.0 were used to analyze data. The prediction models were tested using data from internal and external validation cohorts. Univariable and multivariable analyses were used for clinical feature selection. The receiver operating curve (ROC) and AUC were used to evaluate the diagnostic efficacy of the model. Decision curve analysis (DCA) was employed to evaluate the clinical usefulness of three prediction models. Mann-Whitney-Wilcoxon test was used to compare continuous variables, the chi-squared test was used for categorical variables, and P<0.05 indicated that the difference was statistically significant.
A total of 211 patients were included in this study. The detailed clinical characteristics of the three cohorts are presented in Table 2. Among the most significantly different clinical characteristics in the Ki-67-high group versus the Ki-67-low group were the pathological type, longest diameter, spiculation sign, pleural indentation, and liquefaction necrosis (P<0.05).
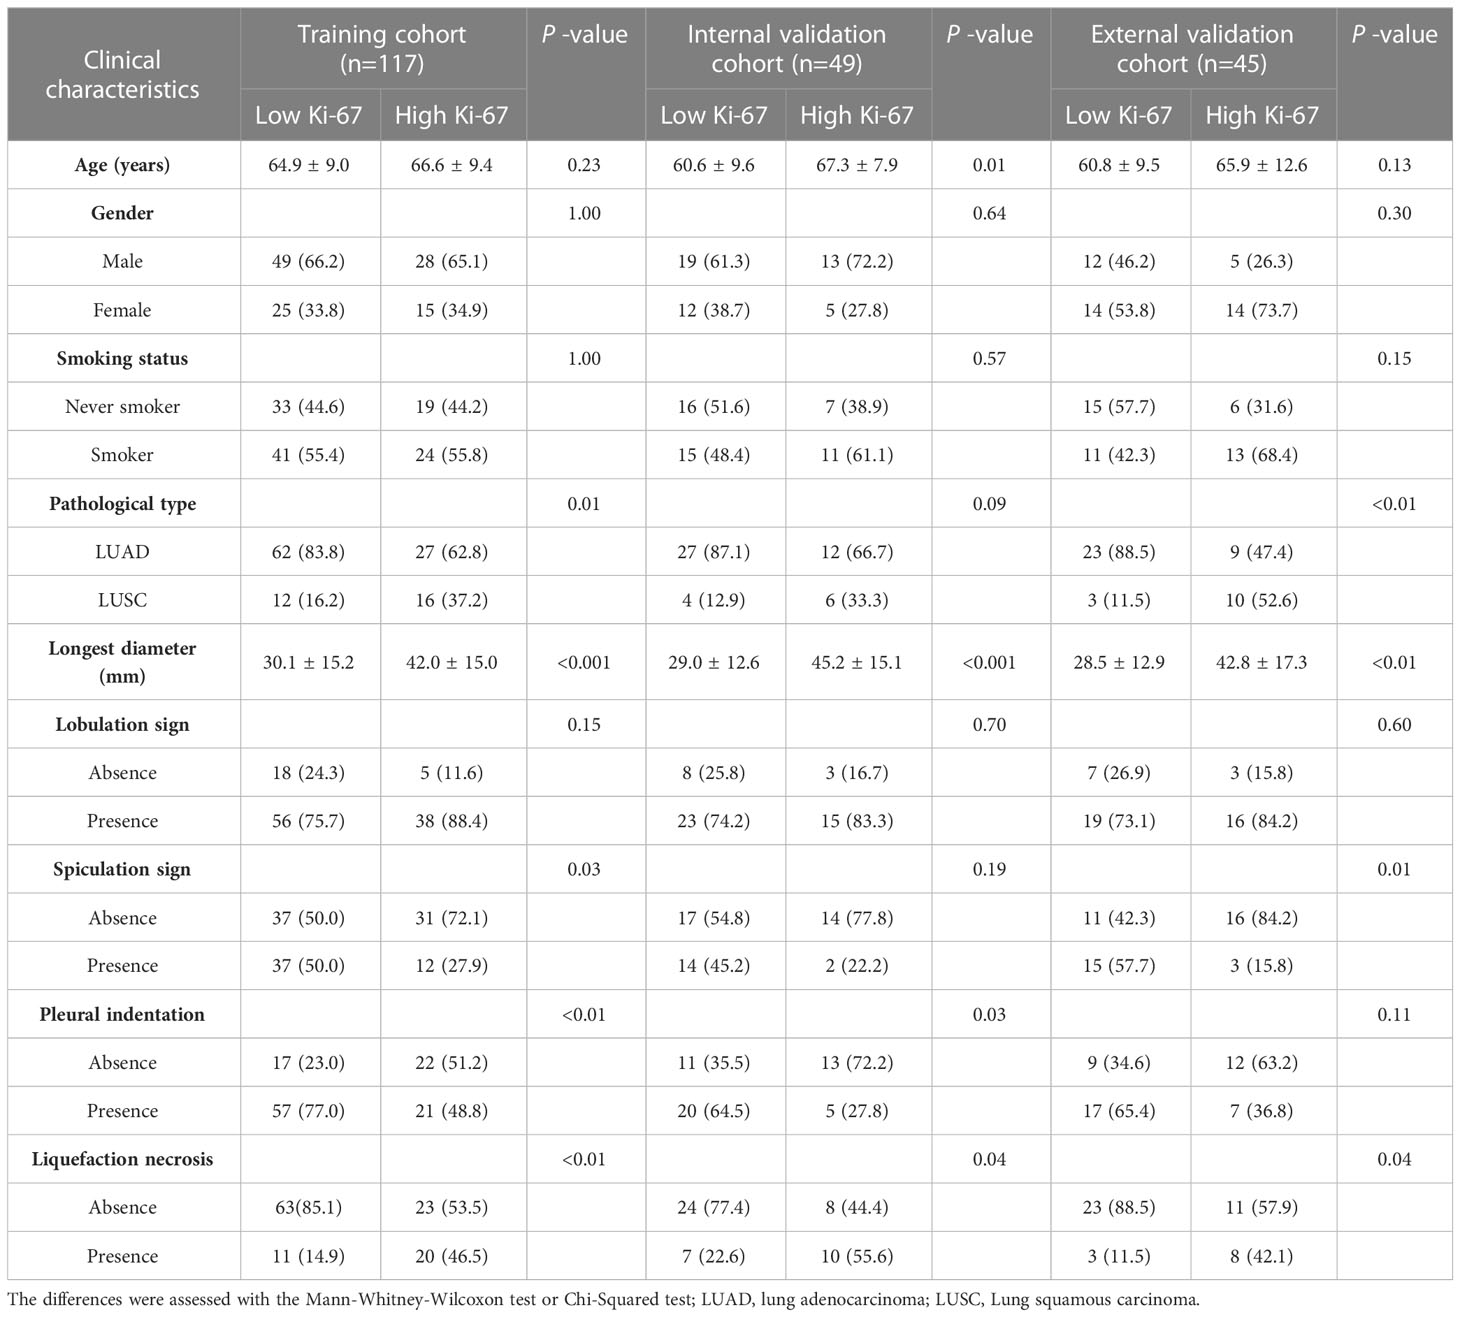
Table 2 The clinical characteristics of three cohorts.
In the set of radiomics features within ROIs extracted by two radiologists, 30 nodules were randomly selected and segmented independently by one radiologist. One month later, another radiologist segmented these 30 nodules. Correlation analysis was performed on 1316 features extracted from these 30 nodules by inter-class correlation (ICC), and the consistency was considered good at ICC>0.80. The resultant ICC in this study was 0.84.
We used the mRMR to select the feature with the strongest correlation. Finally, LASSO was utilized to choose the optimal features in constructing the radiomics signature, and five features were selected (Figures 3, 4). Based on the final five radiomics features and their weights, the rad-score calculation formula was derived, and the rad-score value for each patient was calculated separately. The rad-scores of each patient across all three cohorts are shown in Figure 5.
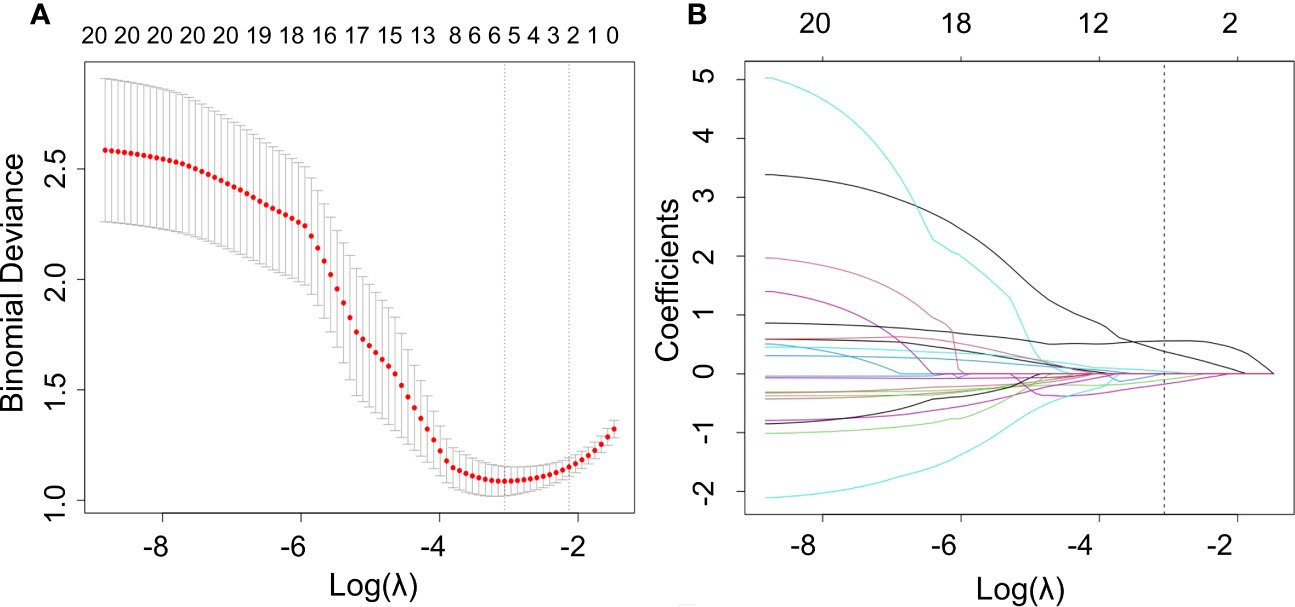
Figure 3 Optimal radiomics features were screened using mRMR and LASSO. (A) Binomial deviation versus a parameter. LASSO regression was used to screen the radiomics features, and cross-validation was used to select the optimal model parameter λ. The vertical axis was the binomial deviation, and the horizontal axis was the log (λ)value. λ, which represented the smallest binomial deviation of the model, was the optimal value (vertical dashed line). (B) Graph of the variation of the radiomics feature coefficient with λ. The number above indicates the number of filtered features.
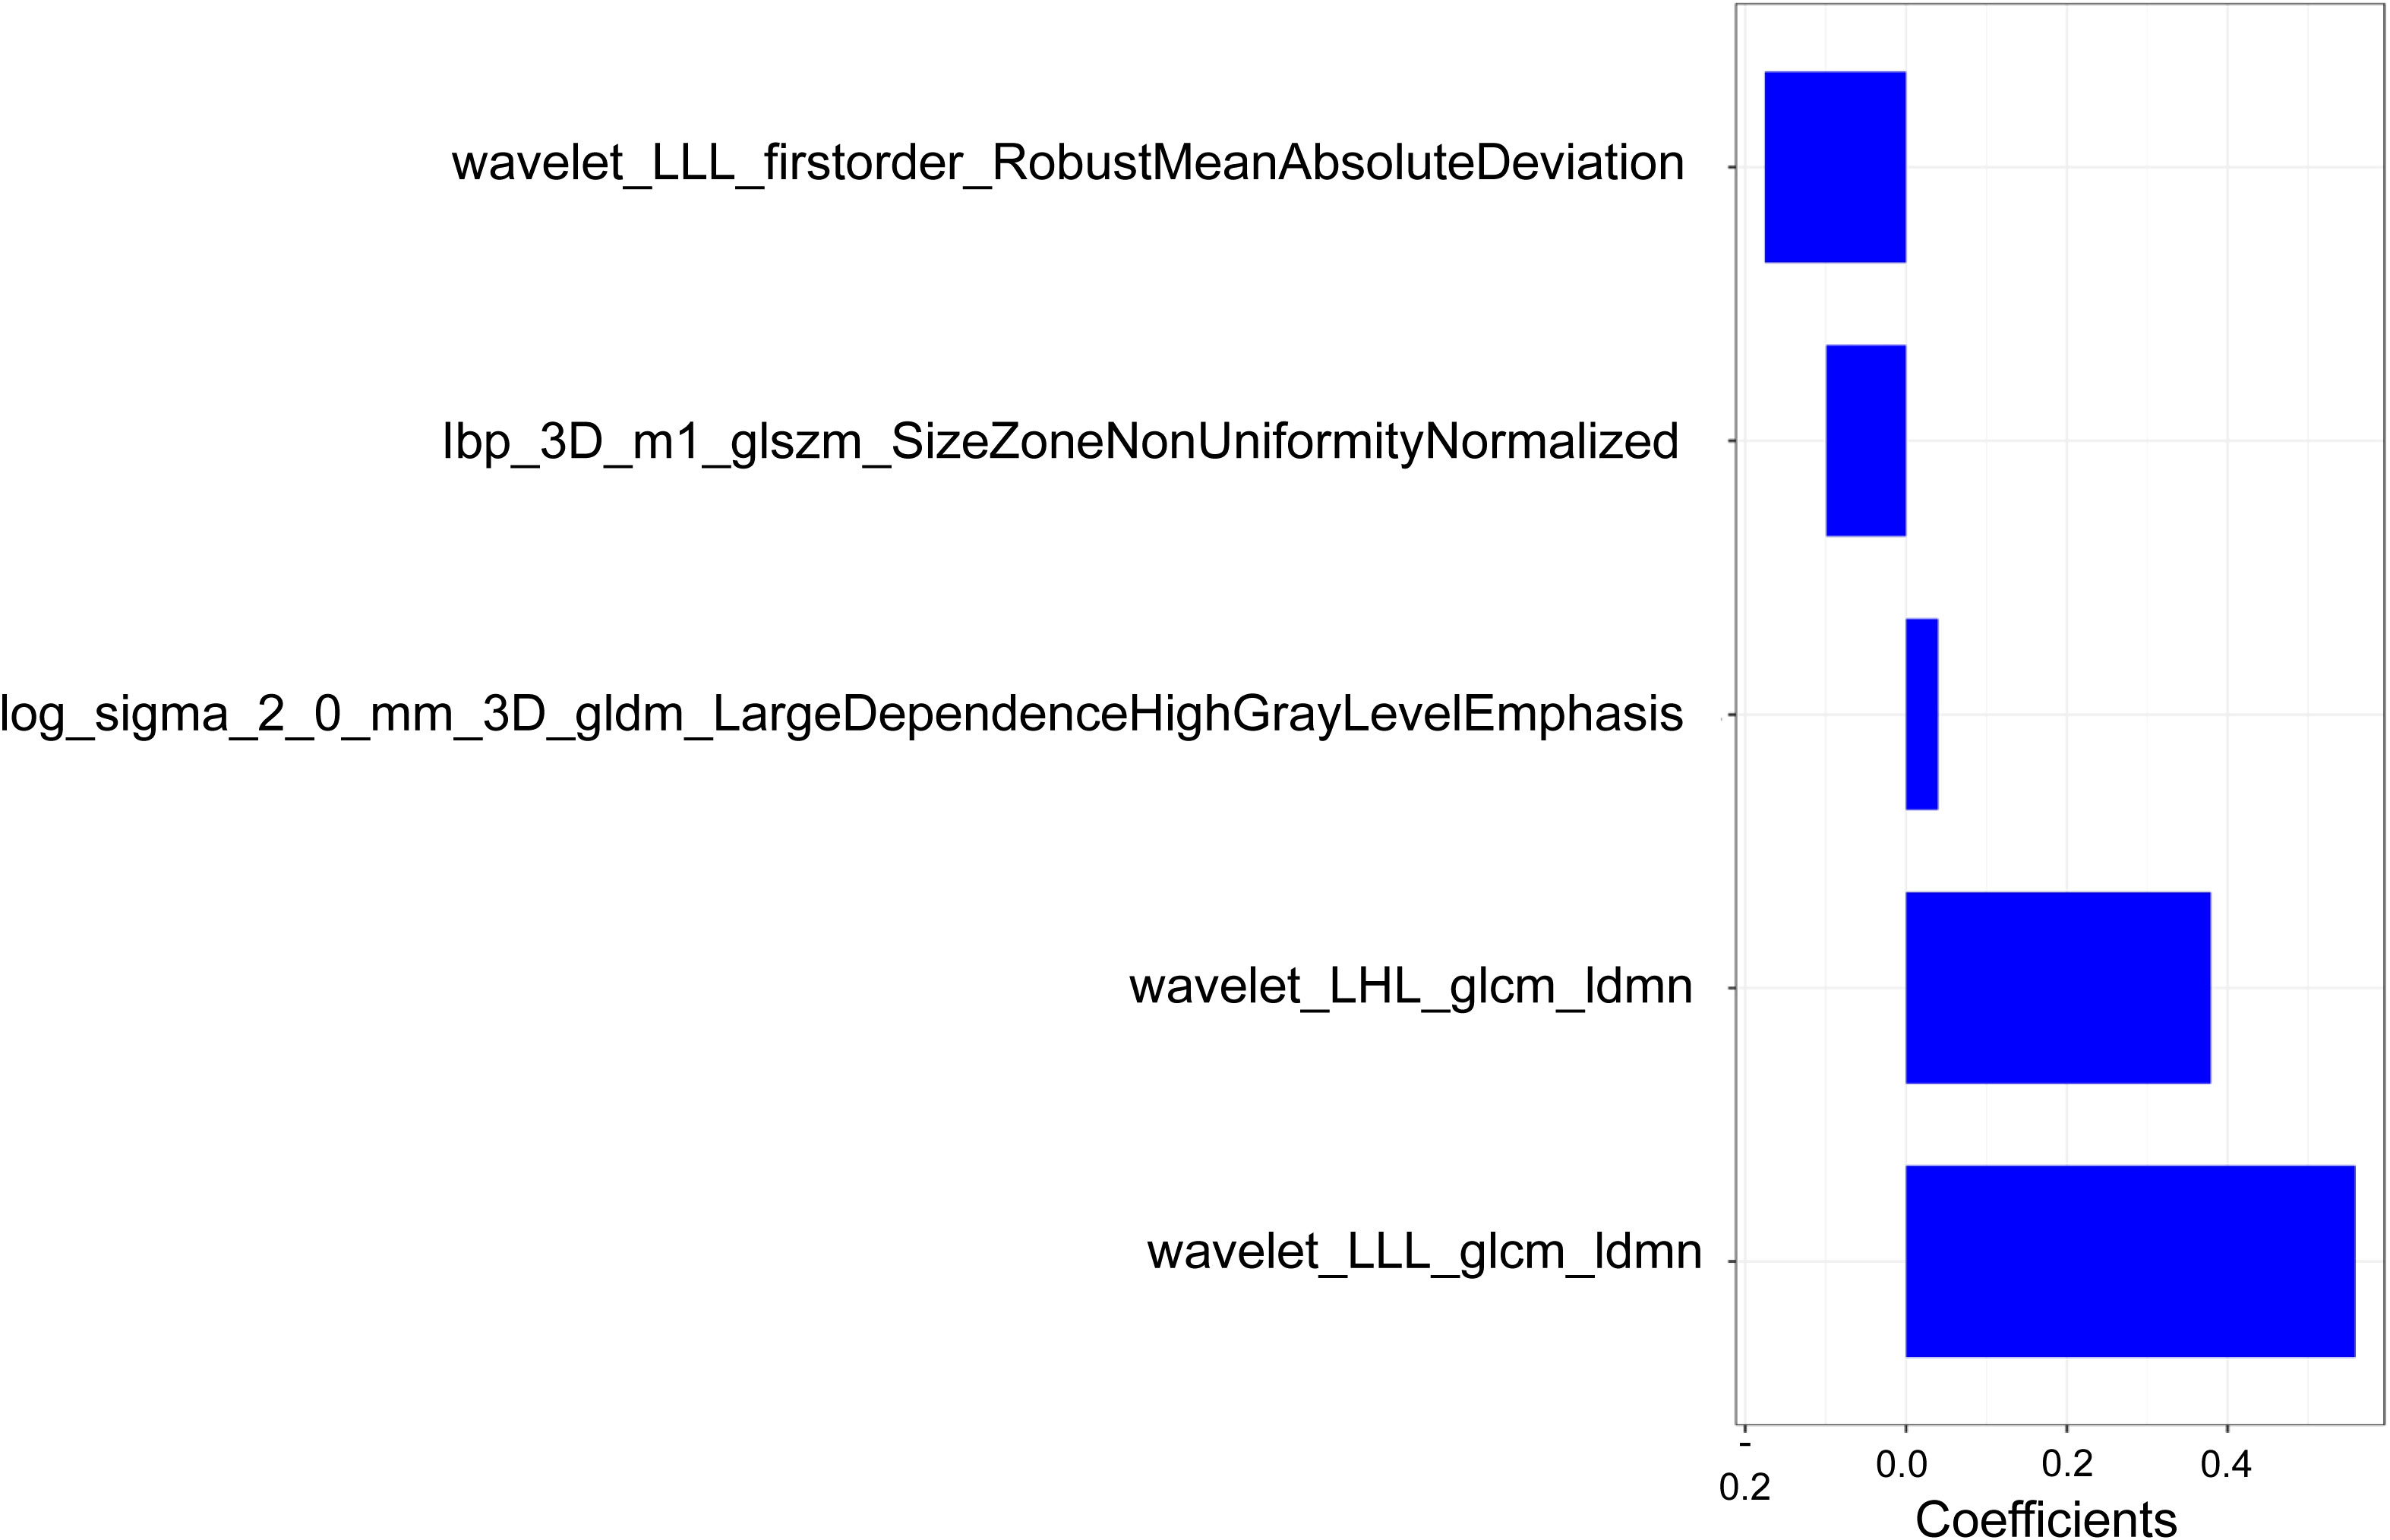
Figure 4 Optimal radiomics features used in this study and their corresponding weights.
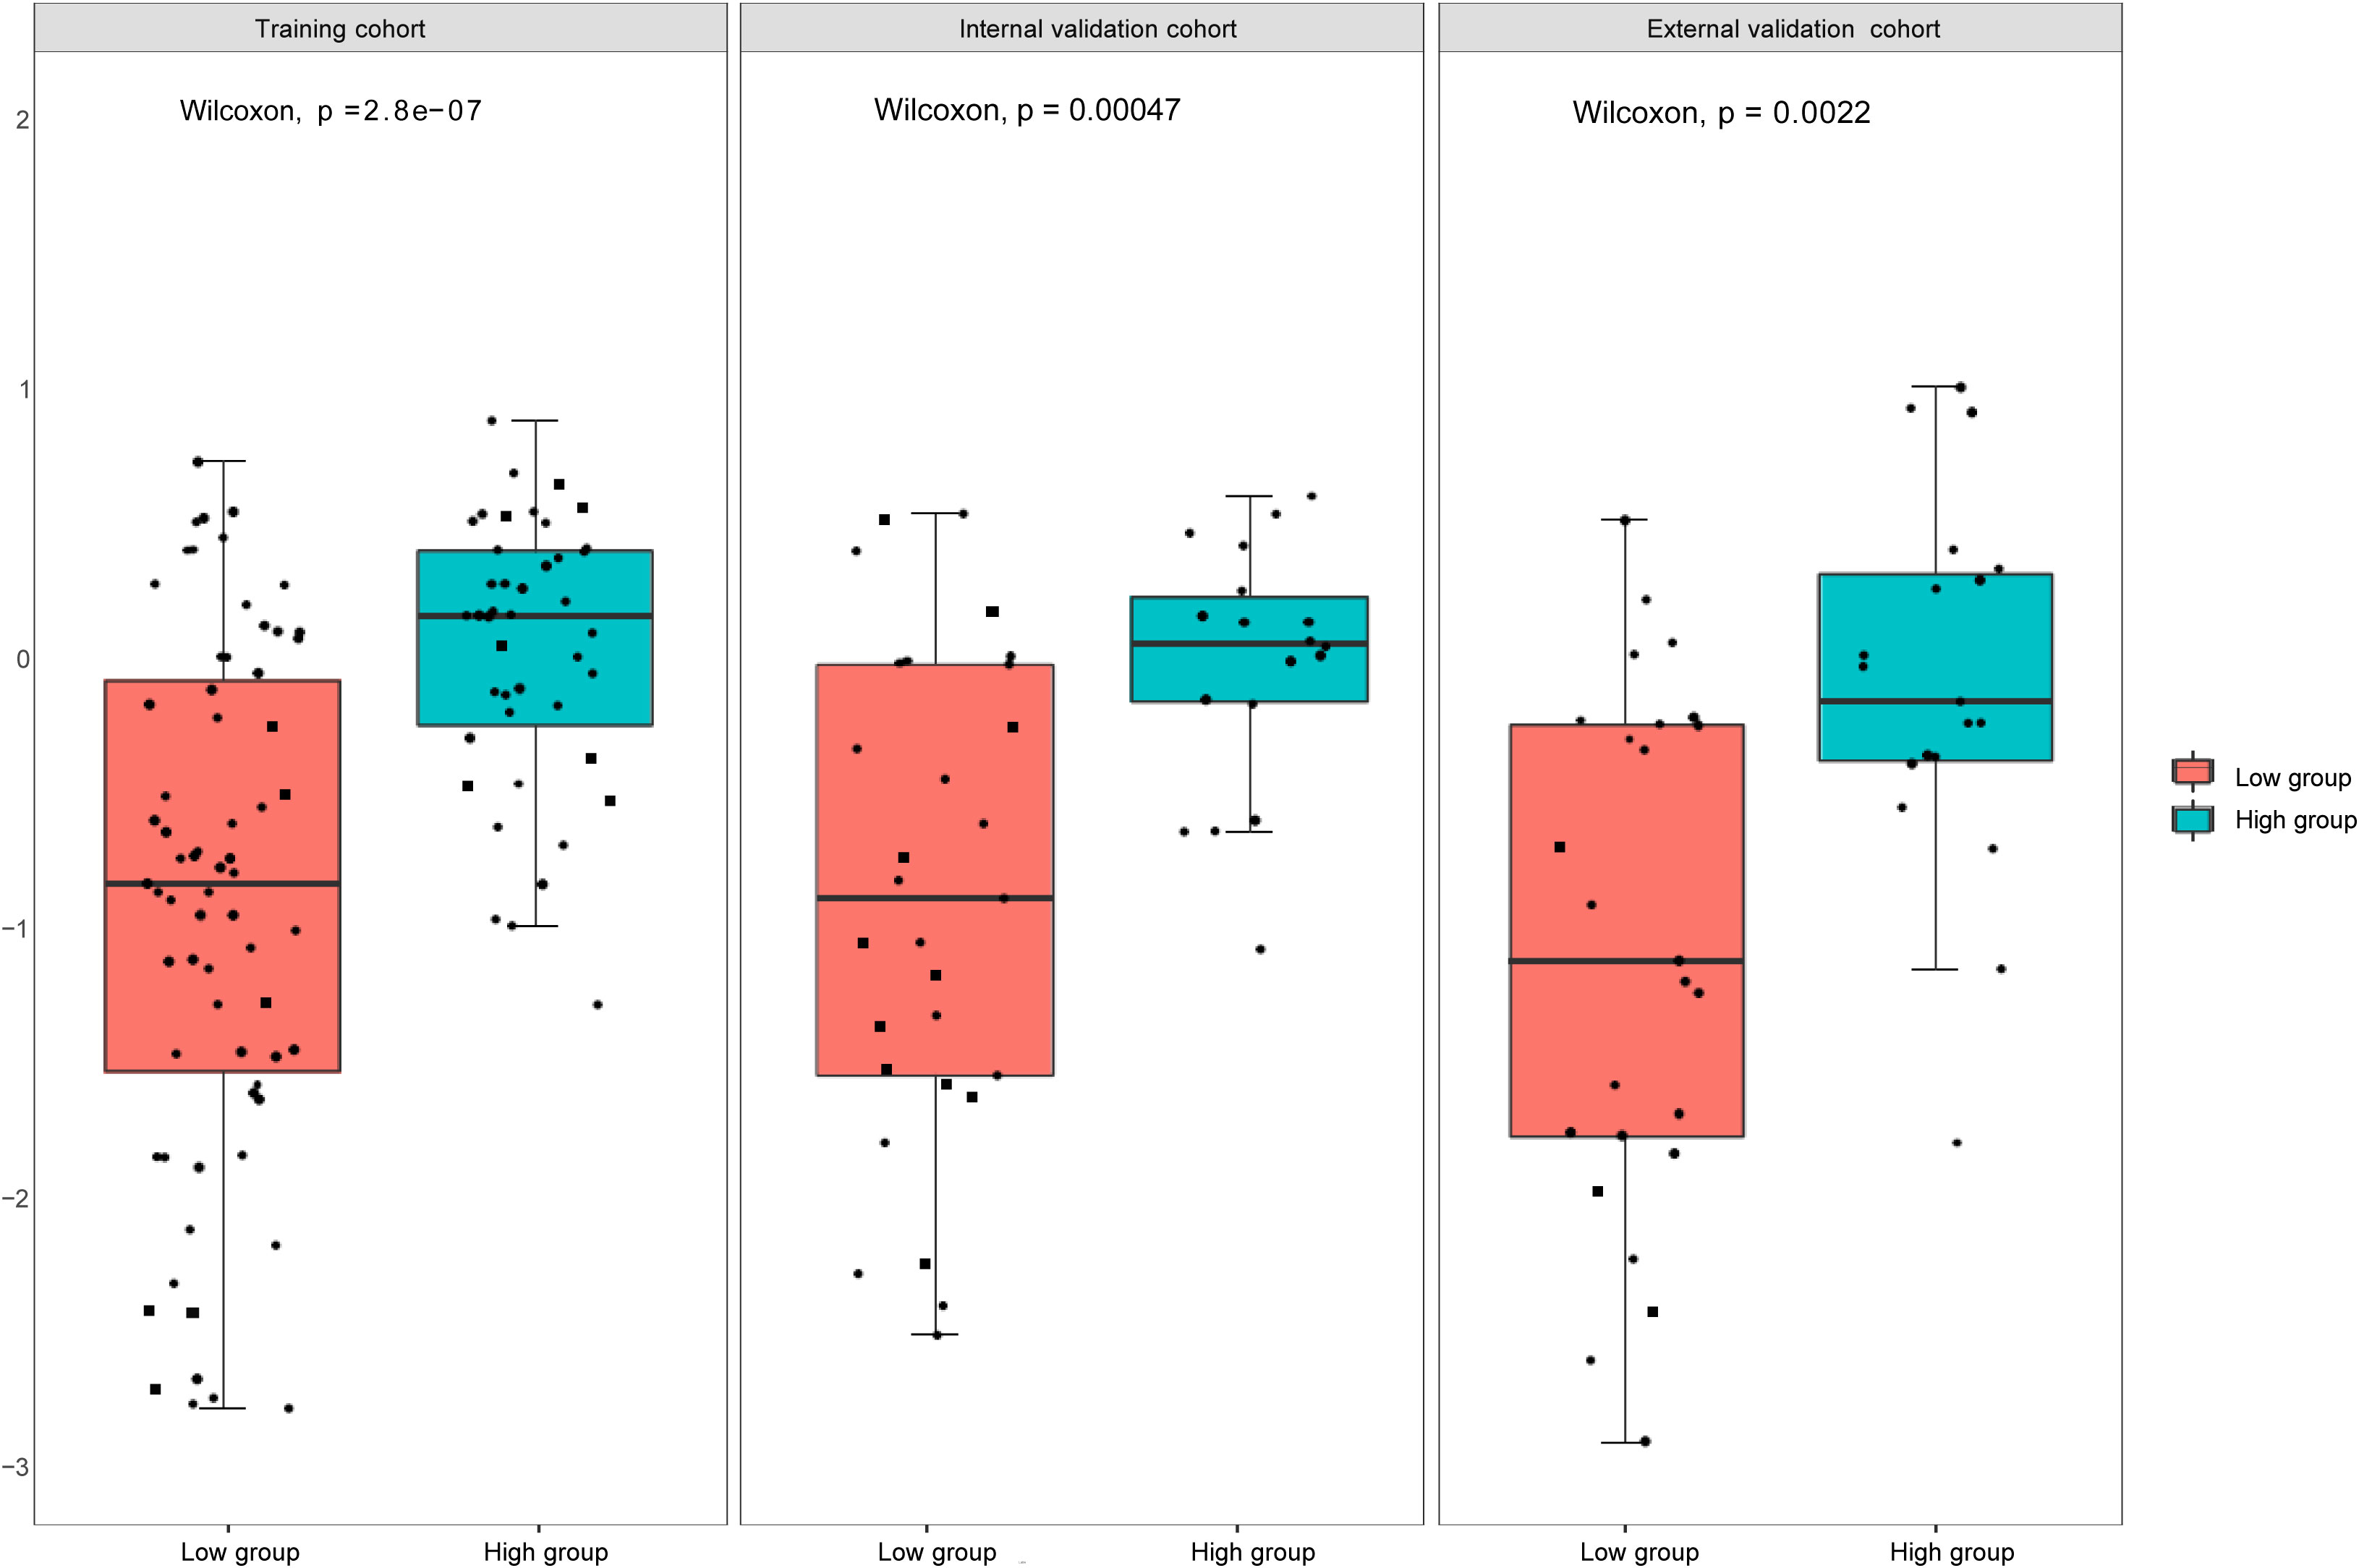
Figure 5 Rad -scores in the training, internal, and external validation cohorts. There is a significant difference between the rad- scores of the high and low expression groups (P<0.05).
We then performed a univariable analysis, which revealed that the longest diameter, spiculation sign, pleural indentation, and liquefaction necrosis are significantly associated with high expression of Ki-67 (P<0.05) (Table 3). Subsequent multivariable logistic regression analysis demonstrated that pleural indentation and liquefaction necrosis were independent predictors of the Ki-67 expression in pure-solid NSCLC (Table 3). Based on these two independent predictive factors, we established a clinical model related to the Ki-67 expression level. Logistic regression was used to establish a radiomics prediction model for Ki-67 expression levels in pure-solid NSCLC patients. Finally, a nomogram combining radiomics signature and clinical features was constructed (Figure 6). The calibration curve for the probability of Ki-67 expression levels showed that the nomogram matched well with the actual trend in all three cohorts (Figure 7). The DeLong test showed a significant difference between the AUC of the nomogram and the AUC of the clinical model in the training cohort (P<0.05). However, there was no statistical difference in AUC between the radiomics model and the nomogram (P=0.14). There was no significant statistical difference in AUC among the models in both internal and external validation cohorts (P>0.05). Figure 8 and Table 4 show that nomogram‘s prediction efficiency outperformed the radiomics signature and clinical model in all three study cohorts.
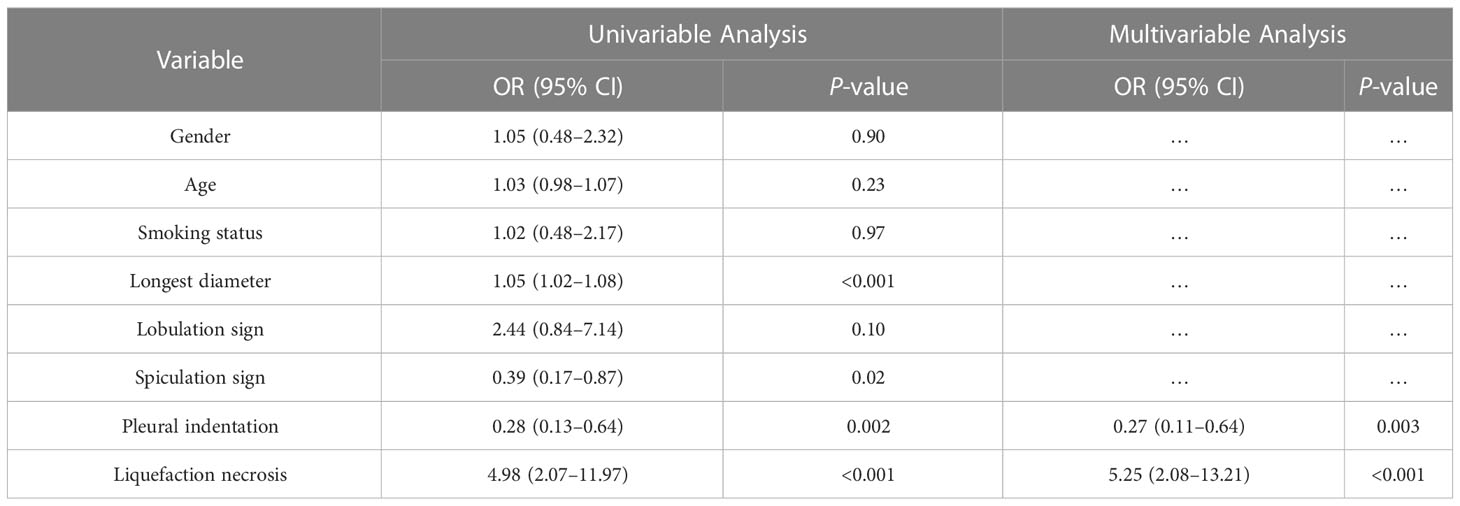
Table 3 Univariable and Multivariable Logistic Regression analyses in the training cohort.
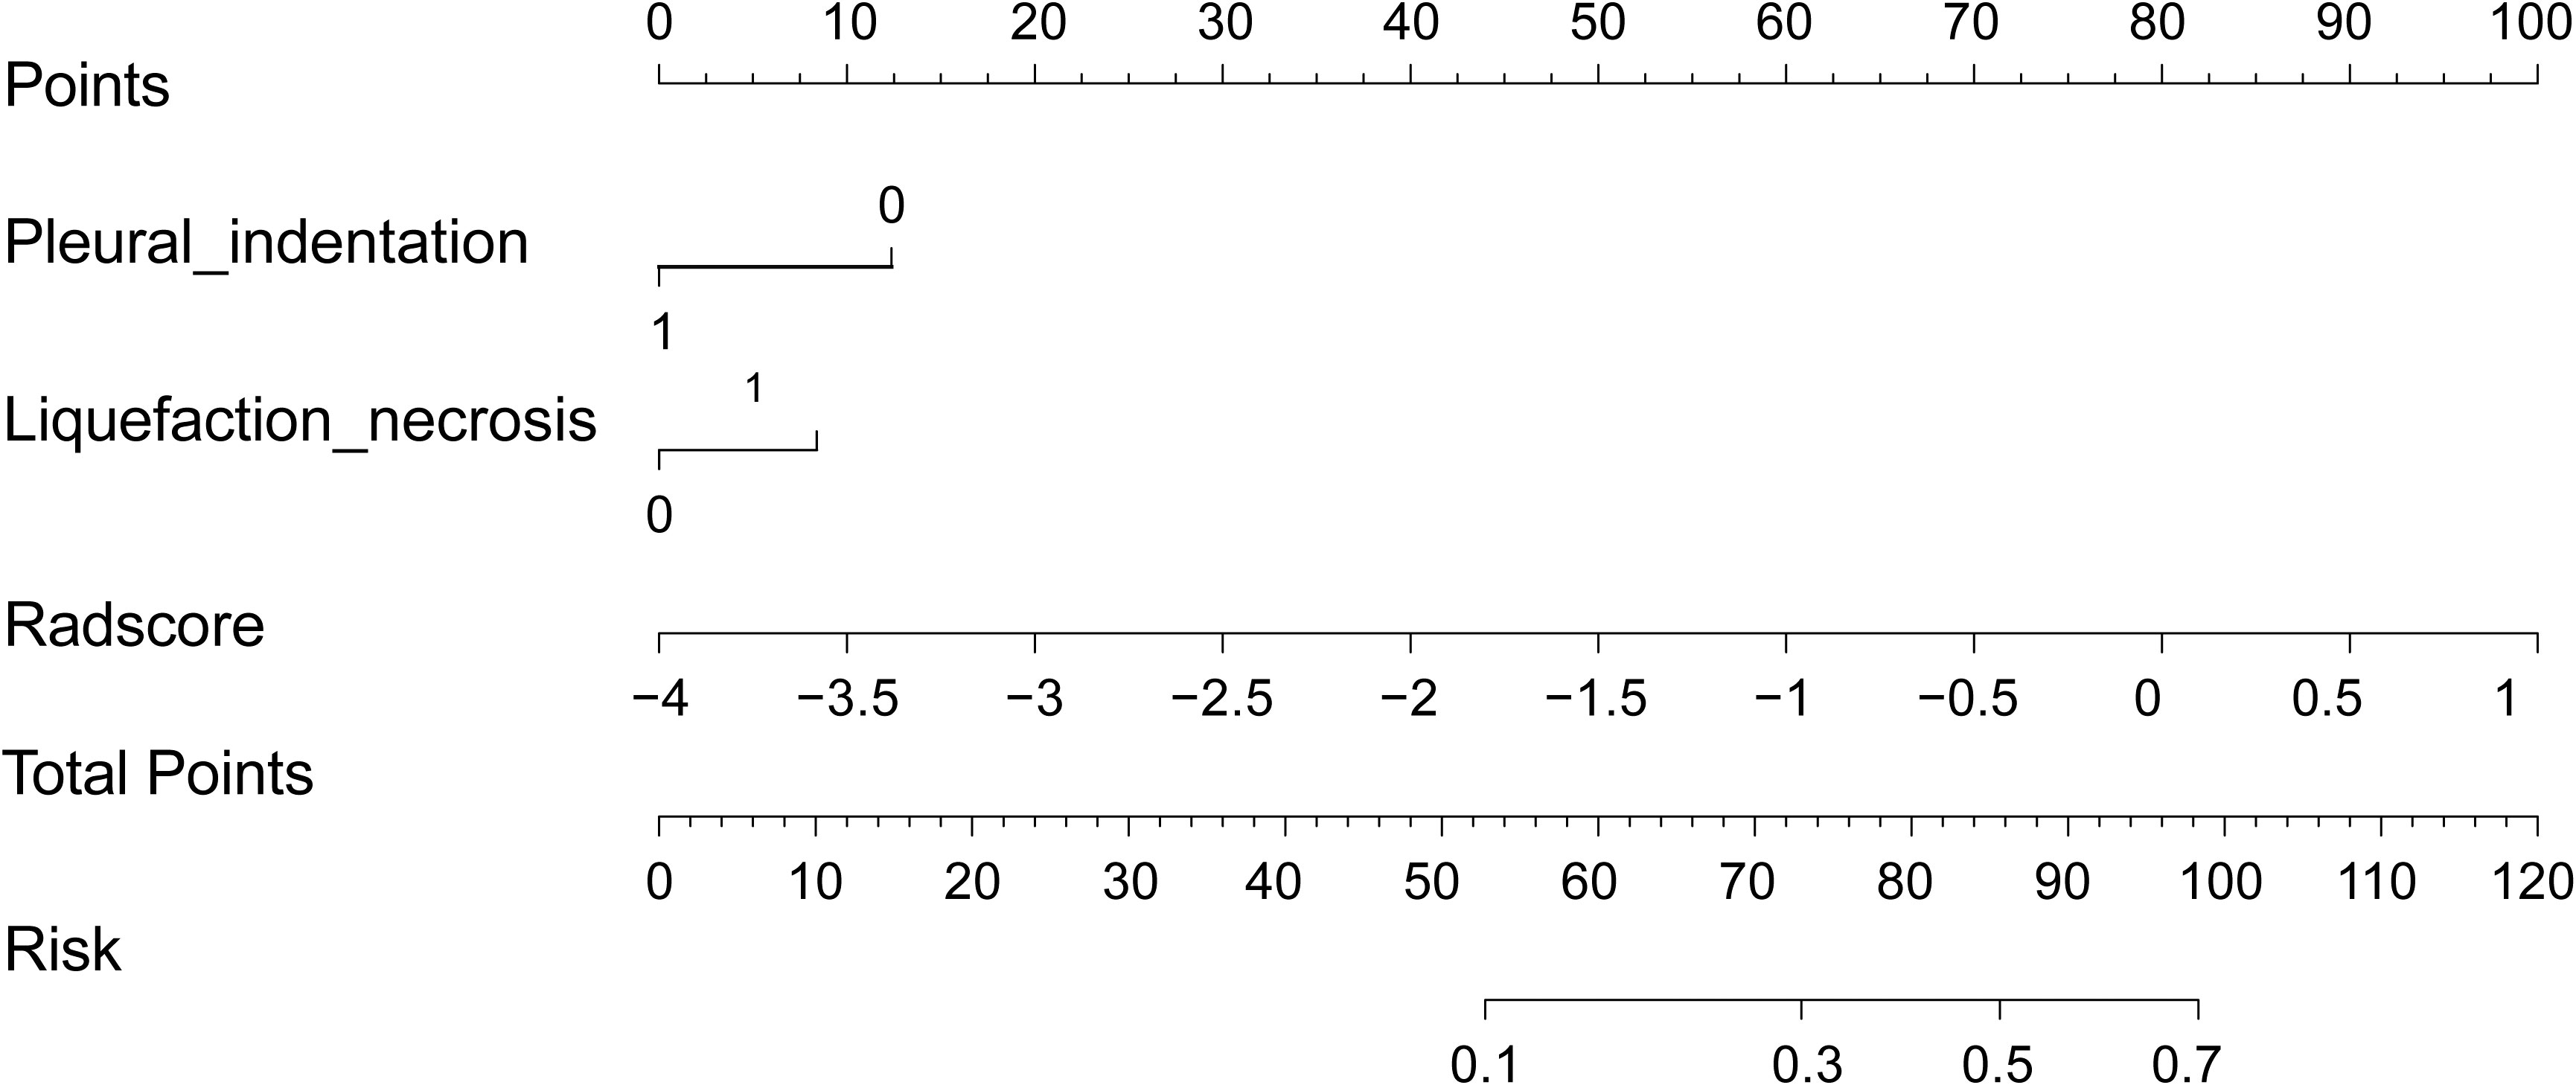
Figure 6 Nomogram integrating radiomics signatures and clinical features.
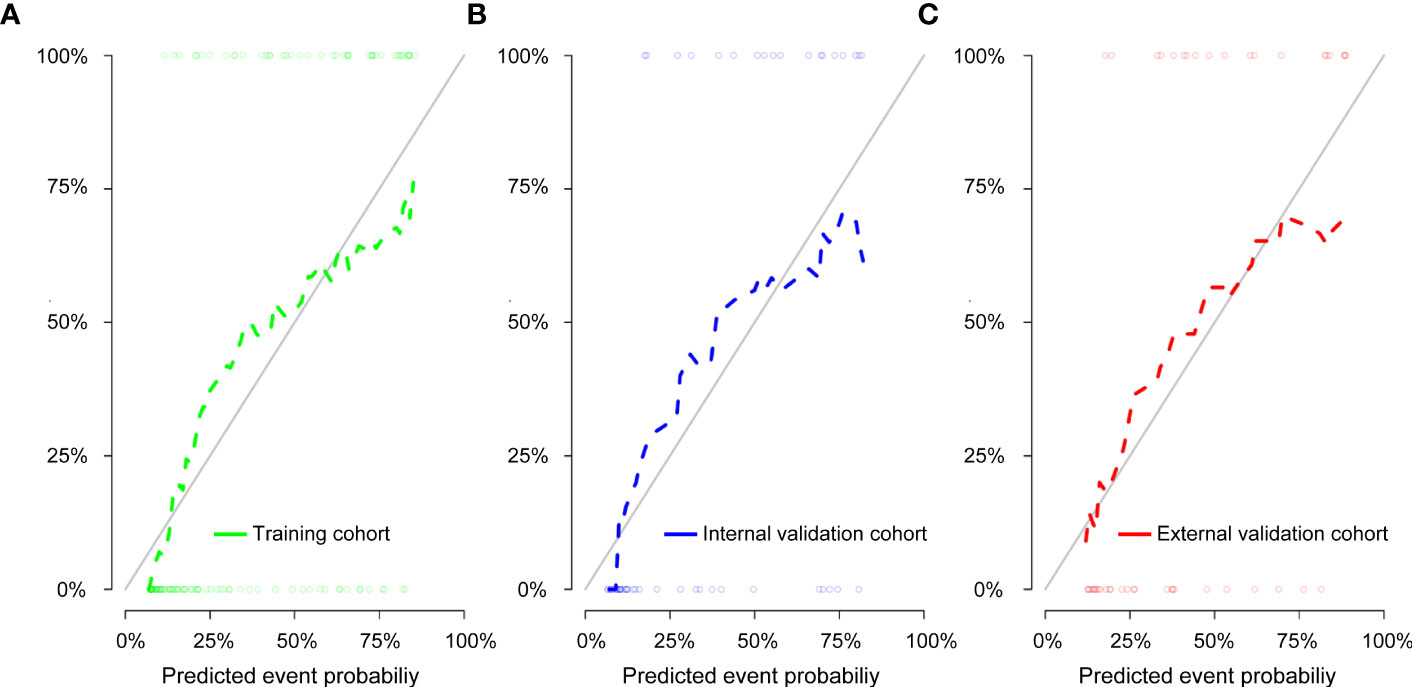
Figure 7 Calibration curve of the nomogram for the training cohort (A), internal validation cohort (B), and external validation cohort (C). The solid diagonal line represents the perfect prediction of the ideal model, and the dashed line represents the actual model’s performance.
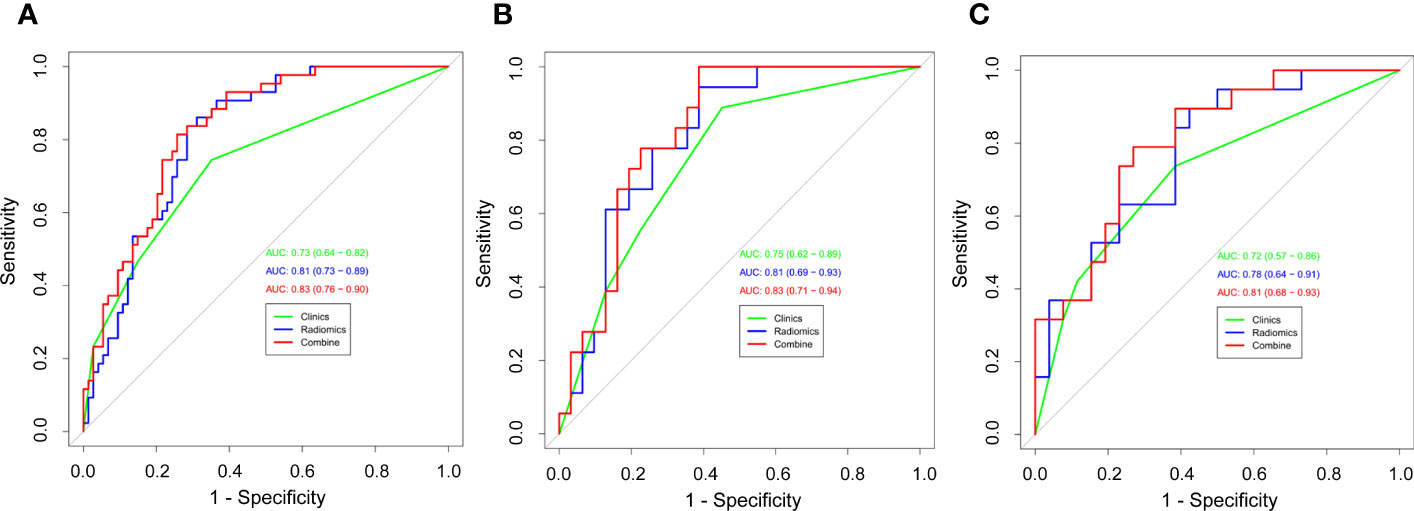
Figure 8 Receiver operating characteristic (ROC) curves of all three models were used to predict the Ki-67 expression level between the training cohort (A), internal validation cohort (B), and external validation cohort (C).
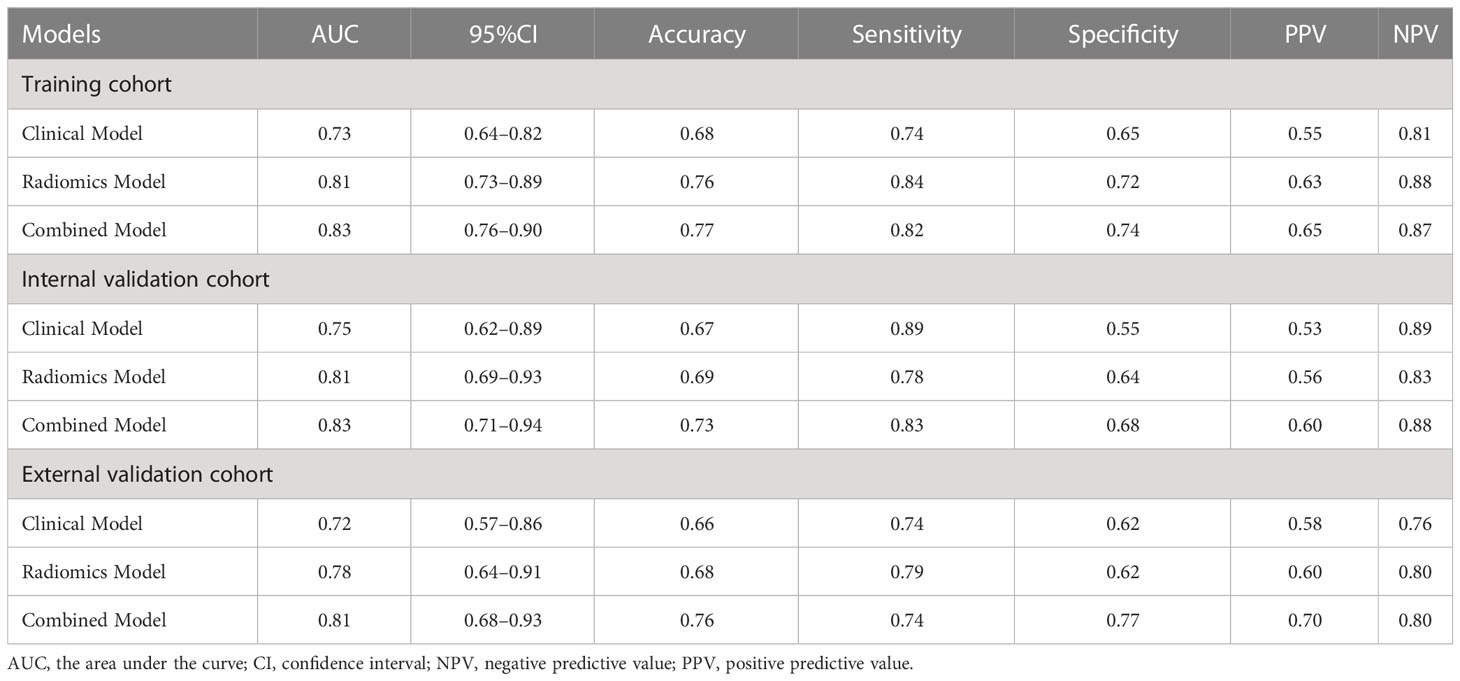
Table 4 The predictive values of different models across three cohorts of the study.
The DCA was used to assess the clinical practical value of the nomogram in all three models (Figure 9). In this study, the DCA indicated that the net benefit of the nomogram combining radiomics signature and clinical features was higher than that of the clinical and radiomics models when the threshold probability was 0.07 to 0.60 and treated all or no patients.
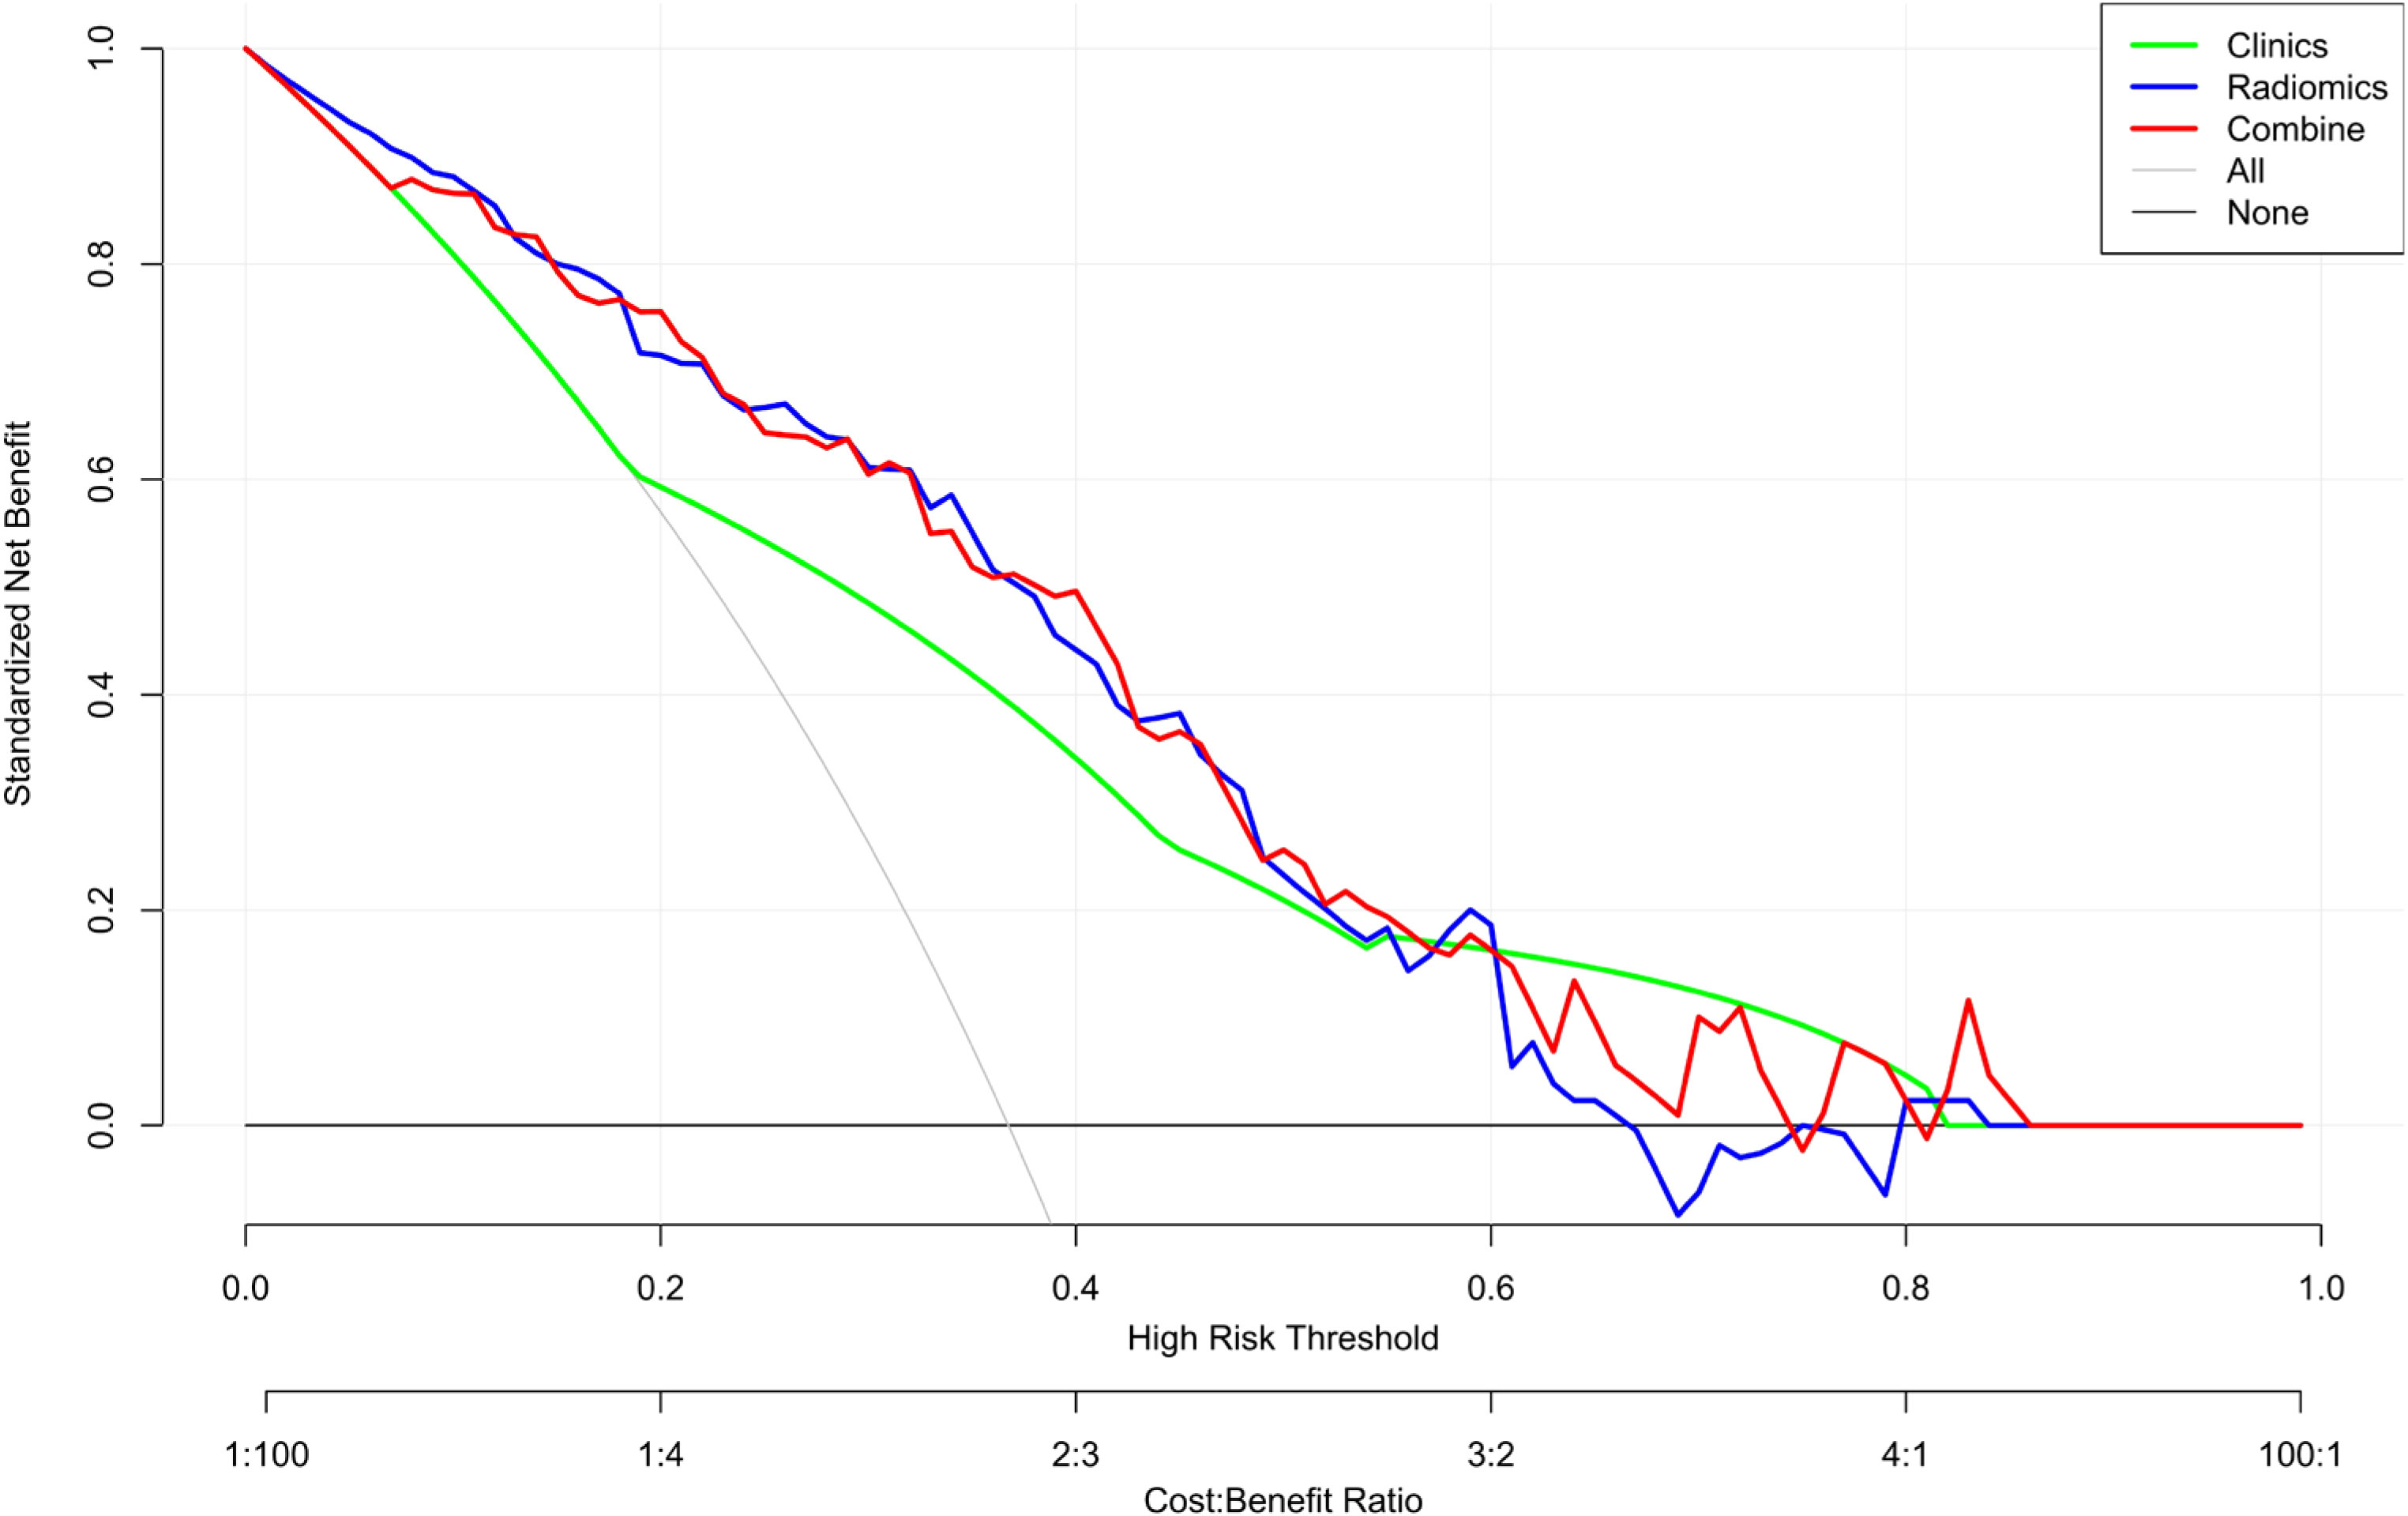
Figure 9 Decision curve analysis (DCA) of the nomogram. The y-axis represents the net benefit. The x-axis shows the threshold probability—the expected benefit of the number of treatments equals the expected benefit of not receiving treatment. The gray line represents the hypothesis that all patients have high Ki-67 expression, and the black line represents the hypothesis that no patient has high Ki-67 expression. The red curve is farthest from the X and Y axes, indicating that the nomogram is clinically useful.
NSCLC is a malignancy with an exceptionally high mortality rate. Squamous and adenocarcinoma are the most common pathological types of NSCLC (1). Currently, Ki-67 is the most frequently employed marker for evaluating cell proliferation. Its expression strongly correlates with lung cancer development, metastasis, and prognosis (17). Accurately predicting Ki-67 expression levels may assist clinicians in making correct treatment decisions and customizing patient care.
Radiomics is the process of acquiring high-throughput data, extracting the quantitative features from images using computer learning software, mining quantitative information, and filtering out the most valuable radiological features to construct a predictive model (18, 19). Radiomics can be a better, non-invasive alternative to biopsy by improving treatment efficiency and reducing costs. Previous studies performed radiomics using images from positron emission tomography/computed tomography (PET/CT) and magnetic resonance imaging (MRI) (16, 20, 21). Many hospitals lack advanced imaging equipment, but CT is available in most of them. As a non-invasive, convenient, and quick imaging method, CT is a valuable imaging tool for lung cancer diagnosis and outcome evaluation. Because textural features of the original structure of the lesion tissue could be obscured by the high-density contrast in the enhanced CT images (22), only thin-slice CT non-enhanced images were used in this study. Since different radiological subtypes of lung cancer may have different biological behaviors, it is necessary to explore the value of radiomics in pure-solid and subsolid lung cancer separately. Few multicenter studies explored the expression level of Ki-67 in pure-solid lung cancer predicted by radiomics. Our multicenter study aimed to develop a simple, non-invasive, and widely applicable method to predict Ki-67 expression levels in solid NSCLC using thin-slice CT non-enhanced images. Thus, analyzing CT images of NSCLC may be valuable for predicting Ki-67 PI.
Several clinical and radiographic characteristics correlate with Ki-67 expression levels. According to previous studies, higher Ki-67 expression levels were linked to age, gender, and tumor diameter (8, 23). We observed significant differences in age between the Ki-67-high and Ki-67-low expression groups; in addition, all three cohorts showed significant differences in tumor diameter (P<0.05) but not in gender (P>0.05). This could be explained by including only NSCLC patients with pure-solid nodules or masses, not those with ground-glass nodules. In addition, logistic regression analysis showed that the radiographic sign (liquefaction necrosis) was an independent predictor of Ki67 high expression in pure-solid NSCLC, and this may be explained by the fact that these radiographic signs always appear on CT scans of lesions containing fast-growing tumor cells, characterized by high Ki-67 levels. In necrocytosis, aqueous fluid within the lesion is thought to be caused by chronic ischemia and neovascularization associated with rapid tumor cell growth (24), often suggesting high heterogeneity within the tumor lesion. Therefore, the Ki-67 high-expression group is more likely to be more necrotic. We established a clinical model to predict the Ki-67 PI. The AUC values for the clinical model in the training, internal, and external validation cohorts were 0.73, 0.75, and 0.72, respectively. These data suggest that the clinical model may have a limited value in predicting Ki-67 expression levels, consistent with previous research (8).
The proliferation, differentiation, and cellular composition of subclonal regions of tumors with different Ki-67 expression levels may differ significantly (25). Medical imaging, such as CT, can reveal these subtle differences and present them as features (18); This study selected five optimal radiomics features and used them for establishing radiomics label values and a multivariable logistic regression model. Further testing of radiomics’ ability to predict Ki-67 expression in pure-solid NSCLC revealed that all three cohorts of radiomics models performed better than clinical models. This suggests that radiomics characteristics models might better predict Ki-67 expression levels in pure-solid NSCLC than prediction algorithms relying solely on clinical factors.
Additionally, we created a nomogram prediction model that combined radiomics signatures and clinical factors. The predictive power of the nomogram model was marginally greater than that of the radiomics model alone, but it outperformed the clinical model. Previous studies only used a single patient dataset and did not perform an external validation (13, 16).
In accordance with previous studies, a cutoff value of 40% was used for the Ki-67 expression in our study. However, other groups applied different cutoffs in their studies (12, 14, 26). Different pathological subtypes of lung cancer may exhibit varying levels of Ki-67 expression. Therefore, different Ki-67 cutoff values may be needed for different cases (27). This may explain the lack of an agreed-upon standard for the Ki-67 PI cutoff value. We intend to explore the predictive value of radiomics for Ki-67 expression using different Ki-67 cutoff values in our follow-up study.
There are several limitations in this study. First, this was a retrospective study, resulting in biased patient selection. Second, although it was a multicenter study with external validation, the sample size was relatively small. Our findings will need to be further validated using larger cohorts of patients. Finally, our study only included squamous cell carcinoma and adenocarcinoma, not other rare types of lung cancer, which may have resulted in some other biases.
The nomogram combining the radiomics signature and clinical features may be helpful, non-invasive, and effective for predicting Ki-67 expression levels in patients with pure-solid NSCLC.
The raw data supporting the conclusions of this article will be made available by the authors, without undue reservation.
The studies involving humans were approved by the institutional ethics committee of the Second Affiliated Hospital, Hengyang Medical School, University of South China. The studies were conducted in accordance with the local legislation and institutional requirements. The participants provided their written informed consent to participate in this study.
FL: Funding acquisition, Investigation, Writing-original draft, Writing. QL: Investigation, Writing-original draft, Writing. XF: Conceptualization, Investigation, Writing – review & editing, Supervision. QY: Conceptualization, Investigation, Writing – review & editing, Supervision. ZX: Data curation, Investigation. YZ: Data curation, Investigation. XL: Investigation, Writing – review & editing. FTL: Data curation, Resources. YH: Data curation, Resources. HL: Data curation, Resources. All authors contributed to the article and approved the submitted version
This work was supported by the Scientific research project of the Hunan Provincial Health Commission of China (202209014713) and Clinical Medical Research Project 4310 of the University of South China (20214310NHYPY01).
Author HL was employed by the company GE Healthcare.
The remaining authors declare that the research was conducted without any commercial or financial relationships that could be construed as a potential conflict of interest.
All claims expressed in this article are solely those of the authors and do not necessarily represent those of their affiliated organizations, or those of the publisher, the editors and the reviewers. Any product that may be evaluated in this article, or claim that may be made by its manufacturer, is not guaranteed or endorsed by the publisher.
CT, computed tomography; PI, proliferation index; NSCLC, non-small cell lung cancer; AUC, the area under the curve; ROC, receiver operating curve; MSCT, multi-slice spiral computed tomography; ROI, region of interest; ICC, intraclass correlation coefficient; mRMR, minimum redundancy maximum relevance; LASSO, least absolute shrinkage and selection operator; DCA, decision curve analysis; LUAD, lung adenocarcinoma; LUSC, lung squamous carcinoma; rad-score, radiomics score; PET/CT, positron emission tomography/computed tomography; MRI, magnetic resonance imaging.
1. Siegel RL, Miller KD, Fuchs HE, Jemal A. Cancer statistics, 2022. CA Cancer J Clin (2022) 72(1):7–33. doi: 10.3322/caac.21708
2. Suzuki K, Kusumoto M, Watanabe S, Tsuchiya R, Asamura H. Radiologic classification of small adenocarcinoma of the lung: radiologic-pathologic correlation and its prognostic impact. Ann Thorac Surg (2006) 81(2):413–9. doi: 10.1016/j.athoracsur.2005.07.058
3. Hattori A, Suzuki K, Takamochi K, Wakabayashi M, Aokage K, Saji H, et al. Prognostic impact of a ground-glass opacity component in clinical stage IA non-small cell lung cancer. J Thorac Cardiovasc Surg (2021) 161(4):1469–80. doi: 10.1016/j.jtcvs.2020.01.107
4. Jamal-Hanjani M, Quezada SA, Larkin J, Swanton C. Translational implications of tumor heterogeneity. Clin Cancer Res (2015) 21(6):1258–66. doi: 10.1158/1078-0432.ccr-14-1429
5. Li Z, Li F, Pan C, He Z, Pan X, Zhu Q, et al. Tumor cell proliferation (Ki-67) expression and its prognostic significance in histological subtypes of lung adenocarcinoma. Lung Cancer (2021) 154:69–75. doi: 10.1016/j.lungcan.2021.02.009
6. Marchevsky AM, Hendifar A, Walts AE. The use of Ki-67 labeling index to grade pulmonary well-differentiated neuroendocrine neoplasms: current best evidence. Mod Pathol (2018) 31(10):1523–31. doi: 10.1038/s41379-018-0076-9
7. Lambin P, Rios-Velazquez E, Leijenaar R, Carvalho S, van Stiphout RG, Granton P, et al. Radiomics: extracting more information from medical images using advanced feature analysis. Eur J Cancer (2012) 48(4):441–6. doi: 10.1016/j.ejca.2011.11.036
8. Zhu M, Yang Z, Zhao W, Wang M, Shi W, Cheng Z, et al. Predicting Ki-67 labeling index level in early-stage lung adenocarcinomas manifesting as ground-glass opacity nodules using intra-nodular and peri-nodular radiomic features. Cancer Med (2022) 11(21):3982–92. doi: 10.1002/cam4.4719
9. Dercle L, Fronheiser M, Lu L, Du S, Hayes W, Leung DK, et al. Identification of non-small cell lung cancer sensitive to systemic cancer therapies using radiomics. Clin Cancer Res (2020) 26(9):2151–62. doi: 10.1158/1078-0432.ccr-19-2942
10. Wu W, Parmar C, Grossmann P, Quackenbush J, Lambin P, Bussink J, et al. Exploratory study to identify radiomics classifiers for lung cancer histology. Front Oncol (2016) 6:71. doi: 10.3389/fonc.2016.00071
11. He R, Yang X, Li T, He Y, Xie X, Chen Q, et al. A machine learning-based predictive model of epidermal growth factor mutations in lung adenocarcinomas. Cancers (Basel) (2022) 14(19):4664. doi: 10.3390/cancers14194664
12. Dong Y, Jiang Z, Li C, Dong S, Zhang S, Lv Y, et al. Development and validation of novel radiomics-based nomograms for the prediction of EGFR mutations and Ki-67 proliferation index in non-small cell lung cancer. Quant Imaging Med Surg (2022) 12(5):2658–71. doi: 10.21037/qims-21-980
13. Fu Q, Liu SL, Hao DP, Hu YB, Liu XJ, Zhang Z, et al. CT radiomics model for predicting the Ki-67 index of lung cance: an exploratory study. Front Oncol (2021) 11:743490. doi: 10.3389/fonc.2021.743490
14. Yan J, Xue X, Gao C, Guo Y, Wu L, Zhou C, et al. Predicting the Ki-67 proliferation index in pulmonary adenocarcinoma patients presenting with subsolid nodules: construction of a nomogram based on CT images. Quant Imaging Med Surg (2022) 12(1):642–52. doi: 10.21037/qims-20-1385
15. Ahn HK, Jung M, Ha SY, Lee JI, Park I, Kim YS, et al. Clinical significance of Ki-67 and p53 expression in curatively resected non-small cell lung cancer. Tumour Biol (2014) 35(6):5735–40. doi: 10.1007/s13277-014-1760-0
16. Yao W, Liao Y, Li X, Zhang F, Zhang H, Hu B, et al. Noninvasive method for predicting the expression of Ki67 and prognosis in non-small-cell lung cancer patients: radiomics. J Healthc Eng (2022) 2022:7761589. doi: 10.1155/2022/7761589
17. Wei DM, Chen WJ, Meng RM, Zhao N, Zhang XY, Liao DY, et al. Augmented expression of Ki-67 is correlated with clinicopathological characteristics and prognosis for lung cancer patients: an up-dated systematic review and meta-analysis with 108 studies and 14,732 patients. Respir Res (2018) 19(1):150. doi: 10.1186/s12931-018-0843-7
18. Gillies RJ, Kinahan PE, Hricak H. Radiomics: images are more than pictures, they are data. Radiology (2016) 278(2):563–77. doi: 10.1148/radiol.2015151169
19. Avanzo M, Stancanello J, El Naqa I. Beyond imaging: The promise of radiomics. Phys Med (2017) 38:122–39. doi: 10.1016/j.ejmp.2017.05.071
20. Caiazzo C, Di Micco R, Esposito E, Sollazzo V, Cervotti M, Varelli C, et al. The role of MRI in predicting Ki-67 in breast cancer: preliminary results from a prospective study. Tumori (2018) 104(6):438–43. doi: 10.5301/tj.5000619
21. Chang C, Zhou S, Yu H, Zhao W, Ge Y, Duan S, et al. A clinically practical radiomics-clinical combined model based on PET/CT data and nomogram predicts EGFR mutation in lung adenocarcinoma. Eur Radiol (2021) 31(8):6259–68. doi: 10.1007/s00330-020-07676-x
22. Yang X, He J, Wang J, Li W, Liu C, Gao D, et al. CT-based radiomics signature for differentiating solitary granulomatous nodules from solid lung adenocarcinoma. Lung Cancer (2018) 125:109–14. doi: 10.1016/j.lungcan.2018.09.013
23. Werynska B, Pula B, Muszczynska-Bernhard B, Piotrowska A, Jethon A, Podhorska-Okolow M, et al. Correlation between expression of metallothionein and expression of Ki-67 and MCM-2 proliferation markers in non-small cell lung cancer. Anticancer Res (2011) 31(9):2833–9. doi: 10.1007/s00520-011-1232-7
24. Winther-Larsen A, Demuth C, Fledelius J, Madsen AT, Hjorthaug K, Meldgaard P, et al. Correlation between circulating mutant DNA and metabolic tumour burden in advanced non-small cell lung cancer patients. Br J Cancer (2017) 117(5):704–09. doi: 10.1038/bjc.2017.215
25. Swanton C. Intratumor heterogeneity: evolution through space and time. Cancer Res (2012) 72(19):4875–82. doi: 10.1158/0008-5472.can-12-2217
26. Zhou B, Xu J, Tian Y, Yuan S, Li X. Correlation between radiomic features based on contrast-enhanced computed tomography images and Ki-67 proliferation index in lung cancer: a preliminary study. Thorac Cancer (2018) 9(10):1235–40. doi: 10.1111/1759-7714.12821
Keywords: radiomics, Ki-67, nomogram, non-small cell lung cancer, multicenter study
Citation: Liu F, Li Q, Xiang Z, Li X, Li F, Huang Y, Zeng Y, Lin H, Fang X and Yang Q (2023) CT radiomics model for predicting the Ki-67 proliferation index of pure-solid non-small cell lung cancer: a multicenter study. Front. Oncol. 13:1175010. doi: 10.3389/fonc.2023.1175010
Received: 27 February 2023; Accepted: 07 August 2023;
Published: 29 August 2023.
Edited by:
John Varlotto, Edwards Comprehensive Cancer Center, United StatesReviewed by:
Zhichao Feng, Central South University, ChinaCopyright © 2023 Liu, Li, Xiang, Li, Li, Huang, Zeng, Lin, Fang and Yang. This is an open-access article distributed under the terms of the Creative Commons Attribution License (CC BY). The use, distribution or reproduction in other forums is permitted, provided the original author(s) and the copyright owner(s) are credited and that the original publication in this journal is cited, in accordance with accepted academic practice. No use, distribution or reproduction is permitted which does not comply with these terms.
*Correspondence: Xiangjun Fang, ZmFuZ3hpYW5nanVuMTE4QDE2My5jb20=; Qinglai Yang, cWluZ3l1NTEzQHVzYy5lZHUuY24=
†These authors have contributed equally to this work and shared first authorship
‡ORCID: Qinglai Yang, orcid.org/0000-0001-9886-5384
Disclaimer: All claims expressed in this article are solely those of the authors and do not necessarily represent those of their affiliated organizations, or those of the publisher, the editors and the reviewers. Any product that may be evaluated in this article or claim that may be made by its manufacturer is not guaranteed or endorsed by the publisher.
Research integrity at Frontiers
Learn more about the work of our research integrity team to safeguard the quality of each article we publish.