 Ren Yuan Lee1,2†
 Chan Way Ng3†
 Menaka Priyadharsani Rajapakse3
 Nicholas Ang3
 Joe Poh Sheng Yeong4,5*
 Mai Chan Lau3,6*
- 1Singapore Thong Chai Medical Institution, Singapore, Singapore
- 2Yong Loo Lin School of Medicine, National University of Singapore, Singapore, Singapore
- 3Singapore Immunology Network (SIgN), Agency for Science, Technology and Research (A*STAR), Singapore, Singapore
- 4Department of Anatomical Pathology, Singapore General Hospital, Singapore, Singapore
- 5Cancer Science Institute of Singapore, National University of Singapore, Singapore, Singapore
- 6Bioinformatics Institute (BII), Agency for Science, Technology and Research (A*STAR), Singapore, Singapore
Growing evidence supports the critical role of tumour microenvironment (TME) in tumour progression, metastases, and treatment response. However, the in-situ interplay among various TME components, particularly between immune and tumour cells, are largely unknown, hindering our understanding of how tumour progresses and responds to treatment. While mainstream single-cell omics techniques allow deep, single-cell phenotyping, they lack crucial spatial information for in-situ cell-cell interaction analysis. On the other hand, tissue-based approaches such as hematoxylin and eosin and chromogenic immunohistochemistry staining can preserve the spatial information of TME components but are limited by their low-content staining. High-content spatial profiling technologies, termed spatial omics, have greatly advanced in the past decades to overcome these limitations. These technologies continue to emerge to include more molecular features (RNAs and/or proteins) and to enhance spatial resolution, opening new opportunities for discovering novel biological knowledge, biomarkers, and therapeutic targets. These advancements also spur the need for novel computational methods to mine useful TME insights from the increasing data complexity confounded by high molecular features and spatial resolution. In this review, we present state-of-the-art spatial omics technologies, their applications, major strengths, and limitations as well as the role of artificial intelligence (AI) in TME studies.
Introduction
Tumour microenvironment (TME) plays an important role in disease progression and clinical outcomes. TME is made up of multiple components including fibroblasts, immunosuppressive cells, immune effector cells, and cytokines (1). Specific T-cell subsets, including CD4+ helper and CD8+ T-cells offer protective immunity (2). On the other hand, tumour-associated macrophages (TAM) which is the most prevalent infiltrating immune cells in the TME can promote tumour growth when accompanied by the activation of fibroblasts. Localization of TAM near invasive borders correlates with unfavorable prognoses in tumors such as colorectal cancer (CRC) (3). Similarly, tumour-associated neutrophils (TANs) can transition from anticancer to pro-tumorigenic phenotypes due to unclear mechanisms (4, 5). TME influences treatment outcomes through multiple mechanisms. In ovarian and lung malignancies, TAM-associated exosomes, which are small membrane-bound vesicles that contain proteins, lipids, and nucleic acids which can be transferred to neighboring cells to influence their physiological behavior, thereby increasing tumour proliferation, apoptosis inhibition and drug resistance (6, 7). TANs were found to have tumour-promoting effects in the lung TME, leading to unfavorable immunotherapy (IO) outcomes (8). Higher mast cell levels in TME were associated with higher PD-L1 expression (9) indicating potential impact on immune checkpoint inhibitor (ICI) efficacy. Increased CD4+ helper T-cells have been postulated to improve IO outcomes through enhancing cytotoxic T-cell response (10). A previous study has shown that phenotypically defined T-cell subsets, rather than overall T-cells, may be useful in predicting therapy outcomes (11).
While traditional immunohistochemistry (IHC) and hematoxylin and eosin (H&E) tissue staining have been used routinely for tumour diagnosis, their low-content limits usefulness in TME analysis. On the other hand, high-throughput technologies such as single-cell RNA-sequencing (scRNAseq) and flow cytometry, despite allowing for high-content molecular profiling, they lose spatial information during tissue dissociation. Additionally, experimental tissue dissociation may result in unexpected cell phenotypic alterations unrepresentative of the actual TME. To address these issues, novel tissue-based spatial omics approaches have recently been developed (12). These advanced spatial techniques enable deep phenotyping, such as distinguishing M1- from M2-polarized macrophages (13) and mature from immature myeloid cells (14), which cannot be achieved with IHC and H&E alone. Additionally, by conserving the spatial information, these techniques allows identification of unique spatial patterns of immune cells in TME with novel biological significance, such as TAM-associated cellular neighborhoods with different antitumor characteristics (15), TMEs with various TAN subtypes linked to prognosis and survival (16), differing states of T cell dysfunction contributing to tumour propagation (17), and ligand-receptor cell interactions (18) associated with various prognoses and treatment outcomes (19). In this review, we will introduce and discuss how state-of-the-art spatial proteomics (SP), spatial transcriptomics (ST) and the utilization of artificial intelligence (AI) approaches that can benefit TME analysis (Figure 1). We will also provide our perspectives on the challenges and future development needed to advance the field of spatial omics.
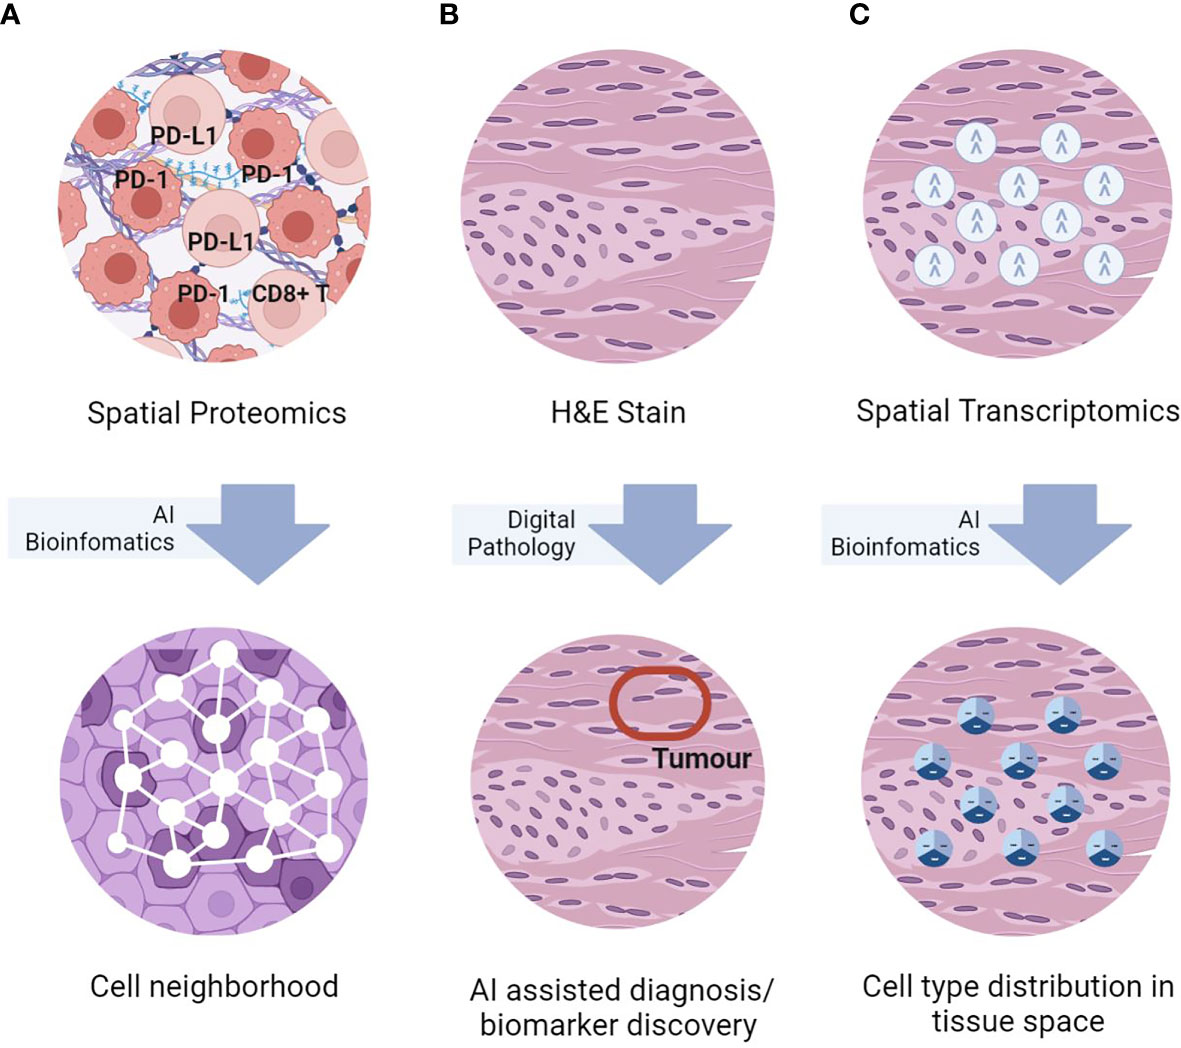
Figure 1 Simplified graphical representations of the three key spatial omics technologies, namely (A) spatial proteomics assays for in-situ single-cell phenotyping using surface marker; (B) H&E staining for histomorphological assessment, and (C) spatial transcriptomics for in-situ transcriptomics characterization, and representative TME analyses enabled by AI bioinformatics.
SP techniques
In this section, we discuss the two major groups of SP techniques, namely fluorescent-labelling and metal isotope-labelling assays (Table 1), which differ in the number of plexing, throughput, resolution, and cost (39).
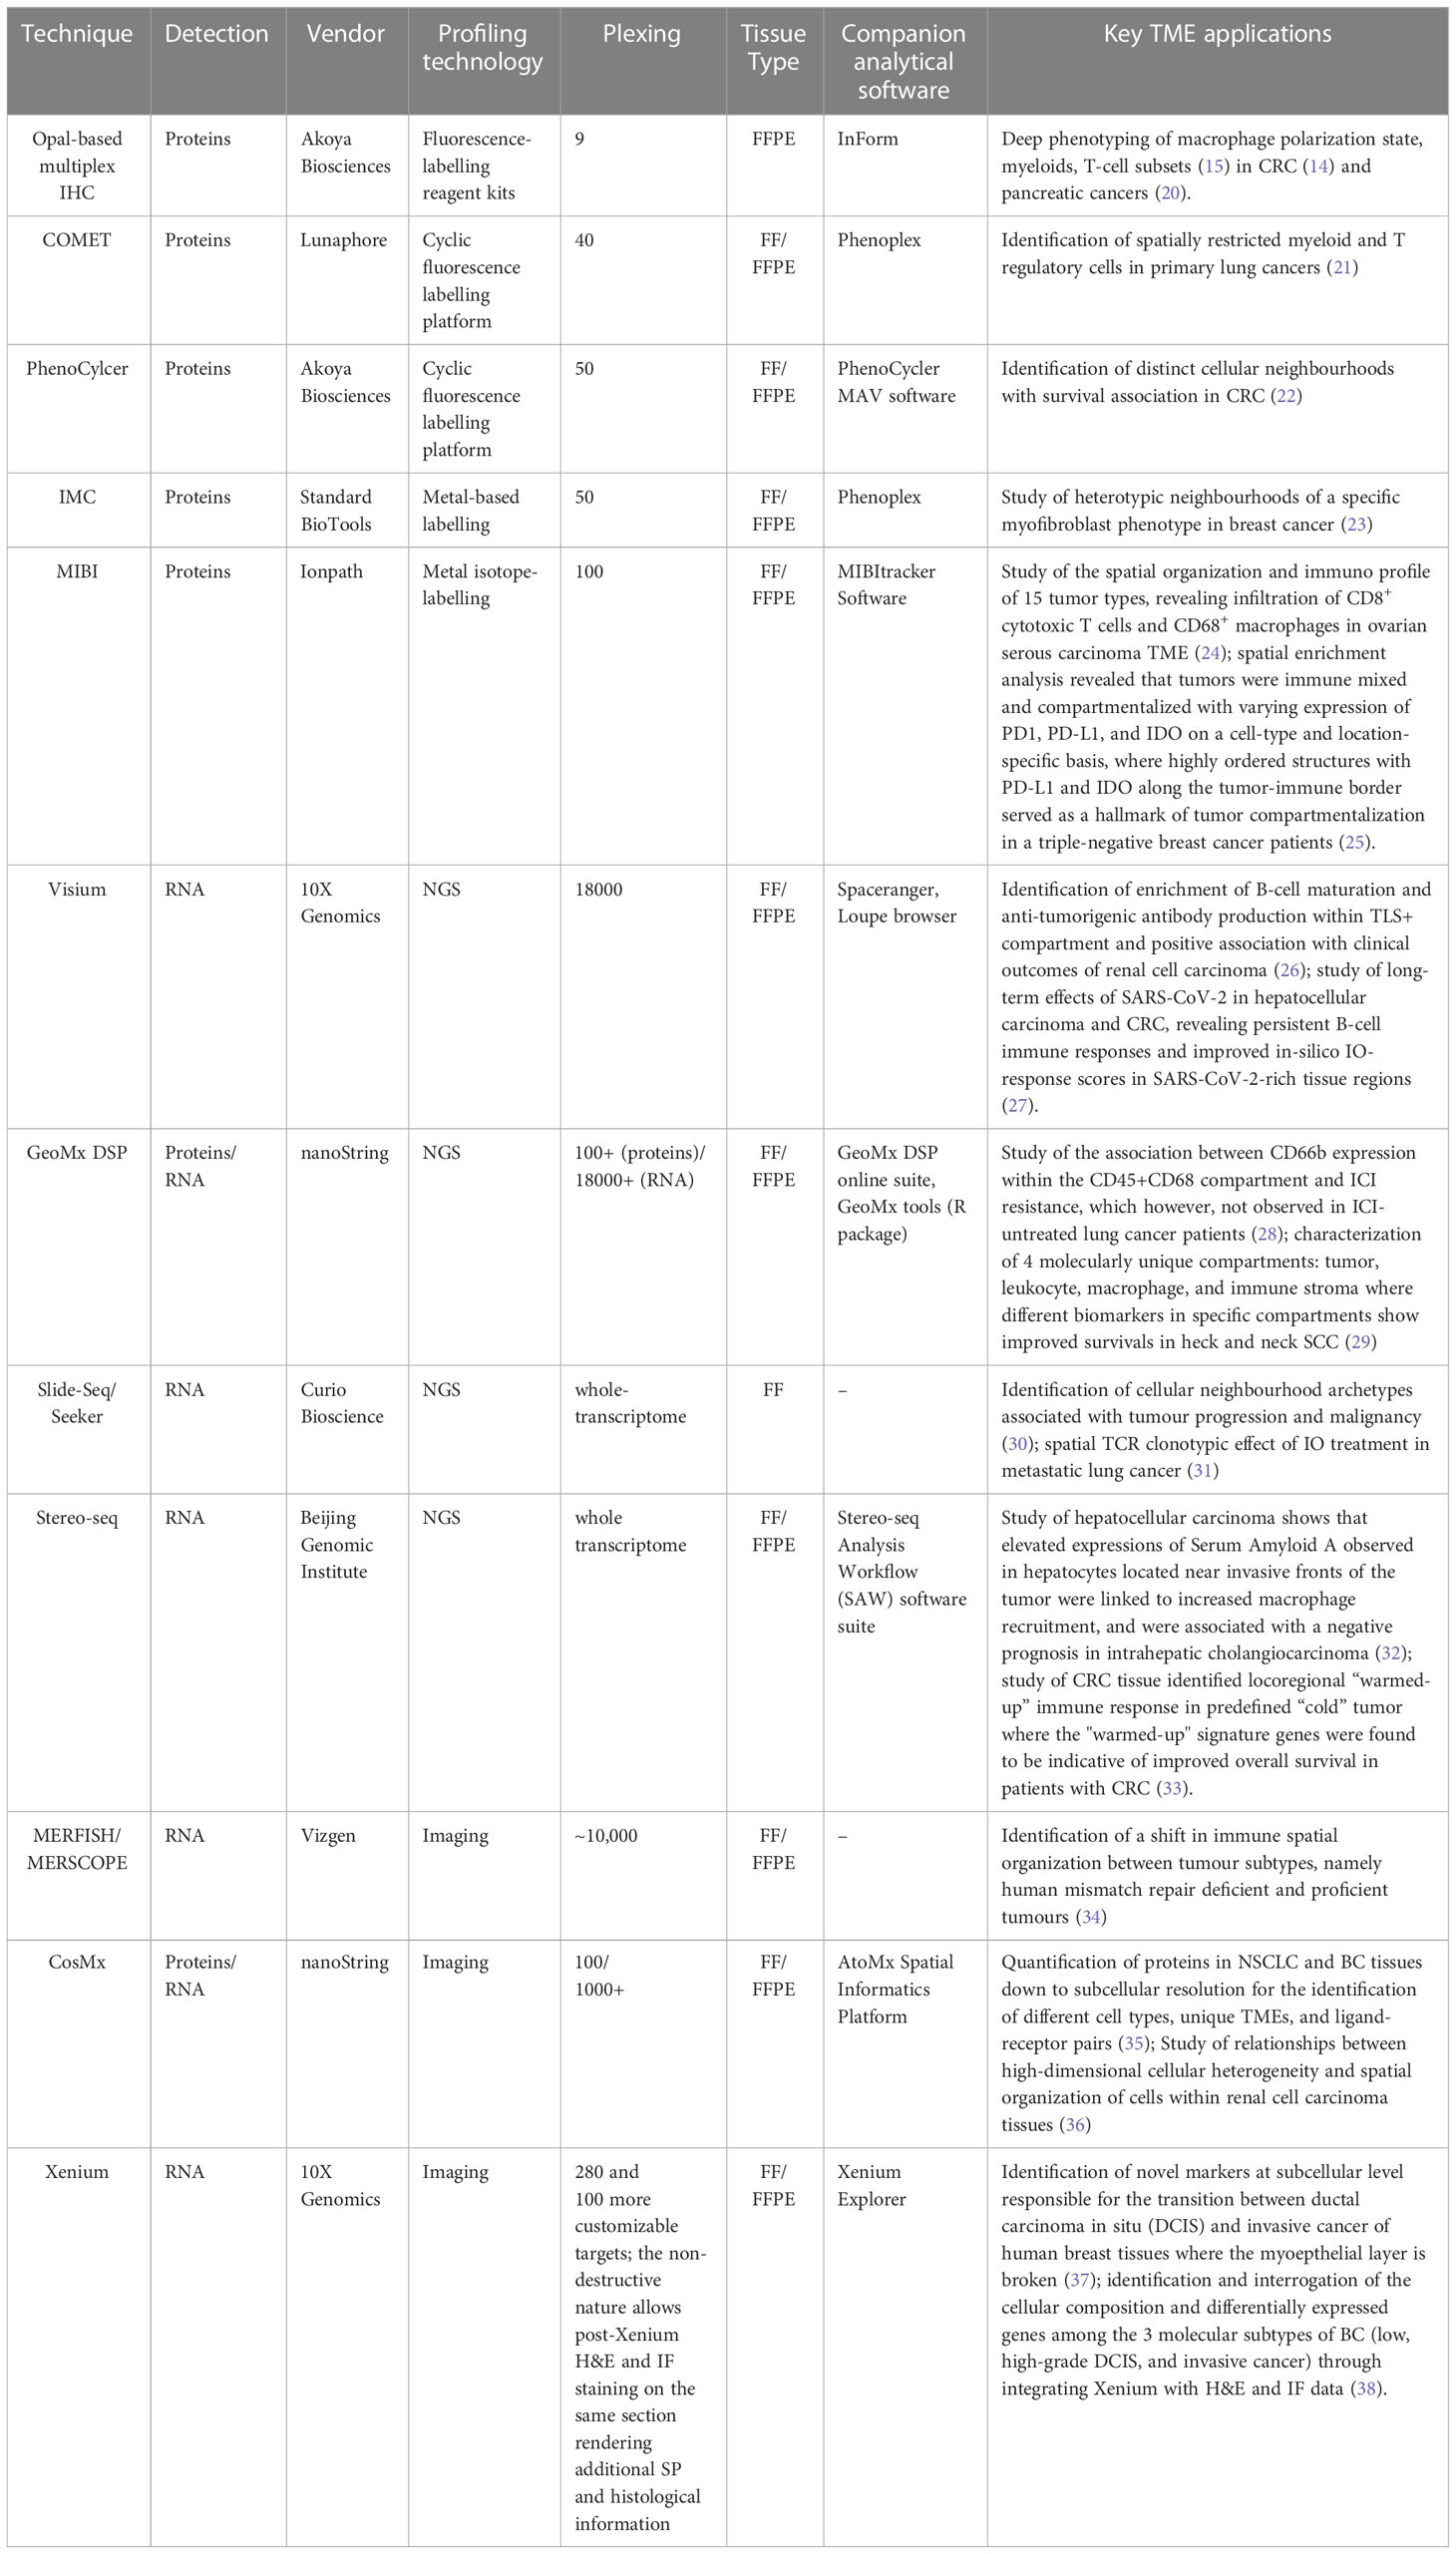
Table 1 Summary of SP and ST techniques as well as their associated applications in TME analysis.
Fluorescence-labelling techniques
OPAL-based multiplex IHC (mIHC)/immunofluorescence (IF) technique allows staining up to 9 markers on a single formalin-fixed, paraffin-embedded (FFPE) tissue section through tyramide signal amplification (TSA). It represents one of the most popular SP techniques for (i) its widely validated consistency against conventional IHC (40, 41); (ii) autostainer availability, particularly BondMax (Leica Biosystems, Germany) for staining consistency (39, 42–45); and (iii) clinical feasibility and usefulness (46–48). The technique has been widely applied for investigating the complex TME through enabling accurate and deep cell phenotyping (e.g., macrophage polarization states, myeloid cell maturity and immunosuppressivity, and T cell phenotypes) (13), revealing the spatial heterogeneity of immune cells (49–51), and characterizing immune localization patterns associated with patient survivals or treatment outcomes (20). Using proximity analysis, Feng et al. showed that hampered survival outcomes of oral squamous cell cancers (SCC) was associated with CD8+ T-cells surrounded by immunosuppressive FoxP3+ or PD-L1+ cells (52); Väyrynen et al. showed that CRC patients with mature monocytic cell (CD14+HLADR+) closer to tumour cells harbored better survival (14). One disadvantage of OPAL-based mIHC/IF technique is the possibility of physical steric hindrance caused by multiple antibodies at a single site, resulting in noisy signals (53).
To enable comprehensive immune profiling, hyper-plex cyclic mIHC/IF techniques have been developed, including COMET (Lunaphore, Switzerland) and PhenoCycler (Akoya Biosciences, USA). COMET provides an automated workflow cycling through staining, imaging, and elution of 3 markers each time, up to 40 markers in the same tissue section, whereby fluorophores are directly attached to secondary antibodies without TSA. This approach not only reduces steric hindrance with lesser markers per cycle, but also enhances signal stability through reducing incubation time (i.e., tissue exposure time to harsh reagents). Using a 40-plex COMET assay, Almeida et al. found that myeloid and T regulatory cells were spatially restricted in primary lung cancers (21). Using machine learning (ML), the authors also identified distinct subsets of myeloid cells within the same TME.
To further reduce the steric hindrance effect, PhenoCylcer (formerly CODEX) replaces the large molecular secondary antibodies in the OPAL approach with DNA-conjugated antibodies tagged to fluorescent reporters, allowing staining of up to 50 markers (3 per cycle). Applying tensor decomposition, cell-type differential enrichment and canonical correlation analysis on PhenoCycler data, Schürch et al. found 9 distinct cellular neighborhoods associated with survival outcomes which were conserved across 35 CRC samples (22).
Metal isotope-labelling techniques
Metal-based methods employ stable metal isotopes to replace the fluorophores (54), where protein expression is measured by detecting isotope signals using laser scanning or ion beams. Autofluorescence and background noise can be considerably reduced with endogenous metals (55). Imaging mass cytometry (IMC) (Standard BioTools, USA) uses high-resolution scanning laser ablation (a fixed lateral resolution of 1,000nm) followed by mass cytometry to quantify up to 50 markers at subcellular resolution using fresh frozen (FF)/FFPE tissues (56–58). Using 37-plex IMC, Ali et al. identified heterotypic neighborhoods of a specific myofibroblast phenotype which was associated with poor outcomes in breast cancer (BC) (23).
Another metal-based method, multiplexed ion beam imaging (MIBI) (Ionpath, USA) uses a tuneable ion beam voltage and mass spectrometry to detect molecules of interest (24), analyzing up to 100 markers at subcellular resolution using FF/FFPE tissues (25, 59, 60). Ptacek et al. validated the robustness, sensitivity, and reproducibility of MIBI against individual IHC stains (24), while Angelo et al. and Rost et al. tested the consistency of MIBI against IHC procedures for estrogen receptor alpha, progesterone receptor and human epidermal growth factor receptor 2 using FFPE BC samples (60, 61). ML techniques have been extensively used in these MIBI studies for rapid exploration and analysis of data for novel discoveries. For examples, Keren et al. developed a computational pipeline to chart the immune landscape in triple-negative breast cancer. In their pipeline, they employed multiple ML techniques such as DeepCell for cell segmentation, k-nearest neighbor algorithm for noise filtering, quantile normalization for batch effects correction, and hierarchical clustering to identify unique and shared spatial interactions among patients (25). Padmanabhan et al. built multiple DL models for segmentation of cells and regions, and for cell classification. A containerized cluster platform that can run a workflow comprising of pre-trained DL models as directed acyclic graph has been used to accelerate the discovery of associations and spatial patters in TME (26). Authors in (23, 60) used CellProfiler, an image analysis tool encompassing number of ML algorithms such as random forest, principal component analysis, and neural networks (NN) to understand phenotypic impact of genomic alterations and to gain new insights from the combination of tissue microarchitecture with multiplexed protein expression patterns, respectively.
ST techniques
ST methods can be broadly categorized into next-generation sequencing (NGS)-based and imaging-based methods, measuring either near whole-transcriptome at multi-cell (10s to hundreds) resolution or selected genes at subcellular spatial resolution. NGS-based methods acquire spatial transcriptomic data by attaching and sequencing unique barcodes to cell subsets in designated tissue areas such as a lattice of evenly spaced spots, user-marked regions, or marker-stained regions. This untargeted nature of NGS based methods make them suitable for exploratory studies (62). Imaging-based methods quantify transcripts in-situ through direct imaging of fluorescence dyes of the nucleic acid bases (termed in-situ sequencing) or the target-specific/bound fluorophore (termed in-situ hybridization (ISH)).
NGS-based ST techniques
Visium Spatial Gene Expression (10x Genomics, USA) enables genome-wide ST profiling of FF/FFPE tissues. The slide capture area (6.5mm2) contains ~5,000 spots, each with a 55 μm diameter. Using Visium, Meylan et al. examined the B-cell response within intratumoral tertiary lymphoid structures (TLS) in renal cell carcinoma, and found positive clinical outcomes associated with intratumoral TLS+ regions enriched with B-cell maturation and anti-tumorigenic antibody production (26); Lau et al. examined the long-term effects of SARS-CoV-2 in hepatocellular carcinoma and CRC, revealing persistent B-cell immune responses and improved in-silico IO-response scores in SARS-CoV-2-rich tissue regions (27). Another genome-wide ST method, Slide-seq (Applied Biotechnology Laboratory, UK), offers higher resolution (10 µm) read-outs with a comparable capture area (in mm-range), but is limited to FF tissues (30, 63, 64). Using Slide-seq, Avraham-Davidi et al. revealed three distinct cellular neighborhood archetypes associated with tumour progression and malignancy (30). Liu et al. further developed Slide-T cell receptor (TCR)-seq and identified 1,132 unique clonotypes, some localized in restricted tissue compartments in metastatic lung cancer post anti-PD-1 therapy, revealing spatial clonotypic effect of IO treatment (31).
GeoMx digital spatial profiler (DSP) (Nanostring, USA) is capable of simultaneous ST (thousands to tens of thousands of genes) and SP (1 nuclear and 3 surface markers) profiling of FF/FFPE tissues of up to 36.2mm x 14.6mm in size (65). RNAs and proteins are quantified through oligonucleotide tagging (with RNA probes or antibodies, respectively), photocleaving, and sequencing. DSP studies showed that higher lymphoid infiltrates and T-cell clonality in the TME were associated with improved IC efficacy (66, 67); CD66b expression in the CD45+CD68 molecular compartment was linked to IO therapy resistance in lung cancers (28); B2M and CD25 levels in tumour and CD11c in stroma were correlated with prolonged survival in head and neck SCC (29).
To address key shortfalls of the abovementioned ST methods (i.e., the lack of single-cell resolution read-outs), Stereo-seq (BGI, China) offers unbiased whole-transcriptomic profiling at subcellular resolution with a maximum 1 cm2 capture area on FF/FFPE tissues. Using Stereo-seq, Wu et al. showed that poorer prognoses of intrahepatic cholangiocarcinoma and hepatocellular carcinoma were associated with tumour boundaries enriched with damaged hepatocytes, or serum amyloid A overexpression in invasive fronts (32); Zhang et al. found a locoregional immune “warmed-up” phenotype with enhanced cytokine secretion and upregulated MHC-II expression in a predefined “cold” tumour of colorectal adenocarcinoma (33). A major challenge with Stereo-seq analysis lies with assigning pixel-level signals to individual cells (32).
Imaging-based techniques
Multiplex error robust fluorescence in situ hybridization (MERFISH) (Vizgen, UK) uses a combinatorial barcoding approach and sequential rounds of imaging to decode the barcode and its associated gene expression. The barcoding system confers error robustness through assigning the erroneous readout to the nearest correct barcode. MERFISH allows profiling of up to tens of thousands of RNA species at subcellular resolution, with a maximum 1 cm2 capture area of FF/FFPE tissues. Using a 450-gene MERFISH panel, Price et al. reported a shift in immune spatial organization between the two tumour subtypes i.e., human mismatch repair deficient and proficient tumors, opening new avenues for tumour subtype-specific treatment strategies (34).
Two other multi-spatial omics methods, namely CosMx spatial molecular imaging (SMI) technique and Xenium (higher-resolution advancement from DSP and Visium, respectively), enable simultaneous ST and SP profiling of FF/FFPE tissues at subcellular resolution. CosMx SMI allows up to 1000-plex and offers 64 validated protein analytes (35, 36). Using CosMx, He et al. (35) evaluated 980 RNAs and 108 proteins in lung cancer and BC tissues, identifying over 18 different cell-types, 10 unique TMEs, and 100 ligand-receptor pairs. While Xenium offers a 280-plex human breast panel and 248-plex mouse brain panel, with additional 100 customizable targets. Due to its non-destructive nature, Xenium allows post-ST H&E staining and IF on the same section, offering additional SP and histological data. Using Xenium, Henley et at. revealed that invasive fronts of ductal carcinoma in situ (DCIS) BC were characterized by disrupted myoepithelial layers, and low KRT14 expression which were also positive for progesterone receptor (37); Janesick et al. predicted the hormone receptor status of three BC subtypes (low-grade and high-grade DCIS, and invasive carcinoma) whose molecular signatures were also characterized using whole-transcriptomics Visium on adjacent tissue sections (38).
AI-enabled TME analysis
Digital pathology
With recent advancements in imaging techniques and computer vision, DP has greatly emerged as a useful diagnosis assisting and prediction tool (68), alleviating the high labor cost and interobserver variability issues faced by conventional microscope-based approach (69–73). While H&E-stained histomorphology images remain the main imaging modality in DP, the use of mIHC/IF to enable subcellular molecular profiling has become popular (74).
Numerous studies use deep learning (DL) models to augment DP, greatly advancing TME analysis. DL-based cell segmentation algorithms, such as Cellpose (75) and Stardist (76), enable identification of individual nuclei, facilitating downstream cell phenotyping. Supervised DL algorithms have been developed to differentiate benign from malignant cells, and immune from stromal cells (71, 77–79). These approaches are limited by the availability of training labels, resulting in the development of unsupervised approaches (80). Novel AI approaches, such as Ronteix (81), for investigating cell-to-cell interaction have also attracted increasing attention. Besides, as image quality and stain consistency impact the performance of DP studies, several AI algorithms have been developed for stain normalization through color deconvolution (82), clustering in the hue-saturation-value color space for color separation (72) or DL-empowered stain-to-stain translation (83).
SP analytic methods
SP analysis involves image pre-processing to remove background or technical noise, cell segmentation, feature extraction (such as signal intensity, cellular area, and shape), cell phenotyping and spatial analysis (Supplementary Table 1). While image pre-processing steps differ across fluorescence-based and metal-based assays, downstream spatial analysis using extracted cell-level data are largely similar.
Composite multi-spectral images generated with fluorescence-based techniques are firstly unmixed whereby the pixel values are decomposed into the constituent pure spectrum (i.e., protein markers). Spectral unmixing can be done using software like inForm (Akoya Biosciences). Similarly, background subtraction and noise removal are critical steps in pre-processing the multi-channel images acquired from metal-based techniques; each channel portraying the abundance of a protein. Moreover, technique-specific filtering may also be needed – specifically, aggregate removal in MIBI data to eliminate unwanted effects from antibody aggregation, and hot pixels filtering to remove IMC-specific noise (25, 84)
Various cell (or object) segmentation algorithms are deployed in different image analysis tools. To this end, CellProfiler (85) offers several classical image processing approaches; whilst Ilastik (86) offers pixel-based random forest and NN approaches accounting for texture and context that can better identify cells, where both methods require user-input labels such as nuclei and background. Segmentation masks generated by Illastik can serve as the training labels in CellProfiler. These cell segmentation algorithms have been integrated into end-to-end SP analysis pipelines, including IMC Segmentation (87) and its dockerized counterpart, Steinbock (84), adding on to the built-in DL-based Mesmer method (88). More generic image analysis tools including QuPath (89) and ImageJ (90) provides built-in cell segmentation algorithm and allows customized algorithms such as Stardist (91, 92).
There are currently two main cell phenotyping approaches, namely user-input thresholding or rule-based approach, and ML-based supervised approach which require cell label training (93). Using Halo (Indica Labs), Ozbek et al. (94) built a T-cell classifier and computed the densities of 8 different T-cell phenotypes in the tumour epithelial and stromal regions in prostate cancer. Furthermore, dedicated tools for proximity analysis, such as SPIAT (95), HistoCAT (56), imcRtools (84) and Cytomapper (96), have also been developed. These tools enable inter-cellular distance computation, touching-cell counts, cell neighborhood identification, cell-type mixing score, spatial point pattern measures (such as K-cross function), spatial heterogeneity (such as entropy), and immune gradients across tumour margins. Like many methodology studies, these works largely focused on demonstrating evident spatial immunological scenarios in individual cases. For instance, in the SPIAT work, it showed that tumour cells were closely interacting with CD3+CD4+ and CD3+CD8+ cells in one prostate cancer sample, while showing the high levels of SOX10+ tumour cells did not co-exist with the CD4+ immune cells in another prostate cancer sample. Nonetheless, HistoCAT study demonstrated a real oncology case wherein it revealed the enrichment and depletion of cell-cell interactions was associated with breast cancer development.
ST analytic methods
Several open-source R tools, such as Seurat (97), standR (98), GeoMxTools (99) and Giotto (100), enable end-to-end ST analysis, from data preprocessing (read mapping and quality checking), spatial clustering, spatially variable gene (SVG) identification, cell-type deconvolution to cell-cell communication. Besides these tools, various algorithms to enhance the performance of individual steps have emerged (Supplementary Table 2).
Spatial clustering groups spots (neighboring cells) with similar transcriptional profile and characterizes unique transcriptomics niche of the TME (101). These include autoencoder-based methods [such as STAGATE (102), SEDR (103), MAPLE (104), and conST (105)], deep convolution neural network (CNN) methods [such as coSTA (106), RESEPT (107), spaGCN (108), stLearn (109) and spaCell (110), and probabilistic methods (BayesSpace (111) and PRECAST (112)]. SVGs are genes with expression patterns significantly dependent on their spatial locations in the tissues. These include a neural network (NN) method called SOMDE (113); regression modelling methods such as SPARK (114) that uses a generalized linear regression to model the mean-variance relation of NGS-based or imaging-based ST data; SpatialDE (115) uses Gaussian process regression model to decompose gene expression variability into spatial and non-spatial components, tested on SeqFISH and MERFISH data; scGCO (116) addresses the key challenge in SVG analysis, i.e., scalability, by employing a hidden markov random field-based probabilistic graph model, tested on SeqFISH, MERFISH and, 3D ST data (STARmap) (117).
Cell-type deconvolution infers cell composition of the multi-cell ST data, facilitating cell-type specific analysis. These include a Bayesian modelling method called DestVI (118); methods that infer spatial cell composition from scRNAseq data such as CellDART (119) and Tangram (120); a graph-based CNN method called DSTG (121) which was used to uncover cell states of pancreatic tumor tissues. On the other hand, the ability of ST to localize gene expression to specific cell phenotypes in the TME allows effective characterization of cellular communication, which is either through cell-cell direct contact or cell signaling of neighboring cells (122). Analytic tools developed for cellular communication include a scalable random forest-based method called MISTy (123), tested on human BC Visium data; a graph NN method called NCEM (124), tested on MERFISH, PhenoCylcer, and MIBI; a graph CNN model based on a curated list of interacting ligands and receptors, called GCNG (125), tested on SeqFISH and MERFISH.
Aforementioned methods have been mainly focused on showcasing specific ST analytic methods. Studies that involve real oncology use cases are given in (103, 111, 112). In the work of SEDR, the authors analyzed the role of immune microenvironments on tumor invasiveness by clustering the TME into pro-inflammatory and anti-inflammatory regions (103); the authors of PRECAST revealed distinguished tumor/normal epithelial regions in hepatocellular cancers that associated with different signaling pathways, providing higher resolution analysis of the dynamics of tumorigenesis (112); using BayesSpace, Zhao et al. found that a higher level of chemokine activity at the tumor border and an elevated level of metastatic activities at the tumor center that could aid in clinical analysis of cancer metastasis (111).
Discussion and future perspectives
Significant advancements in spatial omics and computational techniques have unraveled many previously underappreciated roles of immune contexture in cancer progression, immune evasion, and treatment effect, enhancing our understanding of cancer immunology and helping to pave the way towards precision medicine through developing novel therapeutic targets and spatial biomarkers. Increasing evidence show that the phenotypic and functional states of cells, and thus their anti-tumorigenicity, are determined collectively by the DNA, RNA, and protein expression (126–129). Nonetheless, alternative computational solutions for integrating multiple single-spatial omics data represent a valuable resource given tremendous data have been generated separately and available in the public domain. It is also worth to note that recent development of computational methods for cohort analysis reveals important clinical implications by associating immune spatial patterns with treatment response (130, 131).
In our perspective, several challenges in spatial omics need to be addressed. Firstly, advancement in antibody development, automated workflow, image scanning quality and speed, and multi-omics integrative algorithms are needed to enhance robustness, dimensionality, and spatial resolution. Secondly, consistent and quality data is a prerequisite for clinical translation. Several taskforces, such as the Society for Immunotherapy of Cancer (132) and the Joint Effort to Develop Multiplex Immunofluorescence Standards (133), gather international efforts to standardize the workflow of OPAL-based assays, with similar efforts needed for other spatial omics techniques. Thirdly, existing computational tools often require extensive user inputs, such as number of clusters or neighbors, and distance threshold, which hinders adoption. Finally, effective cross-spatial-modality data integration and results interpretation for comprehensive understanding of the biological system remains challenging, largely due to the variations in image format, scanning techniques, sample handling as well as the demanding requirement of computing power and data storage. When these challenges are addressed, robust, affordable, and insightful spatial TME studies may then be possible in helping advancing precision cancer immunology.
Author contributions
RL and CN contributed equally. All authors contributed to the article and approved the submitted version.
Funding
This work was supported by the Bioinformatics Institute and Singapore Immunology Network, Agency for Science, Technology and Research (A*STAR), and A*STAR Industry Alignment Fund-Pre-positioning (IAF-PP H19/01/a0/024).
Conflict of interest
The authors declare that the research was conducted in the absence of any commercial or financial relationships that could be construed as a potential conflict of interest.
Publisher’s note
All claims expressed in this article are solely those of the authors and do not necessarily represent those of their affiliated organizations, or those of the publisher, the editors and the reviewers. Any product that may be evaluated in this article, or claim that may be made by its manufacturer, is not guaranteed or endorsed by the publisher.
Supplementary material
The Supplementary Material for this article can be found online at: https://www.frontiersin.org/articles/10.3389/fonc.2023.1172314/full#supplementary-material
References
1. Hinshaw DC, Shevde LA. The tumor microenvironment innately modulates cancer progression. Cancer Res (2019) 79(18):4557–66. doi: 10.1158/0008-5472.CAN-18-3962
2. Martin-Orozco N, Muranski P, Chung Y, Yang XO, Yamazaki T, Lu S, et al. T Helper 17 cells promote cytotoxic T cell activation in tumor immunity. Immunity (2009) 31(5):787–98. doi: 10.1016/j.immuni.2009.09.014
3. Wei C, Yang C, Wang S, Shi D, Zhang C, Lin X, et al. Crosstalk between cancer cells and tumor associated macrophages is required for mesenchymal circulating tumor cell-mediated colorectal cancer metastasis. Mol Cancer (2019) 18(1):64. doi: 10.1186/s12943-019-0976-4
4. Granot Z, Fridlender ZG. Plasticity beyond cancer cells and the “Immunosuppressive switch”. Cancer Res (2015) 75(21):4441–5. doi: 10.1158/0008-5472.CAN-15-1502
5. Powell DR, Huttenlocher A. Neutrophils in the tumor microenvironment. Trends Immunol (2016) 37(1):41–52. doi: 10.1016/j.it.2015.11.008
6. Zhu X, Shen H, Yin X, Yang M, Wei H, Chen Q, et al. Macrophages derived exosomes deliver miR-223 to epithelial ovarian cancer cells to elicit a chemoresistant phenotype. J Exp Clin Cancer Res (2019) 38(1):81. doi: 10.1186/s13046-019-1095-1
7. Dong C, Liu X, Wang H, Li J, Dai L, Li J, et al. Hypoxic non-small-cell lung cancer cell-derived exosomal miR-21 promotes resistance of normoxic cell to cisplatin. Onco Targets Ther (2019) 12:1947–56. doi: 10.2147/OTT.S186922
8. Wculek SK, Malanchi I. Neutrophils support lung colonization of metastasis-initiating breast cancer cells. Nature (2015) 528(7582):413–7. doi: 10.1038/nature16140
9. Lv Y, Zhao Y, Wang X, Chen N, Mao F, Teng Y, et al. Increased intratumoral mast cells foster immune suppression and gastric cancer progression through TNF-α-PD-L1 pathway. J Immunother Cancer (2019) 7(1):54. doi: 10.1186/s40425-019-0530-3
10. Borst J, Ahrends T, Bąbała N, Melief CJM, Kastenmüller W. CD4(+) T cell help in cancer immunology and immunotherapy. Nat Rev Immunol (2018) 18(10):635–47. doi: 10.1038/s41577-018-0044-0
11. Wei SC, Levine JH, Cogdill AP, Zhao Y, Anang NAS, Andrews MC, et al. Distinct cellular mechanisms underlie anti-CTLA-4 and anti-PD-1 checkpoint blockade. Cell (2017) 170(6):1120–33.e17. doi: 10.1016/j.cell.2017.07.024
12. Millian DE, Saldarriaga OA, Wanninger T, Burks JK, Rafati YN, Gosnell J, et al. Cutting-edge platforms for analysis of immune cells in the hepatic Microenvironment—Focus on tumor-associated macrophages in hepatocellular carcinoma. Cancers (2022) 14(8):1861. doi: 10.3390/cancers14081861
13. Väyrynen JP, Haruki K, Lau MC, Väyrynen SA, Zhong R, Dias Costa A, et al. The prognostic role of macrophage polarization in the colorectal cancer microenvironment. Cancer Immunol Res (2021) 9(1):8–19. doi: 10.1158/2326-6066.CIR-20-0527
14. Väyrynen JP, Haruki K, Väyrynen SA, Lau MC, Dias Costa A, Borowsky J, et al. Prognostic significance of myeloid immune cells and their spatial distribution in the colorectal cancer microenvironment. J Immunother Cancer (2021) 9(4). doi: 10.1136/jitc-2020-002297
15. Sheng J, Zhang J, Wang L, Tano V, Tang J, Wang X, et al. Topological analysis of hepatocellular carcinoma tumour microenvironment based on imaging mass cytometry reveals cellular neighbourhood regulated reversely by macrophages with different ontogeny. Gut (2022) 71(6):1176–91. doi: 10.1136/gutjnl-2021-324339
16. Xue R, Zhang Q, Cao Q, Kong R, Xiang X, Liu H, et al. Liver tumour immune microenvironment subtypes and neutrophil heterogeneity. Nature (2022) 612(7938):141–7. doi: 10.1038/s41586-022-05400-x
17. Thommen DS. Schumacher TN. T cell dysfunction in cancer. Cancer Cell (2018) 33(4):547–62. doi: 10.1016/j.ccell.2018.03.012
18. Tran M, Yoon S, Min S, Andersen S, Devitt K, Lam P, et al. Spatial analysis of ligand-receptor interactions in skin cancer at genome-wide and single-cell resolution. bioRxiv (2020). 2020.09.10.290833. doi: 10.1101/2020.09.10.290833
19. Yu Q, Jiang M, Wu L. Spatial transcriptomics technology in cancer research. Front Oncol (2022) 12:1019111. doi: 10.3389/fonc.2022.1019111
20. Väyrynen SA, Zhang J, Yuan C, Väyrynen JP, Dias Costa A, Williams H, et al. Composition, spatial characteristics, and prognostic significance of myeloid cell infiltration in pancreatic cancer. Clin Cancer Res (2021) 27(4):1069–81. doi: 10.1158/1078-0432.CCR-20-3141
21. Almeida PM, Rivest F, Juppet Q, Kowal J, Pelz B, Cassano M, et al. Abstract 1716: mapping the cellular architecture of the tumor microenvironment by integrating hyperplex immunofluorescence and automated image analysis. Cancer Res (2022) 82(12_Supplement):1716. doi: 10.1158/1538-7445.AM2022-1716
22. Schürch CM, Bhate SS, Barlow GL, Phillips DJ, Noti L, Zlobec I, et al. Coordinated cellular neighborhoods orchestrate antitumoral immunity at the colorectal cancer invasive front. Cell (2020) 182(5):1341–59.e19. doi: 10.1016/j.cell.2020.07.005
23. Ali HR, Jackson HW, Zanotelli VRT, Danenberg E, Fischer JR, Bardwell H, et al. Imaging mass cytometry and multiplatform genomics define the phenogenomic landscape of breast cancer. Nat Cancer (2020) 1(2):163–75. doi: 10.1038/s43018-020-0026-6
24. Ptacek J, Locke D, Finck R, Cvijic ME, Li Z, Tarolli JG, et al. Multiplexed ion beam imaging (MIBI) for characterization of the tumor microenvironment across tumor types. Lab Invest (2020) 100(8):1111–23. doi: 10.1038/s41374-020-0417-4
25. Keren L, Bosse M, Marquez D, Angoshtari R, Jain S, Varma S, et al. A structured tumor-immune microenvironment in triple negative breast cancer revealed by multiplexed ion beam imaging. Cell (2018) 174(6):1373–87.e19. doi: 10.1016/j.cell.2018.08.039
26. Meylan M, Petitprez F, Becht E, Bougoüin A, Pupier G, Calvez A, et al. Tertiary lymphoid structures generate and propagate anti-tumor antibody-producing plasma cells in renal cell cancer. Immunity (2022) 55(3):527–41.e5. doi: 10.1016/j.immuni.2022.02.001
27. Lau MC, Yi Y, Goh D, Cheung CCL, Tan B, Lim JCT, et al. Case report: understanding the impact of persistent tissue-localization of SARS-CoV-2 on immune response activity via spatial transcriptomic analysis of two cancer patients with COVID-19 co-morbidity. Front Immunol (2022) 13:978760. doi: 10.3389/fimmu.2022.978760
28. Moutafi M, Martinez-Morilla S, Divakar P, Vathiotis I, Gavrielatou N, Aung TN, et al. Discovery of biomarkers of resistance to immune checkpoint blockade in NSCLC using high-plex digital spatial profiling. J Thorac Oncol (2022) 17(8):991–1001. doi: 10.1016/j.jtho.2022.04.009
29. Gavrielatou N, Vathiotis I, Aung TN, Shafi S, Burela S, Fernandez A, et al. Digital spatial profiling to uncover biomarkers of immunotherapy outcomes in head and neck squamous cell carcinoma. J Clin Oncol (2022) 40(16_suppl):6050. doi: 10.1200/JCO.2022.40.16_suppl.6050
30. Avraham-Davidi I, Mages S, Klughammer J, Moriel N, Imada S, Hofree M, et al. Integrative single cell and spatial transcriptomics of colorectal cancer reveals multicellular functional units that support tumor progression. bioRxiv (2022). 2022.10.02.508492. doi: 10.1101/2022.10.02.508492
31. Liu S, Iorgulescu B, Li S, Morriss J, Borji M, Murray E, et al. 76 spatial mapping of T cell receptors and transcriptomes in renal cell carcinoma following immune checkpoint inhibitor therapy. J ImmunoTher Cancer (2021) 9(Suppl 2):A84–A5. doi: 10.1136/jitc-2021-SITC2021.076
32. Wu L, Yan J, Bai Y, Chen F, Xu J, Zou X, et al. Spatially-resolved transcriptomics analyses of invasive fronts in solid tumors. bioRxiv (2021). 2021.10.21.465135. doi: 10.1101/2021.10.21.465135
33. Zhang R, Feng Y, Ma W, Guo Y, Luo M, Li Y, et al. Spatial transcriptome unveils a discontinuous inflammatory pattern in proficient mismatch repair colorectal adenocarcinoma. Fundam Res (2022). doi: 10.1016/j.fmre.2022.01.036
34. Price C, Chen JH, Pelka K, Chao S, Therrien M, Wiggin T, et al. Abstract 2030: a single-cell spatially resolved map of colorectal cancer identifies novel spatial relationships between cancer cells and the microenvironment. Cancer Res (2022) 82(12_Supplement):2030. doi: 10.1158/1538-7445.AM2022-2030
35. He S, Bhatt R, Brown C, Brown EA, Buhr DL, Chantranuvatana K, et al. High-plex multiomic analysis in FFPE at subcellular level by spatial molecular imaging. bioRxiv (2022). 2021.11.03.467020. doi: 10.1101/2021.11.03.467020
36. Newell E, Kim Y, Ryu H, Li S, Leon M, Kim S, et al. 50 In-situ visualization and measurement of tumor-infiltrating lymphocytes (TILs) on intact FFPE renal cell carcinoma (RCC) tissue using the spatial molecular imager (SMI). J ImmunoTher Cancer (2021) 9(Suppl 2):A57–A. doi: 10.1136/jitc-2021-SITC2021.050
37. Henley R, Rapicavoli N, Janesick A, Shelansky R, Kim A, Hensel J, et al. 95 characterization of human breast cancer tissue with the xenium In Situ platform reveals a novel marker for invasiveness. J ImmunoTher Cancer (2022) 10(Suppl 2):A104–A. doi: 10.1136/jitc-2022-SITC2022.0095
38. Janesick A, Shelansky R, Gottscho AD, Wagner F, Rouault M, Beliakoff G, et al. High resolution mapping of the breast cancer tumor microenvironment using integrated single cell, spatial and in situ analysis of FFPE tissue. bioRxiv (2022). 2022.10.06.510405. doi: 10.1101/2022.10.06.510405
39. Tan WCC, Nerurkar SN, Cai HY, Ng HHM, Wu D, Wee YTF, et al. Overview of multiplex immunohistochemistry/immunofluorescence techniques in the era of cancer immunotherapy. Cancer Commun (2020) 40(4):135–53. doi: 10.1002/cac2.12023
40. Lu S, Stein JE, Rimm DL, Wang DW, Bell JM, Johnson DB, et al. Comparison of biomarker modalities for predicting response to PD-1/PD-L1 checkpoint blockade: a systematic review and meta-analysis. JAMA Oncol (2019) 5(8):1195–204. doi: 10.1001/jamaoncol.2019.1549
41. Bosisio FM, Van Herck Y, Messiaen J, Bolognesi MM, Marcelis L, Van Haele M, et al. Next-generation pathology using multiplexed immunohistochemistry: mapping tissue architecture at single-cell level. Front Oncol (2022) 12. doi: 10.3389/fonc.2022.918900
42. Surace M, DaCosta K, Huntley A, Zhao W, Bagnall C, Brown C, et al. Automated multiplex immunofluorescence panel for immuno-oncology studies on formalin-fixed carcinoma tissue specimens. J Vis Exp (2019) (143). doi: 10.3791/58390
43. Wee YTF, Alkaff SMF, Lim JCT, Loh JJH, Hilmy MH, Ong C, et al. An integrated automated multispectral imaging technique that simultaneously detects and quantitates viral RNA and immune cell protein markers in fixed sections from Epstein-Barr virus-related tumours. Ann Diagn Pathol (2018) 37:12–9. doi: 10.1016/j.anndiagpath.2018.09.002
44. Lim JCT, Yeong JPS, Lim CJ, Ong CCH, Wong SC, Chew VSP, et al. An automated staining protocol for seven-colour immunofluorescence of human tissue sections for diagnostic and prognostic use. Pathology (2018) 50(3):333–41. doi: 10.1016/j.pathol.2017.11.087
45. Humphries MP, Bingham V, Abdullahi Sidi F, Craig SG, McQuaid S, James J, et al. Improving the diagnostic accuracy of the PD-L1 test with image analysis and multiplex hybridization. Cancers (Basel) (2020) 12(5). doi: 10.3390/cancers12051114
46. Yeong J, Tan T, Chow ZL, Cheng Q, Lee B, Seet A, et al. Multiplex immunohistochemistry/immunofluorescence (mIHC/IF) for PD-L1 testing in triple-negative breast cancer: a translational assay compared with conventional IHC. J Clin Pathol (2020) 73(9):557–62. doi: 10.1136/jclinpath-2019-206252
47. Van Herck Y, Antoranz A, Andhari MD, Milli G, Bechter O, De Smet F, et al. Multiplexed immunohistochemistry and digital pathology as the foundation for next-generation pathology in melanoma: methodological comparison and future clinical applications. Front Oncol (2021) 11. doi: 10.3389/fonc.2021.636681
48. Halse H, Colebatch AJ, Petrone P, Henderson MA, Mills JK, Snow H, et al. Multiplex immunohistochemistry accurately defines the immune context of metastatic melanoma. Sci Rep (2018) 8(1):11158. doi: 10.1038/s41598-018-28944-3
49. Dias Costa A, Väyrynen SA, Chawla A, Zhang J, Väyrynen JP, Lau MC, et al. Neoadjuvant chemotherapy is associated with altered immune cell infiltration and an anti-tumorigenic microenvironment in resected pancreatic cancer. Clin Cancer Res (2022) 28(23):5167–79. doi: 10.1158/1078-0432.CCR-22-1125
50. Masugi Y, Abe T, Ueno A, Fujii-Nishimura Y, Ojima H, Endo Y, et al. Characterization of spatial distribution of tumor-infiltrating CD8(+) T cells refines their prognostic utility for pancreatic cancer survival. Mod Pathol (2019) 32(10):1495–507. doi: 10.1038/s41379-019-0291-z
51. Moncada R, Barkley D, Wagner F, Chiodin M, Devlin JC, Baron M, et al. Integrating microarray-based spatial transcriptomics and single-cell RNA-seq reveals tissue architecture in pancreatic ductal adenocarcinomas. Nat Biotechnol (2020) 38(3):333–42. doi: 10.1038/s41587-019-0392-8
52. Feng Z, Bethmann D, Kappler M, Ballesteros-Merino C, Eckert A, Bell RB, et al. Multiparametric immune profiling in HPV- oral squamous cell cancer. JCI Insight (2017) 2(14). doi: 10.1172/jci.insight.93652
53. Boisson A, Noël G, Saiselet M, Rodrigues-Vitória J, Thomas N, Fontsa ML, et al. Fluorescent multiplex immunohistochemistry coupled with other state-Of-The-Art techniques to systematically characterize the tumor immune microenvironment. Front Mol Biosci (2021) 8. doi: 10.3389/fmolb.2021.673042
54. Schlecht A, Boneva S, Salie H, Killmer S, Wolf J, Hajdu RI, et al. Imaging mass cytometry for high-dimensional tissue profiling in the eye. BMC Ophthalmol (2021) 21(1):338. doi: 10.1186/s12886-021-02099-8
55. Imaging mass cytometry services: visikol. Available at: https://visikol.com/services/digipath/imaging-mass-cytometry-services/.
56. Schapiro D, Jackson HW, Raghuraman S, Fischer JR, Zanotelli VRT, Schulz D, et al. histoCAT: analysis of cell phenotypes and interactions in multiplex image cytometry data. Nat Methods (2017) 14(9):873–6. doi: 10.1038/nmeth.4391
57. Bouzekri A, Esch A, Ornatsky O. Multidimensional profiling of drug-treated cells by imaging mass cytometry. FEBS Open Bio (2019) 9(9):1652–69. doi: 10.1002/2211-5463.12692
58. Jackson HW, Fischer JR, Zanotelli VRT, Ali HR, Mechera R, Soysal SD, et al. The single-cell pathology landscape of breast cancer. Nature (2020) 578(7796):615–20. doi: 10.1038/s41586-019-1876-x
59. Baharlou H, Canete NP, Cunningham AL, Harman AN, Patrick E. Mass cytometry imaging for the study of human diseases-applications and data analysis strategies. Front Immunol (2019) 10:2657. doi: 10.3389/fimmu.2019.02657
60. Angelo M, Bendall SC, Finck R, Hale MB, Hitzman C, Borowsky AD, et al. Multiplexed ion beam imaging of human breast tumors. Nat Med (2014) 20(4):436–42. doi: 10.1038/nm.3488
61. Rost S, Giltnane J, Bordeaux JM, Hitzman C, Koeppen H, Liu SD. Multiplexed ion beam imaging analysis for quantitation of protein expresssion in cancer tissue sections. Lab Invest (2017) 97(8):992–1003. doi: 10.1038/labinvest.2017.50
62. Rao A, Barkley D, França GS, Yanai I. Exploring tissue architecture using spatial transcriptomics. Nature (2021) 596(7871):211–20. doi: 10.1038/s41586-021-03634-9
63. Rodriques SG, Stickels RR, Goeva A, Martin CA, Murray E, Vanderburg CR, et al. Slide-seq: a scalable technology for measuring genome-wide expression at high spatial resolution. Science (2019) 363(6434):1463–7. doi: 10.1126/science.aaw1219
64. Asp M, Bergenstråhle J, Lundeberg J. Spatially resolved transcriptomes–next generation tools for tissue exploration. BioEssays (2020) 42(10):1900221. doi: 10.1002/bies.201900221
65. Bergholtz H, Carter J, Cesano A, Cheang M, Church S, Divakar P, et al. Best practices for spatial profiling for breast cancer research with the GeoMx® digital spatial profiler. Cancers (2021) 13:4456. doi: 10.3390/cancers13174456
66. Amaria RN, Reddy SM, Tawbi HA, Davies MA, Ross MI, Glitza IC, et al. Neoadjuvant immune checkpoint blockade in high-risk resectable melanoma. Nat Med (2018) 24(11):1649–54. doi: 10.1038/s41591-018-0197-1
67. Blank CU, Rozeman EA, Fanchi LF, Sikorska K, van de Wiel B, Kvistborg P, et al. Neoadjuvant versus adjuvant ipilimumab plus nivolumab in macroscopic stage III melanoma. Nat Med (2018) 24(11):1655–61. doi: 10.1038/s41591-018-0198-0
68. Saito A, Kuroda M. [AI application on the pathology-from diagnosis assisting tool to prediction tool]. Gan to kagaku ryoho Cancer Chemother (2019) 46(3):427–31.
69. Martin B, Schäfer E, Jakubowicz E, Mayr P, Ihringer R, Anthuber M, et al. Interobserver variability in the H&E-based assessment of tumor budding in pT3/4 colon cancer: does it affect the prognostic relevance? Virchows Archiv (2018) 473(2):189–97. doi: 10.1007/s00428-018-2341-1
70. Lidbury JA, Rodrigues Hoffmann A, Ivanek R, Cullen JM, Porter BF, Oliveira F, et al. Interobserver agreement using histological scoring of the canine liver. J Vet Internal Med (2017) 31(3):778–83. doi: 10.1111/jvim.14684
71. Gomez-Brouchet A, Gilhodes J, Van Acker N, Brion R, Bouvier C, Assemat P, et al. Characterization of macrophages and osteoclasts in the osteosarcoma tumor microenvironment at diagnosis: new perspective for osteosarcoma treatment? Cancers (2021) 13(3):423. doi: 10.3390/cancers13030423
72. Zarella MD, Breen DE, Plagov A, Garcia FU. An optimized color transformation for the analysis of digital images of hematoxylin & eosin stained slides. J Pathol Inform (2015) 6(1):33. doi: 10.4103/2153-3539.158910
73. Azevedo Tosta TA, de Faria PR, Neves LA, do Nascimento MZ. Computational normalization of H&E-stained histological images: progress, challenges and future potential. Artif Intell Med (2019) 95:118–32. doi: 10.1016/j.artmed.2018.10.004
74. Liu Y, Li X, Zheng A, Zhu X, Liu S, Hu M, et al. Predict ki-67 positive cells in H&E-stained images using deep learning independently from IHC-stained images. Front Mol Biosci (2020) 7. doi: 10.3389/fmolb.2020.00183
75. Stringer C, Wang T, Michaelos M, Pachitariu M. Cellpose: a generalist algorithm for cellular segmentation. Nat Methods (2021) 18(1):100–6. doi: 10.1038/s41592-020-01018-x
76. Schmidt U, Weigert M, Broaddus C, Myers G eds. Cell detection with star-convex polygons. medical image computing and computer assisted intervention – MICCAI 2018. Cham: Springer International Publishing (2018).
77. Väyrynen JP, Lau MC, Haruki K, Väyrynen SA, Dias Costa A, Borowsky J, et al. Prognostic significance of immune cell populations identified by machine learning in colorectal cancer using routine hematoxylin and eosin–stained sections. Clin Cancer Res (2020) 26(16):4326–38. doi: 10.1158/1078-0432.CCR-20-0071
78. Rączkowski Ł, Paśnik I, Kukiełka M, Nicoś M, Budzinska MA, Kucharczyk T, et al. Deep learning-based tumor microenvironment segmentation is predictive of tumor mutations and patient survival in non-small-cell lung cancer. BMC Cancer (2022) 22(1):1001. doi: 10.1186/s12885-022-10081-w
79. Jiao Y, Li J, Qian C, Fei S. Deep learning-based tumor microenvironment analysis in colon adenocarcinoma histopathological whole-slide images. Comput Methods Prog Biomed (2021) 204:106047. doi: 10.1016/j.cmpb.2021.106047
80. Bulten W, Litjens G. Unsupervised prostate cancer detection on H&E using convolutional adversarial autoencoders. Ithaca, NY: Cornell University (2018). Available at: https://arxiv.org/abs/1804.07098.
81. Ronteix G, Aristov A, Bonnet V, Sart S, Sobel J, Esposito E, et al. Griottes: a generalist tool for network generation from segmented tissue images. BMC Biol (2022) 20(1):178. doi: 10.1186/s12915-022-01376-2
82. Macenko M, Niethammer M, Marron JS, Borland D, Woosley JT, Xiaojun G, et al. eds. (2009). A method for normalizing histology slides for quantitative analysis, in: 2009 IEEE International Symposium on Biomedical Imaging: From Nano to Macro. Available at: https://biag.cs.unc.edu/publication/dblp-confisbi-macenko-nmbwgst-09/.
83. Salehi P, Chalechale A eds. (2020). Pix2Pix-based stain-to-Stain translation: a solution for robust stain normalization in histopathology images analysis, in: 2020 International Conference on Machine Vision and Image Processing (MVIP). Available at: https://arxiv.org/abs/2002.00647.
84. Windhager J, Bodenmiller B, Eling N. An end-to-end workflow for multiplexed image processing and analysis. bioRxiv (2021). 2021.11.12.468357. doi: 10.1101/2021.11.12.468357
85. Stirling DR, Swain-Bowden MJ, Lucas AM, Carpenter AE, Cimini BA, Goodman A. CellProfiler 4: improvements in speed, utility and usability. BMC Bioinf (2021) 22(1):433. doi: 10.1186/s12859-021-04344-9
86. Berg S, Kutra D, Kroeger T, Straehle CN, Kausler BX, Haubold C, et al. Ilastik: interactive machine learning for (bio)image analysis. Nat Methods (2019) 16(12):1226–32. doi: 10.1038/s41592-019-0582-9
87. Zanotelli VRT, Bodenmiller B. ImcSegmentationPipeline: a pixelclassification based multiplexed image segmentation pipeline. Zenodo (2017). doi: 10.5281/zenodo.3841961
88. Greenwald NF, Miller G, Moen E, Kong A, Kagel A, Dougherty T, et al. Whole-cell segmentation of tissue images with human-level performance using large-scale data annotation and deep learning. Nat Biotechnol (2022) 40(4):555–65. doi: 10.1038/s41587-021-01094-0
89. Bankhead P, Loughrey MB, Fernández JA, Dombrowski Y, McArt DG, Dunne PD, et al. QuPath: open source software for digital pathology image analysis. Sci Rep (2017) 7(1):16878. doi: 10.1038/s41598-017-17204-5
90. Rasband WS. ImageJ. USA: National Institutes of Health (1997). Available at: https://imagej.net/ij/.
91. Stevens M, Nanou A, Terstappen LWMM, Driemel C, Stoecklein NH, Coumans FAW. StarDist image segmentation improves circulating tumor cell detection. Cancers (2022) 14(12):2916. doi: 10.3390/cancers14122916
92. Mi H, Bivalacqua TJ, Kates M, Seiler R, Black PC, Popel AS, et al. Predictive models of response to neoadjuvant chemotherapy in muscle-invasive bladder cancer using nuclear morphology and tissue architecture. Cell Rep Med (2021) 2(9):100382. doi: 10.1016/j.xcrm.2021.100382
93. Mori H, Bolen J, Schuetter L, Massion P, Hoyt CC, VandenBerg S, et al. Characterizing the tumor immune microenvironment with tyramide-based multiplex immunofluorescence. J Mammary Gland Biol Neoplasia (2020) 25(4):417–32. doi: 10.1007/s10911-021-09479-2
94. Ozbek B, Ertunc O, Erickson A, Vidal ID, Gomes-Alexandre C, Guner G, et al. Multiplex immunohistochemical phenotyping of T cells in primary prostate cancer. Prostate (2022) 82(6):706–22. doi: 10.1002/pros.24315
95. Yang T, Ozcoban V, Pasam A, Kocovski N, Pizzolla A, Huang Y-K, et al. SPIAT: an r package for the spatial image analysis of cells in tissues. bioRxiv (2020). 2020.05.28.122614. doi: 10.1101/2020.05.28.122614
96. Eling N, Damond N, Hoch T, Bodenmiller B. Cytomapper: an R/Bioconductor package for visualization of highly multiplexed imaging data. Bioinformatics (2020) 36(24):5706–8. doi: 10.1101/2020.09.08.287516
97. Hao Y, Hao S, Andersen-Nissen E, Mauck WM III, Zheng S, Butler A, et al. Integrated analysis of multimodal single-cell data. Cell (2021) 184(13):3573–87.e29. doi: 10.1016/j.cell.2021.04.048
98. Liu N, Bhuva D, Mohamed A, Tan CW, Davis M. standR package (2022). Available at: https://bioconductor.org/packages/devel/bioc/vignettes/standR/inst/doc/standR_introduction.html.
99. Ortogero N, Yang Z, Vitancol R, Griswold M, Henderson D. GeomxTools: NanoString GeoMx tools. r package version 3.2.0 2022.
100. Dries R, Zhu Q, Dong R, Eng C-HL, Li H, Liu K, et al. Giotto: a toolbox for integrative analysis and visualization of spatial expression data. Genome Biol (2021) 22(1):78. doi: 10.1186/s13059-021-02286-2
101. Li Y, Stanojevic S, Garmire LX. Emerging artificial intelligence applications in spatial transcriptomics analysis. Comput Struct Biotechnol J (2022) 20:2895–908. doi: 10.1016/j.csbj.2022.05.056
102. Dong K, Zhang S. Deciphering spatial domains from spatially resolved transcriptomics with an adaptive graph attention auto-encoder. Nat Commun (2022) 13(1):1739. doi: 10.1038/s41467-022-29439-6
103. Fu H, Xu H, Chong K, Li M, Ang KS, Lee HK, et al. Unsupervised spatially embedded deep representation of spatial transcriptomics. bioRxiv (2021). 2021.06.15.448542. doi: 10.1101/2021.06.15.448542
104. Allen C, Chang Y, Ma Q, Chung D. MAPLE: a hybrid framework for multi-sample spatial transcriptomics data. bioRxiv (2022). 2022.02.28.482296. doi: 10.1101/2022.02.28.482296
105. Zong Y, Yu T, Wang X, Wang Y, Hu Z, Li Y. conST: an interpretable multi-modal contrastive learning framework for spatial transcriptomics. bioRxiv (2022). 2022.01.14.476408. doi: 10.1101/2022.01.14.476408
106. Xu Y, McCord RP. CoSTA: unsupervised convolutional neural network learning for spatial transcriptomics analysis. BMC Bioinf (2021) 22(1):397. doi: 10.1186/s12859-021-04314-1
107. Chang Y, He F, Wang J, Chen S, Li J, Liu J, et al. Define and visualize pathological architectures of human tissues from spatially resolved transcriptomics using deep learning. Comput Struct Biotechnol J (2022) 20:4600–17. doi: 10.1016/j.csbj.2022.08.029
108. Hu J, Li X, Coleman K, Schroeder A, Ma N, Irwin DJ, et al. SpaGCN: integrating gene expression, spatial location and histology to identify spatial domains and spatially variable genes by graph convolutional network. Nat Methods (2021) 18(11):1342–51. doi: 10.1038/s41592-021-01255-8
109. Pham D, Tan X, Xu J, Grice LF, Lam PY, Raghubar A, et al. stLearn: integrating spatial location, tissue morphology and gene expression to find cell types, cell-cell interactions and spatial trajectories within undissociated tissues. bioRxiv (2020). 2020.05.31.125658. doi: 10.1101/2020.05.31.125658
110. Tan X, Su A, Tran M, Nguyen Q. SpaCell: integrating tissue morphology and spatial gene expression to predict disease cells. Bioinformatics (2020) 36(7):2293–4. doi: 10.1093/bioinformatics/btz914
111. Zhao E, Stone MR, Ren X, Guenthoer J, Smythe KS, Pulliam T, et al. Spatial transcriptomics at subspot resolution with BayesSpace. Nat Biotechnol (2021) 39(11):1375–84. doi: 10.1038/s41587-021-00935-2
112. Liu W, Liao X, Luo Z, Yang Y, Lau MC, Jiao Y, et al. Probabilistic embedding, clustering, and alignment for integrating spatial transcriptomics data with PRECAST. Nat Commun (2023) 14(1):296. doi: 10.1038/s41467-023-35947-w
113. Hao M, Hua K, Zhang X. SOMDE: a scalable method for identifying spatially variable genes with self-organizing map. bioRxiv (2021). 2020.12.10.419549. doi: 10.1093/bioinformatics/btab471
114. Sun S, Zhu J, Zhou X. Statistical analysis of spatial expression patterns for spatially resolved transcriptomic studies. Nat Methods (2020) 17(2):193–200. doi: 10.1038/s41592-019-0701-7
115. Svensson V, Teichmann SA, Stegle O. SpatialDE: identification of spatially variable genes. Nat Methods (2018) 15(5):343–6. doi: 10.1038/nmeth.4636
116. Zhang K, Feng W, Wang P. Identification of spatially variable genes with graph cuts. Nat Commun (2022) 13(1):5488. doi: 10.1038/s41467-022-33182-3
117. Wang X, Allen WE, Wright MA, Sylwestrak EL, Samusik N, Vesuna S, et al. Three-dimensional intact-tissue sequencing of single-cell transcriptional states. Science (2018) 361(6400). doi: 10.1126/science.aat5691
118. Lopez R, Li B, Keren-Shaul H, Boyeau P, Kedmi M, Pilzer D, et al. DestVI identifies continuums of cell types in spatial transcriptomics data. Nat Biotechnol (2022) 40(9):1360–9. doi: 10.1038/s41587-022-01272-8
119. Bae S, Na KJ, Koh J, Lee DS, Choi H, Kim YT. CellDART: cell type inference by domain adaptation of single-cell and spatial transcriptomic data. Nucleic Acids Res (2022) 50(10):e57. doi: 10.1093/nar/gkac084
120. Biancalani T, Scalia G, Buffoni L, Avasthi R, Lu Z, Sanger A, et al. Deep learning and alignment of spatially resolved single-cell transcriptomes with tangram. Nat Methods (2021) 18(11):1352–62. doi: 10.1038/s41592-021-01264-7
121. Song Q, Su J. DSTG: deconvoluting spatial transcriptomics data through graph-based artificial intelligence. Briefings Bioinf (2021) 22(5). doi: 10.1093/bib/bbaa414
122. Jin S, Ramos R. Computational exploration of cellular communication in skin from emerging single-cell and spatial transcriptomic data. Biochem Soc Trans (2022) 50(1):297–308. doi: 10.1042/BST20210863
123. Tanevski J, Flores ROR, Gabor A, Schapiro D, Saez-Rodriguez J. Explainable multiview framework for dissecting spatial relationships from highly multiplexed data. Genome Biol (2022) 23(1):97. doi: 10.1186/s13059-022-02663-5
124. Fischer DS, Schaar AC, Theis FJ. Modeling intercellular communication in tissues using spatial graphs of cells. Nat Biotechnol (2023) 41:332–6. doi: 10.1038/s41587-022-01467-z
125. Yuan Y, Bar-Joseph Z. GCNG: graph convolutional networks for inferring gene interaction from spatial transcriptomics data. Genome Biol (2020) 21(1):300. doi: 10.1186/s13059-020-02214-w
126. Feder ME, Walser JC. The biological limitations of transcriptomics in elucidating stress and stress responses. J Evol Biol (2005) 18(4):901–10. doi: 10.1111/j.1420-9101.2005.00921.x
127. Alfaro JA, Sinha A, Kislinger T, Boutros PC. Onco-proteogenomics: cancer proteomics joins forces with genomics. Nat Methods (2014) 11(11):1107–13. doi: 10.1038/nmeth.3138
128. Cieślik M, Chinnaiyan AM. Cancer transcriptome profiling at the juncture of clinical translation. Nat Rev Genet (2018) 19(2):93–109. doi: 10.1038/nrg.2017.96
129. de Vries NL, Mahfouz A, Koning F, de Miranda NFCC. Unraveling the complexity of the cancer microenvironment with multidimensional genomic and cytometric technologies. Front Oncol (2020) 10. doi: 10.3389/fonc.2020.01254
130. Blise KE, Sivagnanam S, Banik GL, Coussens LM, Goecks J. Single-cell spatial architectures associated with clinical outcome in head and neck squamous cell carcinoma. NPJ Precis Oncol (2022) 6(1):10. doi: 10.1038/s41698-022-00253-z
131. Wu Z, Trevino AE, Wu E, Swanson K, Kim HJ, D’Angio HB, et al. Graph deep learning for the characterization of tumour microenvironments from spatial protein profiles in tissue specimens. Nat Biomed Engineering (2022) 6(12):1435–48. doi: 10.1038/s41551-022-00951-w
132. Taube JM, Akturk G, Angelo M, Engle EL, Gnjatic S, Greenbaum S, et al. The society for immunotherapy of cancer statement on best practices for multiplex immunohistochemistry (IHC) and immunofluorescence (IF) staining and validation. J Immunother Cancer (2020) 8(1). doi: 10.1136/jitc-2019-000155corr1
Keywords: spatial omics, tumour microenvironment, artificial intelligence, machine learning, deep learning, spatial proteomics, spatial transcriptomics, digital pathology
Citation: Lee RY, Ng CW, Rajapakse MP, Ang N, Yeong JPS and Lau MC (2023) The promise and challenge of spatial omics in dissecting tumour microenvironment and the role of AI. Front. Oncol. 13:1172314. doi: 10.3389/fonc.2023.1172314
Received: 23 February 2023; Accepted: 18 April 2023;
Published: 01 May 2023.
Edited by:
Sara Lovisa, Humanitas University, ItalyReviewed by:
Paola Trono, National Research Council (CNR), ItalyYuzhou Chang, The Ohio State University, United States
Copyright © 2023 Lee, Ng, Rajapakse, Ang, Yeong and Lau. This is an open-access article distributed under the terms of the Creative Commons Attribution License (CC BY). The use, distribution or reproduction in other forums is permitted, provided the original author(s) and the copyright owner(s) are credited and that the original publication in this journal is cited, in accordance with accepted academic practice. No use, distribution or reproduction is permitted which does not comply with these terms.
*Correspondence: Joe Poh Sheng Yeong, am9lLnllb25nLnAuc0BzZ2guY29tLnNn; Mai Chan Lau, bGF1X21haV9jaGFuQGJpaS5hLXN0YXIuZWR1LnNn
†These authors have contributed equally to this work