 Quanjun Lin
 Yihang Yuan
- Department of General Surgery, Tongren Hospital, Shanghai Jiao Tong University School of Medicine, Shanghai, China
Background: Metabolic reprogramming is one of the most important events in the development of tumors. Similarly, long non-coding RNAs are closely related to the occurrence and development of colorectal cancer (CRC). However, there is still a lack of systematic research on metabolism-related lncRNA in CRC.
Methods: Expression data of metabolism-related genes and lncRNA were obtained from The Cancer Genome Atlas (TCGA). Hub metabolism-related genes (HMRG) were screened out by differential analysis and univariate Cox analysis; a metabolism-related lncRNA risk index (MRLncRI) was constructed by co-expression analysis, univariate Cox regression analysis, LASSO, and multivariate Cox regression analysis. Survival curves were drawn by the Kaplan-Meier method. The ssGSEA method assessed the tumor microenvironment of the sample, and the IPS assessed the patient’s response to immunotherapy. “Oncopredict” assessed patient sensitivity to six common drugs.
Results: MRLncRI has excellent predictive ability for CRC prognosis. Based on this, we also constructed a nomogram that is more suitable for clinical applications. Most immune cells and immune-related terms were higher in the high-risk group. IPS scores were higher in the high-risk group. In addition, the high-risk and low-risk groups were sensitive to different drugs.
Conclusion: MRLncRI can accurately predict the prognosis of CRC patients, is a promising biomarker, and has guiding significance for the clinical treatment of CRC.
1 Introduction
Colorectal cancer (CRC) is one of the most common malignant tumors in the world, ranking third in incidence and second in mortality among all malignant tumors (1). Although great efforts have been made to prevent and control the occurrence and development of CRC. However, it is estimated that by 2040, the number of new cases and deaths of colorectal cancer will continue to increase (2). Therefore, there is an urgent need to find new biomarkers as targets for the prevention and treatment of CRC.
It is well known that one of the hallmarks of cancer is metabolic reprogramming (3). Cancer cells adapt various metabolic pathways to meet their own biosynthetic and energy demands (4, 5). The current study shows that two key nutrients, glucose and glutamine, serve to support cancer cell survival and biosynthesis (6). In addition, certain genes or signaling pathways can also drive cancer cells to undergo metabolic reprogramming, resulting in metabolic adaptation (7, 8). For example, p53, a key molecule in cancer, can reprogram glycolysis, lipid metabolism, amino acid metabolism, etc. in cancer cells (9, 10). Mutual crosstalk between HIF1a and c-myc regulates energy metabolism in cancer cells under hypoxic environment, thereby affecting cell proliferation and differentiation (11–13). Given that metabolism plays a crucial role in cancer, it is necessary to systematically explore the key regulators between metabolism and cancer to gain a deeper understanding of the pathogenesis of CRC.
LncRNA is a class of RNA molecules with poor conservation and a length of more than 200 nt. Current research shows that lncRNA is involved in most physiological and pathological processes, including cell proliferation, differentiation, invasion and metastasis, etc. (14). And existing studies have shown that lncRNA is involved in the occurrence and development of most cancers (14–17). More interestingly, lncRNA regulate energy metabolism in cancer (18, 19). At present, there have been many studies involving lncRNA with specific functions to predict the prognosis of CRC. For example, risk models based on lncRNA related to EMT, immunity, and cuproptosis can effectively predict the prognosis of CRC (20–22). However, there is still a lack of effective metabolic-related lncRNA risk models for predicting the prognosis of CRC patients.
In this study, a metabolism-related lncRNA risk model was constructed, which can effectively predict the prognosis of CRC patients. In addition, this risk model can effectively distinguish the tumor microenvironment of patients, which also provides some insights for the selection of immunotherapy and targeted therapy in CRC patients.
2 Materials and methods
2.1 Data download and processing
The gene expression data, clinical data and prognostic information of CRC patients were obtained from The Cancer Genome Atlas (TCGA, https://portal.gdc.cancer.gov/) database. The TCGA-CRC cohort (including TCGA-COAD and TCGA-READ cohorts) contained 42 normal and 491 cancerous tissues. Samples with missing data were excluded. The genes related to metabolism-related signaling pathways were sorted out from the molecular signature database (MSigDB, https://www.gsea-msigdb.org/), and 948 metabolism-related genes (MRG) were defined. Due to the lack of information on GSTT1 in the expression profile of the TCGA-CRC cohort. Finally, we investigated 947 MRG, which was consistent with previous studies (23). See Supplementary Table 1 for detailed information.
2.2 Metabolism-related lncRNA screening
Firstly, the “Limma” package was used to perform differential analysis on MRG, and the differentially expressed genes affecting the prognosis of CRC were screened out by univariate Cox regression analysis and defined as hub metabolism-related genes (HMRG). The Spearman method was used to obtain HMRG-related lncRNA through co-expression analysis.
2.3 Constructing a risk index for metabolic-related lncRNA signatures
Univariate Cox regression analysis was used to screen out lncRNA affecting prognosis, and LASSO regression and multivariate Cox analysis were used to further screen candidate lncRNA to avoid overfitting. The formula for the risk score based on the results of multivariate Cox regression analysis is as follows, MRLncRI = lncRNA1 expression * lncRNA1 coefficient+ lncRNA2 expression * lncRNA2 coefficient+…+ lncRNAn expression * lncRNAn coefficient.
The total cohort was randomly divided into a training cohort and a validation cohort at a ratio of 1:1. The Kaplan-Meier (K-M) method was used to draw the survival curves of patients with different risk scores.
2.4 Construction of nomogram
A nomogram was drawn using the “regplot” package combined with the metabolism-related lncRNA risk index (MRLncRI) and clinical parameters. ROC curve, c-index and calibration curve are used to evaluate the accuracy and stability of nomogram
2.5 Gene set enrichment analysis
GSEA was performed using the “org.Hs.eg.db”, “clusterProfiler” and “enrichplot” packages to explore the enriched signaling pathways in the high-risk and low-risk groups.
2.6 Assessment of the tumor microenvironmental landscape
The 29 immune-related marker gene sets were used for single sample Gene Set Enrichment Analysis (ssGSEA) analysis. The GSVA package was used to perform ssGSEA. The 29 immune-related marker gene sets included 13 immune-related terms and 16 immune-related cells.
2.7 Immunophenotype score (IPS)
Previous studies have shown that the IPS score can be used to predict response to immunotherapy in cancer patients (24). The IPS scores of CRC patients were downloaded from The Cancer Immunome Atlas database (https://tcia.at/home).
2.8 Drug sensitivity analysis
Using the “Oncopredict” package (25) to predict sensitivity to common drugs in CRC patients.
2.9 Sample collection, RNA extraction, and RT-PCR
24 pairs CRC samples and matched paracancerous normal tissues were obtained from Tongren Hospital, Shanghai Jiao Tong University School of Medicine. Briefly, total tissue RNA was extracted using RNA-easy isolation reagent (Vazyme, China). RNA was reverse transcribed into stable cDNA using PrimeScript™ RT Master Mix (Takara Bio, Japan), and finally PCR was performed using SYBR-Green qPCR Master Mix (Vazyme, China) and normalized using GAPDH. The primers involved in this study are listed in Supplementary Table 2.
2.10 Statistical analysis
All analyzes in this study were done on the R language (version 4.1.2). For non-normally distributed continuous variables, the Wilcoxon rank sum test was used for variance analysis. PCR data were analyzed using Student’s t-test. Correlation analysis using the person method. The K-M method was used to draw survival curves. P<0.05 means the difference is statistically significant.
3 Results
3.1 HMRG screening
First, we identified 948 MRG and performed differential MRG analysis of in the TCGA-CRC cohort. The results showed that there were 315 differentially expressed genes (DEG), among which 143 MRG were up-regulated and 172 MRG were down-regulated (logFC = 1, p < 0.05). Volcano plots (Figure 1A) and heat maps (Figure 1B) were used to visualize these results. Then, we performed prognostic analysis on these DEGs by univariate Cox regression analysis, and found that a total of 32 DEGs were prognostic factors in CRC, including 22 risk factors and 10 protective factors (Figures 1C, D). The 32 DEGs affecting prognosis were defined as HMRG and further studied.
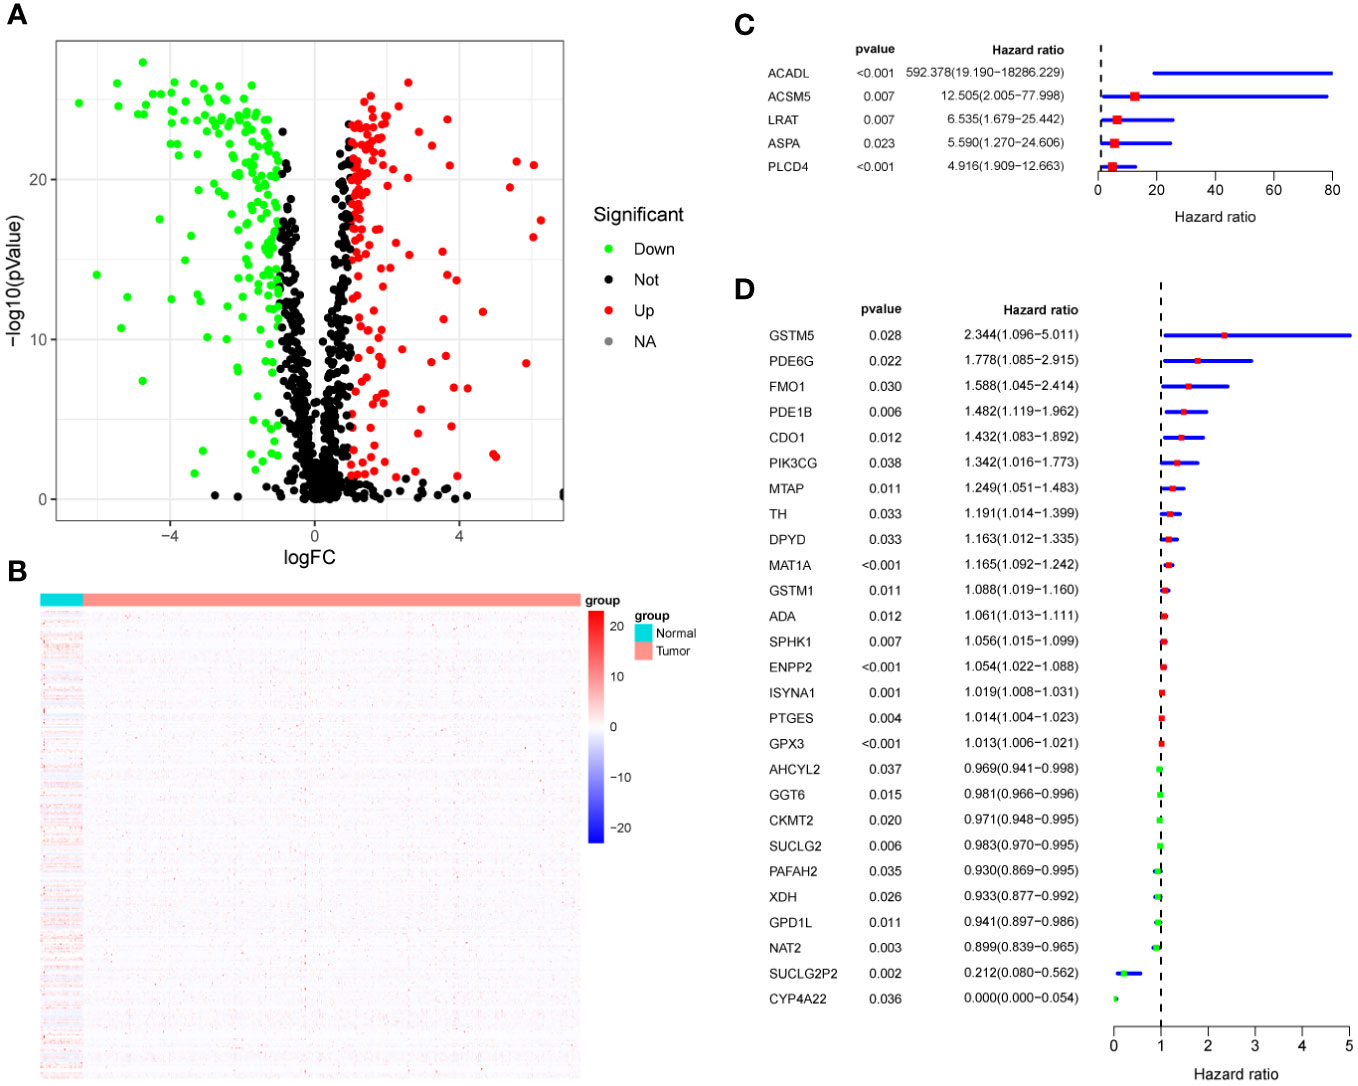
Figure 1 HMRG Screening. (A) Volcano plot showing differentially expressed metabolic genes. (B) Heatmap showing differentially expressed metabolic genes. (C, D) Forest plots showing univariate Cox analysis of DEG survival analysis.
3.2 Construction and validation of MRLncRI
First, we performed co-expression analysis of HMRG and lncRNA in the TCGA-CRC cohort. Finally, we obtained 1637 metabolic-related lncRNA (correlation coefficient > 0.4, P < 0.05) (Figure 2A). Then, univariate Cox regression analysis obtained 5 lncRNA that were significantly associated with the prognosis of CRC (p < 0.001) (Figure 2B). In order to give each patient a scientific quantitative label, we used LASSO regression analysis (Figures 3A, B) and multivariate Cox regression analysis (See Supplementary Table 3 for detailed results) to identify 3 hub lncRNA construction model features, namely AC004846.1, AL391422.4 and UBA6-AS1. Based on the results of multivariate Cox regression analysis, the formula representing MRLncRI was constructed as follows: MRLncRI = AC004846.1 expression * 3.04 + AL391422.4 expression * 1.23+UBA6-AS1 expression * 3.64. We randomly split the TCGA cohort into a training cohort and a validation cohort in a 1:1 ratio. The clinicopathological characteristics of the two groups were first compared and found no statistical difference in the clinicopathological characteristics between the training cohort and the validation cohort (Table 1). The correlation of 32 HMRG with 3 hub lncRNA was shown using heatmap (Figure 3C).
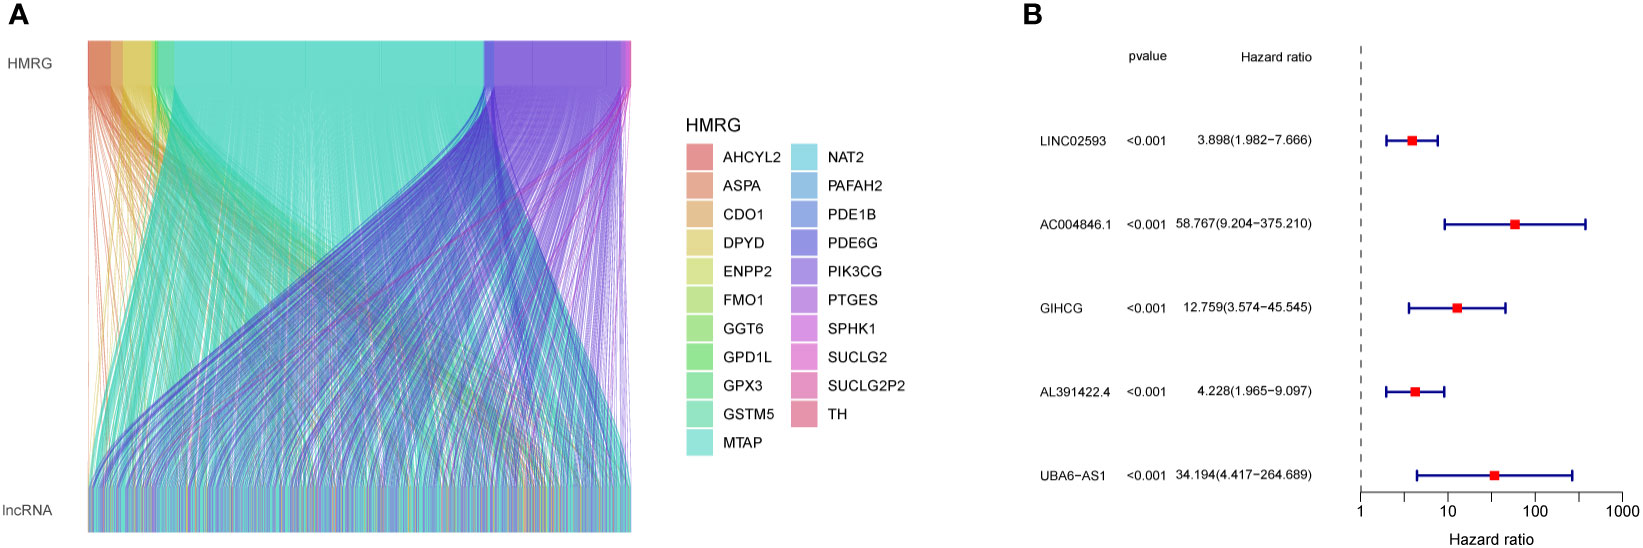
Figure 2 Screening of prognosis-related lncRNA. (A) Co-expression network diagram of HMRG and LncRNA. (B) Forest plot showing univariate Cox analysis of lncRNA survival analysis.
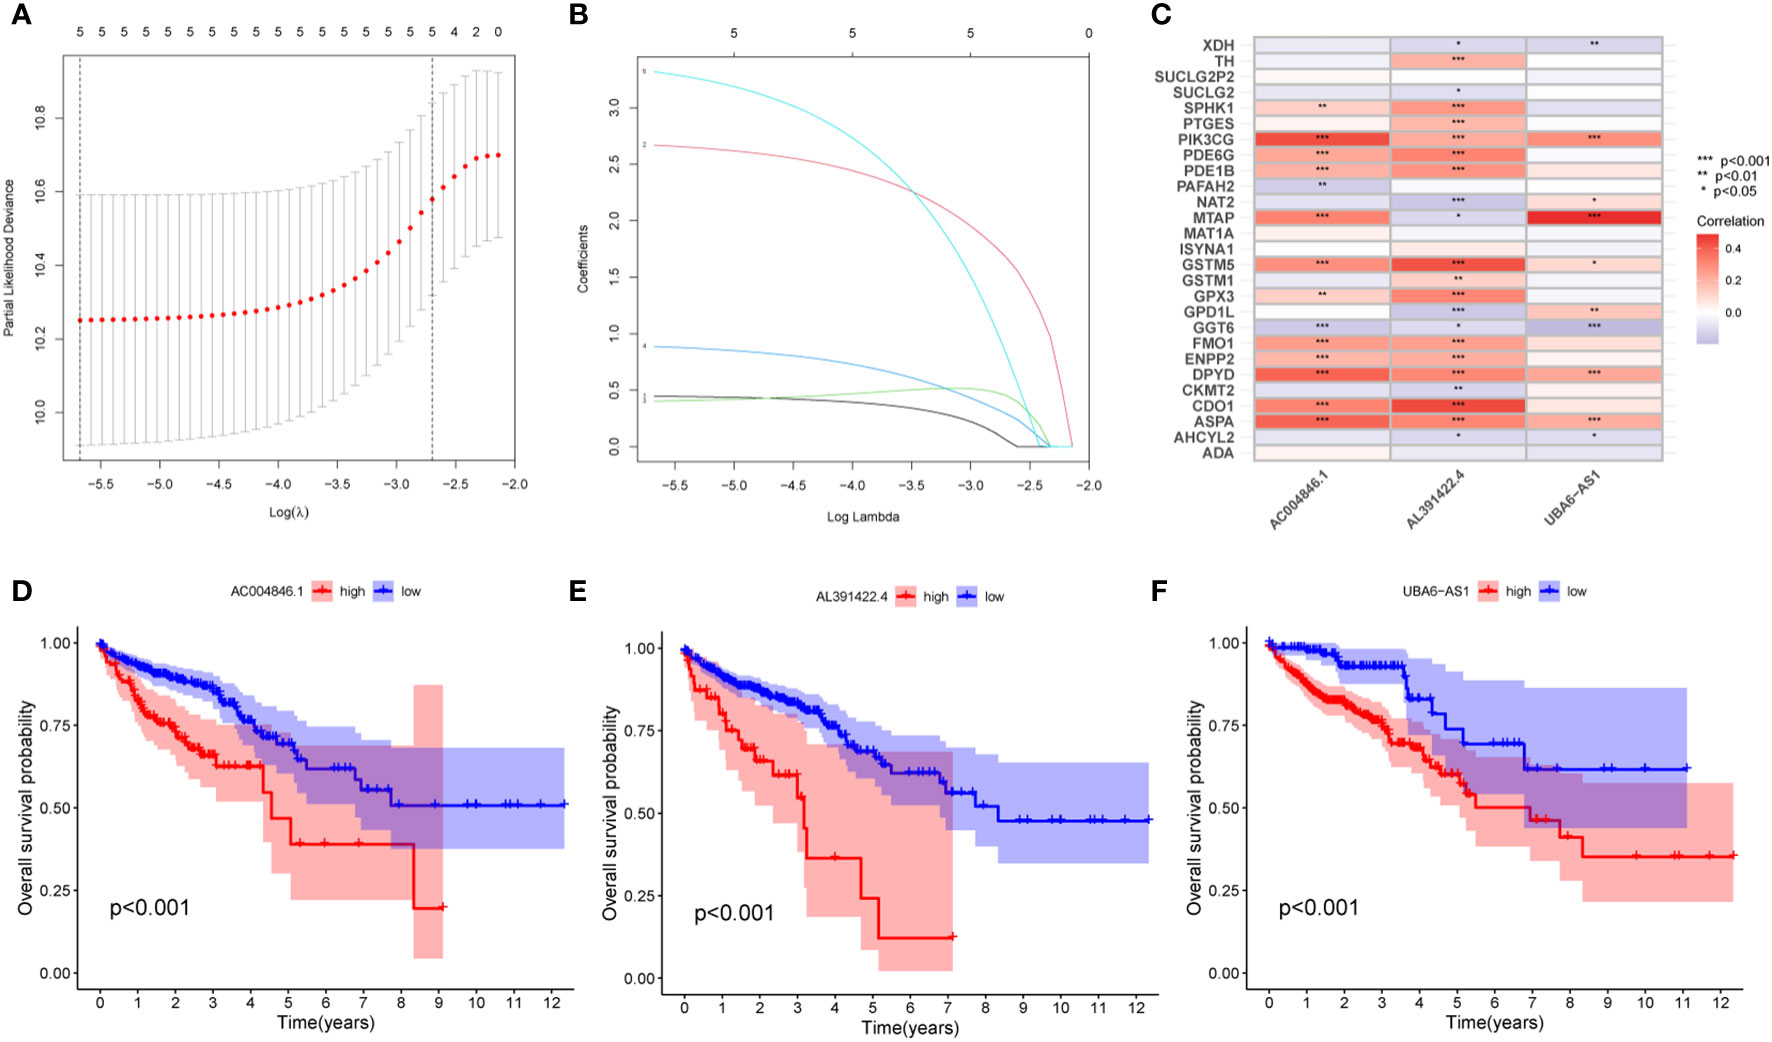
Figure 3 Construction of MRLncRI. (A, B) LASSO analysis of prognosis-related lncRNA. (C) Correlation heat map of HMRGs and hub lncRNA. (D–F) Kaplan-Meier survival curve analysis of hub lncRNA.
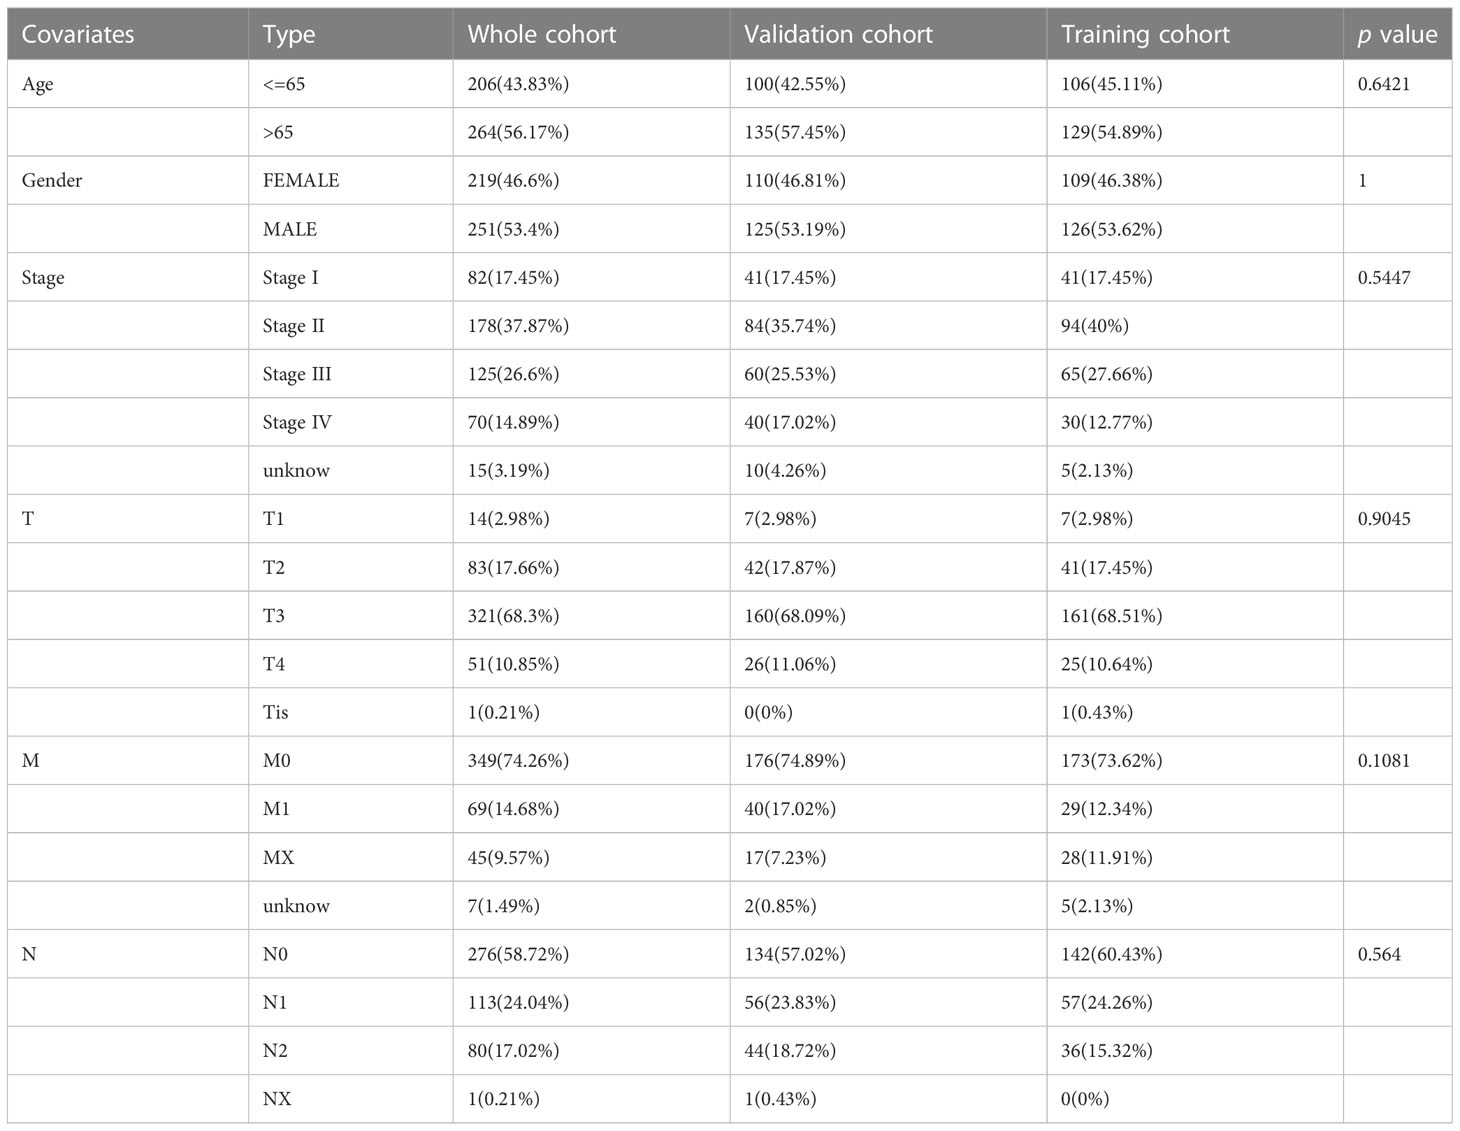
Table 1 Clinicopathological characteristics of the Whole cohort, training cohort, and validation cohort.
Prognostic analysis showed that the survival time of patients with low expression of AC004846.1, AL391422.4 and UBA6-AS1 was significantly longer than that of patients with high expression (Figures 3D–F). According to the median risk index, the TCGA cohort was divided into high-risk and low-risk groups. Prognostic analysis showed that patients in the high-risk group had significantly lower OS than the high-risk group in the training cohort, validation cohort, and overall cohort (Figures 4A–C). In addition, we also evaluated patients’ DSS and DFS, and the results were similar to OS. That is, the DSS and DFS of the high-risk group were significantly shorter than those of the low-risk group in the training cohort and the entire cohort. Although there was no statistical difference in DSS and DFS between the high-risk group and low-risk group in the validation cohort, there was a corresponding trend (Figures 4D–I).
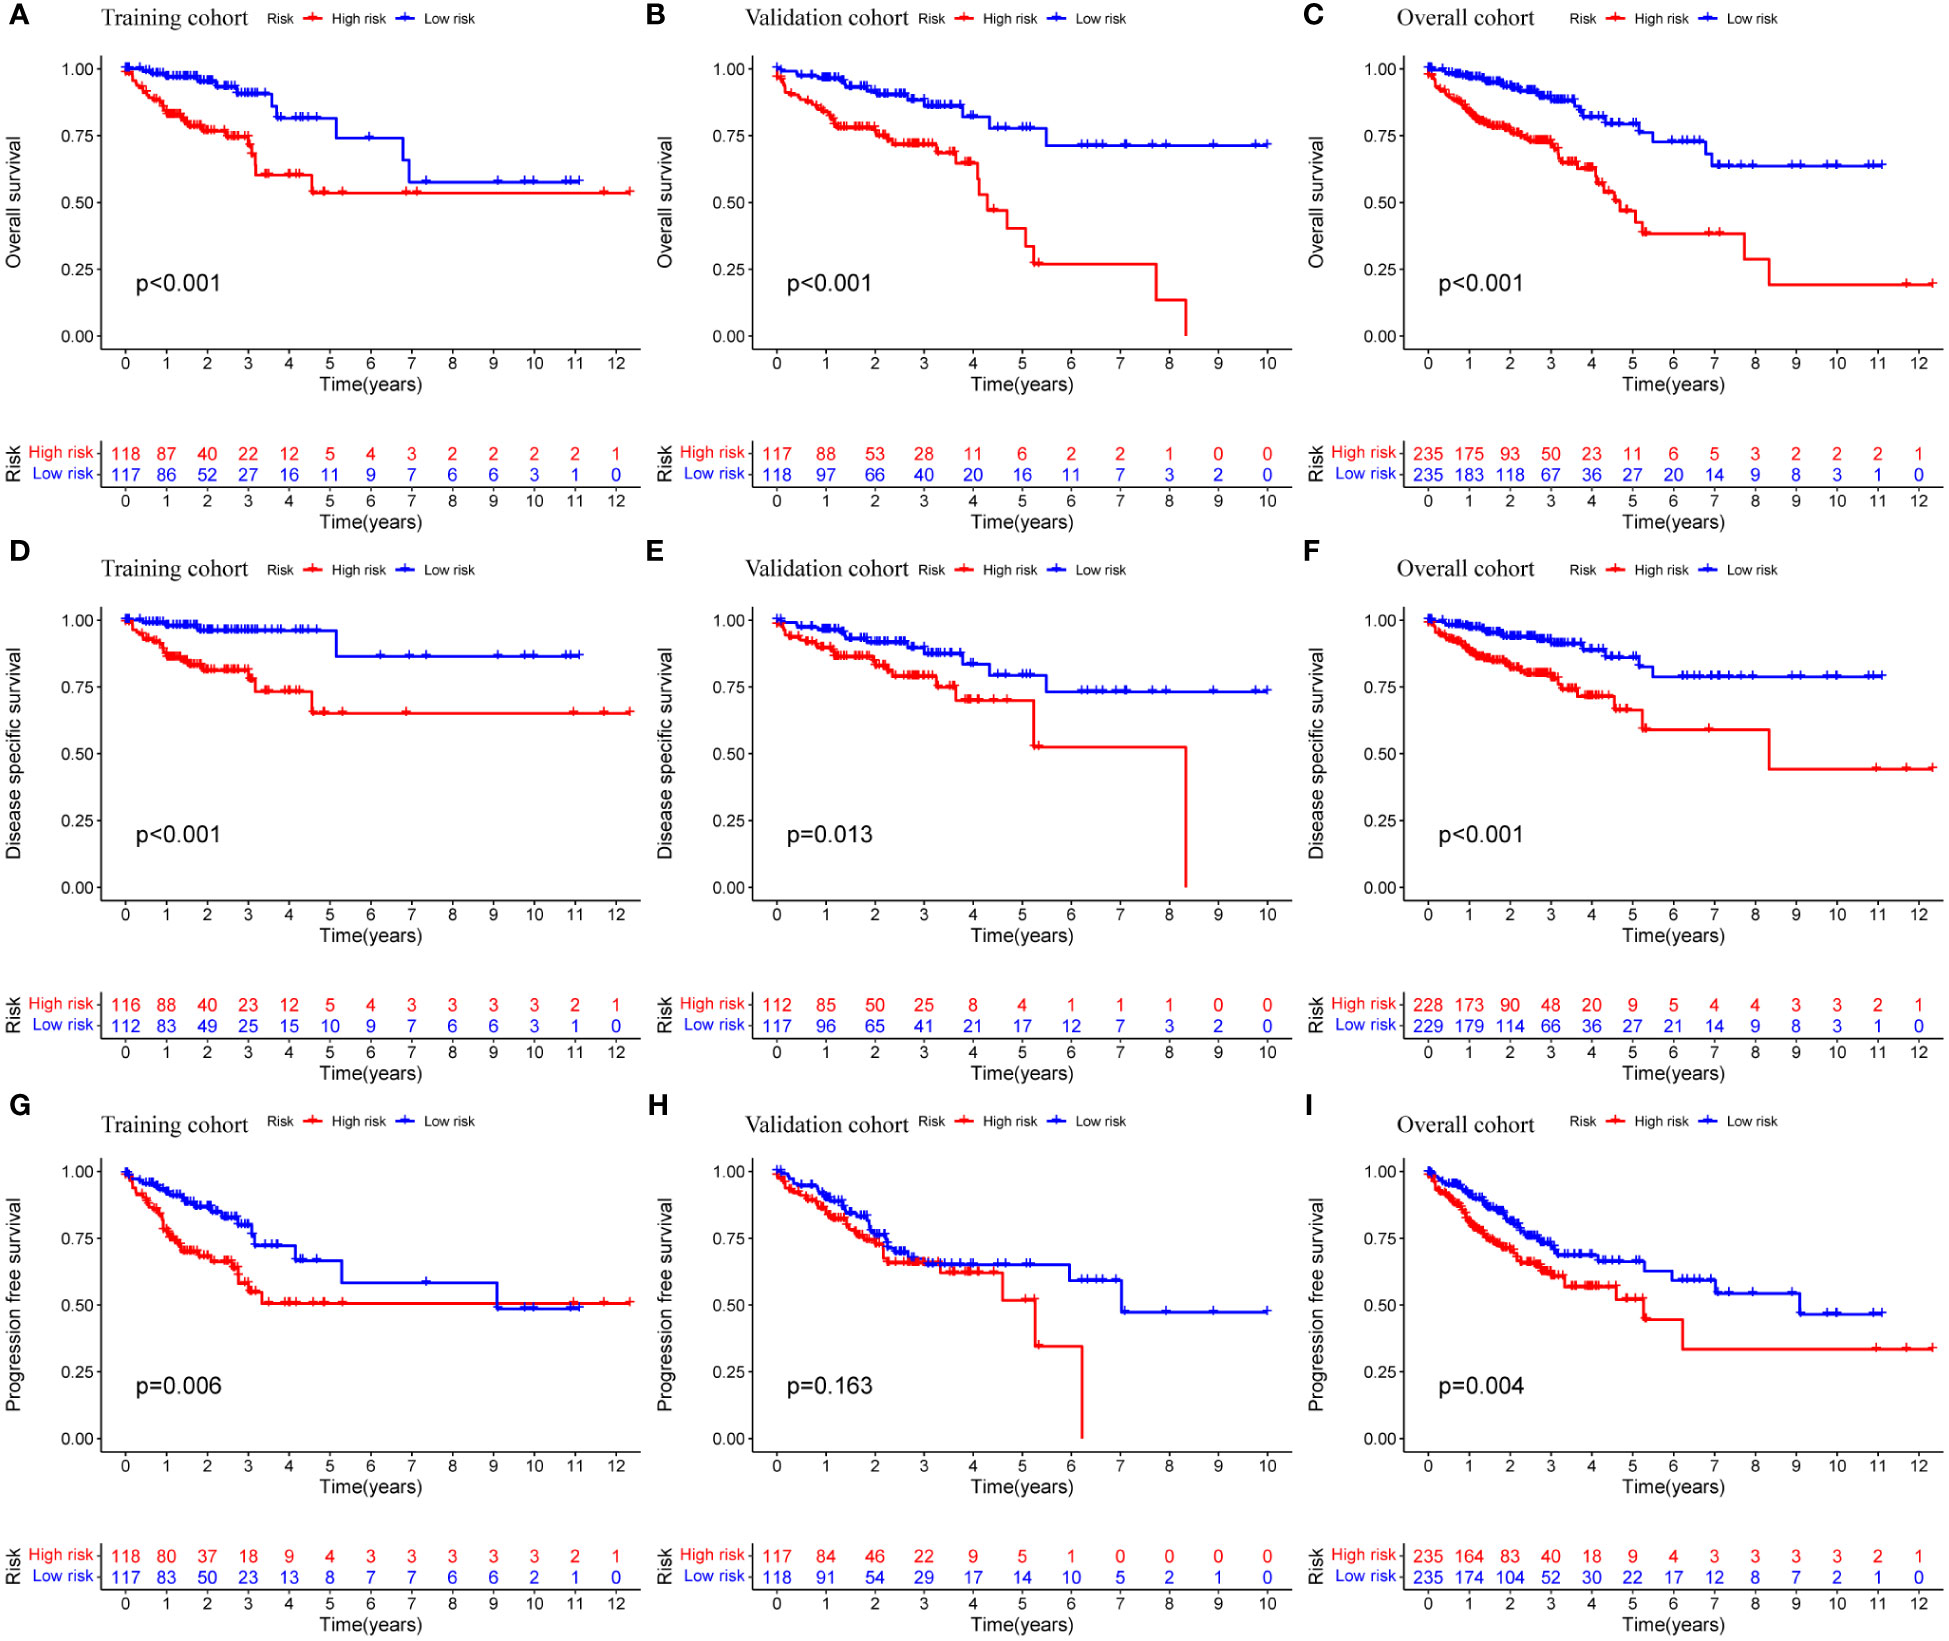
Figure 4 Prognostic analysis of MRLncRI. (A–C) Kaplan-Meier survival curve analysis of training cohort, validation cohort and whole cohort OS. (D–F) Kaplan-Meier survival curve analysis of training cohort, validation cohort and whole cohort DSS. (G–I) Kaplan-Meier survival curve analysis of training cohort, validation cohort and whole cohort PFS.
Principal component analysis was performed based on the expression of HMRG, HMRG-associated lncRNA, and hub lncRNA to evaluate the difference between high-risk and low-risk groups. The results showed that the expression of hub lncRNA (Figure 5C) but not HMRG and HMRG-related lncRNA (Figures 5A, B) could effectively distinguish high-risk and low-risk patients, illustrating the accuracy of the model. In addition, we further discussed the prognostic value of MRLncRI in different clinicopathological feature states. The results showed that the high-risk group had significantly shorter OS than the low-risk group in different ages (Figures 5D, E), gender (Figures 5F, G) and tumor stage (Figures 5H, I).
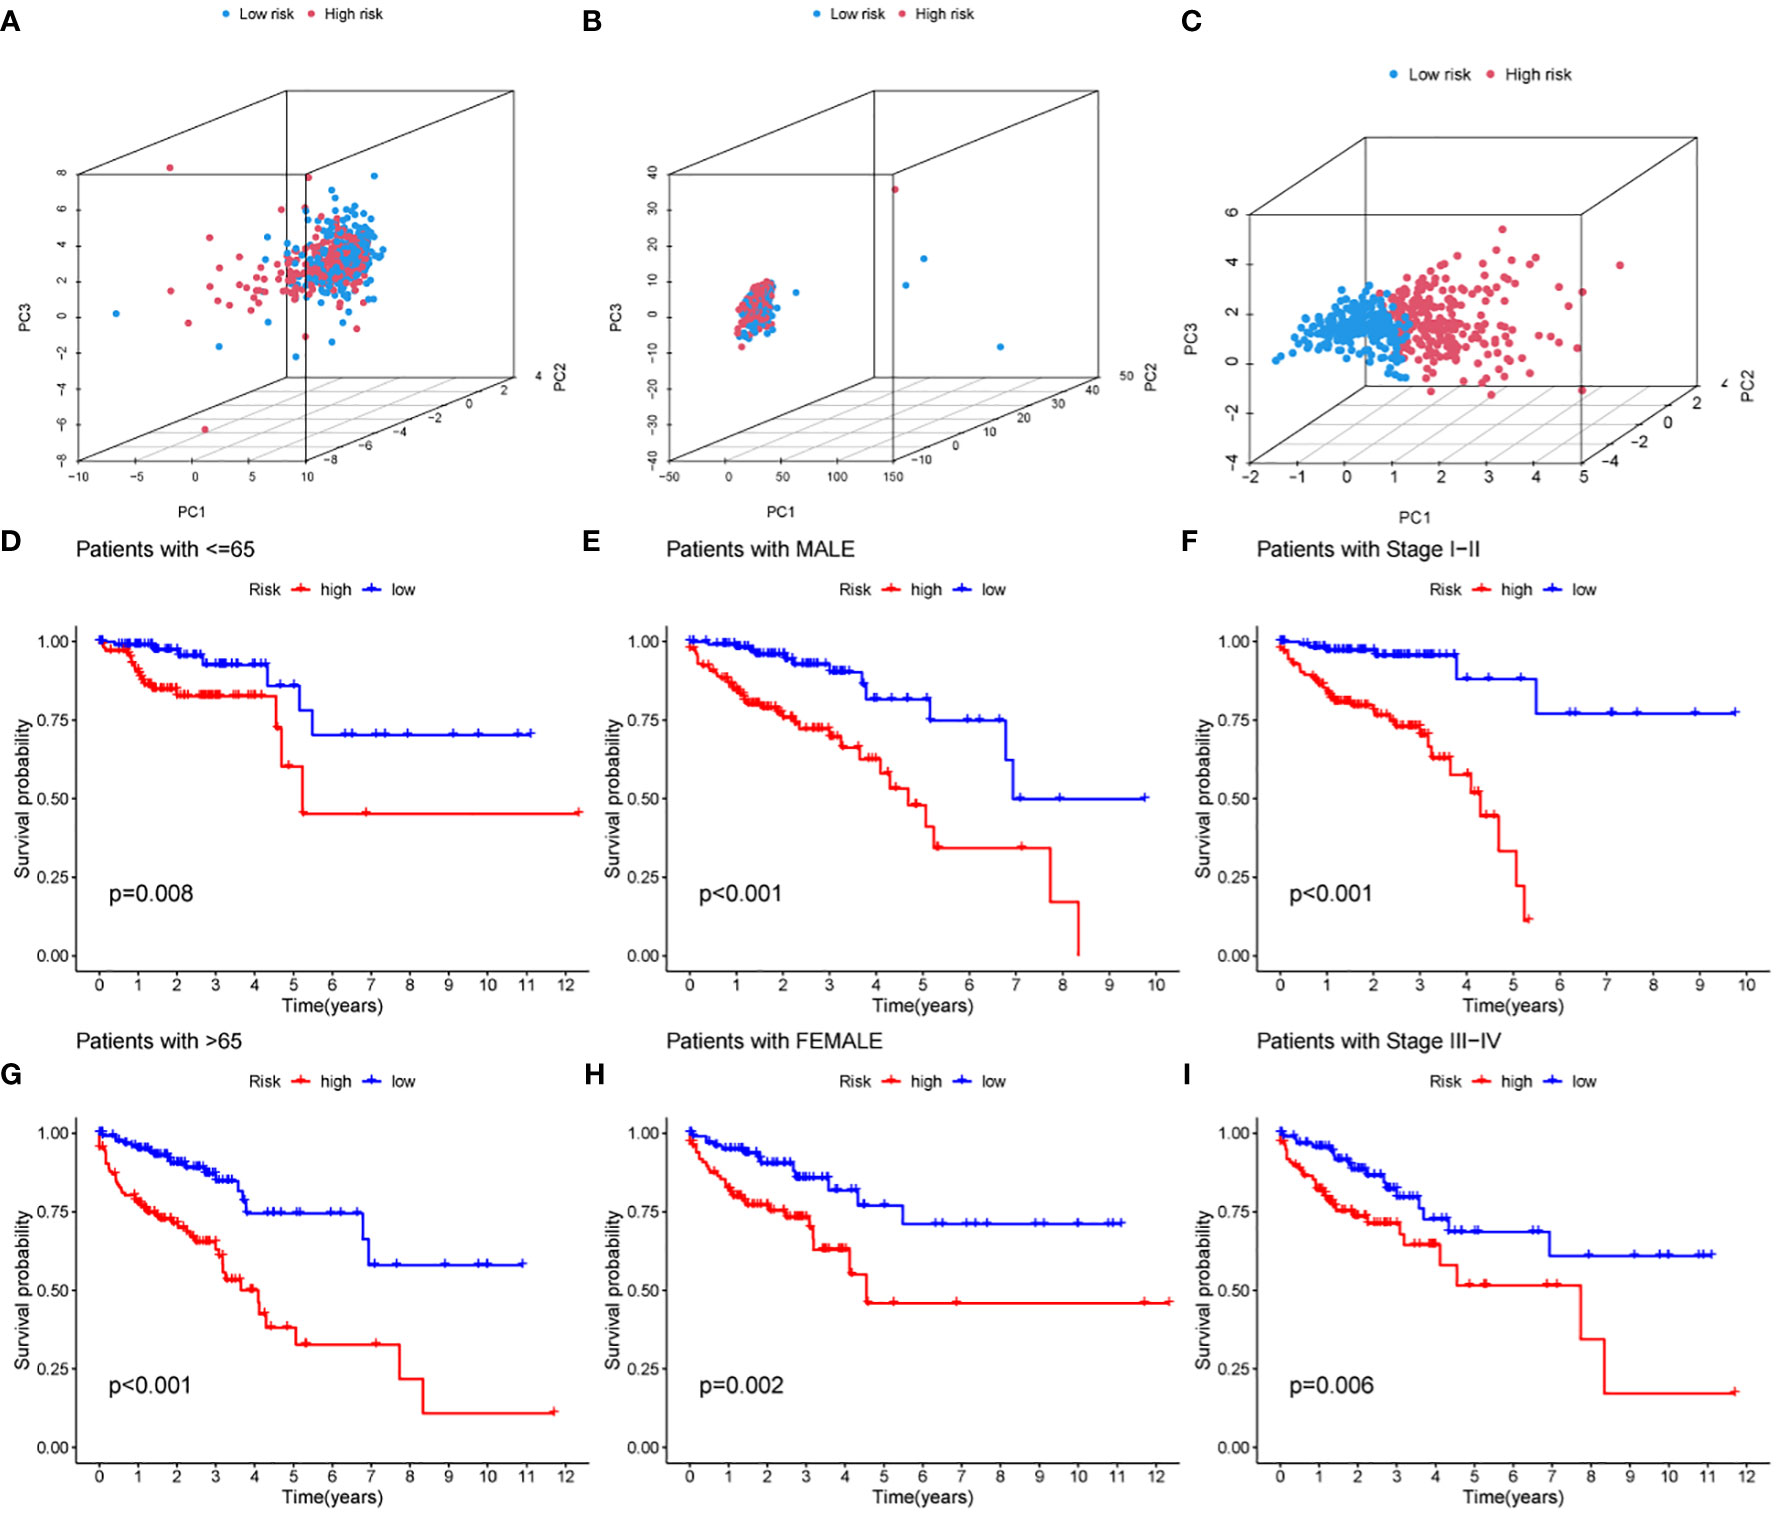
Figure 5 Prognostic analysis of MRLncRI in different pathological features. (A–C) PCA analysis of high-risk group and low-risk group based on HMRG, HMRG-related LncRNA and hub LncRNA. (D, E) Kaplan-Meier survival curve analysis of high-risk group and low-risk group under different age groups. (F, G) Kaplan-Meier survival curve analysis of high-risk group and low-risk group under different gender groups. (H, I) Kaplan-Meier survival curve analysis of high-risk group and low-risk group under different tumor stages.
3.3 Nomogram construction based on MRLncRI
We further explored whether MRLncRI is an independent factor affecting the prognosis of CRC patients. We included common clinical parameters (sex, age and stage) for adjustment. Univariate and multivariate Cox regression analysis showed that MRLncRI and tumor stage were independent risk factors affecting the prognosis of CRC patients (Figures 6A, B). In addition, in order to highlight the clinical application value of MRLncRI, we constructed a nomogram. The nomogram included MRLncRI as well as three easily accessible clinical parameters (Figure 6C). First, we evaluated the sensitivity and specificity of clinical parameters, MRLncRI, and nomogram in predicting patients’ OS using ROC curves. The results showed that the nomogram significantly improved the ability of a single indicator to predict OS (Figure 6D). In addition, c-index also shows that nomogram has a strong ability to predict OS (Figure 6E). Finally, the calibration curve showed a strong agreement between the predicted and actual values of the nomogram for predicting patient OS (Figure 6F). Taken together, these results consistently suggest that the nomogram has excellent potential clinical utility for predicting patient OS.
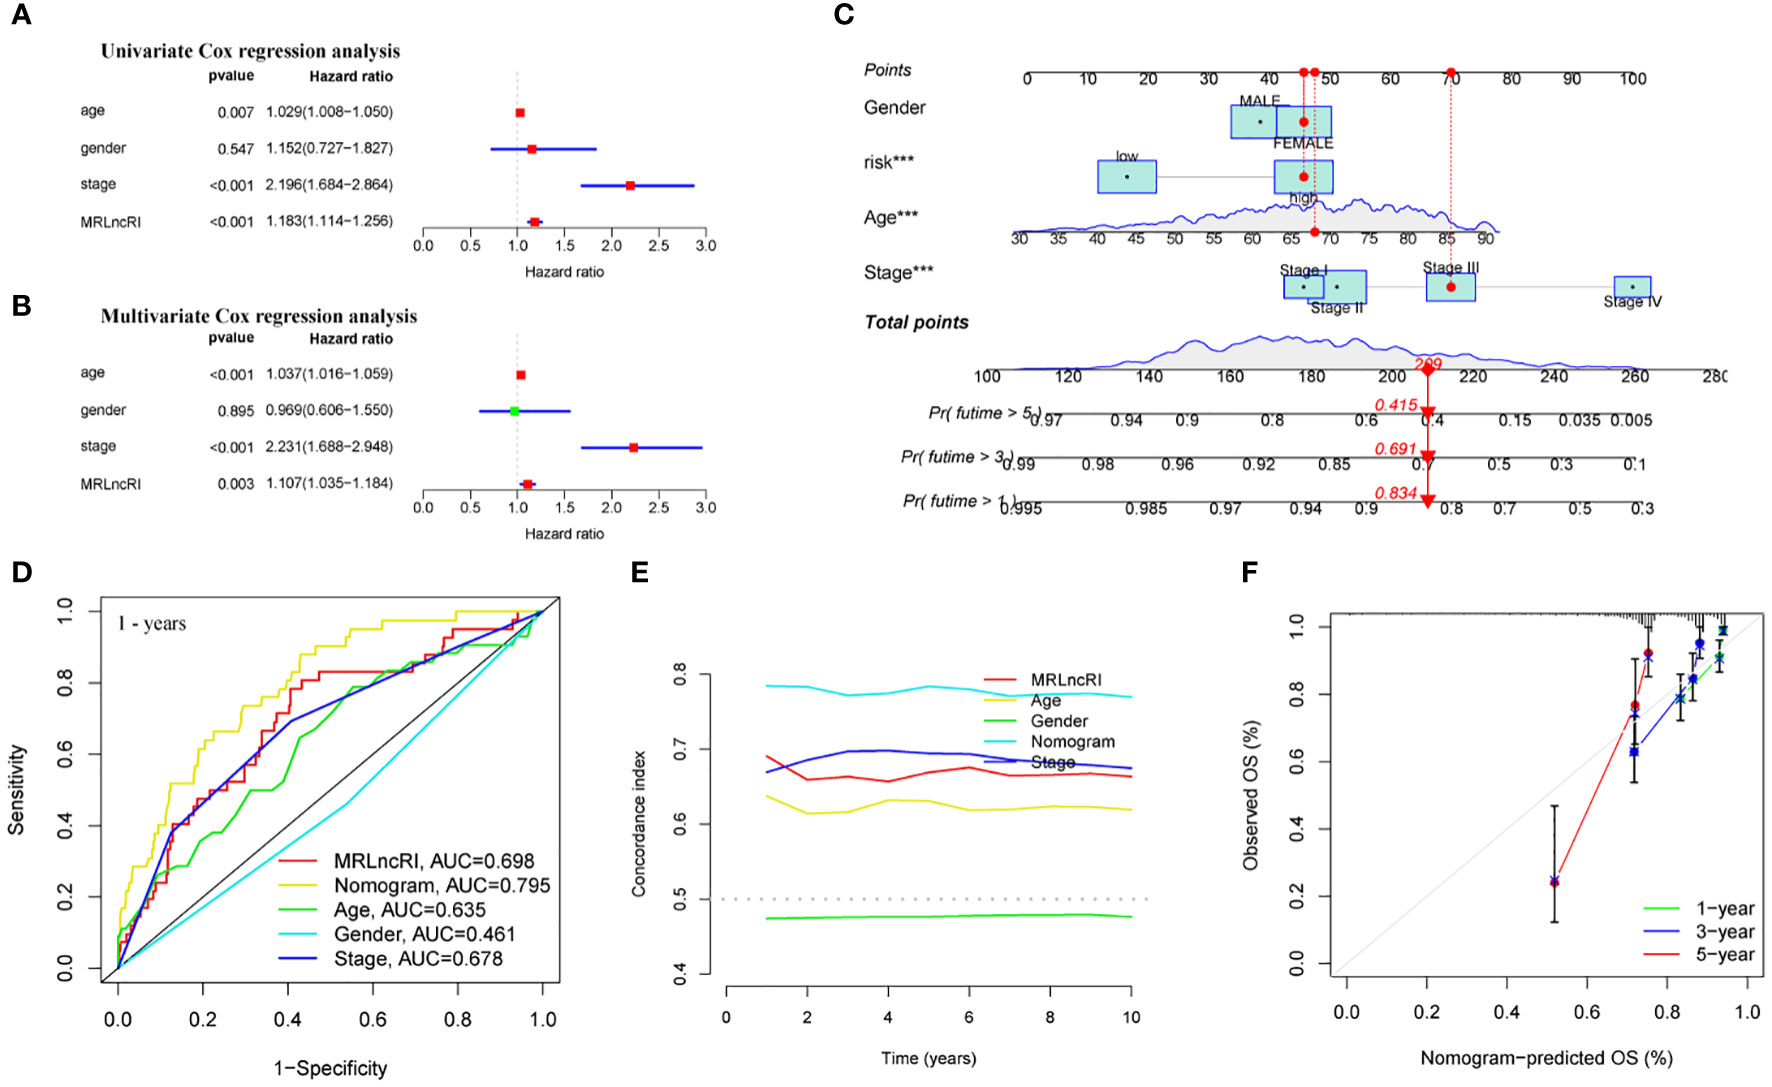
Figure 6 Construction and evaluation of nomogram. (A) Univariate Cox regression analysis of MRLncRI and common clinical parameters in CRC. (B) Multivariate Cox regression analysis of MRLncRI and common clinical parameters in CRC. (C) Nomogram combined with MRLncRI and common clinical parameters. (D) ROC of nomogram, MRLncRI and common clinical parameters. (E) C-index of nomogram, MRLncRI and common clinical parameters. (F) Calibration curves of nomogram predicting 1-year, 3-year and 5-year OS in CRC patients.
3.4 GSEA
We further used GSEA to explore biological functional differences in different risk groups. The results showed that the high-risk group participated in signaling pathways mainly involving: KEGG CELL ADHESION MOLECULES CAMS, KEGG COMPLEMENT AND COAGULATION CASCADES, KEGG CYTOKINE CYTOKINE RECEPTOR INTERACTION, KEGG ECM RECEPTOR INTERACTION, KEGG FOCAL ADHESION (Figure 7A). The signaling pathways involved in the low-risk group mainly involve: KEGG ARGININE AND PROLINE METABOLISM, KEGG CITRATE CYCLE TCA CYCLE, KEGG DNA REPLICATION, KEGG GLYOXYLATE AND DICARBOXYLATE METABOLISM, KEGG ONE CARBON POOL BY FOLATE (Figure 7B).
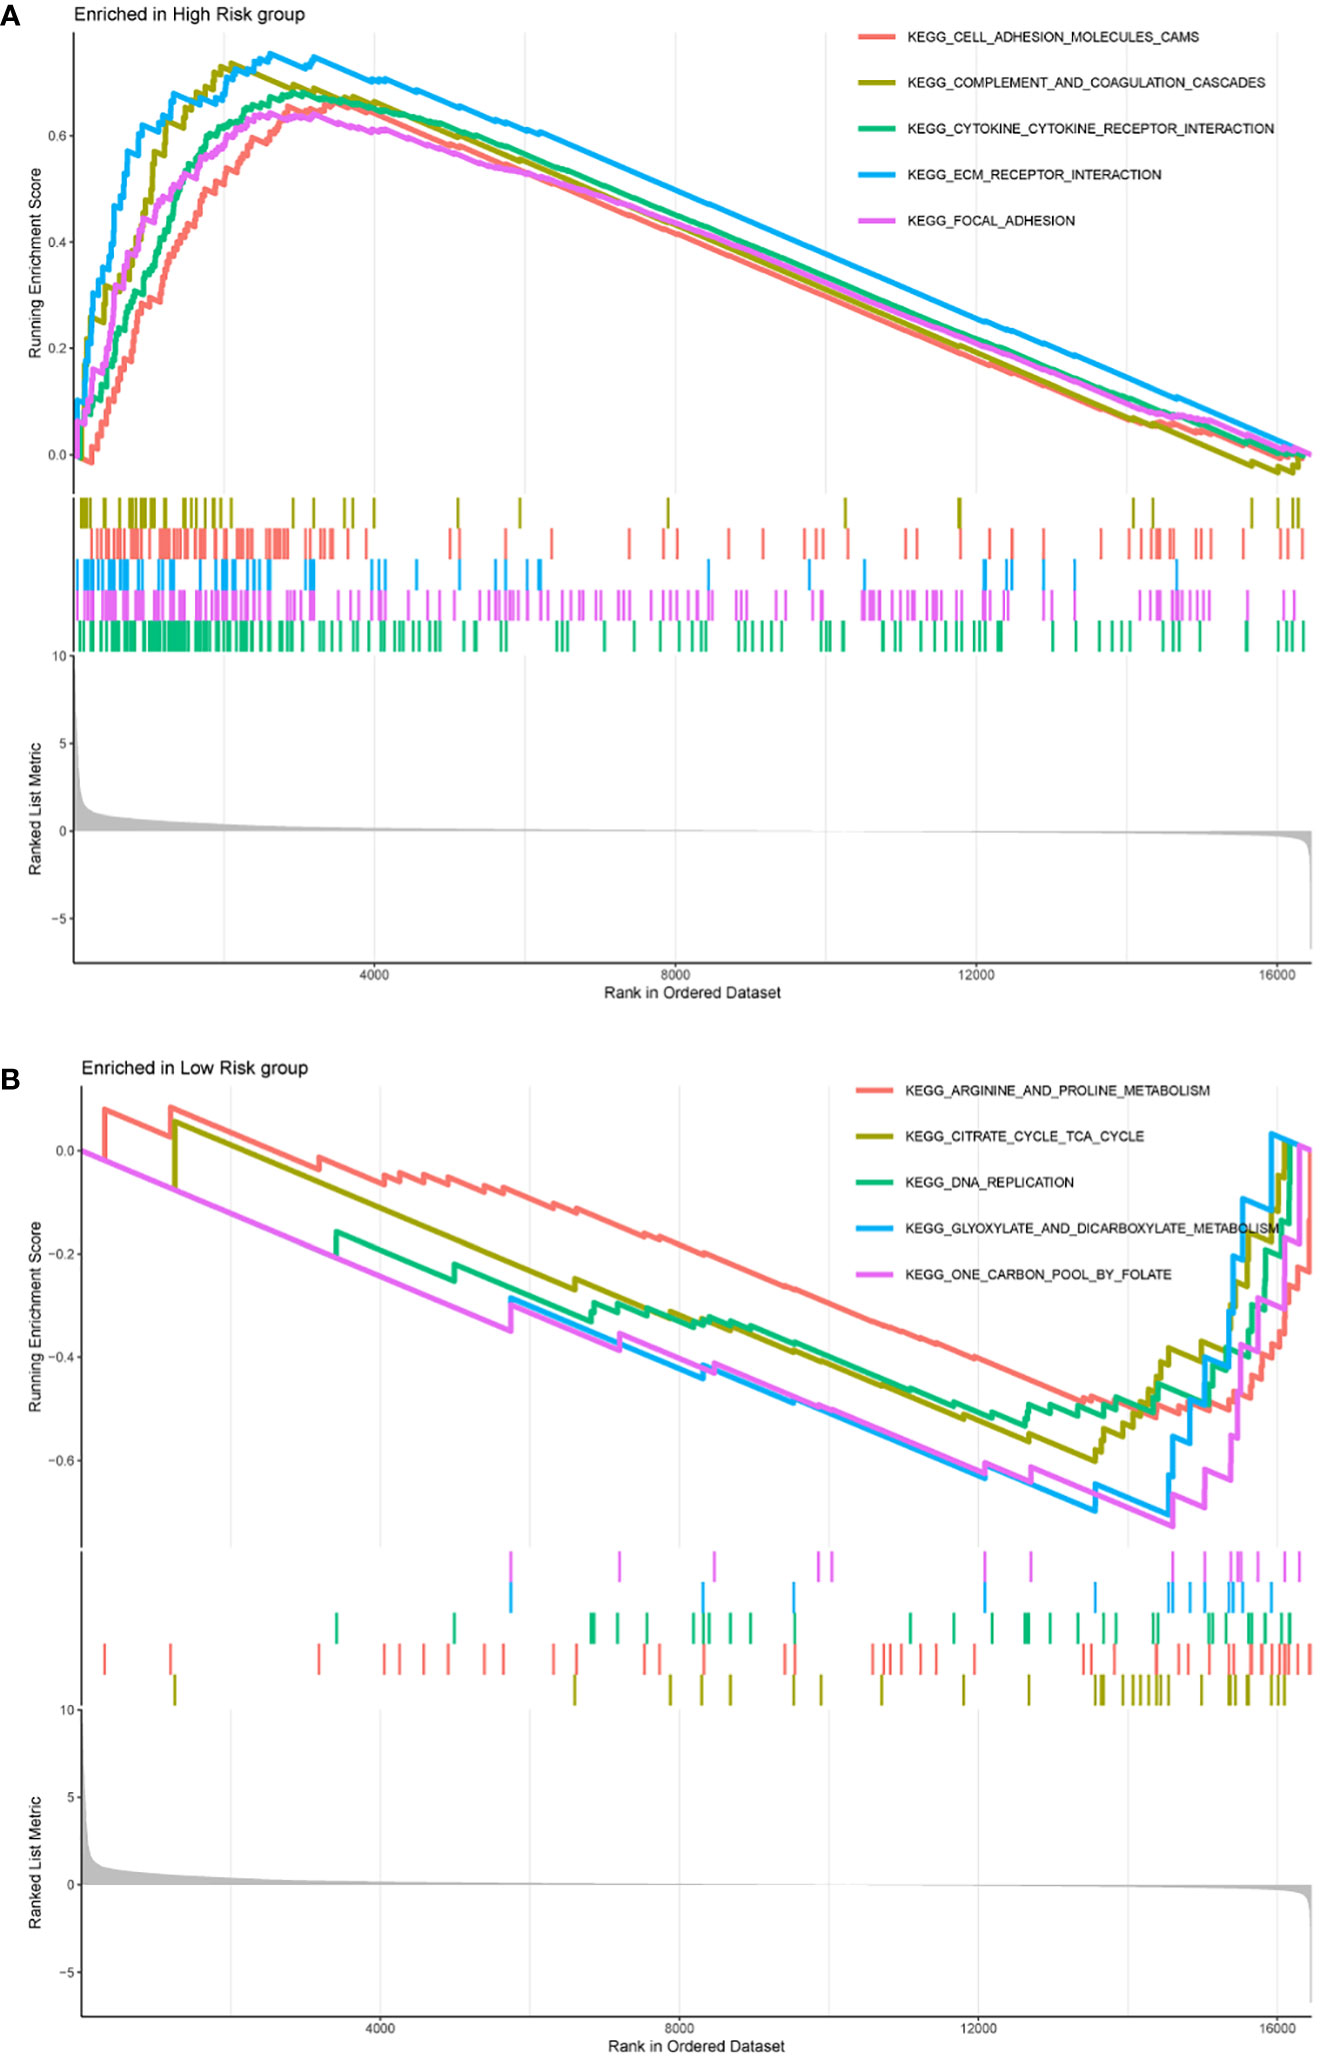
Figure 7 The top five signaling pathways enriched in high-risk group (A) and low-risk group (B) were shown by GSEA analysis, respectively.
3.5 The effect of MRLncRI on the TME and its value in guiding immunotherapy
First, we quantitatively scored 13 immune-related terms and 16 immune cell types using ssGSEA and visualized using heatmaps (Figures 8A, B). In addition, we conducted a difference analysis, and the results showed that the levels of APC_co_stimulation, CCR, Check−point, HLA, Parainflammation, T_cell_co−stimulation, Type_I_IFN_Reponse, Type_II_IFN_Reponse, B_cells, DCs, iDCs, Macrophages, Mast_cells, Neutrophils, NK_cells, pDCs, T_helper_cells, Tfh, TIL, Treg in the high-risk group were significantly higher than those in the low-risk group (Figures 8C, D).
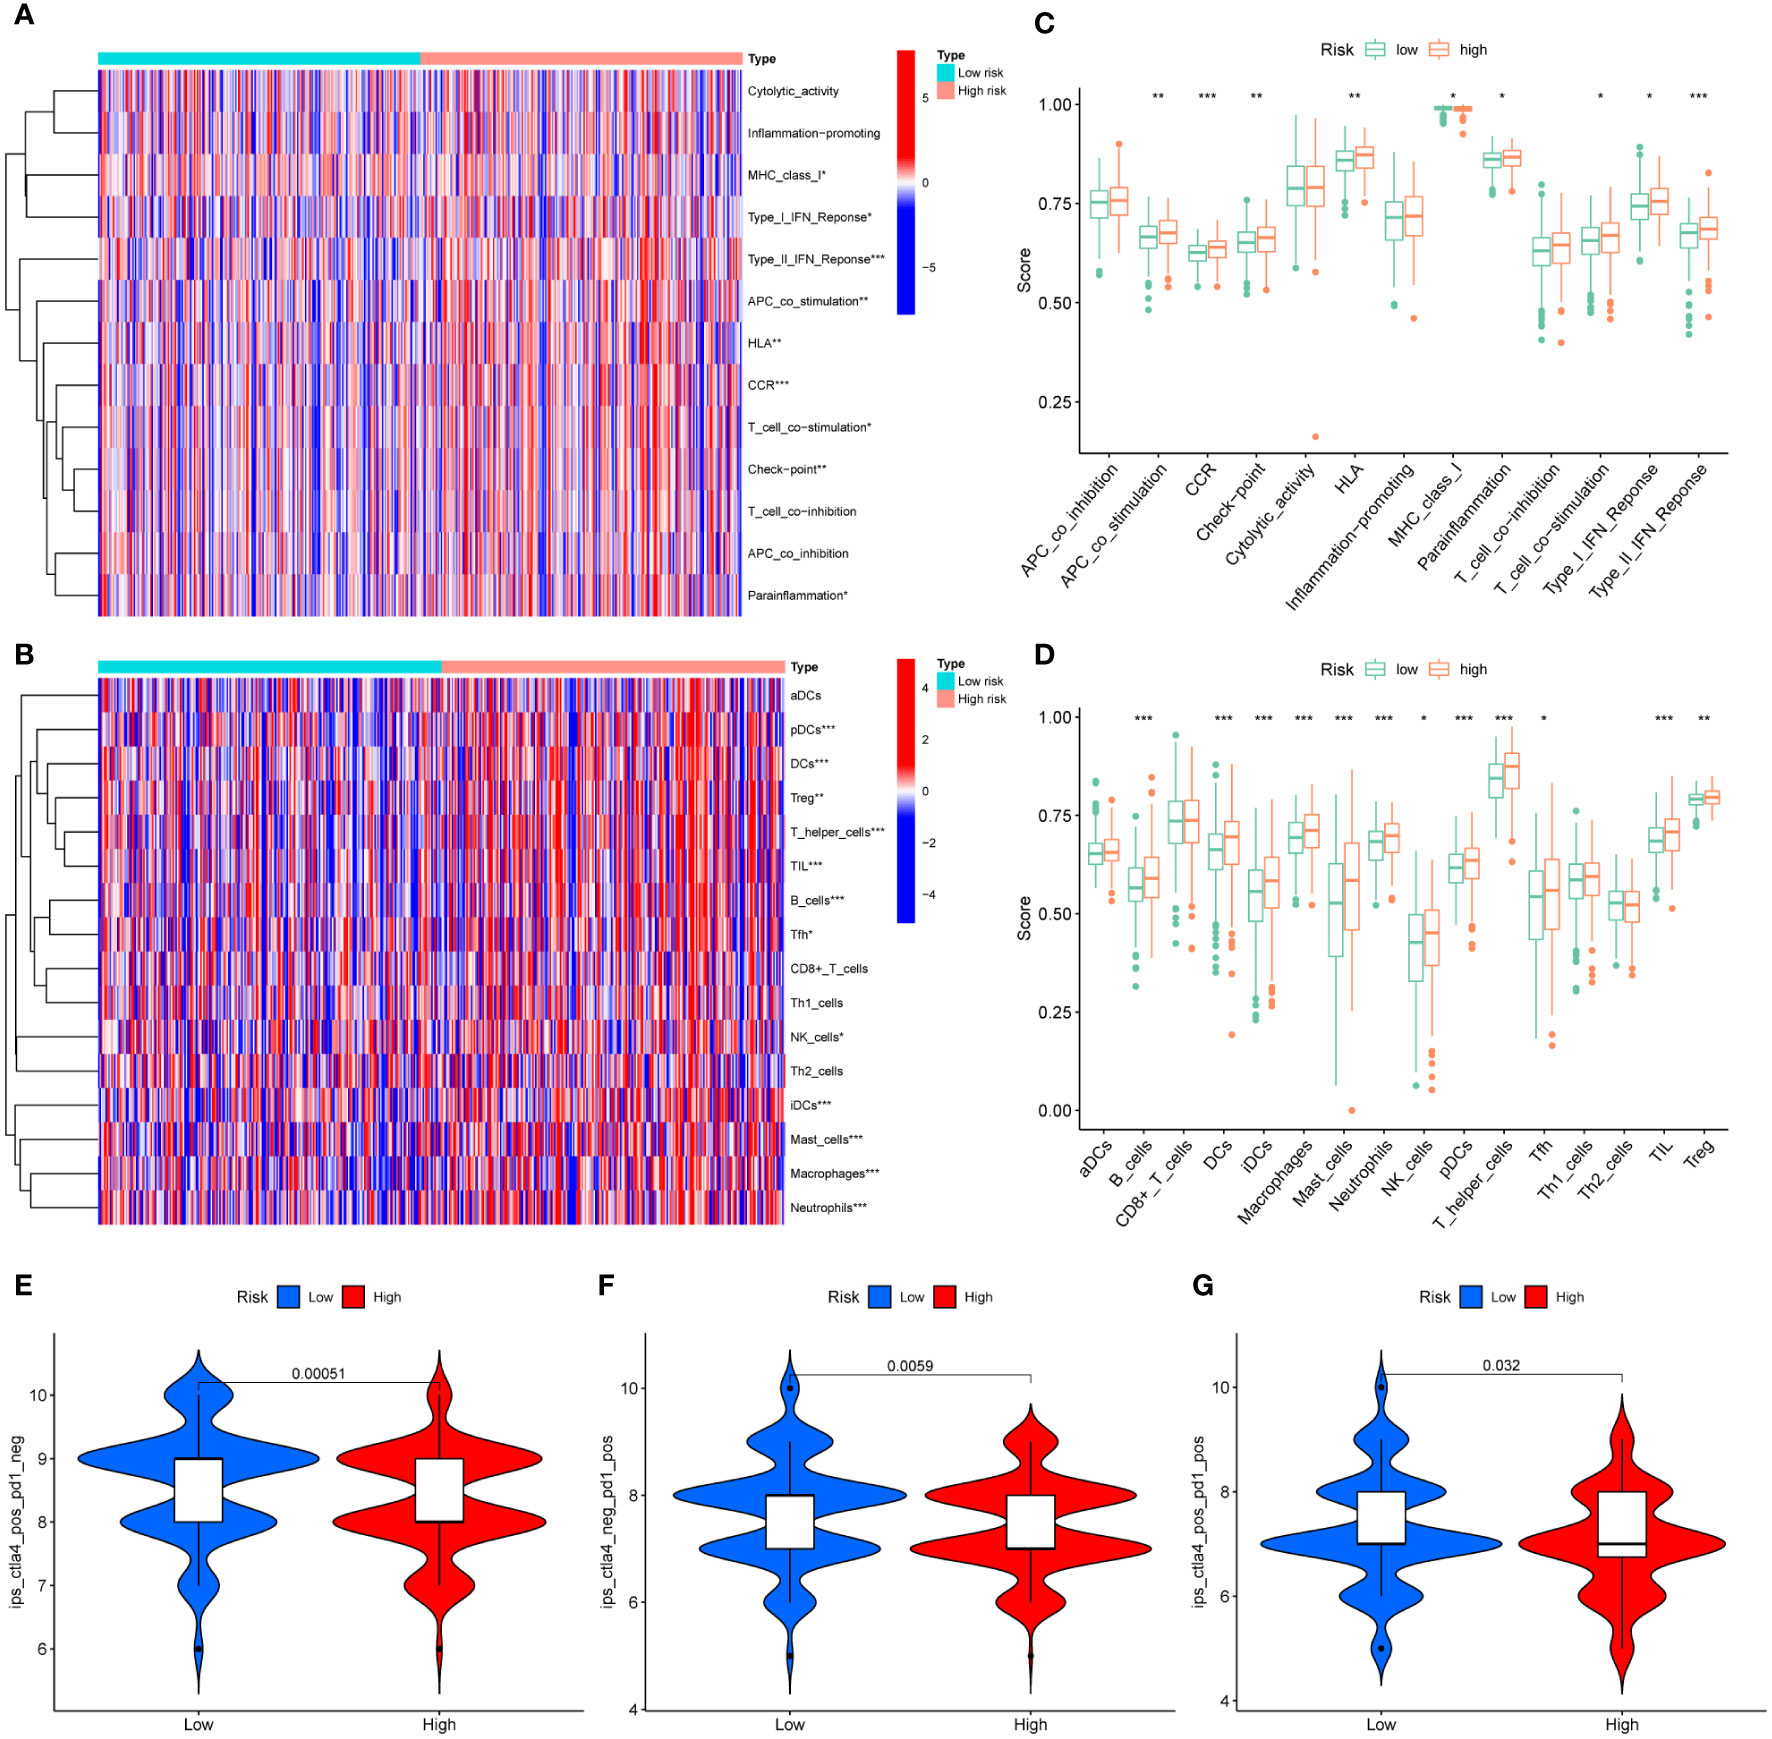
Figure 8 Differences in TME in different risk groups. (A) Heatmap of 13 immune-related terms in CRC samples. (B) Heat map of 16 types of immune cell infiltration in CRC samples. (C) Difference analysis of 13 immune-related terms in high-risk group and low-risk group. (D) Difference analysis of 16 kinds of immune cell infiltration in high-risk group and low-risk group. (E–G) Difference analysis of IPS scores between high-risk and low-risk groups. * represents p < 0.05, ** represents p < 0.01, and *** represents p < 0.001.
In addition, we further evaluated the guiding value of the MRLncRI for immunotherapy using the IPS. The results showed that the high-risk group had higher IPS scores in the anti-PD1, anti-CTLA4 and combined anti-PD1-CTAL4 treatment groups (Figures 8E–F), indicating that patients in the high-risk group may be more suitable for immunotherapy.
3.6 Potential drug screening
We evaluated the IC50 values of common drugs using the oncopredict package. The results showed that the IC50 values of 5-Fluorouracil, Cisplatin, Gefitinib, Oxaliplatin, and Tamoxifen were lower in the low-risk group, and the IC50 values of Dasatinib in the high-risk group were lower (Figures 9A–F). In addition, we also analyzed the correlation between MRLncRI and IC50 using scatterplots (Figures 9G–L). The lower the IC50 value, the higher the drug sensitivity and the better the therapeutic effect.
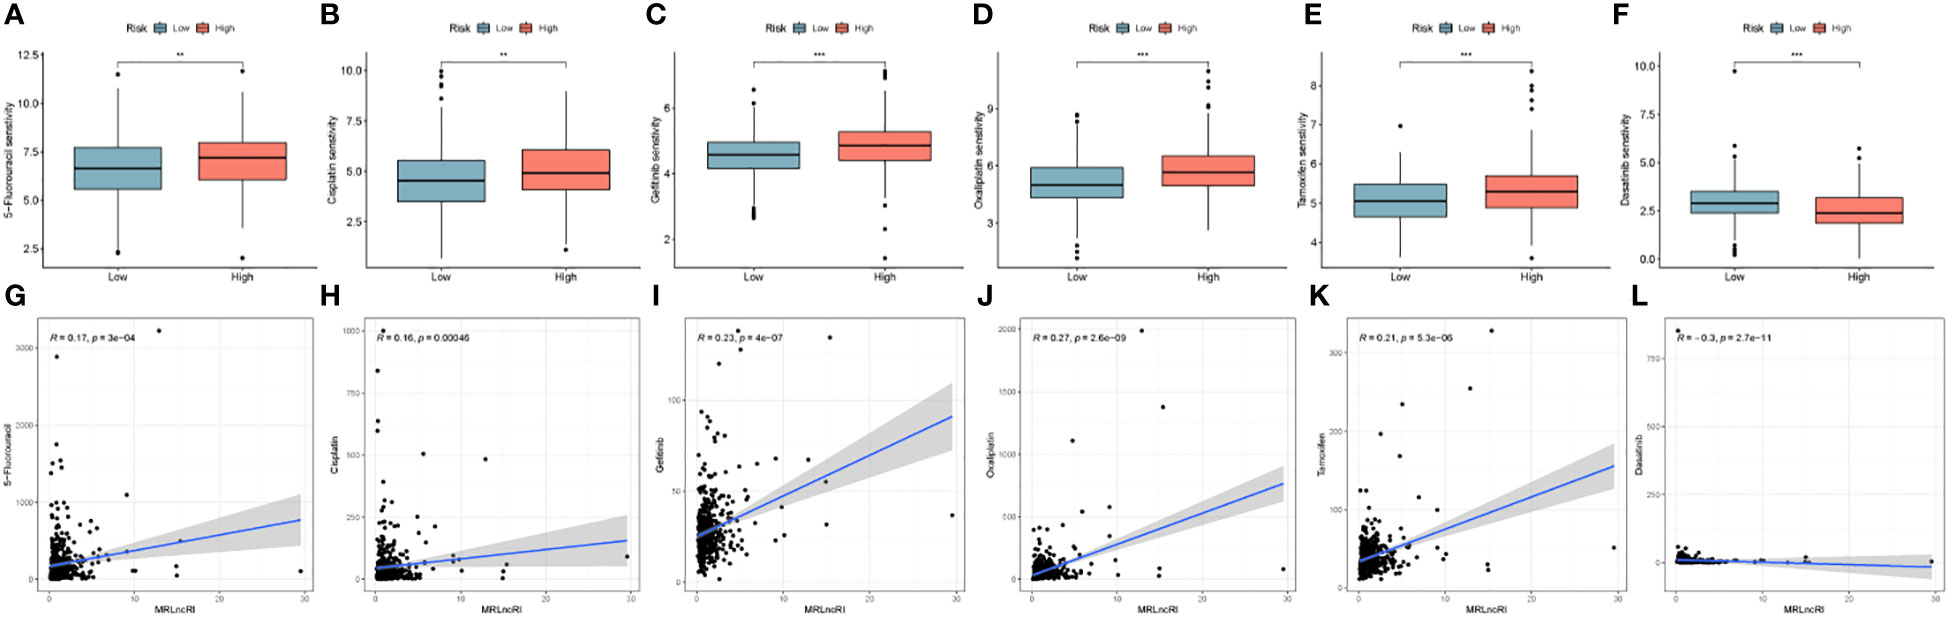
Figure 9 (A–F) IC50 difference of 6 common drugs in high-risk group and low-risk group. (G–L) Correlation between MRLncRI and IC50 of 6 commonly used drugs. ** represents p < 0.01, and *** represents p < 0.001.
3.7 Expression verification of hub lncRNA
This study further explored the expression of 3 hub lncRNA in CRC tissues. The results showed that among the 24 pairs of CRC tissues and adjacent normal tissues, the expressions of AC004846.1, AL391422.4 and UBA6-AS1 in CRC tissues were significantly higher than those in normal tissues (Supplementary Figures 1A–C). These results are consistent with those of the bioinformatics analysis.
4 Discussion
Nearly a hundred years ago, studies have shown that tumor cells have a significantly higher demand for glucose than normal cells (26), implying metabolic reprogramming of tumor cells. Furthermore, the same phenomenon was found on other tumors as well as metabolites (27, 28). Although the research on metabolism and tumor has been developed for a long time, there is still a lack of biomarkers that can effectively predict the prognosis of CRC. LncRNA participate in various biological processes of CRC, such as growth, metastasis, drug resistance and tumor immune microenvironment (29–31). More importantly, lncRNA can also affect the progression of CRC through metabolic reprogramming (30, 32–34). Therefore, we believe that the systematic analysis of lncRNA related to metabolism is very promising for predicting the prognosis of CRC patients.
In this study, we constructed the MRLncRI by a multidimensional statistical method. Patients were divided into high-risk and low-risk groups according to the median risk index, and the total cohort was randomly divided into a training cohort and a validation cohort. MRLncRI consists of three high-risk lncRNA, AC004846.1, AL391422.4, and UBA6-AS1. Previous studies have shown that UBA6-AS1 can inhibit the proliferation ability of CRC cells in vitro and is associated with poorer prognosis (35). This is consistent with the results of this study and also reflects the accuracy of this study. In addition, the prognostic analysis showed that the prognosis of patients in the high-risk group was worse than that in the low-risk group, including OS, DSS, and DFS. In more detail, under different clinical parameters, the prognosis of patients in the high-risk group is worse than that of patients in the low-risk group. More importantly, this study constructed a nomogram that is easier to use clinically. As expected, the ROC, c-index and calibration curves showed that the MRLncRI-based nomogram has high accuracy and robustness in predicting the prognosis of CRC.
Targeting the tumor microenvironment could help improve the effects of immunotherapy, current study suggests (36–38). Tumors with a high degree of immune cell infiltration in the tumor microenvironment and a good response to immunotherapy are called hot tumors, and vice versa are called cold tumors (22). In this study, we estimated the TME of tumor in CRC patients by ssGSEA. The results showed that the level of most immune cells and immune-related terms in the high-risk group was higher than that in the low-risk group. These results mean that patients in the high-risk group tend to have hot tumors and respond better to immunotherapy. Next, we will further explore this view through IPS score. The results showed that the patients in the high-risk group responded better to PD1 and CTLA4-based immunotherapy. In conclusion, the high-risk group is more likely to be classified as hot tumor, and the low-risk group is more likely to be classified as cold tumor.
In addition, drug sensitivity analysis showed that patients in the low-risk group had higher sensitivity to 5-Fluorouracil, Cisplatin, Gefitinib, Oxaliplatin, and Tamoxifen, and patients in the high-risk group had higher sensitivity to Dasatinib, which provided some guidance for the clinical use of CRC patients.
In addition, this study still has some shortcomings. First, no external validation of the prognostic model was performed in this study due to the lack of complete LncRNA expression profiles and prognostic data in public databases. Secondly, in this study, the biological function of the model lincRNA has not been verified by in vitro and in vivo experiments. In the future, our research will focus more on the exploration of the biological function of the model LncRNA and the external validation of the prognosis model.
5 Conclusion
In summary, our study constructed a MRLncRI based on metabolism-related genes and lncRNA. The model can accurately predict the prognosis of CRC patients. In addition, the model can effectively distinguish hot tumors from cold tumors, providing some valuable information for clinical treatment.
Data availability statement
The original contributions presented in the study are included in the article/Supplementary Material. Further inquiries can be directed to the corresponding author.
Ethics statement
The studies involving human participants were reviewed and approved by The Ethics Committee of Tongren Hospital, Shanghai Jiao Tong University School of Medicine. The patients/participants provided their written informed consent to participate in this study.
Author contributions
YY were responsible for the design of the study. QL were responsible for data download and analysis and wrote the manuscript. ZW, JW and MX were responsible for picture arrangement and typesetting. All authors contributed to the article and approved the submitted version.
Funding
This work was qualified by the Key Medical Specialty of Shanghai (Gastrointestinal Surgery, No. ZK2019A15), and the Research Fund of Shanghai Tongren Hospital, Shanghai Jiaotong University School of Medicine.
Conflict of interest
The authors declare that the research was conducted in the absence of any commercial or financial relationships that could be construed as a potential conflict of interest.
Publisher’s note
All claims expressed in this article are solely those of the authors and do not necessarily represent those of their affiliated organizations, or those of the publisher, the editors and the reviewers. Any product that may be evaluated in this article, or claim that may be made by its manufacturer, is not guaranteed or endorsed by the publisher.
Supplementary material
The Supplementary Material for this article can be found online at: https://www.frontiersin.org/articles/10.3389/fonc.2023.1163283/full#supplementary-material
Supplementary Figure 1 | Expression of hub lncRNA in CRC tissues. (A–C) Differential expression analysis of AC004846.1, AL391422.4 and UBA6-AS1 in CRC tissues and adjacent normal tissues.
References
1. Sung H, Ferlay J, Siegel RL, Laversanne M, Soerjomataram I, Jemal A, et al. Global cancer statistics 2020: Globocan estimates of incidence and mortality worldwide for 36 cancers in 185 countries. CA: Cancer J Clin (2021) 71(3):209–49. doi: 10.3322/caac.21660
2. Morgan E, Arnold M, Gini A, Lorenzoni V, Cabasag CJ, Laversanne M, et al. Global burden of colorectal cancer in 2020 and 2040: Incidence and mortality estimates from globocan. Gut (2023) 72(2):338–44. doi: 10.1136/gutjnl-2022-327736
3. Hanahan D, Weinberg RA. Hallmarks of cancer: The next generation. Cell (2011) 144(5):646–74. doi: 10.1016/j.cell.2011.02.013
4. Martínez-Reyes I, Chandel NS. Cancer metabolism: Looking forward. Nat Rev Cancer (2021) 21(10):669–80. doi: 10.1038/s41568-021-00378-6
5. DeBerardinis RJ, Chandel NS. Fundamentals of cancer metabolism. Sci Adv (2016) 2(5):e1600200. doi: 10.1126/sciadv.1600200
6. Pavlova NN, Thompson CB. The emerging hallmarks of cancer metabolism. Cell Metab (2016) 23(1):27–47. doi: 10.1016/j.cmet.2015.12.006
7. Dey P, Kimmelman AC, DePinho RA. Metabolic codependencies in the tumor microenvironment. Cancer Discov (2021) 11(5):1067–81. doi: 10.1158/2159-8290.cd-20-1211
8. Vander Heiden MG, Cantley LC, Thompson CB. Understanding the warburg effect: The metabolic requirements of cell proliferation. Sci (New York NY) (2009) 324(5930):1029–33. doi: 10.1126/science.1160809
9. Lacroix M, Riscal R, Arena G, Linares LK, Le Cam L. Metabolic functions of the tumor suppressor P53: Implications in normal physiology, metabolic disorders, and cancer. Mol Metab (2020) 33:2–22. doi: 10.1016/j.molmet.2019.10.002
10. Chen LL, Wang WJ. P53 regulates lipid metabolism in cancer. Int J Biol Macromol (2021) 192:45–54. doi: 10.1016/j.ijbiomac.2021.09.188
11. Gordan JD, Thompson CB, Simon MC. Hif and c-myc: Sibling rivals for control of cancer cell metabolism and proliferation. Cancer Cell (2007) 12(2):108–13. doi: 10.1016/j.ccr.2007.07.006
12. Huang LE. Carrot and stick: Hif-alpha engages c-myc in hypoxic adaptation. Cell Death Differ (2008) 15(4):672–7. doi: 10.1038/sj.cdd.4402302
13. Gnanaprakasam JNR, Sherman JW, Wang R. Myc and hif in shaping immune response and immune metabolism. Cytokine Growth Factor Rev (2017) 35:63–70. doi: 10.1016/j.cytogfr.2017.03.004
14. Li J, Meng H, Bai Y, Wang K. Regulation of lncrna and its role in cancer metastasis. Oncol Res (2016) 23(5):205–17. doi: 10.3727/096504016x14549667334007
15. Smolarz B, Romanowicz H. The role of lncrna in the development of tumors, including breast cancer. Int J Mol Sci (2021) 22(16):8427. doi: 10.3390/ijms22168427
16. Fang Y, Fullwood MJ. Roles, functions, and mechanisms of long non-coding rnas in cancer. Genomics Proteomics Bioinf (2016) 14(1):42–54. doi: 10.1016/j.gpb.2015.09.006
17. Chi Y, Wang D, Wang J, Yu W, Yang J. Long non-coding rna in the pathogenesis of cancers. Cells (2019) 8(9):1015. doi: 10.3390/cells8091015
18. Lin W, Zhou Q, Wang CQ, Zhu L, Bi C, Zhang S, et al. Lncrnas regulate metabolism in cancer. Int J Biol Sci (2020) 16(7):1194–206. doi: 10.7150/ijbs.40769
19. Tan YT, Lin JF, Li T, Li JJ, Xu RH, Ju HQ. Lncrna-mediated posttranslational modifications and reprogramming of energy metabolism in cancer. Cancer Commun (London England) (2021) 41(2):109–20. doi: 10.1002/cac2.12108
20. Yang Y, Feng M, Bai L, Liao W, Zhou K, Zhang M, et al. Comprehensive analysis of emt-related genes and lncrnas in the prognosis, immunity, and drug treatment of colorectal cancer. J Trans Med (2021) 19(1):391. doi: 10.1186/s12967-021-03065-0
21. Liu Z, Liu L, Weng S, Guo C, Dang Q, Xu H, et al. Machine learning-based integration develops an immune-derived lncrna signature for improving outcomes in colorectal cancer. Nat Commun (2022) 13(1):816. doi: 10.1038/s41467-022-28421-6
22. Zhu Z, Zhao Q, Li S, Weng J, Guo T, Zhu C, et al. Comprehensive analysis of cuproptosis-related lncrnas to predict prognosis and immune infiltration characteristics in colorectal cancer. Front Genet (2022) 13:984743. doi: 10.3389/fgene.2022.984743
23. Shen J, Sun W, Liu J, Li J, Li Y, Gao Y. Metabolism-related signatures is correlated with poor prognosis and immune infiltration in hepatocellular carcinoma Via multi-omics analysis and basic experiments. Front Oncol (2023) 13:1130094. doi: 10.3389/fonc.2023.1130094
24. Charoentong P, Finotello F, Angelova M, Mayer C, Efremova M, Rieder D, et al. Pan-cancer immunogenomic analyses reveal genotype-immunophenotype relationships and predictors of response to checkpoint blockade. Cell Rep (2017) 18(1):248–62. doi: 10.1016/j.celrep.2016.12.019
25. Maeser D, Gruener RF, Huang RS. Oncopredict: An r package for predicting in vivo or cancer patient drug response and biomarkers from cell line screening data. Briefings Bioinf (2021) 22(6):bbab260. doi: 10.1093/bib/bbab260
26. Warburg O, Wind F, Negelein E. The metabolism of tumors in the body. J Gen Physiol (1927) 8(6):519–30. doi: 10.1085/jgp.8.6.519
27. Som P, Atkins HL, Bandoypadhyay D, Fowler JS, MacGregor RR, Matsui K, et al. A fluorinated glucose analog, 2-Fluoro-2-Deoxy-D-Glucose (F-18): Nontoxic tracer for rapid tumor detection. J Nucl Med Off publication Soc Nucl Med (1980) 21(7):670–5. doi: 10.1097/00004728-198012000-00045
28. Eagle H. The minimum vitamin requirements of the l and hela cells in tissue culture, the production of specific vitamin deficiencies, and their cure. J Exp Med (1955) 102(5):595–600. doi: 10.1084/jem.102.5.595
29. Lin X, Zhuang S, Chen X, Du J, Zhong L, Ding J, et al. Lncrna Itgb8-As1 functions as a cerna to promote colorectal cancer growth and migration through integrin-mediated focal adhesion signaling. Mol Ther J Am Soc Gene Ther (2022) 30(2):688–702. doi: 10.1016/j.ymthe.2021.08.011
30. Wang X, Zhang H, Yin S, Yang Y, Yang H, Yang J, et al. Lncrna-encoded pep-ap attenuates the pentose phosphate pathway and sensitizes colorectal cancer cells to oxaliplatin. EMBO Rep (2022) 23(1):e53140. doi: 10.15252/embr.202153140
31. Xu M, Xu X, Pan B, Chen X, Lin K, Zeng K, et al. Lncrna Satb2-As1 inhibits tumor metastasis and affects the tumor immune cell microenvironment in colorectal cancer by regulating Satb2. Mol Cancer (2019) 18(1):135. doi: 10.1186/s12943-019-1063-6
32. Tang J, Yan T, Bao Y, Shen C, Yu C, Zhu X, et al. Lncrna Glcc1 promotes colorectal carcinogenesis and glucose metabolism by stabilizing c-myc. Nat Commun (2019) 10(1):3499. doi: 10.1038/s41467-019-11447-8
33. Wang Y, Lu JH, Wu QN, Jin Y, Wang DS, Chen YX, et al. Lncrna linris stabilizes Igf2bp2 and promotes the aerobic glycolysis in colorectal cancer. Mol Cancer (2019) 18(1):174. doi: 10.1186/s12943-019-1105-0
34. Li C, Wang P, Du J, Chen J, Liu W, Ye K. Lncrna Rad51-As1/Mir-29b/C-3p/Ndrg2 crosstalk repressed proliferation, invasion and glycolysis of colorectal cancer. IUBMB Life (2021) 73(1):286–98. doi: 10.1002/iub.2427
35. Xu C, He T, Shao X, Gao L, Cao L. M6a-related lncrnas are potential biomarkers for the prognosis of coad patients. Front Oncol (2022) 12:920023. doi: 10.3389/fonc.2022.920023
36. Pitt JM, Marabelle A, Eggermont A, Soria JC, Kroemer G, Zitvogel L. Targeting the tumor microenvironment: Removing obstruction to anticancer immune responses and immunotherapy. Ann Oncol Off J Eur Soc Med Oncol (2016) 27(8):1482–92. doi: 10.1093/annonc/mdw168
37. Bejarano L, Jordāo MJC, Joyce JA. Therapeutic targeting of the tumor microenvironment. Cancer Discov (2021) 11(4):933–59. doi: 10.1158/2159-8290.cd-20-1808
Keywords: colorectal cancer, metabolism, lncRNA, prognosis, immunity, drug sensitivity
Citation: Lin Q, Wang Z, Wang J, Xu M and Yuan Y (2023) Construction and validation of a metabolic-associated lncRNA risk index for predicting colorectal cancer prognosis. Front. Oncol. 13:1163283. doi: 10.3389/fonc.2023.1163283
Received: 10 February 2023; Accepted: 21 March 2023;
Published: 31 March 2023.
Edited by:
Yuanyuan Zheng, Tongji University School of Medicine, ChinaReviewed by:
Fangdie Ye, Fudan University, ChinaQinjunjie Chen, Huazhong University of Science and Technology, China
Copyright © 2023 Lin, Wang, Wang, Xu and Yuan. This is an open-access article distributed under the terms of the Creative Commons Attribution License (CC BY). The use, distribution or reproduction in other forums is permitted, provided the original author(s) and the copyright owner(s) are credited and that the original publication in this journal is cited, in accordance with accepted academic practice. No use, distribution or reproduction is permitted which does not comply with these terms.
*Correspondence: Yihang Yuan, c3VyZ2VyeXVhbkBvdXRsb29rLmNvbQ==