 Cuifang Han
 Jiaru Chen1,2†
 Jincheng Zeng
 Hongbing Yu
95% of researchers rate our articles as excellent or good
Learn more about the work of our research integrity team to safeguard the quality of each article we publish.
Find out more
CORRECTION article
Front. Oncol. , 08 March 2023
Sec. Molecular and Cellular Oncology
Volume 13 - 2023 | https://doi.org/10.3389/fonc.2023.1162375
by Han C, Chen J, Huang J, Zhu R, Zeng J, Yu H and He Z (2023) Front. Oncol. 13:1104262. doi: 10.3389/fonc.2023.1104262
In the published article, there was an error in Figure 6 as published. The image of Figure 6G is superimposed on Figure 6H. The corrected Figure 6 and its caption Figure 6 HDG identification and validation in the training (TCGA-LIHC) and validation cohorts (GSE76427).
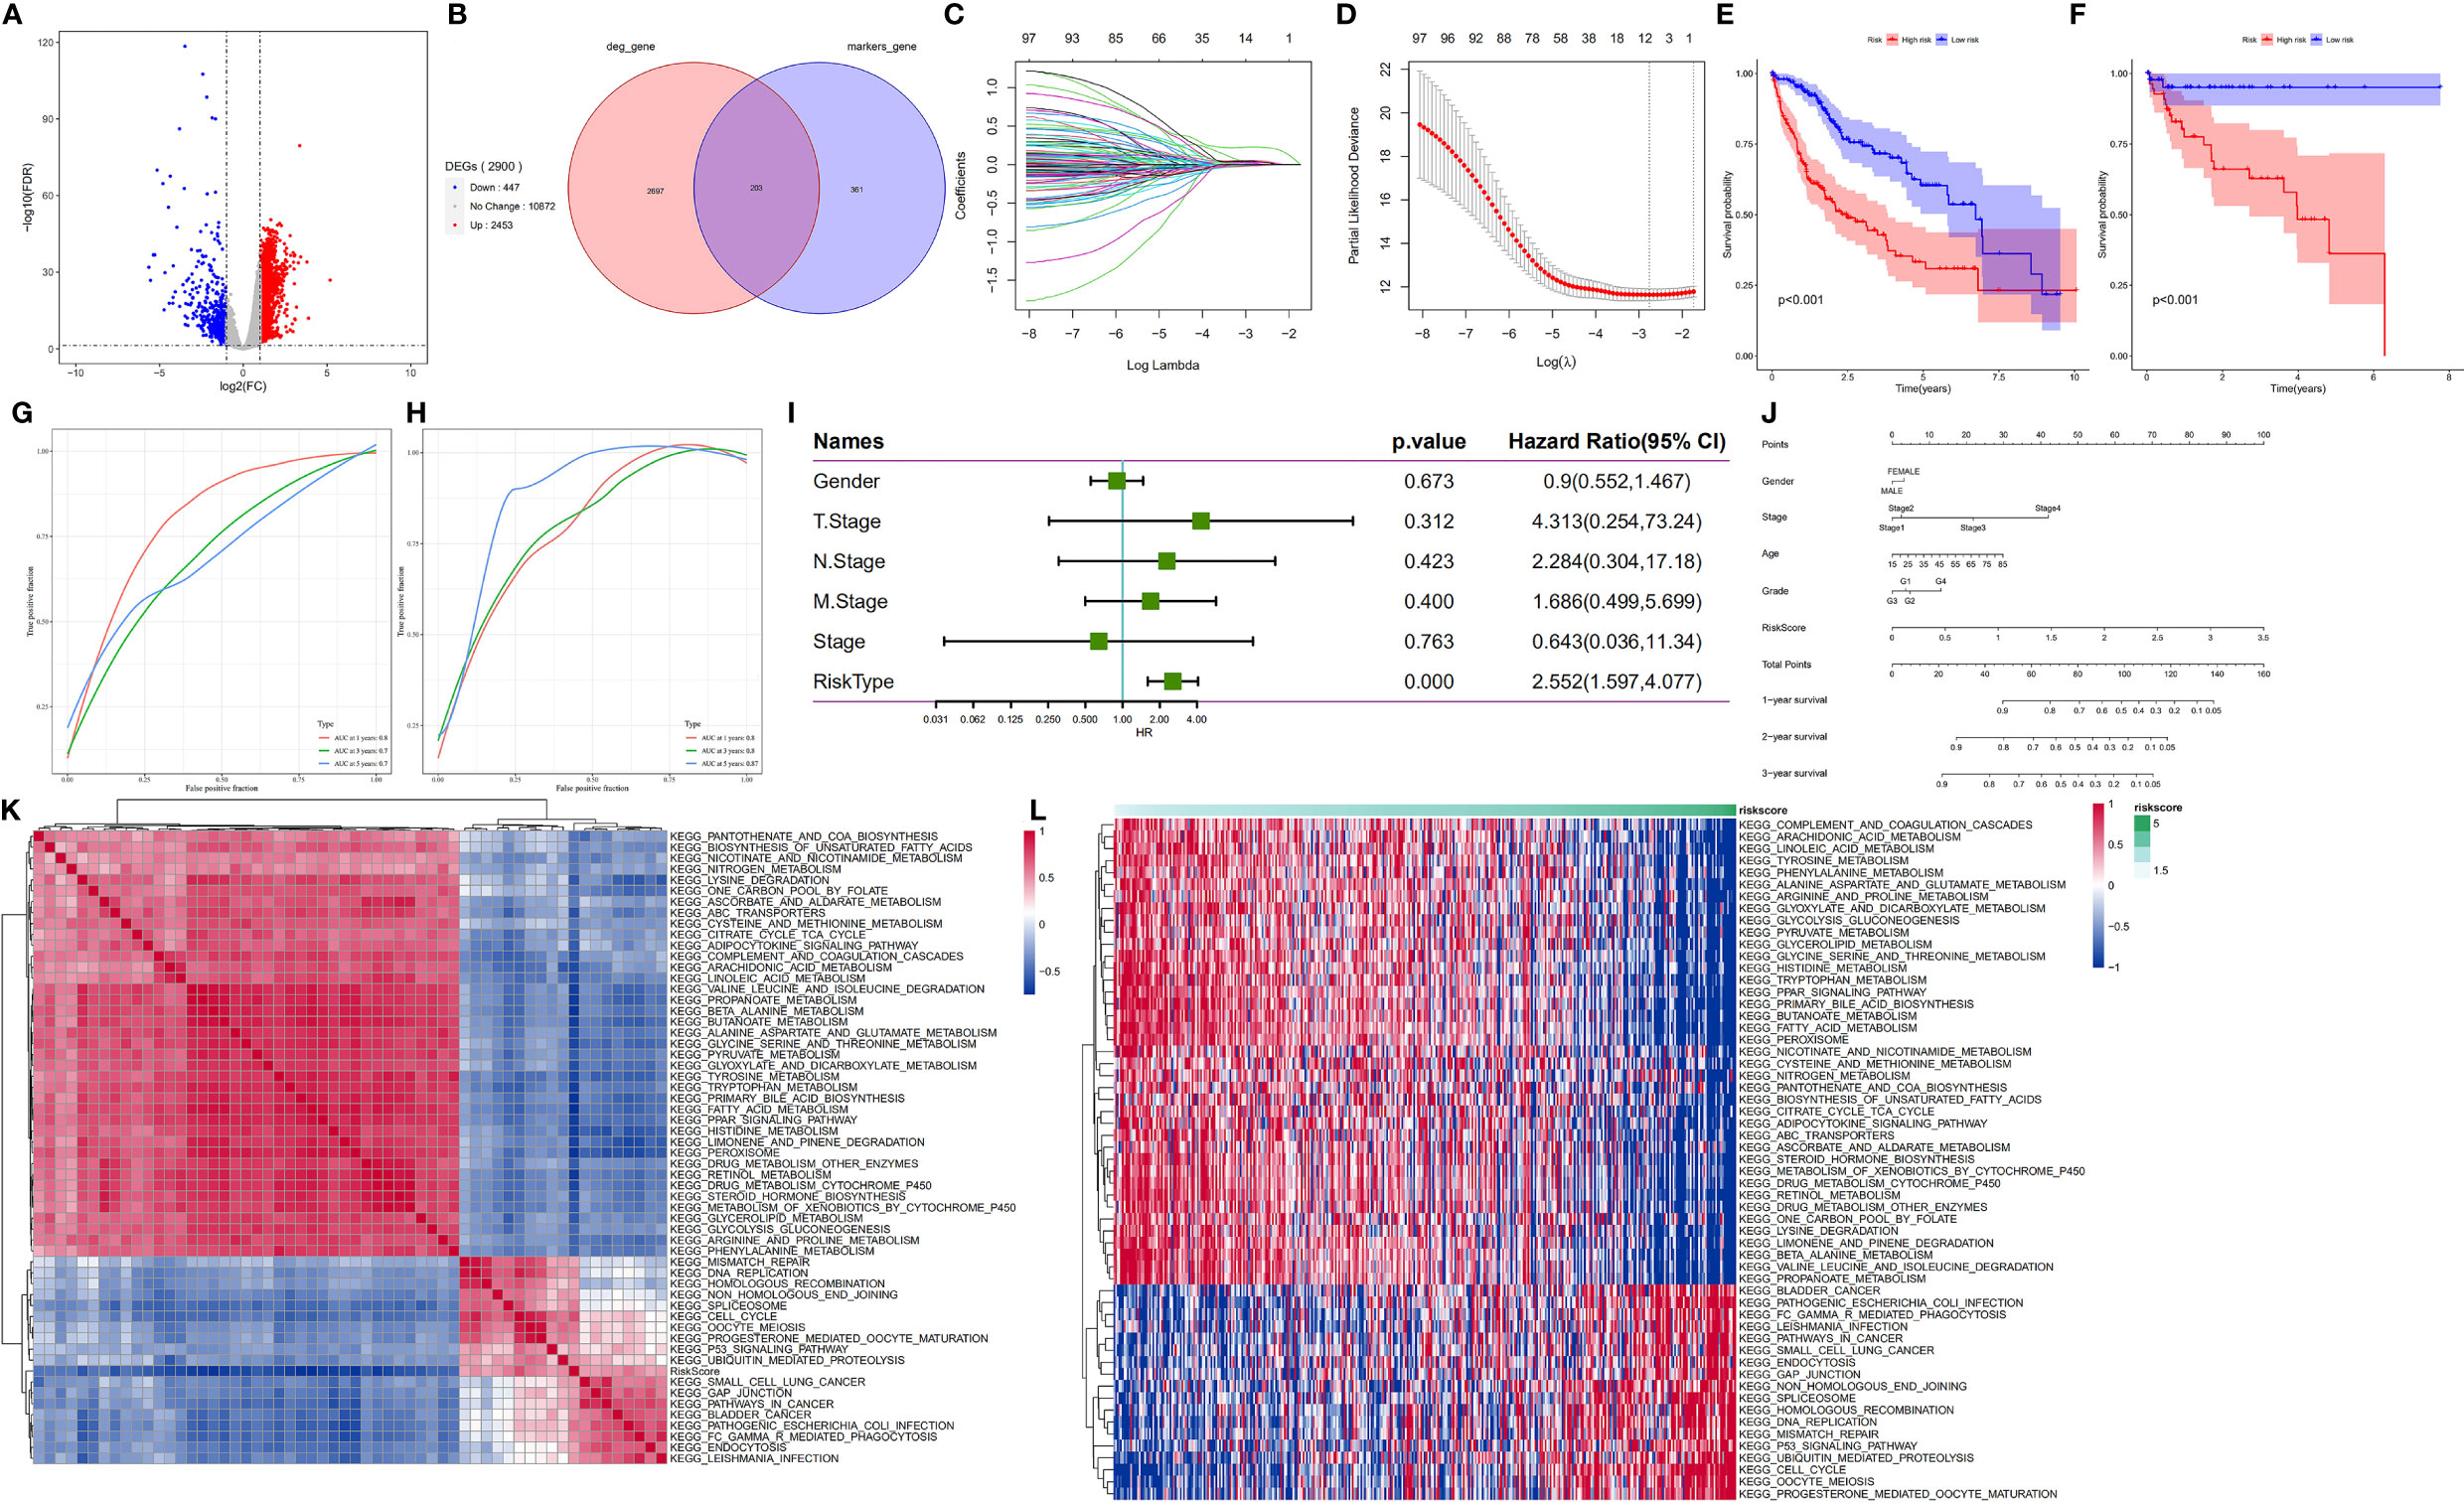
Figure 6 HDG identification and validation in the training (TCGA-LIHC) and validation cohorts (GSE76427). (A) The volcano plot of degs in the TCGA-LIHC dataset. (B) The intersection of degs of TCGA-LIHC cohort with marker genes of epithelial cell subpopulation of HCC. (C, D) Coefficient distribution plots of log(λ) sequences (C) and selection of optimal parameters (lambda) in the LASSO model (D). (E, F) Kaplan−Meier survival curves illustrate the prognostic value of the 11-gene signature in the training cohort (E) and validation cohort (F). (G, H) Distribution of the 11-gene signature risk scores and survival status of HCC patients in the training cohort (G) and validation cohort (H). ROC curves showing the value of the 11-gene signature in predicting the OS rates of HCC patients at 1, 3, and 5 years in both cohorts. (I) Forest plot showing multivariate Cox analysis results. (J) Nomogram showing the prediction of OS at 1, 2, and 3 years. (K, L) Regulatory pathways potentially related to risk score.
In the published article, there was an error in FIGURE 7 as published. The symbols used for the statistical significance analysis in Figure 7A and Figure 7C are superimposed. The corrected Figure 7 and its caption Figure 7 The Relative RNA Expression Level and Protein Expression Level of prognosis-related differentially expressed genes. Appear below.
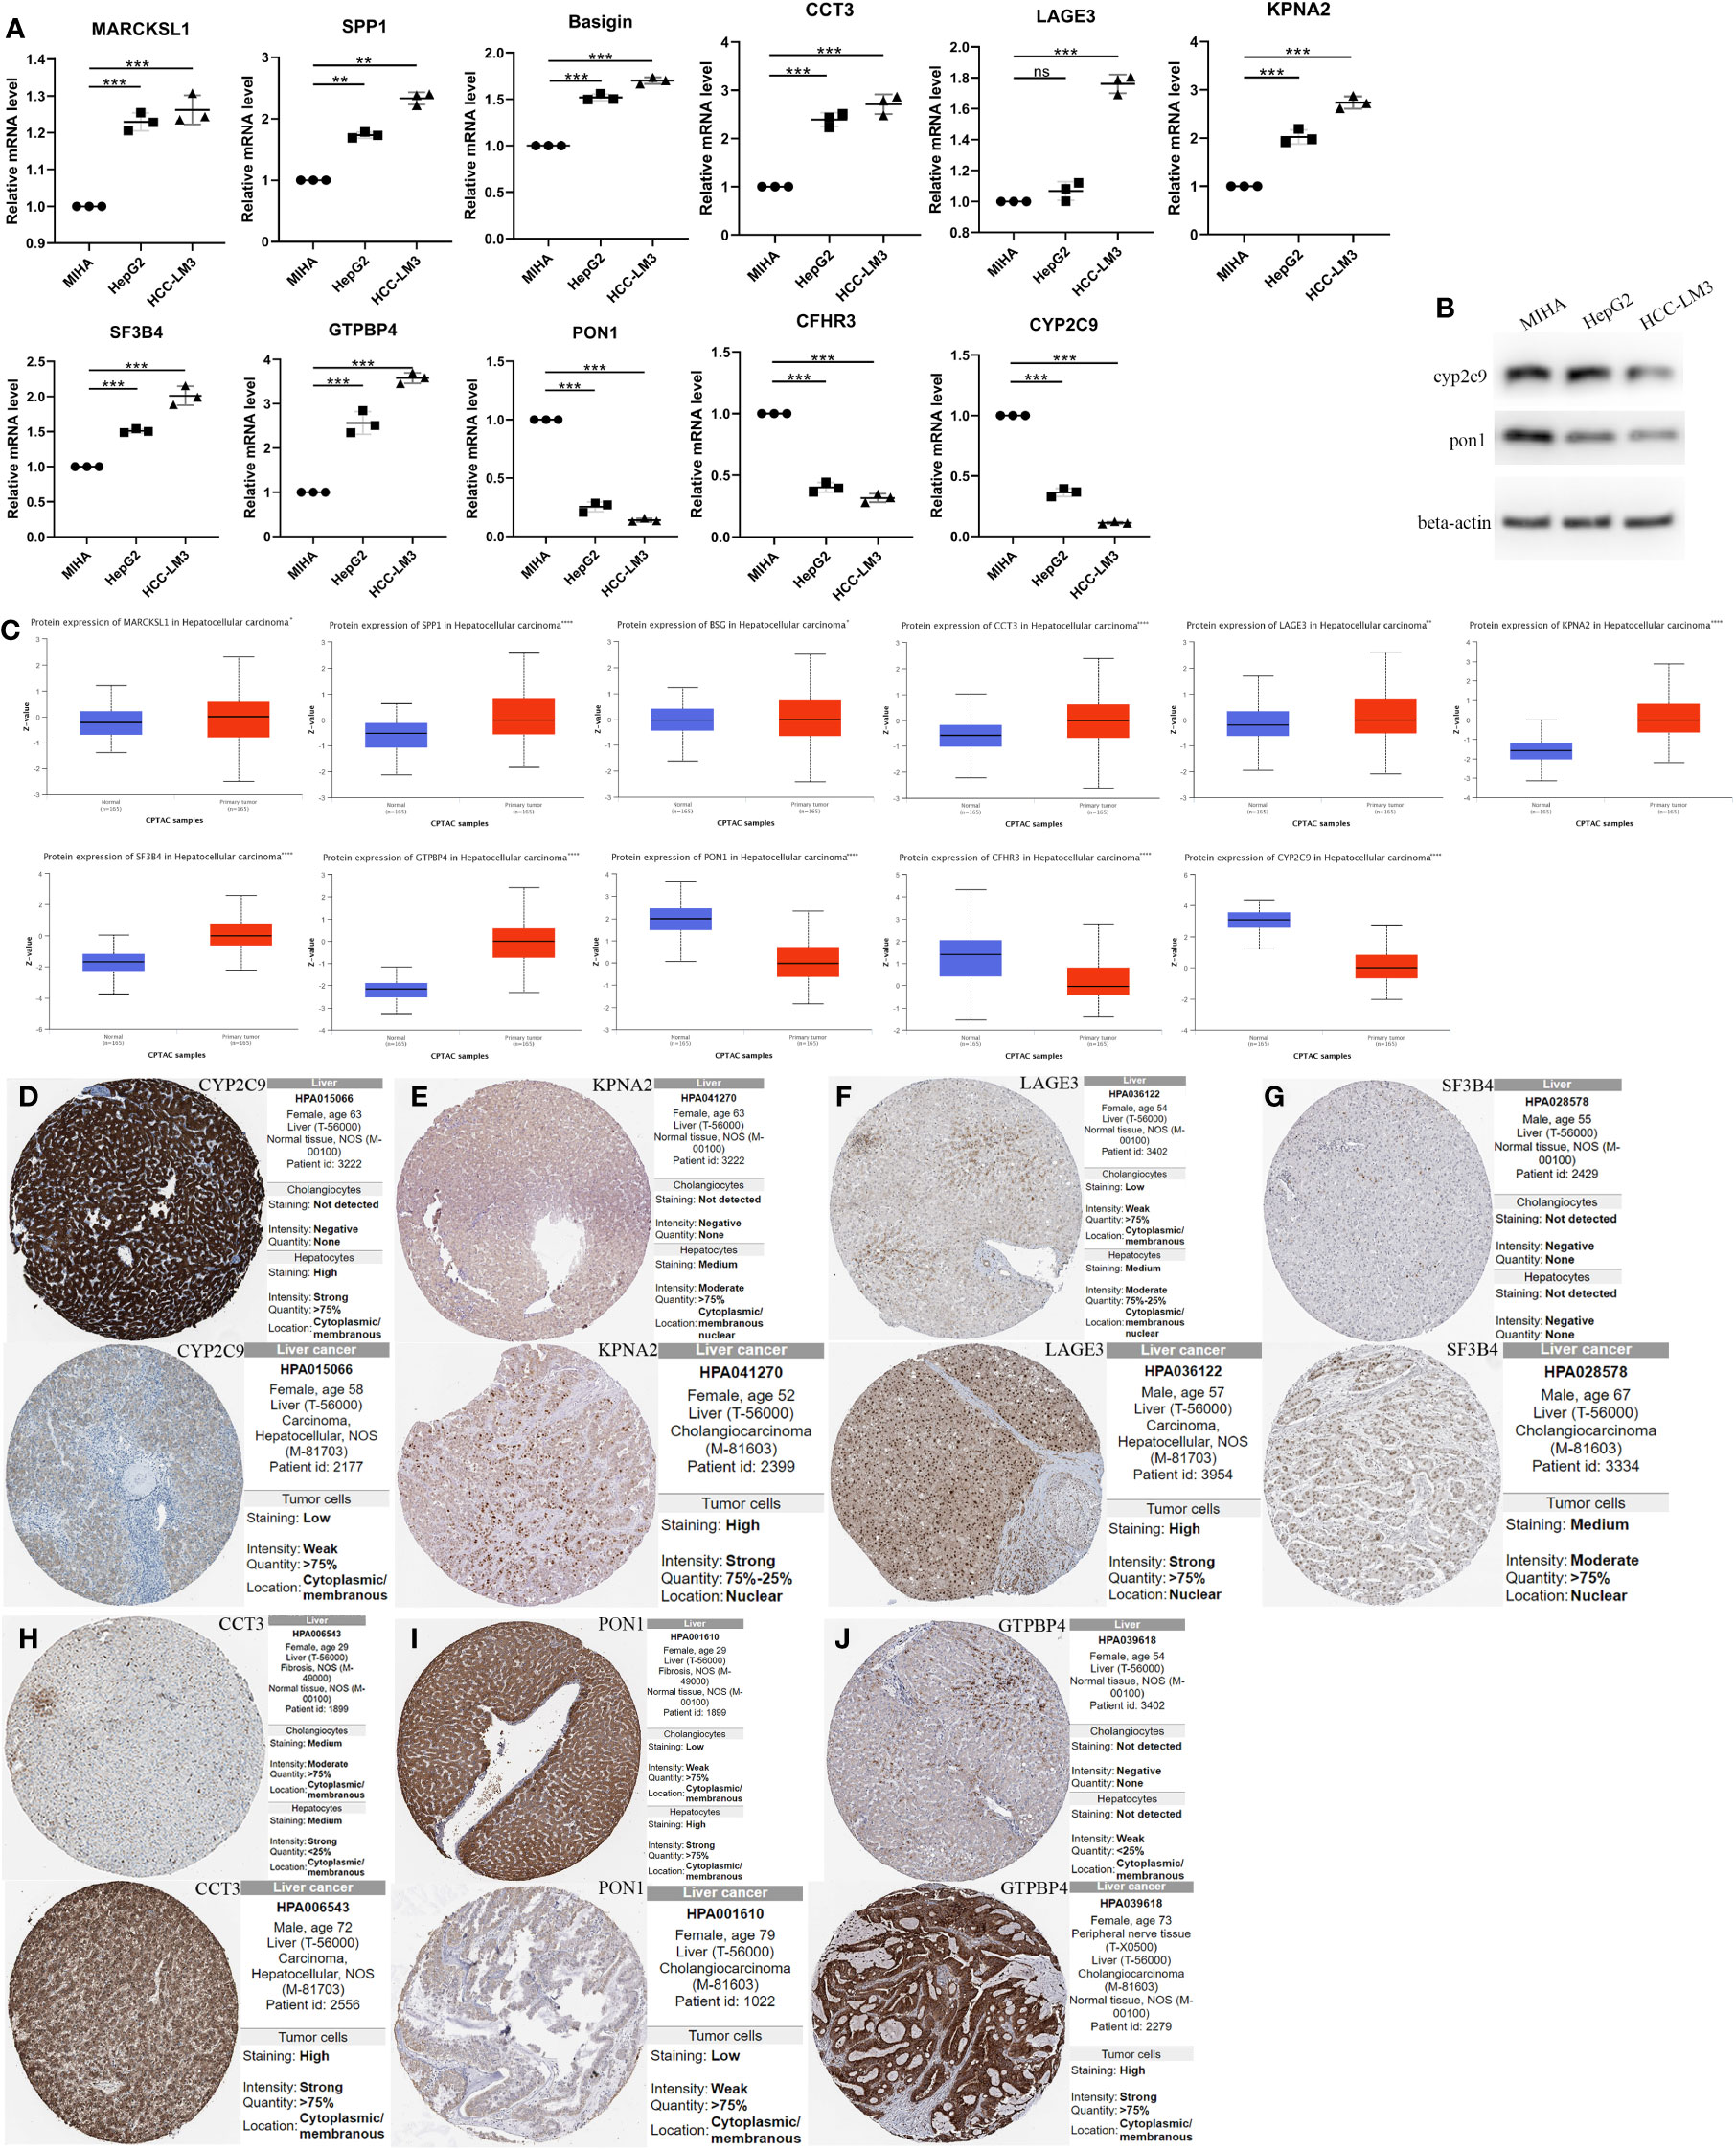
Figure 7 The Relative RNA Expression Level and Protein Expression Level of prognosis-related differentially expressed genes. (A) The Relative RNA Expression Level of MARCKSL1, SPP1, BSG, CCT3, LAGE3, KPNA2, SF3B4, GTPBP4, PON1, CFHR3 and CYP2C9. (B) Expression of CYP2C9 and PON1 in normal human hepatocyte cell line MIHA and HCC cell lines HCC-LM3 and HepG2 through western blot analysis. (C) Box plots showed the differential protein expression of 11 hub genes in the CPTAC dataset in HCC tumor tissue and adjacent normal. (D–J) Immunohistochemical analysis of the CYP2C9, KPNA2, LAGE3, SF3B4, CCT3, PON1 and GTPBP4 in HCC and liver tissues from the HPA database. HCC, hepatocellular carcinoma; CPTAC, The National Cancer Institute’s Clinical Proteomic Tumor Analysis Consortium. HPA, Human Protein Atlas. (Unpaired t-test, *P < 0.05, **P < 0.01, ***P < 0.001, ****p < 0.0001 and ns, no significance).
The authors apologize for these errors and state that they do not change the scientific conclusions of the article in any way. The original article has been updated.
All claims expressed in this article are solely those of the authors and do not necessarily represent those of their affiliated organizations, or those of the publisher, the editors and the reviewers. Any product that may be evaluated in this article, or claim that may be made by its manufacturer, is not guaranteed or endorsed by the publisher.
Keywords: cancer metabolism, hepatocellular carcinoma, malignant hepatocytes, prognostic biomarker, single-cell RNA sequencing
Citation: Han C, Chen J, Huang J, Zhu R, Zeng J, Yu H and He Z (2023) Corrigendum: Single-cell transcriptome analysis reveals the metabolic changes and the prognostic value of malignant hepatocyte subpopulations and predict new therapeutic agents for hepatocellular carcinoma. Front. Oncol. 13:1162375. doi: 10.3389/fonc.2023.1162375
Received: 09 February 2023; Accepted: 10 February 2023;
Published: 08 March 2023.
Approved by:
Frontiers Editorial Office, Frontiers Media SA, SwitzerlandCopyright © 2023 Han, Chen, Huang, Zhu, Zeng, Yu and He. This is an open-access article distributed under the terms of the Creative Commons Attribution License (CC BY). The use, distribution or reproduction in other forums is permitted, provided the original author(s) and the copyright owner(s) are credited and that the original publication in this journal is cited, in accordance with accepted academic practice. No use, distribution or reproduction is permitted which does not comply with these terms.
*Correspondence: Cuifang Han, aGFuY3VpZmFuZ0BnZG11LmVkdS5jbg==; Hongbing Yu, aGJ5dUBnZG11LmVkdS5jbg==; Zhiwei He, aGV6aGl3ZWlAZ2RtdS5lZHUuY24=
†These authors have contributed equally to this work
Disclaimer: All claims expressed in this article are solely those of the authors and do not necessarily represent those of their affiliated organizations, or those of the publisher, the editors and the reviewers. Any product that may be evaluated in this article or claim that may be made by its manufacturer is not guaranteed or endorsed by the publisher.
Research integrity at Frontiers
Learn more about the work of our research integrity team to safeguard the quality of each article we publish.