
94% of researchers rate our articles as excellent or good
Learn more about the work of our research integrity team to safeguard the quality of each article we publish.
Find out more
ORIGINAL RESEARCH article
Front. Oncol., 08 June 2023
Sec. Cancer Immunity and Immunotherapy
Volume 13 - 2023 | https://doi.org/10.3389/fonc.2023.1157861
This article is part of the Research TopicBiomarkers and Immunotherapy for Genitourinary TumorsView all 30 articles
 Xiaoxu Zhang1
 Yang Sun1
 Yushuo Ma1,2
 Chengwen Gao2
 Youzhi Zhang3
 Xiaokun Yang3Xia Zhao2*Wei Wang4*
 Lisheng Wang1*
Background: Renal clear cell carcinoma (RCC) has negative prognosis and high mortality due to its early diagnosis difficulty and early metastasis. Although previous studies have confirmed the negative progression of RCC is closely related to M2 macrophages in tumor-associated macrophages (TAMs), the specific mechanism is still unknown
Methods: We used immunofluorescence labeling and flow cytometry to detect the proportion of M2 macrophages in RCC tissues. And bioinformatics technique was used to obtain 9 M2 macrophage-related model genes, including SLC40A1, VSIG4, FUCA1, LIPA, BCAT1, CRYBB1, F13A, TMEM144, COLEC12. Using these genes, model formulas are constructed to devide samples into high and low risk groups, and then the overall survival (OS), progression-free survival (PFS) and Gene set enrichment analysis (GSEA) of the high and low risk groups were analyzed. Real-time quantitative polymerase chain reaction (RT-qPCR) was used to measure the expression of model genes between normal kidney tissue and RCC tissue, as well as between HK-2 cell and 786-O cell. Besides, we induced the M2 differentiation of THP-1 cell, and then co-cultured with the RCC cell 786-O in transwell to observe what effect M2 macrophages will cause on the invasion, migration and the expression of model genes of RCC.
Results: Our study demonstrated M2 macrophages in RCC was about 2 folds that of normal renal tissue (P<0.0001) and M2 macrophages affected the prognosis of patients with RCC by affecting the co-expressed genes, which were mainly enriched in immune-related pathways. The results of in vitro experiments showed that in RCC tissues and 786-O cells, the model gene FUCA1 was down-regulated, and SLC40A1, VSIG4, CRYBB1 and LIPA were up-regulated. Besides, the results of co-culture showed that after 786-O co-culture with M2 macrophages, the ability of migration and invasion was promoted and the expressions of FUCA1, SLC40A1, VSIG4, CRYBB1, LIPA and TMEM144 were all up-regulated.
Conclusion: The proportion of tumor-associated M2 macrophages in RCC tissues is upregulated, and M2 macrophages promote the progression of RCC by regulating the expression of SLC40A1, VSIG4, FUCA1, LIPA, BCAT1, CRYBB1, F13A, TMEM144, COLEC12 genes, thereby affecting the prognosis of patients with RCC.
Renal clear cell carcinoma (RCC) is the most common pathological subtype of renal cancer (1, 2), originating from the proximal ureter (3). Due to the difficulties in early diagnosis, local invasion and early metastasis (4), about 30-40% of RCC patients occur metastasis at the diagnosis (5), which leads to poor prognosis and high mortality of RCC. Now due to the advancement of imaging technology, the detection rate of RCC has increased, which has improved the prognosis and reduced the mortality rate to a certain extent. Surgery serves as the most traditional treatment for RCC, but the metastasis or recurrence of the lesion limits this treatment. The emergence of new tyrosine kinase inhibitors (6)and targeted therapies such as PD-1/PD-L1 (7)has had a positive impact on the survival of metastatic renal cell carcinoma patients. However, the overall survival rate (OS) and progression-free survival (PFS) of RCC are still low (8), and the risk of metastasis and recurrence is still high (9). In recent years, increasing researchers have noticed the interaction between tumor cells and immune cells in the tumor immune microenvironment (TME) (10, 11), these immune cells are closely related to the occurrence and development of tumors (12), such as RCC (13). The components of the TME are very complex, including immune cells, stromal cells, extracellular matrix, and various secreted factors (14), among which macrophages account for a large proportion. Such macrophages infiltrating or accumulating in the microenvironment of solid tumors are defined as tumor-associated macrophages (TAMs), including M2 macrophages and a small part of M1 macrophages (15, 16). M1 macrophages are associated with tumor suppression, while M2 macrophages are associated with tumor promotion (17). Some studies have demonstrated that M2 macrophages in TAMs are significantly correlated with tumor stage, tumor cell differentiation, infiltration depth, angiogenesis, lymph node metastasis, and drug resistance, thereby affecting the prognosis of tumor patients (18), such as lung cancer, gastric cancer, and breast cancer (19). Previous studies have confirmed that M2 macrophages can promote the proliferation and migration of tumor cells by regulating certain genes in tumor cells, thereby affecting the prognosis of cancer patients, such as non-small cell lung cancer (20), squamous cell carcinoma of the lung (21) and lung adenocarcinoma (22), etc. This tumor genes regulated by M2 macrophages are called M2 macrophage-related genes. Previous studies have confirmed that M2 macrophages in the TME are closely related to negative prognosis of RCC (23, 24). However, so far, a comprehensive research of the biological role of tumor-associated M2 macrophages in the progression and clinical prognosis of RCC is still lacking. Therefore, in order to understand how M2 macrophages affect the prognosis of RCC, in this study, we used bioinformatics and in vitro experiments to explore the mechanism and screened nine M2 macrophage-related genes, including SLC40A1, VSIG4, FUCA1, LIPA, BCAT1, CRYBB1, F13A, TMEM144, COLEC12, and a new prognostic model was developed for RCC based on the nine M2 macrophage-associated genes. This model shows beneficial predictive effects. In addition, to investigate clinical and biological differences between high-risk and low-risk patients with RCC, clinical correlation analysis, enrichment analysis, and immune infiltration study were performed. In conclusion, we established a risk model based on M2 macrophage-associated genes for clinical prognosis prediction in patients with RCC. Else, it is necessary to identify and validate these predictive biomarkers as well as the prognostic model in the current treatment scenario of localized and advanced RCC in next researches, which makes the model we constructed in the study to assist the prognosis judgment of RCC and the evaluation of clinical treatment effect
Materials: renal clear cell carcinoma cell line 786-O, normal renal cell line HK-2, THP-1 cells, fetal bovine serum (Procell, Wuhan, China), 1640 medium, DMEM medium (meilunbio, Dalian, China), 0.1% crystal violet dye, collagenase IV, hyaluronidase, DNA enzyme, Ficoll paque plus (Solarbio, Beijing, China), 8 μ m and 0.4 μ m transwell chambers, matrix glue (Corning, New York, USA). CD68, CD86 and CD206 flow antibodies, IL-4 and IL-10 (Biolegend, Beijing, China), primers (Sangon Biotech, Shanghai, China), PMA (MedChemExpress, New Jersey, USA), FIX&PERM Kit (MULTISCIENCES, Hangzhou, China). Reverse transcription Kit and qPCR Kit (TransGen Biotech, Beijing, China).
The study used data from public databases. 537 samples of renal clear cell carcinoma were downloaded from TCGA database, including transcriptome data and clinical data. Among them, there were 613 cases in the transcriptional group (72 normal samples and 541 tumor samples). The survival time was between 0 days and 4537 days. GSE29609 is downloaded from GEO database and contains clinical information, such as sex, age, clinical stage, survival time, survival status and so on.
We used CIBERSORT to calculate the proportion of 22 kinds of immune cell infiltration (TIC) in each sample of TCGA. According to the co-expression analysis of M2 macrophage expression and sample gene expression, M2 macrophage related genes were obtained, and the correlation coefficient between M2 macrophages and genes was obtained. Using Kyoto Encyclopedia of Genome and Genome (KEGG) (25) and Gene Ontology (GO) (26), the obtained genes were enriched and analyzed, and the biological process of M2 macrophage-related genes was determined.
The transcriptome data of TCGA and the data of GEO gene set were intersected and corrected, and the expression of M2 macrophage-related genes in each sample in the overlapping data was obtained by weighted gene co-expression network analysis (WGCNA). Then combined with the clinical information of TCGA and GEO respectively, univariate and multivariate Cox regression analysis was carried out to obtain meaningful prognosis-related genes. The obtained prognosis-related genes are intersected, which are the final prognosis-related genes. Based on the expression of prognostic related genes in TCGA, a lasso regression model was constructed and cross-validated to obtain the prognostic model formula, .
The prognostic model formula was used to score the TCGA samples, and the risk score was obtained. According to the median score, the samples were divided into two groups: high and low risk groups. The prognostic model formula was also used to score the GEO sample, and the median risk score of TCGA samples was used to divide them into high and low risk groups. Kaplan-Meier survival analysis was conducted to study the survival difference between high-risk and low-risk groups, and the model was verified by ROC curve to predict the accuracy of 1st, 3rd and 5th survival rates.
GSEA was performed on the samples of high and low risk groups in order to find out the difference between the two groups. The difference of immune cell infiltration between high and low risk samples was analyzed, and the correlation between different immune cells and model genes was further analyzed. In addition, the gene expression related to the immune checkpoint was obtained from the sample gene, and the correlation with the risk score was analyzed.
The expression differences of individual model gene between normal tissue and tumor tissue and between tumor tissue and paracancerous tissue in the same sample were compared. In addition, through the expression of each gene in the prognostic model, the samples were divided into high and low risk groups, and then the survival differences between high and low risk groups were analyzed.
HK-2 was mixed with DMEM medium containing 10% fetal bovine serum and 1 × double antibiotic and seeded in petri dish. 786-O was mixed with 1640 medium containing 10% fetal bovine serum and 1 × double antibiotic and seeded in a petri dish. When the cells adhesion fusion degree reached 80%-90%, they were digested with 0.05% trypsin, subcultured, amplified and cryopreserved.
Renal cell carcinoma and normal kidney tissues were obtained from the affiliated Hospital of Qingdao University with the consent of the patients and their families. To remove the blood stain and necrotic tissues, the obtained tissues were washed with PBS containing 1 × double antibiotic, and then cut them into 1mm3 volume. The digestive juice was composed of 2mg/ml collagenase IV, 0.25mg/ml hyaluronidase, 0.2mg/ml DNA enzyme and 1640 medium. The tissues were digested at 37 °C for 2 hours. After digestion, the undigested tissue was removed with a 40 μm cell sieve. 5ml 1640 medium was used to re-suspended the cells, and then cell suspension was added to 5ml 100% Ficoll Paque Plus. The mixed solution was centrifuge at 1,500 r for 30 min. After centrifugation, the cells at the junction were taken. After washed once, the obtained cells were re-suspended with 1640 medium containing 20% FBS, and seeded on a 6-well plate. After 2 hours, unadherent cells were removed, and the adherent cells were labeled flow antibody CD68 and CD86. Besides, CD206 was labeled on the adherent cells after breaking the membrane. Last, macrophage markers were detected using flow cytometry.
THP-1 cells were mixed and seeded on 6-well plate in 1640 medium containing 100ng/ml PMA to induce the cells maturation. 20ng/ml IL-4 and IL-10 were added to induce M2 differentiation. 48 hours later, the cells were digested with trypsin and labeled with flow antibodies CD68, CD86 and CD206 to detect whether the THP-1 cell successfully differentiated into M2 macrophages. The differentiated M2 macrophages were seeded to the 8 μm transwell chamber, and 786-O, which had been starved for 24 hours, was seeded into the upper chamber after the matrix glue was pretreated. 24 hours later, the 30 min was fixed with 4% paraformaldehyde, the fixed solution was removed. 10min was stained with 0.1% crystal violet, and then 5 visual fields were selected under the microscope after proper air-drying.
The differences of individual model genes between normal tissues and tumor tissues of different samples, and of the same sample were compared. The survival differences between high and low risk groups of single model genes were analyzed. The results showed that SLC40A1, VSIG4, FUCA1, LIPA, CRYBB1, TMEM144 6 model genes among 9 model genes were different in 3 kinds of individual gene analysis (S1-S3). Therefore, we carried out in vitro qPCR of the 6 model genes. Trizol was used to extract the RNA of normal renal tissue and renal clear cell carcinoma, as well as HK-2 and 786-O. The differentiated M2 macrophages and 786-O cells were co-cultured in a 0.4 μm transwell chamber for 48 hours, then 786-O was digested and Trizol was added to extract RNA. The RNA extracted above were performed reverse transcription and qPCR (primer sequences in Table 1) to detect the expression of 6 model genes.
Table 1 Model gene primer sequences.
The pathological sections were obtained from the Department of Pathology of the affiliated Hospital of Qingdao University. After dewaxing, hydration, antigen repair and inactivation of endogenous catalase, the sections were placed in PBS containing 3% BSA. The first antibody was incubated overnight at 4 °C. The second antibody was incubated at room temperature about 50min. After the sections were incubated and sealed, appropriate fluorescence channels were selected for observation and images were collected. Use image-J for data processing and analysis. The main antibodies are as follows: anti-CD68 and anti-CD163. All sections were evaluated by pathologists who did not know the identity and clinical outcome of the patient.
The R4.2.1 software is used for statistical analysis, and the numerical value is . Kaplan-Meier curve and logarithmic rank test were used to evaluate the survival differences between groups. Univariate and multivariate Cox regression analysis were used to determine the prognostic factors. The correlation coefficient was calculated by Pearson and Spearman correlation analysis. Unmatched Student-t and Mann-Whitney U test were used to compare normal and abnormal variables, respectively. One-way analysis of variance and Kruskal-Wallis test were used as parametric and nonparametric methods to compare upper 2 groups. P< 0.05 was considered to be statistically significant.
The sample clinical data were obtained from TCGA and GEO, including the patient’s age, survival status, sex, grade and TNM stage (Table 2).
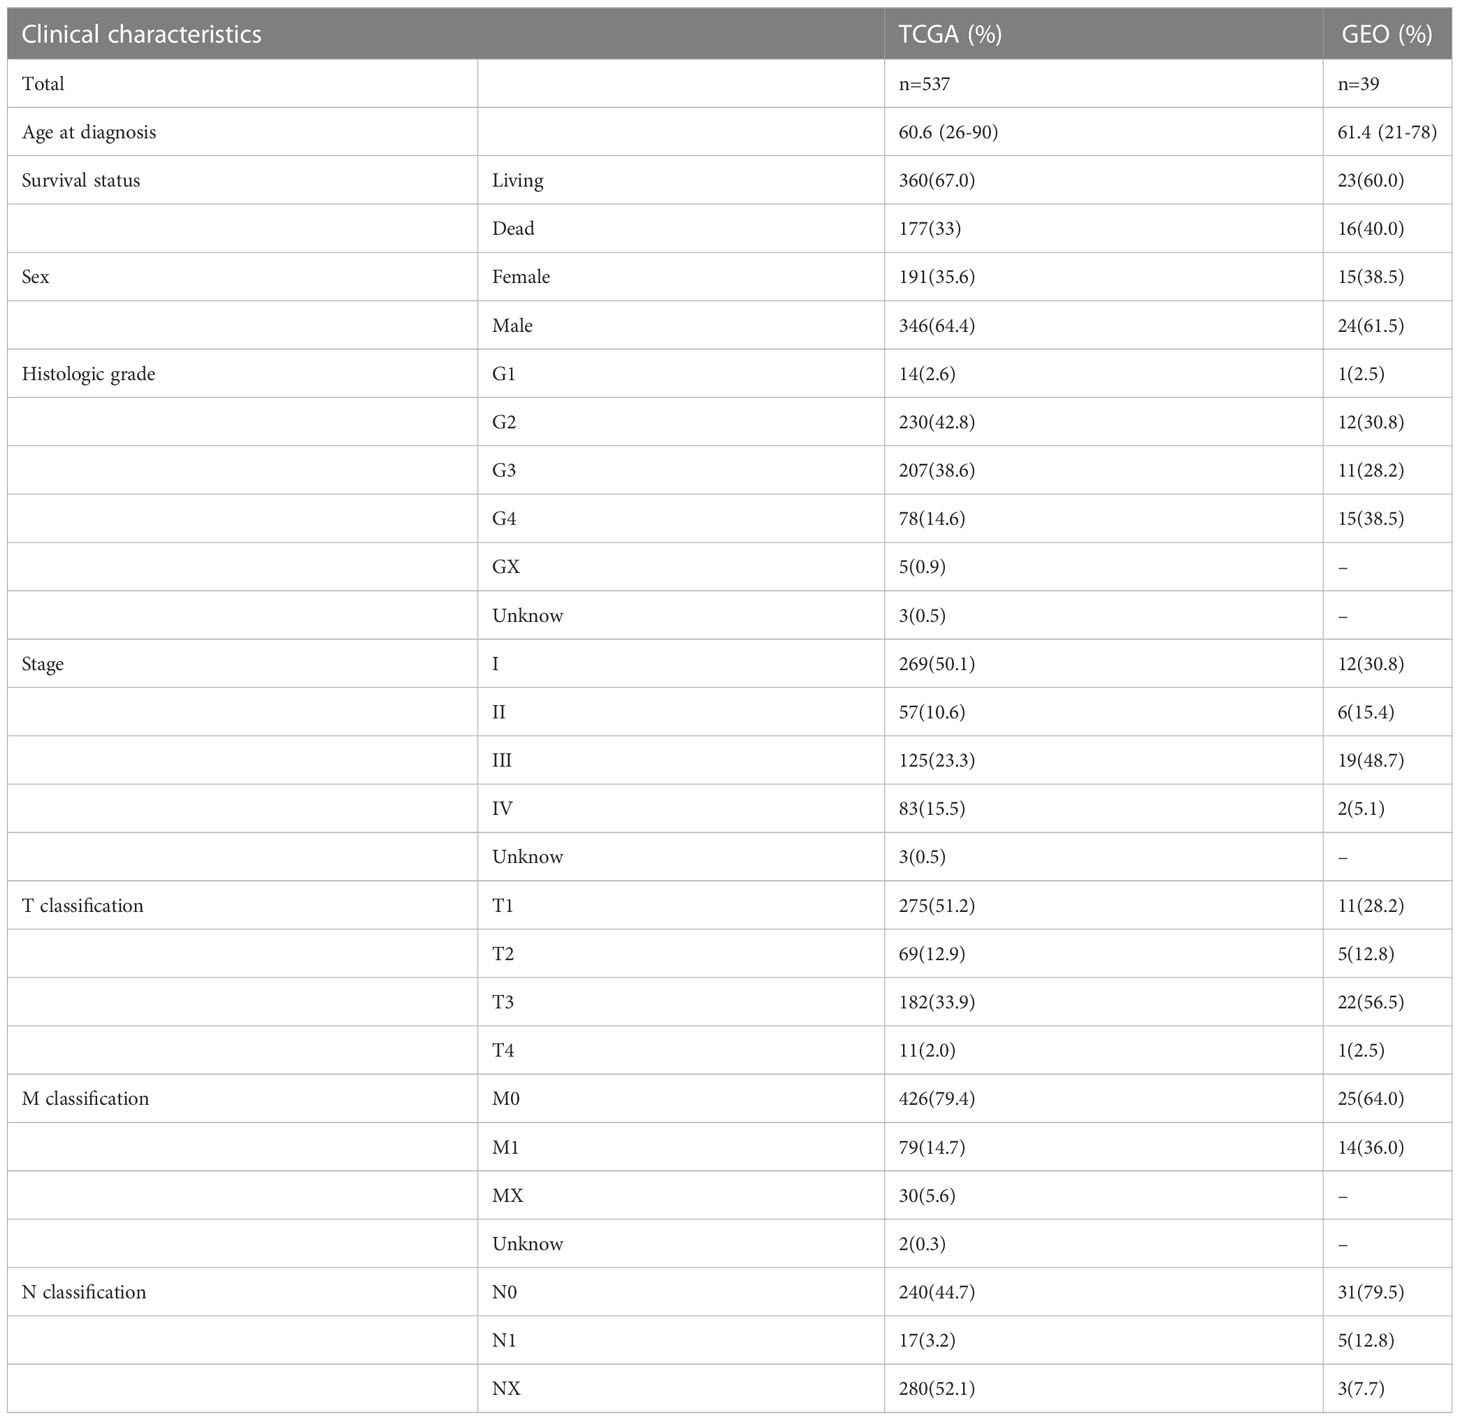
Table 2 The clinical characteristics of TCGA and GEO samples.
The results of immunofluorescence labeling showed that the proportion of CD163 in RCC tissues was about 2 folds higher than that in normal renal tissues (P< 0.0001), which meant that the proportion of M2 macrophages in RCC tissues increased (Figure 1A). After M2 macrophages were extracted from RCC tissues and normal renal tissues according to the procedure (Figure 1B), the extracted cell markers CD68, CD86 and CD206 were detected by flow cytometry. The results confirmed that the proportion of M2 macrophages in RCC tissues was higher than that in normal renal tissues (P< 0.05) (Figure 1C). When the extracted macrophages were co-cultured with 786-O, the results showed that the macrophages extracted from RCC tissues could promote the invasion and migration of renal cancer cells more obviously (Figure 1D). This means that the enhancement of metastatic ability of RCC in the body is related to the increase of M2 macrophages.
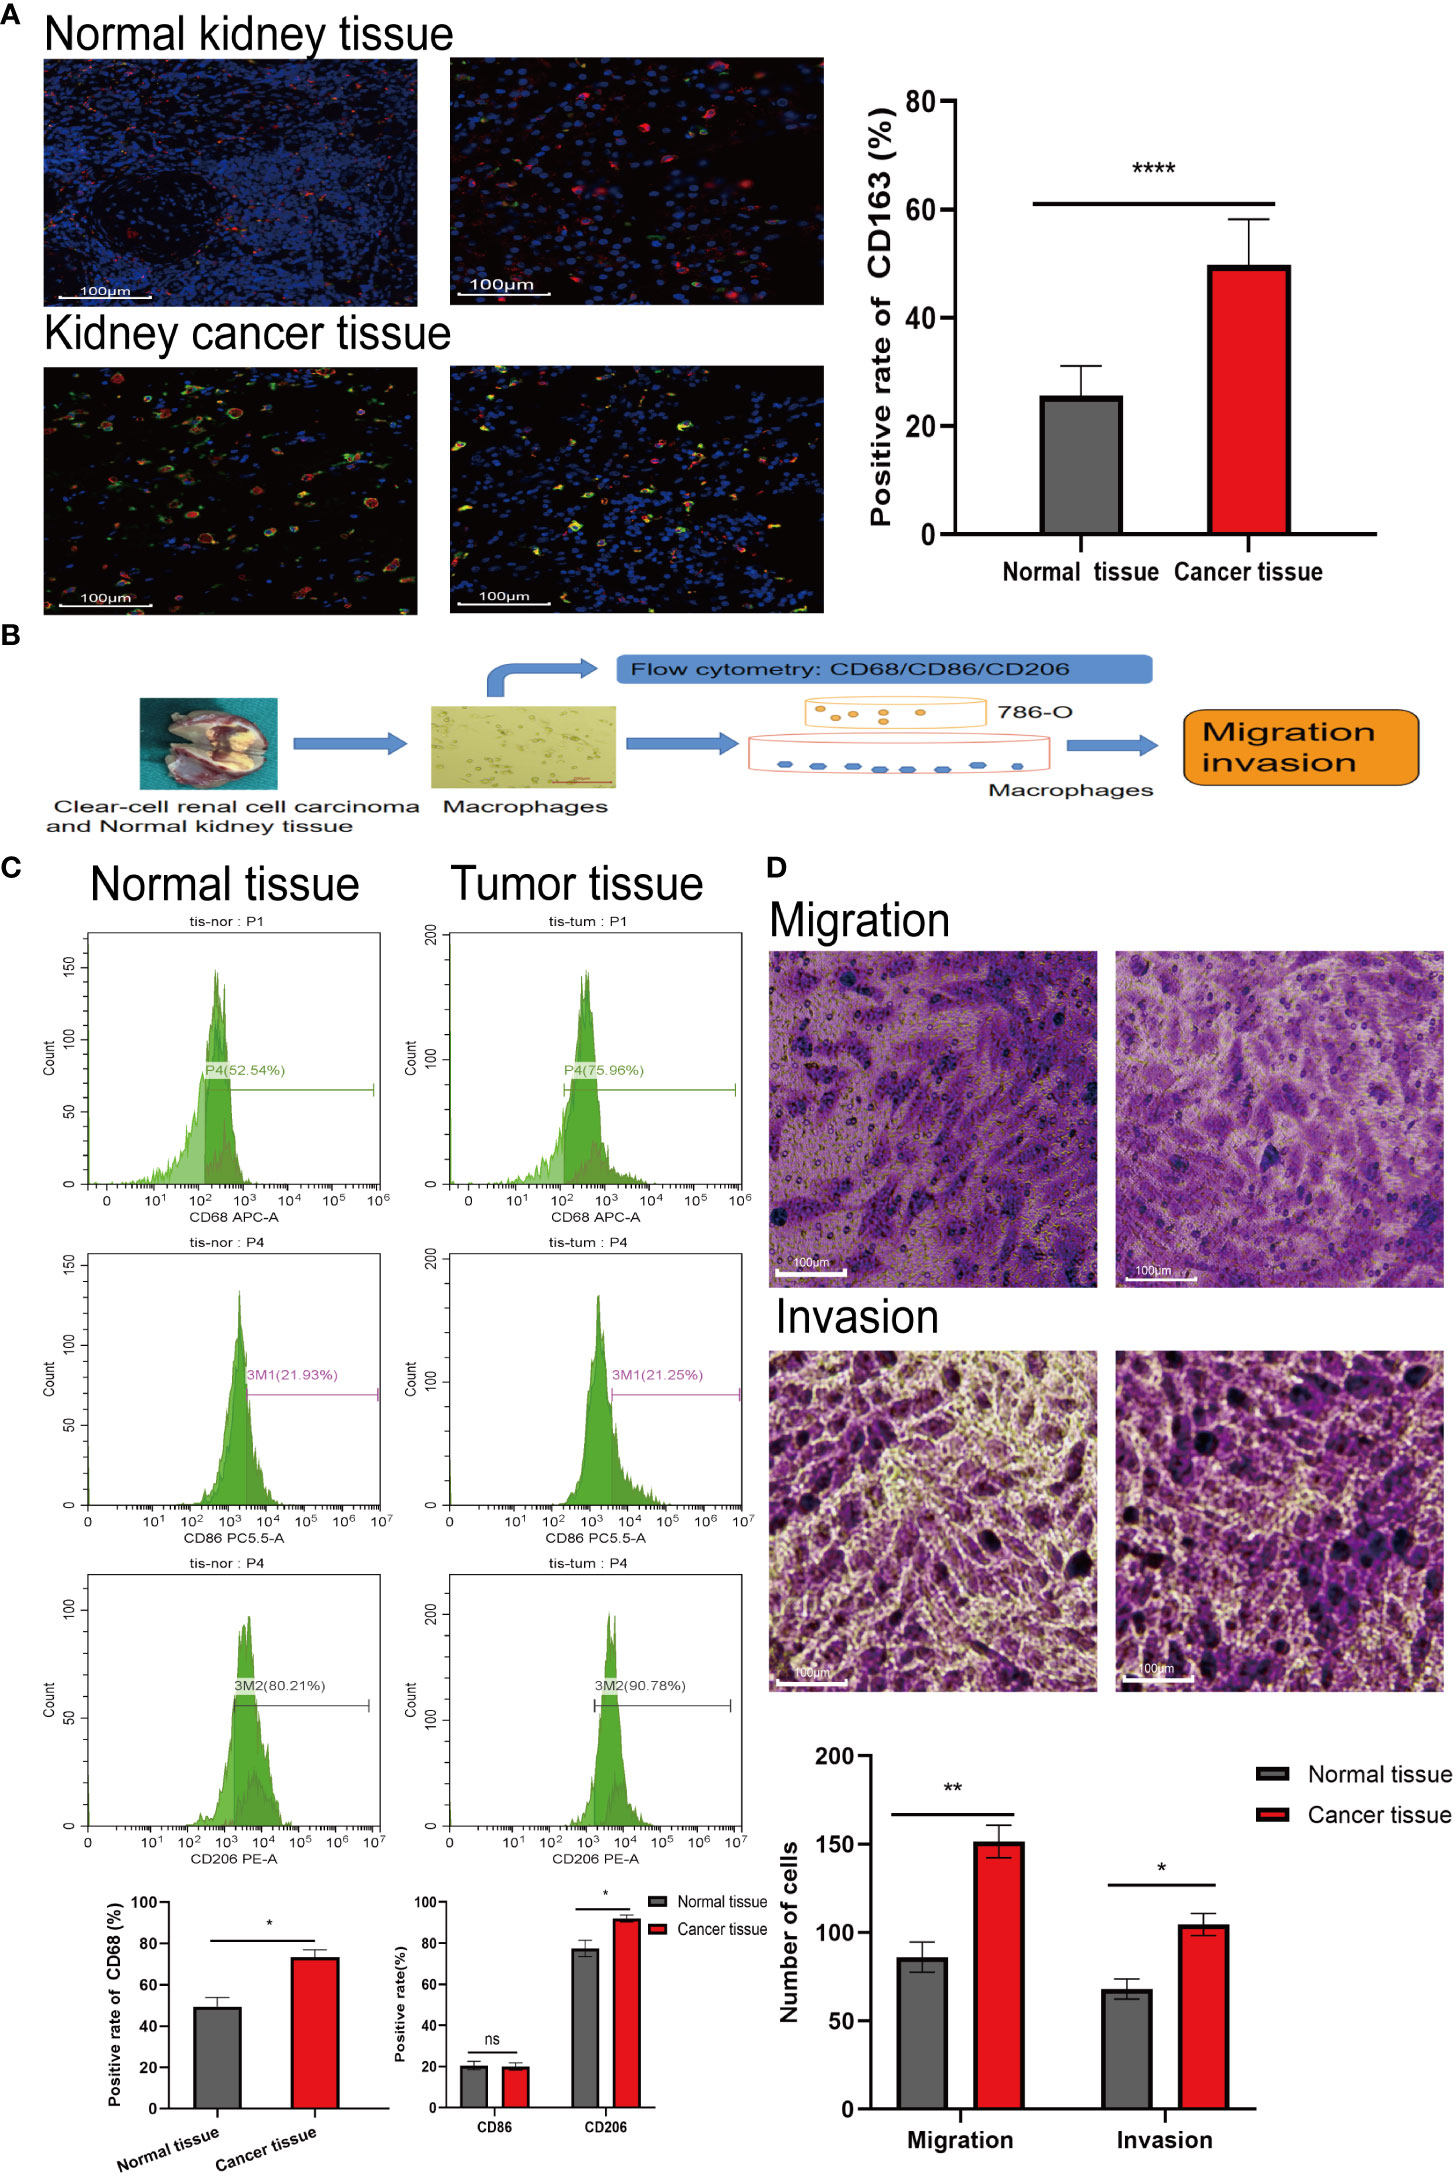
Figure 1 The proportion of M2 type macrophages elevates in RCC tissue. (A) Immunofluorescence labeling the normal kidney tissue and RCC tissue obtained, red fluorescence represents CD68 (labeling mature macrophages) and green fluorescence represents CD163 (labeling M2 type macrophages). (B) Extracting macrophages in kidney tissue and subsequent experimental procedure. (C) Macrophages were extracted from normal kidney tissue and RCC tissue, labeled with flow antibody CD68 (labeling mature macrophages), CD86 (labeling M1 type macrophages) and CD206 (labeling M2 type macrophages), and the proportion of M2 macrophages extracted from both tissues was detected by flow cytometry. (D) Macrophage cells extracted from the tissues were co-cultured with 786-O, and then crystalline violet staining to detect the effect of tissue-extracted macrophages on the invasion and migration ability of 786-O. The result of normal kidney tissue-extracted macrophages (left) co-cultured with 786-O. The result of RCC tissue-extracted macrophages (right) co-cultured with 786-O. *P<0.05, **P<0.01, ****P<0.0001.
After obtaining the proportion of immune cell infiltration in the TCGA sample, the correlation between the expression of M2 macrophages and the gene expression of the sample was analyzed. The results showed that there was a positive correlation between the expression of SLC40A1, VSIG4, FUCA1, LIPA, BCAT1, CRYBB1, F13A, TMEM144, COLEC12 and M2 macrophages (Figure 2A). Furthermore, the results of coexpression analysis were visualized, and the correlation figure (Figure 2B) and coexpression network map (Figure 2C) were obtained. The visualized results allow visual observation of sample genes associated with M2 macrophages.
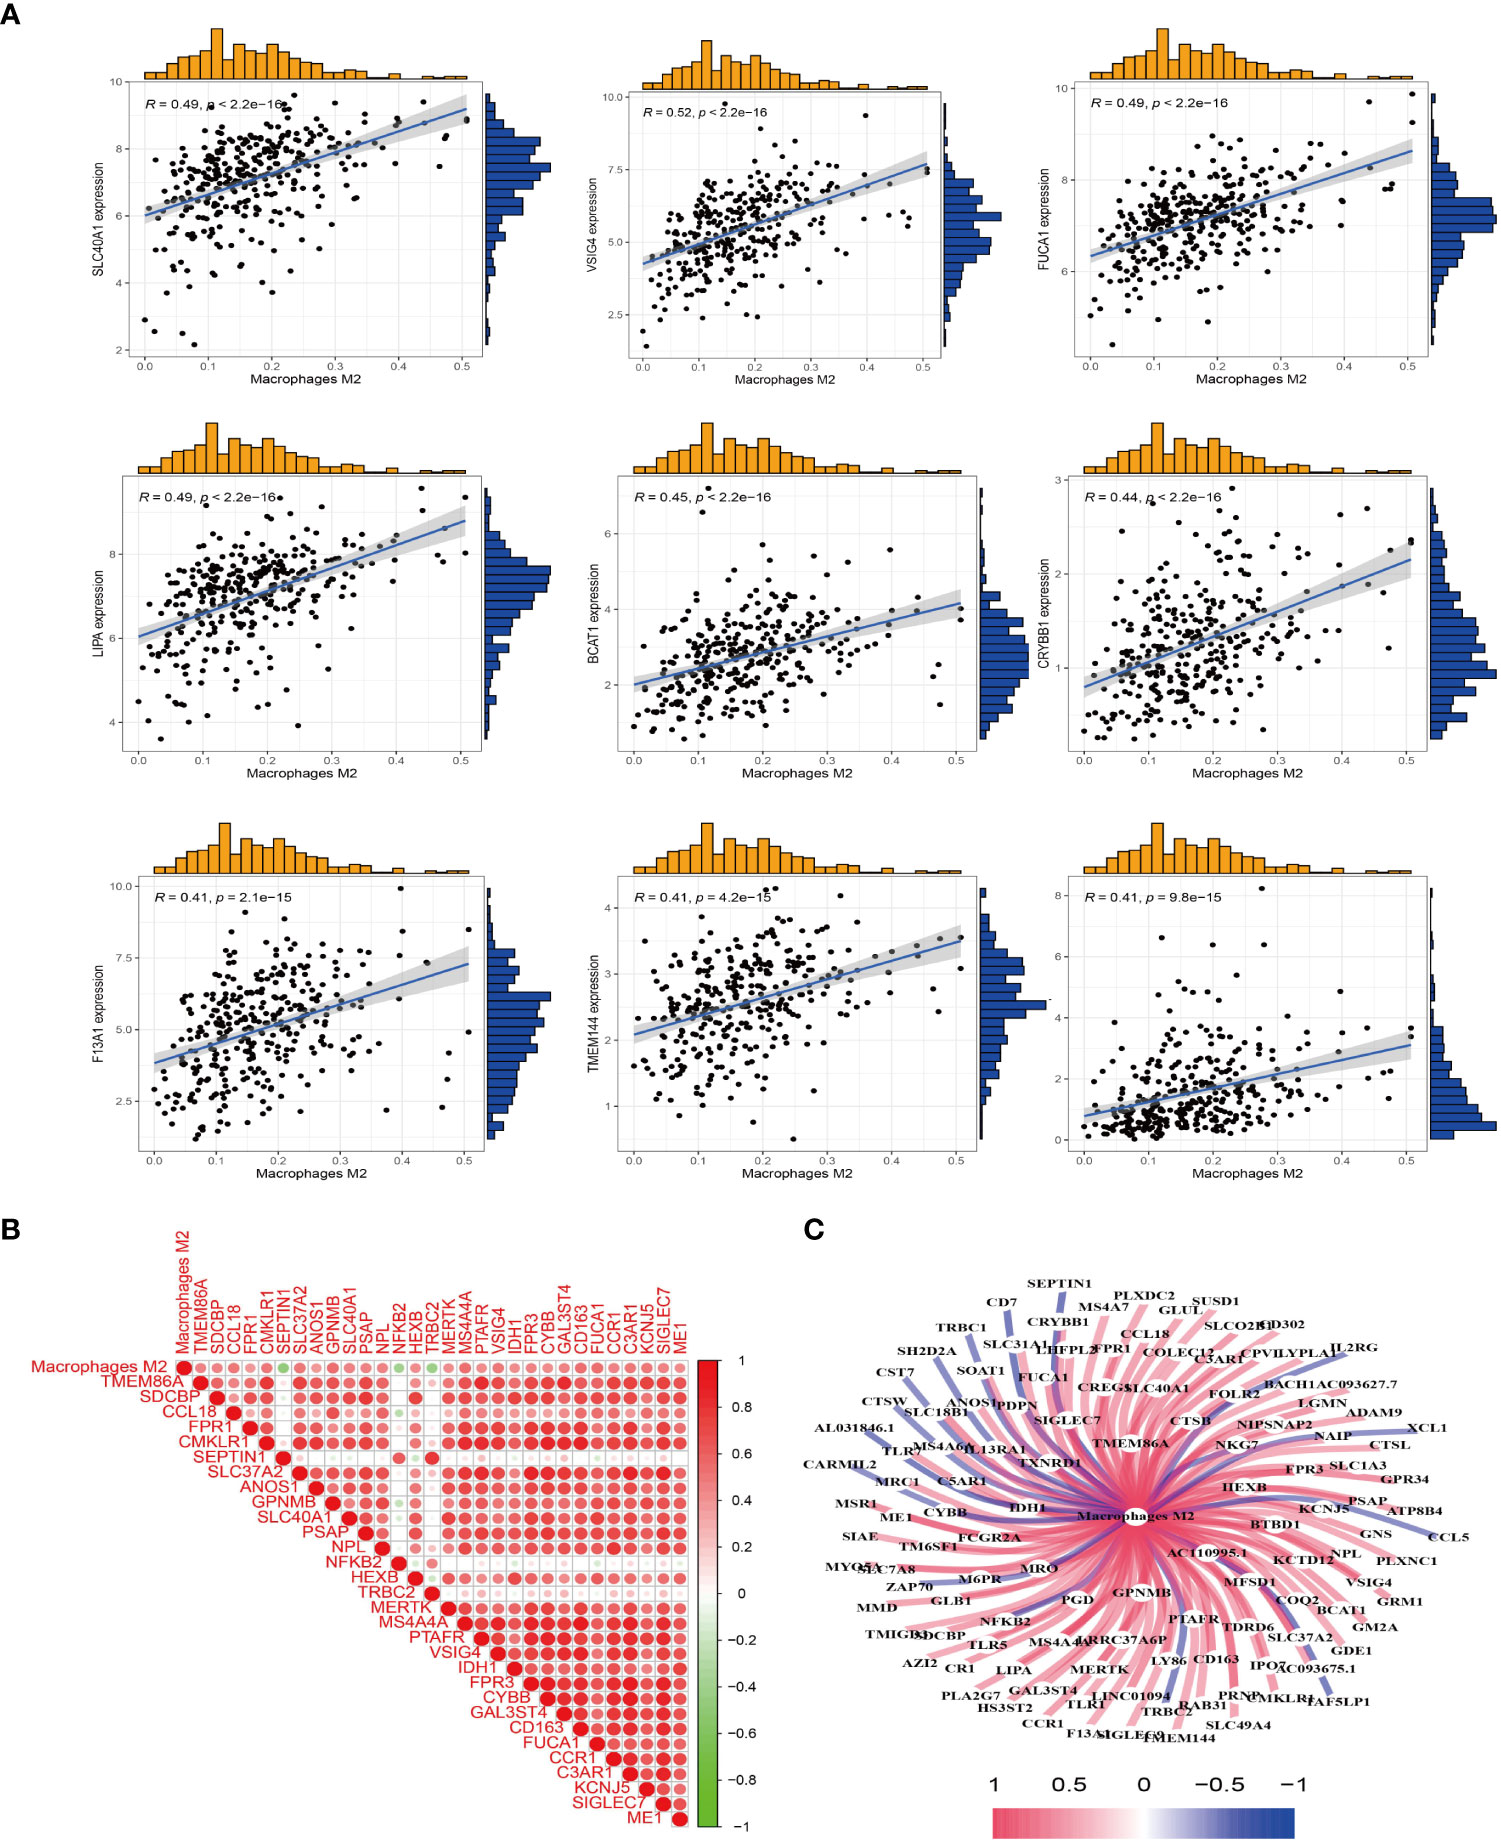
Figure 2 M2 macrophage-related genes were obtained. (A) Co-expression analysis between the sample genes and the expression of M2 macrophages was performed to obtain M2 macrophage-related genes. (B) Heat map of M2 macrophages co-expressed genes. Red represents positive correlation, and green represents negative correlation. (C) Visualization of M2 macrophage-related genes to obtain a co-expression network graph. Central node is M2 macrophages, connecting lines represent correlation, blue represents negative correlation, and red represent positive correlation.
Type M2 macrophage related genes were analyzed by GO and KEGG. GO enrichment results showed that M2 macrophage-related genes were mainly enriched in immune regulatory pathways, such as positive regulation of leukocyte, mononuclear cell migration, regulation of mononuclear cell migration, regulation of leukocyte chemotaxis (Figure 3A). KEGG enrichment results showed that M2 macrophage-related genes were also enriched in immune-related pathways, such as Neutrophil extracellular trap formation, phagosome (Figure 3B).
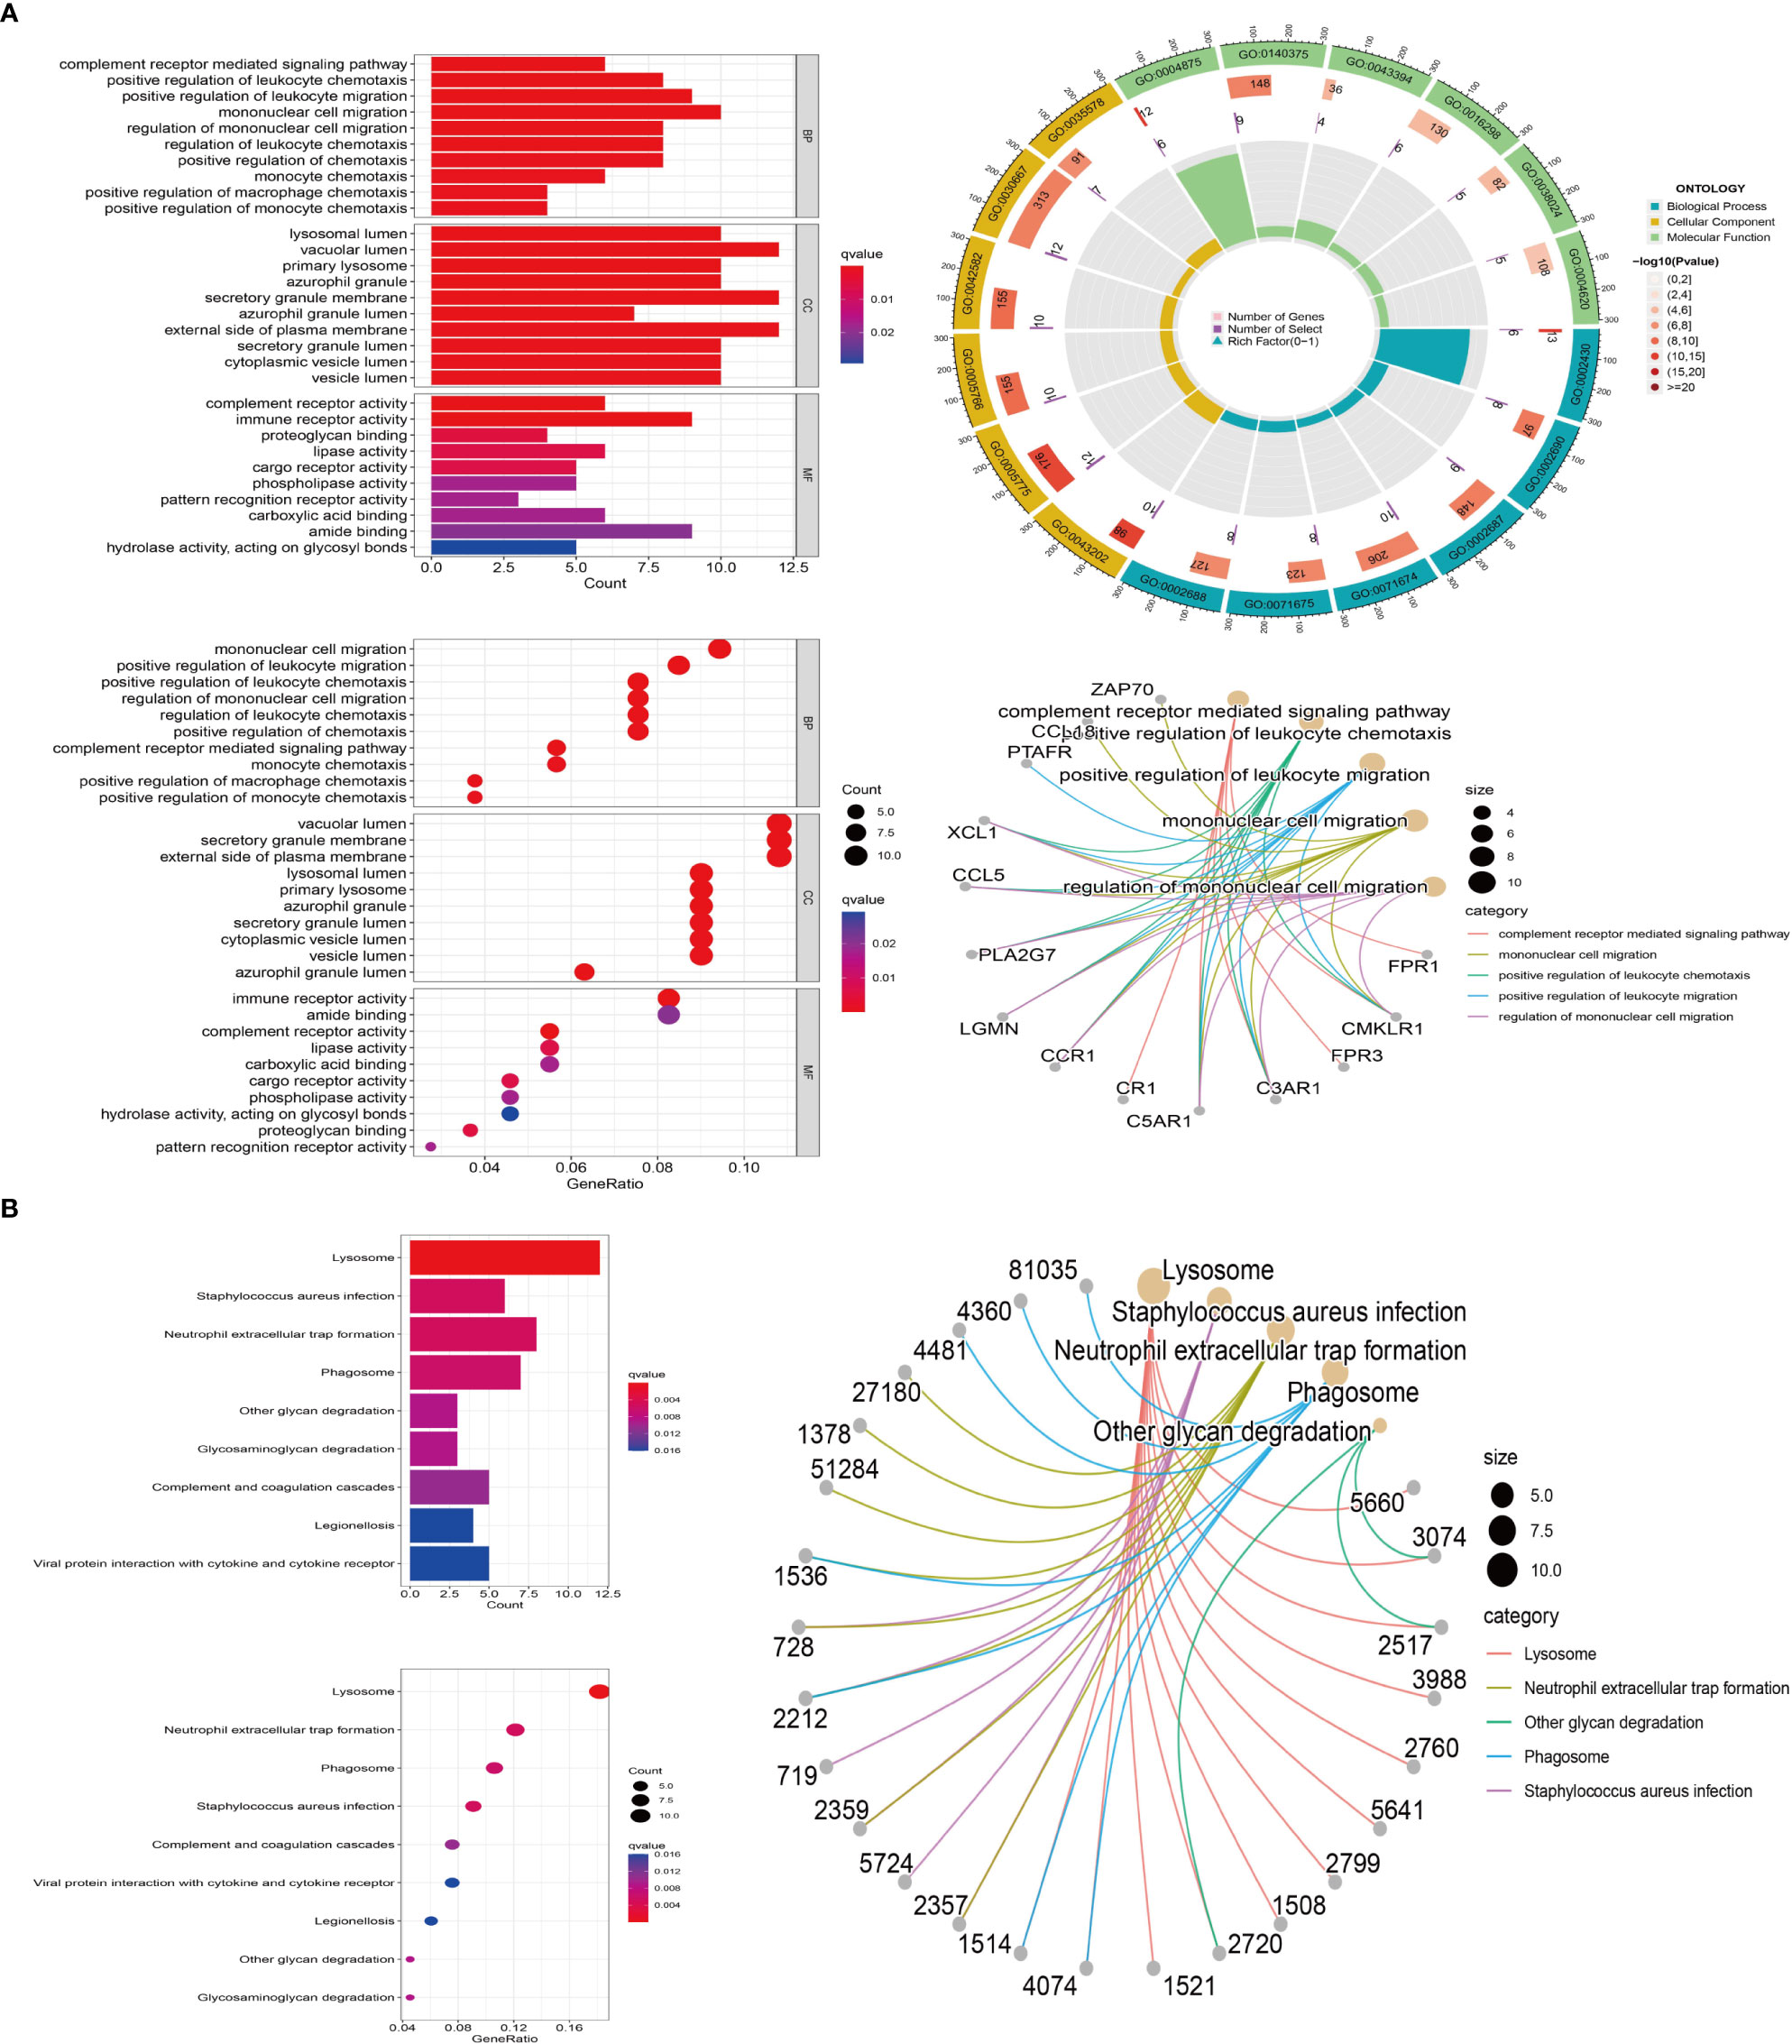
Figure 3 M2 macrophage-associated gene enrichment pathway. (A) GO enrichment. Red represents positive correlation, blue represents negative correlation (left); the outermost circle represents gene ID, and green, blue, yellow represent the three major functions, including molecular function, biological process, cellular component, respectively. The second circle represents the number of genes on each GO, the third circle represents the number of co-expressing genes enriched on each GO, and the fourth circle represents the proportion of co-expressed genes (top right); The major enrichment pathways of M2 macrophage-associated genes on GO (bottom right). (B) KEGG enrichment. Red represents positive correlation, blue represents negative correlation (left); The major enrichment pathway of M2-type macrophage-associated genes on KEGG (right).
Based on the expression of prognosis-related genes in TCGA samples, a lasso regression model was constructed and cross-validated to get the model formula, risk score = VSIG4*0.235-SLC40A1*0.550-FUCA1*0.191-LIPA*0.066+BCAT1*0.138+CRYBB1*0.170+F13A1*0.138-TMEM144*0.090+COLEC12*0.048. Through the survival analysis of the prognosis model, the survival curves of TCGA and GEO samples were obtained respectively (Figure 4A). The results demonstrated that with the passage of time, the survival rate of both groups decreased gradually, but the overall survival rate of the high-risk group was significantly lower than that of the low risk group (P< 0.001), which means that our survival model is beneficial to divide the samples into high and low risk groups. We also conducted independent prognostic analysis of univariate and multivariate (Figure 4B). The results showed that our model could be independent of other factors as prognostic factors. In addition, judging the accuracy of our prognostic model in predicting patient survival by the ROC curve, we found that the prediction accuracy of our model is high. The AUC values of 1st, 3rd and 5th survival prediction are 0.825, 0.767, 0.753 respectively (Figure 4C). Moreover, the other ROC curve is built by combining our model with staging, grading and other clinical traits. Our model has the largest area under the curve (AUC=0.753), which means that our model is the most accurate in predicting patient survival (Figure 4C). In addition, the results of the risk curve (Figure 4D) show that the number of deaths increases as the patient’s risk increases. Using the line chart, the scores of all parturient traits were added to get a total score, and the survival time of patients was predicted according to the total score (Figure 4E). The probability of survival of more than 1 year, 3 years and 5 years was 0.961, 0.903 and 0.84, respectively.
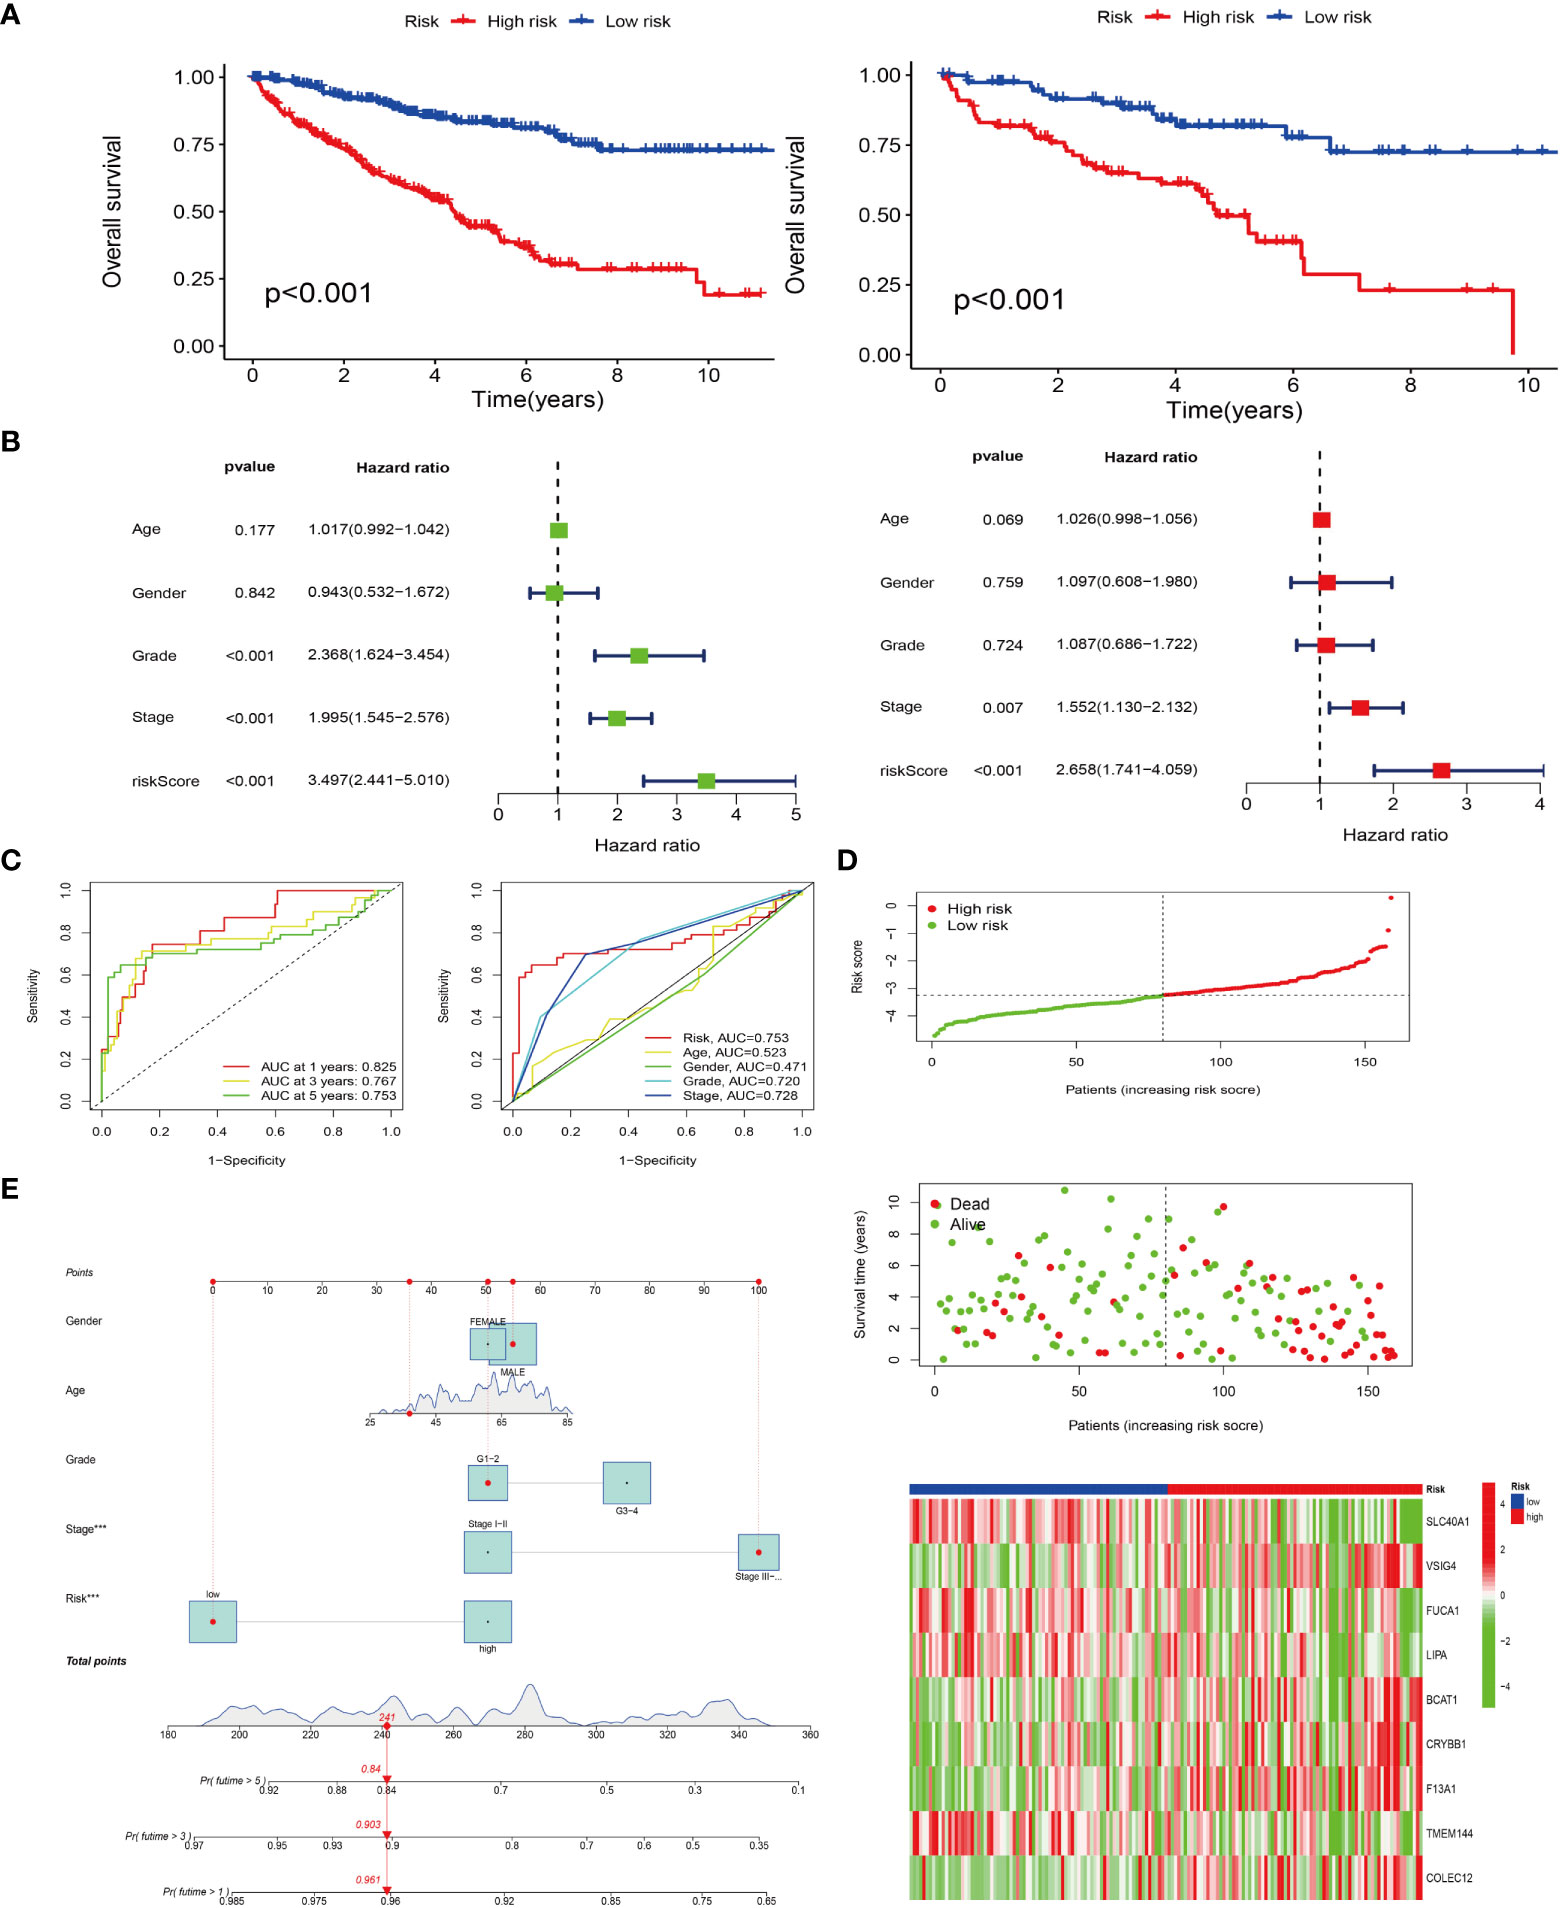
Figure 4 Prognostic models were constructed and survival analyses were performed. (A) Survival analyses for both high and low risk groups in the TCGA cohort (left); survival analyses for both high and low risk groups in the GEO cohort (right). (B) Single- and multi-factor independent prognostic analyses. Forest plots for single-factor Cox analysis (left); forest plots for multi-factor Cox analysis (right). (C) Risk models predicting patients’ survival at 1, 3, and 5 years by subject operating characteristic (ROC) curves (left); risk model combined ROC curves with other clinical traits (right). (D) Distribution of risk-score and survival status; Heat map of risk score and M2-type model genes. Red represents positive correlation and green represents negative correlation. (E) Column line plot of survival prediction model.
The progression-free survival curve was obtained by combining the risk model with clinical traits such as staging and grading (Figure 5A). The results confirmed that with the passage of time, the overall survival rate of patients decreased, and the survival rate of high risk with late stage or grade sample was the lowest. PFS analysis was used to observe the progression-free survival time between the high and low risk groups. The results showed that the PFS time in the high-risk group was significantly lower than that in the low risk group (Figure 5B) (P< 0.001). The line chart predicted the probability that the PFS time of patients was more than 1 year, 3 years and 5 years, and the probability were 0.941, 0.865 and 0.801, respectively (Figure 5C).
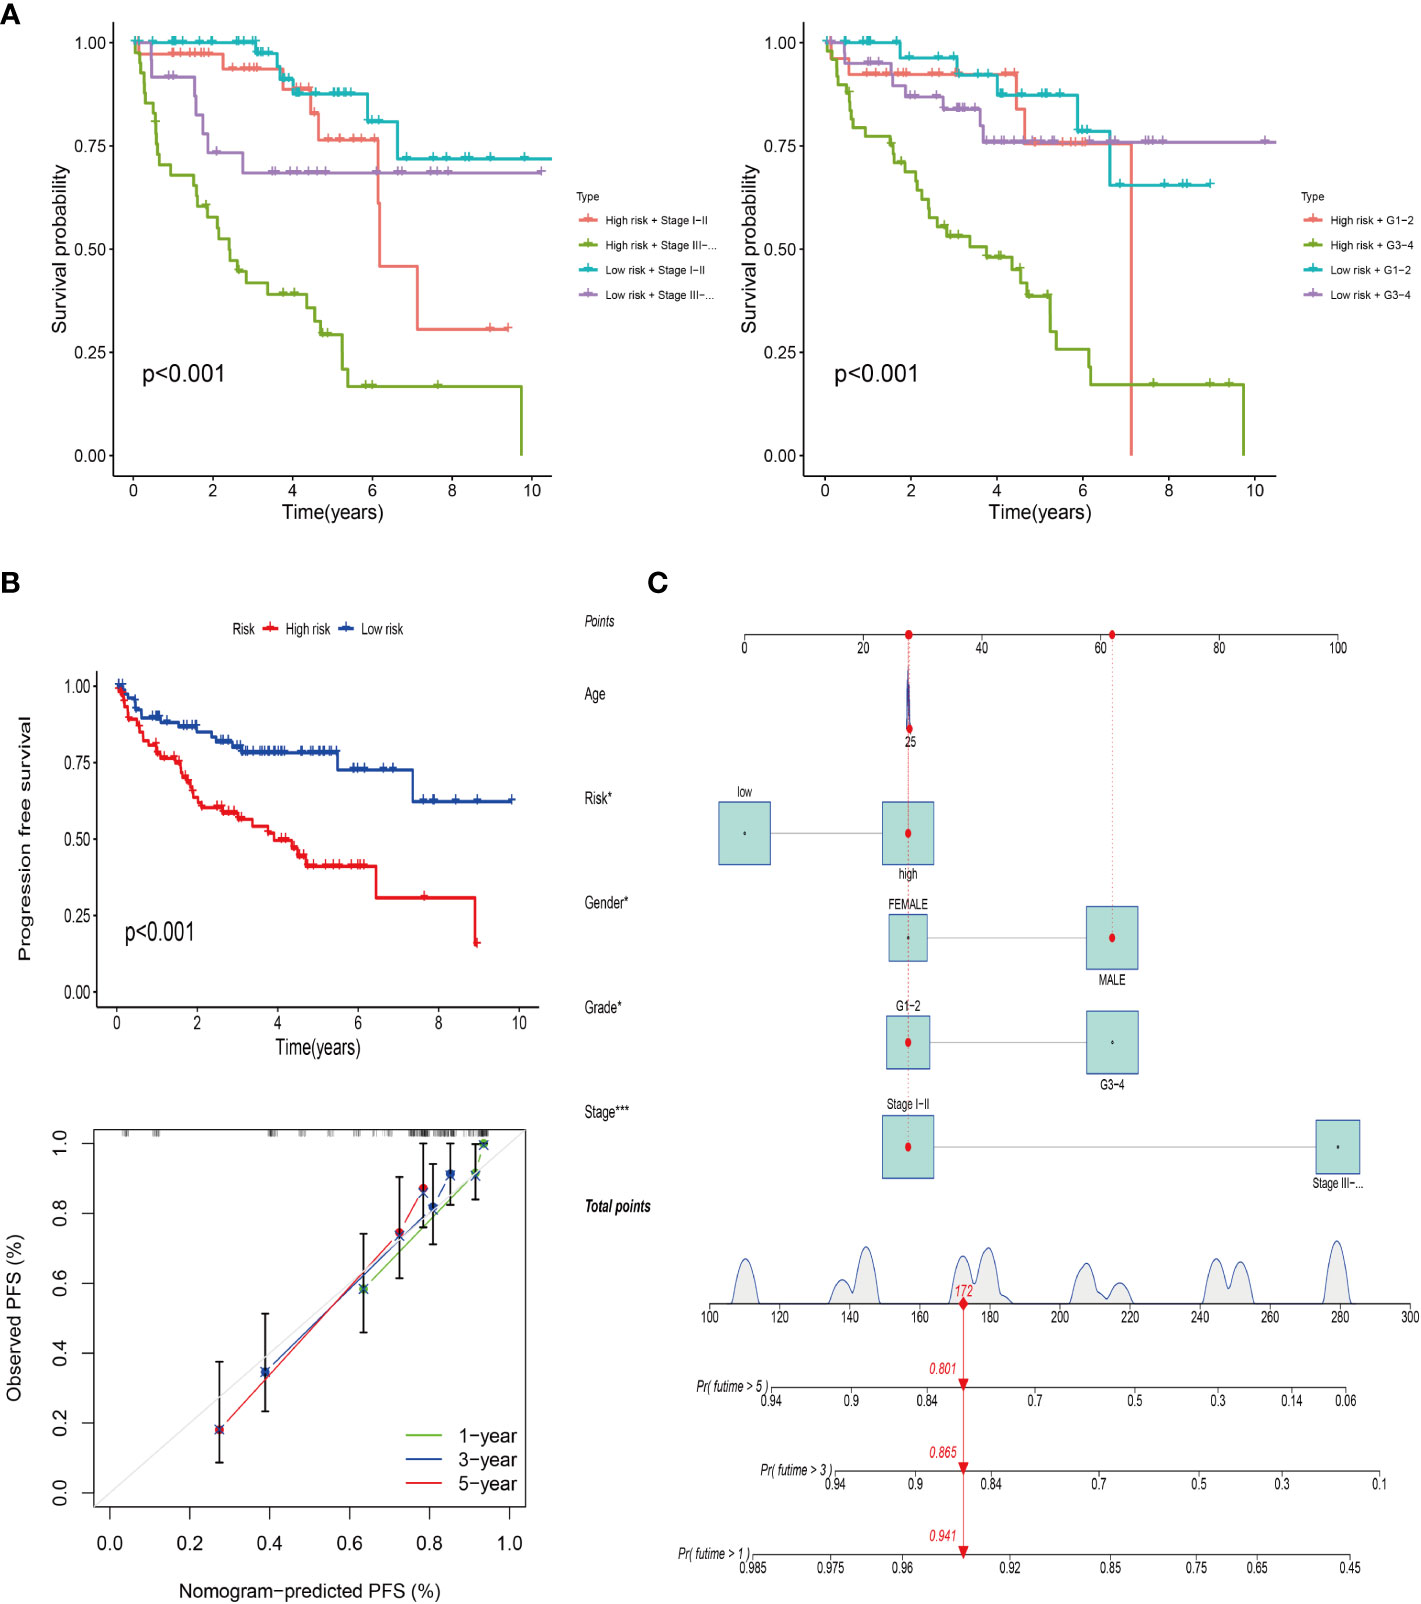
Figure 5 Progression-free survival of the risk model. (A) Survival analysis of the risk model combined with clinical stage (left) and grade (right). (B) PFS of the risk model and calibration curve. (C) Column line plot of the PFS prediction model.
Through GSEA, we found that the prognostic model related genes in the high-risk group are active in immune-related pathways, such as Phagocytosis-receptor, immunoglobulin-complex, immunoglobulin-complex-circulating, and antigen-binding, while those in the low-risk group are mainly active in metabolic-related pathways, such as organic-catabolic-process and small-molecular-catabolic-process (Figure 6A). In addition, through the analysis of the difference of immune cells between high and low risk group, we confirmed that there are significant differences between high and low risk groups (Figure 6B). The results of correlation analysis between risk score and immune checkpoint (Figure 6C) showed that the risk score was correlated with PDCDILG2, HAVCR2 and other immune checkpoint related genes. Besides, the results of immune cell correlation analysis (Figure 6D) showed that the risk score was related to T cell CD4 memory activated, macrophages M1 and other immune cells or immune pathways.
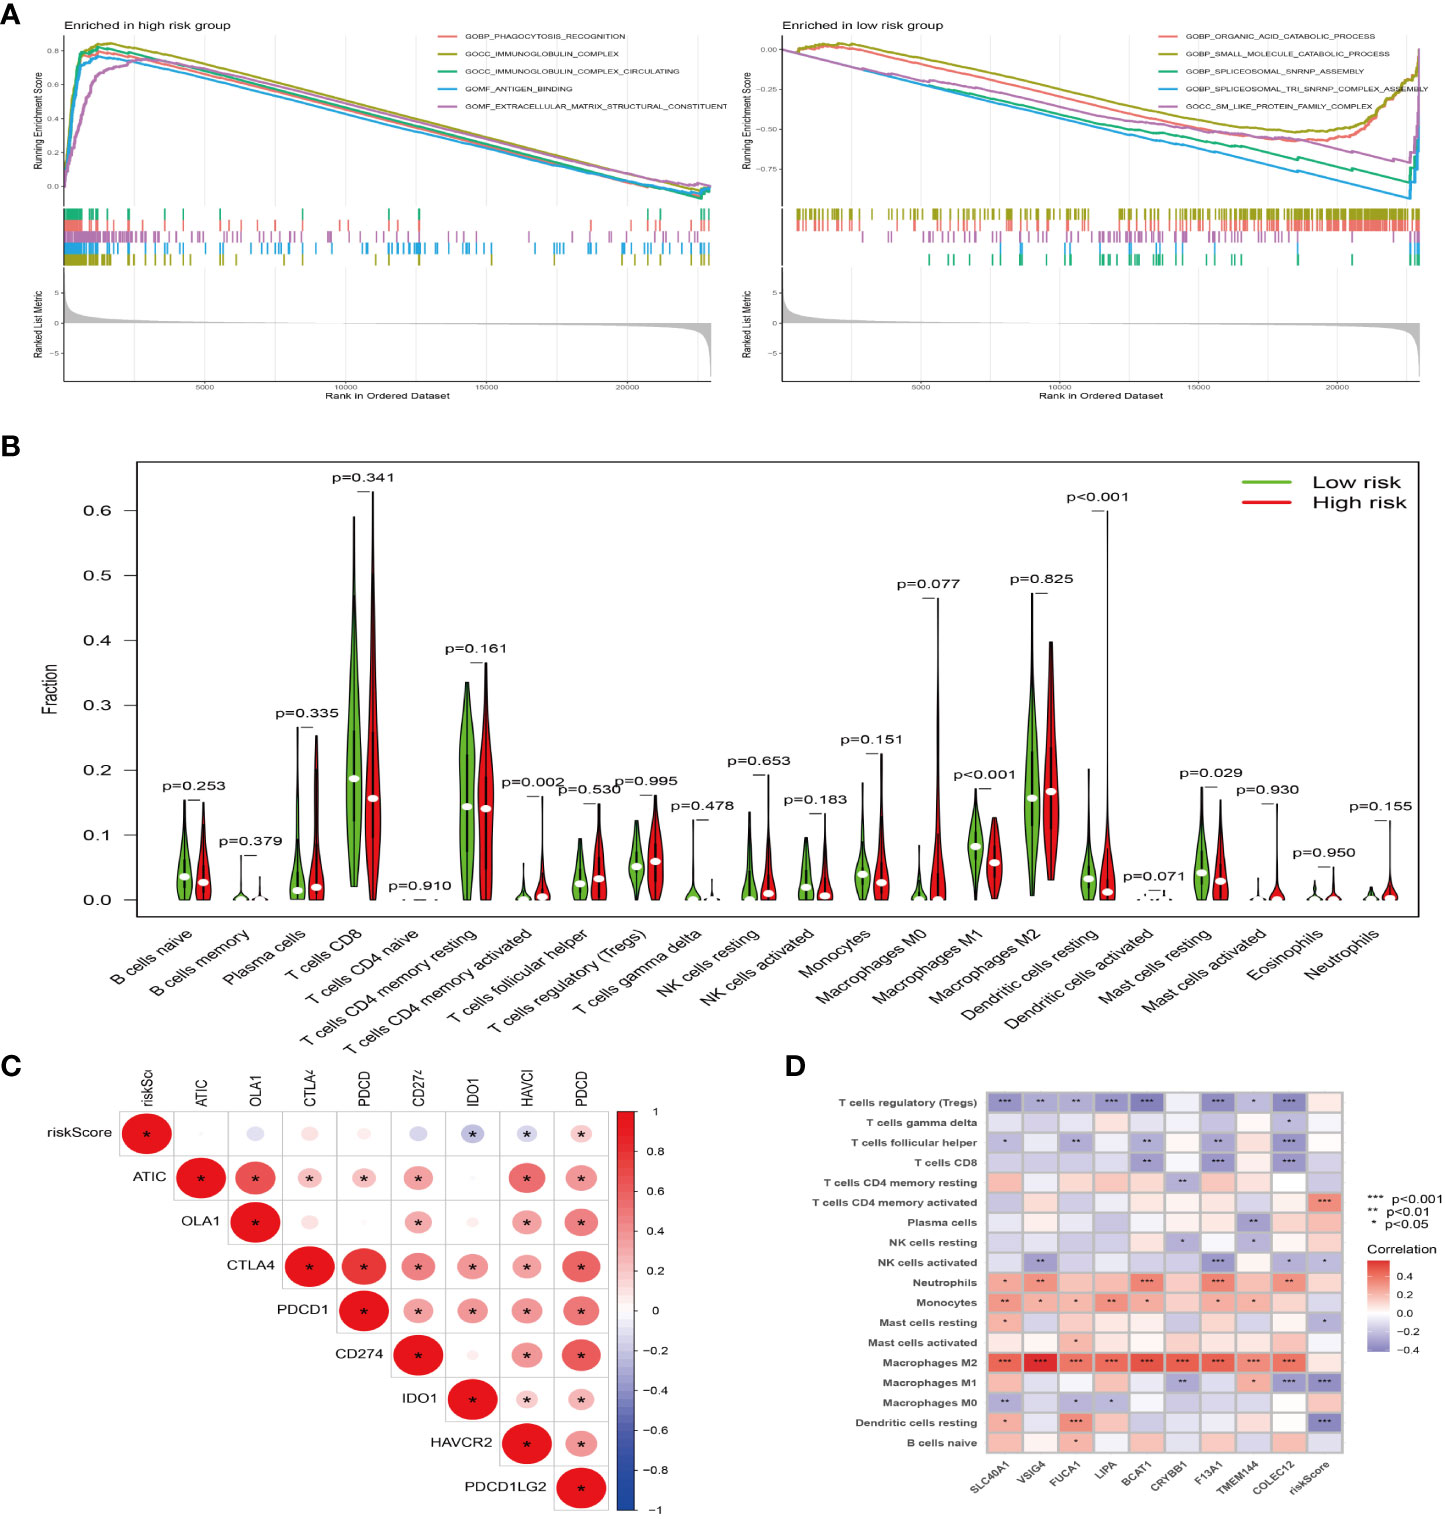
Figure 6 The model gene plays a tumor-promoting role through immunity. (A) GSEA of high (left) and low (right) risk groups, different color curves represent different functions or pathways. (B) Violin plot of immune cell difference analysis of high and low risk groups, green represents low risk group, and red represents high risk group. (C) Correlation analysis of immune checkpoint and risk score, “*” represents correlation, red represents positive, and blue represents negative. (D) Correlation analysis of immune cells and risk score, “*” represents correlation, red represents positive, and blue represents negative. *P<0.05, **P<0.01, ***P<0.001.
The high and low risk groups were constructed by each single gene in the model gene. The survival differences between the high and low risk groups were analyzed. And the results showed that there was a difference in survival between the high and low risk groups constructed by VSIG4, TMEM144, SLC40A1, LIPA, F13A1 and CRYBB1 (Supplementary Figure 1). In addition, the differences in the expression of M2 macrophage-related genes between tumor tissues and paracancerous tissues from the same sample were analyzed, and the results showed that there were differences in the expression of VSIG4, TMEM144, SLC40A1, LIPA, CRYBB1, COLEC12, FUCA1 and BCAT1 between tumor tissues and paracancerous tissues (Supplementary Figure 2). At the same time, the expression of M2 macrophage-related genes from normal tissues and tumors of different individuals was analyzed, and the results showed that there was a difference in VSIG4, TMEM144, SLC40A1, LIPA, CRYBB1, COLEC12, FUCA1, BCAT1 between tumor tissues and normal tissues (Supplementary Figure 3). Based on the results of single gene analysis, 6 genes that cross existed in single gene analysis were selected from the 9 genes of the model gene. The differential expression of the model genes selected in RCC tissue and normal kidney tissue as well as in HK-2 and 786-O cells was analyzed. The results demonstrated that FUCA1 was down-regulated in RCC tissue and cell, while SLC40A1, VSIG4, CRYBB1 and LIPA were up-regulated in RCC tissue and cell (Figure 7A). In previous experiments, we confirmed that macrophages extracted from RCC tissues could significantly promote the invasion and migration of 786-O (Figure 1D). In further experiments (Figure 7B), in order to eliminate the effect of other cells that may exist in tissue extraction cells, we induced THP-1 cell to differentiate into M2 macrophages, and THP-1 were suspended cells under normal circumstances, while the M2 differentiation THP-1 were adherent cells (Figure 7C). Besides, the expression of flow antibodies CD206 were up-regulated after differentiating into M2 macrophages (Figure 7D). The results showed that M2 macrophages significantly promoted the migration (P<0.0001) and invasion (P<0.001) of RCC, compared with the control group and the M0 macrophages group (Figure 7E). After 786-O co-culturing with M2 macrophages, its RNA was extracted, and then qPCR was performed again to detect the expression of the above 6 model genes. The results showed that M2 macrophages promoted the expression of VSIG4, TMEM144, SLC40A1, LIPA, FUCA1 and CRYBB1 in 786-O cells, compared with the control group (Figure F).
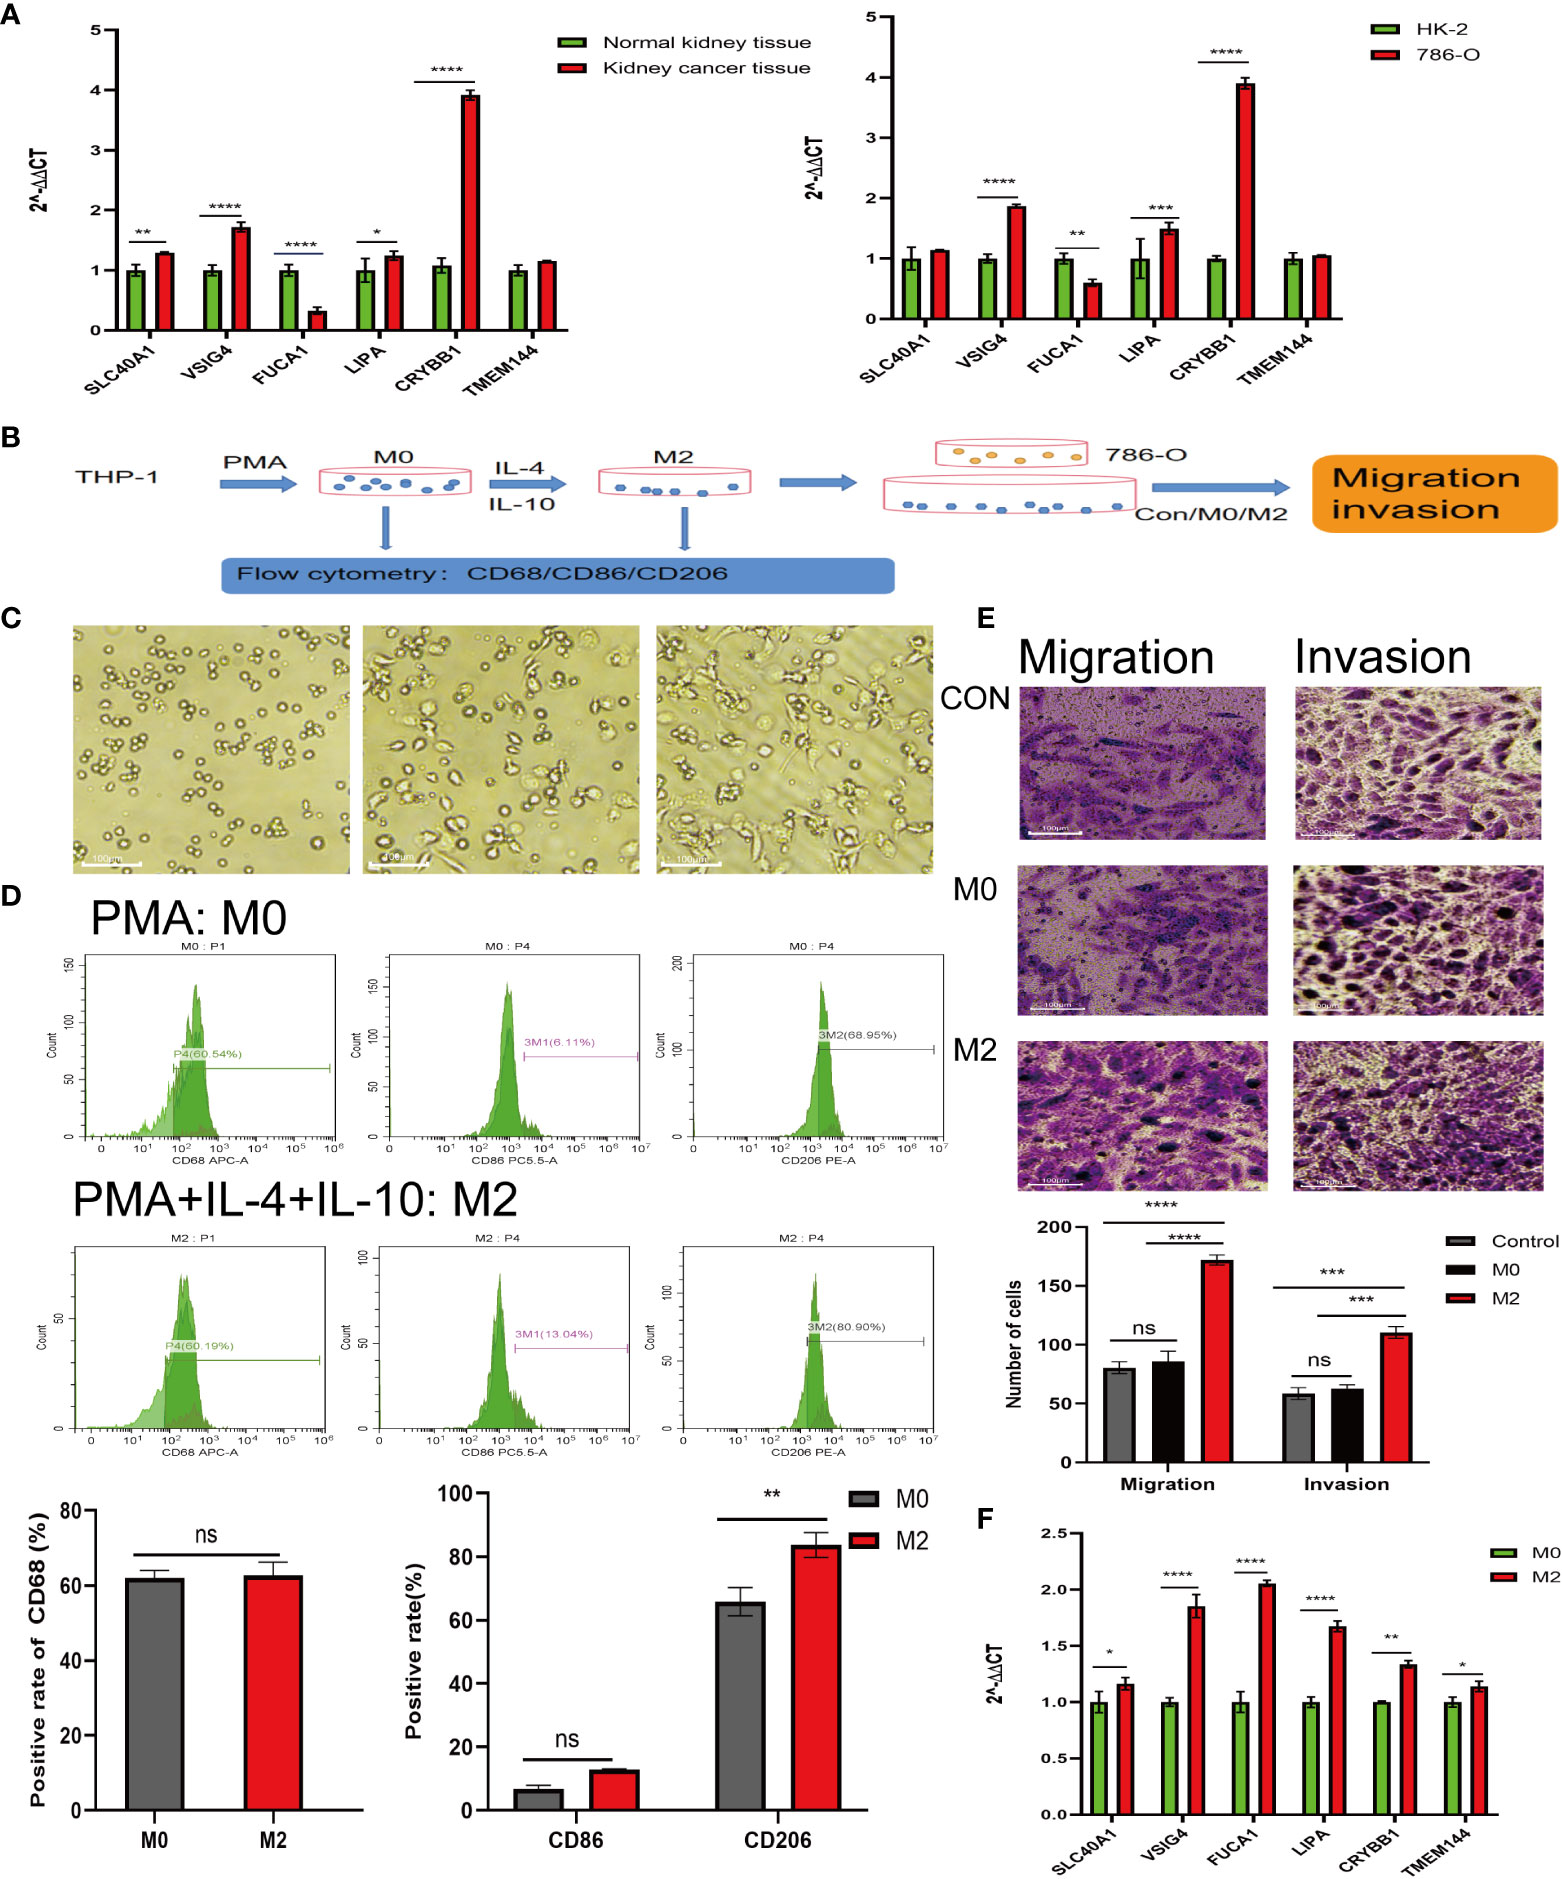
Figure 7 Experiments in vitro to detect the effect of M2-type macrophages on RCC. (A) Expression of model genes in normal kidney tissues, RCC tissues (left) and HK-2, 786-O (right). (B) Procedure of induced differentiation of M2-type macrophages from THP-1 and procedure of co-culture. (C) Undifferentiated THP-1 cells (left); mature M0 macrophages (middle); differentiated M2-type macrophages (right). (D) Expression of CD68, CD86 and CD206 after THP-1 differentiating. (E) Effect of M0 and M2 co-cultured with 786-O on migration and invasion ability of 786-O. (F) Expression of model genes in 786-O cells after co-culture. *P<0.05, **P<0.01, ***P<0.001, ****P<0.0001.
3Tumor immune escape, refractory and recurrence are attributed to tumor immune microenvironment to a large extent (27). Tumor-associated macrophages(TAMAs) play a key role in reshaping tumor immune microenvironment to promote tumor development (13). TAMAs are the most important component of immune cells in the tumor microenvironment of solid tumors (28). They can be roughly divided into two types: M1 of classical activation pathway and M2 of bypass activation pathway (29). Among them, M2 macrophages are mainly (27). Recently, studies have shown that tumor-associated M2 macrophages are associated with tumor staging, differentiation, metastasis and drug resistance, affecting the prognosis of tumor patients (30). Such as breast cancer, ovarian cancer, prostate cancer, cervical cancer, lung cancer and so on. However, few studies have focused on the effect of M2 macrophages on RCC.
Due to the difficulty of early diagnosis and early metastasis of RCC (4), 30% of RCC patients had metastatic lesions at diagnosis (5), which causes RCC poor prognosis and low survival rate. In our early study, immunofluorescence labeling was used to confirm the increase of M2 macrophages in RCC tissues. Besides, the macrophages extracted from renal clear cell carcinoma tissues and normal renal tissues were detected by flow cytometry, and the results also showed that the proportion of M2 macrophages in renal clear cell carcinoma tissues was significantly higher than that in normal renal tissues. In addition, the co-culture experiment confirmed that the macrophages extracted from RCC could promote the invasion and migration of renal cancer cells. Based on this, we speculate that the early metastasis and poor prognosis of RCC may be closely related to M2 macrophages in TAMs, but the specific mechanism of its effect is still unclear. Therefore, in this study, we used bioinformatics methods to explore the mechanism of M2 macrophages on RCC. Using the transcriptome data and clinical information of RCC downloaded from TCGA database and GEO database, we obtained M2 macrophage related genes in RCC, and then screened the model genes to construct a prognostic model. According to the prognosis model, it can be seen that the overall survival time and progression-free survival time of patients in the high-risk group are worse than those in the low-risk group, and, through univariate and multivariate analysis, it demonstrated that our survival model is not affected by age, sex, stage, grade and other factors, and can be used as an independent prognostic factor. The ROC curve confirmed that our prognostic model has high accuracy in predicting survival, which means that M2 macrophages in TAMs play a key role by affecting model genes, including SLC40A1, VSIG4, FUCA1, LIPA, BCAT1, CRYBB1, F13A, TMEM144 and COLEC12, in tumor cells of patients with renal cell carcinoma. In addition, the results of GO and KEGG enrichment analysis showed that M2 macrophage-related genes were mainly enriched in immune-related pathways, such as positive regulation of leukocyte, mononuclear cell migration, regulation of mononuclear cell migration, regulation of leukocyte chemotaxis, neutrophil extracellular trap formation and phagosome. In addition, the results of GSEA showed that the prognostic model related genes in high-risk group were active in immune related pathways, such as Phagocytosis-receptor, immunoglobulin-complex, immunoglobulin-complex-circulating and antigen-binding, which means that the model genes affect the proliferation, invasion and metastasis of tumor cells through immune regulation, or M2 macrophages regulate the model genes of RCC through the formula of immune regulation. In addition, the correlation analysis between risk score and immune checkpoints as well as immune cells also showed that the model genes associated with M2 macrophages were closely related to immunity. Yet, although the link between risk scores and immune cells as well as immune checkpoints has been demonstrated in this study, there is no clinical evidence to support it, so prospective studies are necessary to validate the M2 macrophage-associated gene in the cohort of patients receiving immune checkpoint inhibitor (ICI) combination therapy in next studies. In addition, single gene analysis was carried out in this study, and SLC40A1, VSIG4, FUCA1, LIPA, CRYBB1 and TEME144 6 genes were screened from 9 model genes. RNA was extracted from RCC tissue and normal kidney tissue, 786-O and HK-2 for qPCR. The results showed that FUCA1 was down-regulated and SLC40A1, VSIG4, CRYBB1 and LIPA were up-regulated in renal cell carcinoma and 786-O, and the difference was statistically significant. After 786-O co-culturing with M2 macrophages, RNA was extracted and qPCR was performed again. The results showed that compared with the control group, the expression of FUCA1, SLC40A1, VSIG4, CRYBB1, LIPA and TMEM144 in M2 macrophage co-culture group were up-regulated. It has been previously reported that Fucosidase1 (FUCA1) encodes a lysosomal enzyme that participates in the degradation of fucose-containing glycoproteins and glycolipids. Down-regulation of FUCA1 can enhance autophagy and inhibit macrophage infiltration, thus inhibiting tumor growth (31). In this study, M2 macrophages can up-regulate the expression of FUCA1, but its actual expression in renal clear cell carcinoma is down-regulated. We speculate that the contradictory result may be caused by the complexity of the tumor microenvironment, but the specific mechanism is still unknown. V-set and immunoglobulin domain containing 4 (VSIG4) is a transmembrane receptor of the immunoglobulin superfamily, which is specifically expressed in macrophages and mature dendritic cells. As a newly discovered B7 family-associated macrophage protein, it can inhibit T cell activation (32). Solute carrier family 40 member 1 (SLC40A1) is the only iron output protein found in mammals (33). It can increase the expression of iron in tumor microenvironment, and high iron levels can promote M2 polarization of macrophages (34). In addition, lysosomal acid lipase A (LIPA) contributes to the phenotypic transformation of macrophages and promotes the survival of macrophages (35), and studies have confirmed that LIPA deficiency can induce macrophages to differentiate into pro-inflammatory phenotype M1 (36–38).
In this study, we confirmed the increased proportion of M2 tumor-associated macrophages in RCC, which promotes RCC cell migration and invasion. The results of bioinformatics analysis show that M2 macrophages may play a significant part in promoting the development of renal cell carcinoma by regulating the expression of M2 macrophage related genes such as SLC40A1, VSIG4, FUCA1, LIPA, BCAT1, CRYBB1, F13A, TMEM144 and COLEC12 in RCC. Therefore, these genes may be considered as therapeutic targets in the treatment of renal cell carcinoma in the future, so as to provide more possibilities for the treatment of renal cell carcinoma.
The data used in this research are available from the corresponding author upon reasonable request.
The studies involving human participants were reviewed and approved by the Medical Ethics Committee of the Affiliated Hospital of Qingdao University (Approval No. QYFYWZLL27558). The patients/participants provided their written informed consent to participate in this study.
XXZ, CG, XY and YZ conducted all the analysis. XXZ, YS and YM wrote the manuscript. XZ, WW and LW designed this work. All authors contributed to the article and approved the submitted version.
This work was supported by the Natural Science Foundation of Shandong Province (ZR2020MH327).
The authors declare that the research was conducted in the absence of any commercial or financial relationships that could be construed as a potential conflict of interest.
All claims expressed in this article are solely those of the authors and do not necessarily represent those of their affiliated organizations, or those of the publisher, the editors and the reviewers. Any product that may be evaluated in this article, or claim that may be made by its manufacturer, is not guaranteed or endorsed by the publisher.
The Supplementary Material for this article can be found online at: https://www.frontiersin.org/articles/10.3389/fonc.2023.1157861/full#supplementary-material
Supplementary Figure 1 | Single model gene survival analysis. Red represents high-risk groups and blue represents low-risk groups.
Supplementary Figure 2 | Differential analysis of individual model genes in normal and kidney cancer tissues from the same sample. Red represents normal samples and blue represents tumor samples.
Supplementary Figure 3 | Differential analysis of individual model gene in normal kidney tissue and kidney cancer tissue from different samples. Red represents normal samples and blue represents tumor samples.
1. Bukowski RM. Natural history and therapy of metastatic renal cell carcinoma: the role of interleukin-2. Cancer (1997) 80(7):1198–220. doi: 10.1002/(sici)1097-0142(19971001)80:7<1198::aid-cncr3>3.0.co;2-h
2. Park YH, Baik KD, Lee YJ, Ku JH, Kim HH, Kwak C. Late recurrence of renal cell carcinoma >5 years after surgery: clinicopathological characteristics and prognosis. BJU Int (2012) 110(11):553–8. doi: 10.1111/j.1464-410X.2012.11246.x
3. Liang T, Sang S, Shao Q, Chen C, Deng Z, Wang T, et al. Abnormal expression and prognostic significance of EPB41L1 in kidney renal clear cell carcinoma based on data mining. Cancer Cell Int (2020) 20:356. doi: 10.1186/s12935-020-01449-8
4. Cheng F, Zheng B, Wang J, Zhao G, Yao Z, Niu Z, et al. Comprehensive analysis of a new prognosis signature based on histone deacetylases in clear cell renal cell carcinoma. Cancer Med (2021) 10(18):6503–14. doi: 10.1002/cam4.4156
5. Kim SP, Weight CJ, Leibovich BC, Thompson RH, Costello BA, Cheville JC, et al. Outcomes and clinicopathologic variables associated with late recurrence after nephrectomy for localized renal cell carcinoma. Urology (2011) 78(5):1101–6. doi: 10.1016/j.urology.2011.05.012
6. Motzer RJ, Hutson TE, Tomczak P, Michaelson MD, Bukowski RM, Oudard S, et al. Overall survival and updated results for sunitinib compared with interferon alfa in patients with metastatic renal cell carcinoma. J Clin Oncol (2009) 27(22):3584–90. doi: 10.1200/jco.2008.20.1293
7. Wang C, Wang Y, Hong T, Ye J, Chu C, Zuo L, et al. Targeting a positive regulatory loop in the tumor-macrophage interaction impairs the progression of clear cell renal cell carcinoma. Cell Death Differ (2021) 28(3):932–51. doi: 10.1038/s41418-020-00626-6
8. Jonasch E, Gao J, Rathmell WK. Renal cell carcinoma. Bmj (2014) 349:47–52. doi: 10.1136/bmj.g4797
9. Cohen HT, McGovern FJ. Renal-cell carcinoma. N Engl J Med (2005) 353(23):2477–90. doi: 10.1056/NEJMra043172
10. Hirsch FR, Scagliotti GV, Mulshine JL, Kwon R, Curran WJ Jr., Wu YL, et al. Lung cancer: current therapies and new targeted treatments. Lancet (2017) 389(10066):299–311. doi: 10.1016/s0140-6736(16)30958-8
11. Pollard JW. Trophic macrophages in development and disease. Nat Rev Immunol (2009) 9(4):259–70. doi: 10.1038/nri2528
12. Yamagata Y, Tomioka H, Sakamoto K, Sato K, Harada H, Ikeda T, et al. CD163-positive macrophages within the tumor stroma are associated with lymphangiogenesis and lymph node metastasis in oral squamous cell carcinoma. J Oral Maxillofac Surg (2017) 75(10):2144–53. doi: 10.1016/j.joms.2017.03.009
13. Pollard JW. Tumour-educated macrophages promote tumour progression and metastasis. Nat Rev Cancer (2004) 4(1):71–8. doi: 10.1038/nrc1256
14. Yang P, Markowitz GJ, Wang XF. The hepatitis b virus-associated tumor microenvironment in hepatocellular carcinoma. Natl Sci Rev (2014) 1(3):396–412. doi: 10.1093/nsr/nwu038
15. Mantovani A, Marchesi F, Malesci A, Laghi L, Allavena P. Tumour-associated macrophages as treatment targets in oncology. Nat Rev Clin Oncol (2017) 14(7):399–416. doi: 10.1038/nrclinonc.2016.217
16. Murray PJ, Wynn TA. Protective and pathogenic functions of macrophage subsets. Nat Rev Immunol (2011) 11(11):723–37. doi: 10.1038/nri3073
17. Komohara Y, Jinushi M, Takeya M. Clinical significance of macrophage heterogeneity in human malignant tumors. Cancer Sci (2014) 105(1):1–8. doi: 10.1111/cas.12314
18. Pritchard A, Tousif S, Wang Y, Hough K, Khan S, Strenkowski J, et al. Lung tumor cell-derived exosomes promote M2 macrophage polarization. Cells (2020) 9(5):1303–23. doi: 10.3390/cells9051303
19. Chen Y, Zhang S, Wang Q, Zhang X. Tumor-recruited M2 macrophages promote gastric and breast cancer metastasis via M2 macrophage-secreted CHI3L1 protein. J Hematol Oncol (2017) 10(1):36. doi: 10.1186/s13045-017-0408-0
20. Zeng Z, Yu J, Yang Z, Du K, Chen Y, Zhou L. Investigation of M2 macrophage-related gene affecting patients prognosis and drug sensitivity in non-small cell lung cancer: evidence from bioinformatic and experiments. Front Oncol (2022) 12:1096449. doi: 10.3389/fonc.2022.1096449
21. Han Y, Li Y. Comprehensive exploration of M2 macrophages and its related genes for predicting clinical outcomes and drug sensitivity in lung squamous cell carcinoma. J Oncol (2022) 2022:116–24. doi: 10.1155/2022/1163924
22. Xu C, Song L, Yang Y, Liu Y, Pei D, Liu J, et al. Clinical M2 macrophage-related genes can serve as a reliable predictor of lung adenocarcinoma. Front Oncol (2022) 12:919899. doi: 10.3389/fonc.2022.919899
23. Kovaleva OV, Samoilova DV, Shitova MS, Gratchev A. Tumor associated macrophages in kidney cancer. Anal Cell Pathol (Amst) (2016) 2016:75–89. doi: 10.1155/2016/9307549
24. Wang Y, Yan K, Lin J, Li J, Bi J. Macrophage M2 Co-expression factors correlate with the immune microenvironment and predict outcome of renal clear cell carcinoma. Front Genet (2021) 12:615655. doi: 10.3389/fgene.2021.615655
25. Kanehisa M, Furumichi M, Tanabe M, Sato Y, Morishima K. KEGG: new perspectives on genomes, pathways, diseases and drugs. Nucleic Acids Res (2017) 45(1):353–61. doi: 10.1093/nar/gkw1092
26. Ashburner M, Ball CA, Blake JA, Botstein D, Butler H, Cherry JM, et al. Gene ontology: tool for the unification of biology. Gene Ontology Consortium. Nat Genet (2000) 25(1):25–9. doi: 10.1038/75556
27. Kumari N, Choi SH. Tumor-associated macrophages in cancer: recent advancements in cancer nanoimmunotherapies. J Exp Clin Cancer Res (2022) 41(1):68. doi: 10.1186/s13046-022-02272-x
28. Liu C, Zhang X, Hu C, Liang X, Cao X, Wang D. Systematic construction and validation of a novel macrophage differentiation-associated prognostic model for clear cell renal cell carcinoma. Front Genet (2022) 13:877656. doi: 10.3389/fgene.2022.877656
29. Ostuni R, Kratochvill F, Murray PJ, Natoli G. Macrophages and cancer: from mechanisms to therapeutic implications. Trends Immunol (2015) 36(4):229–39. doi: 10.1016/j.it.2015.02.004
30. Guo Q, Jin Z, Yuan Y, Liu R, Xu T, Wei H, et al. New mechanisms of tumor-associated macrophages on promoting tumor progression: recent research advances and potential targets for tumor immunotherapy. J Immunol Res (2016) 2016:209–12. doi: 10.1155/2016/9720912
31. Xu L, Li Z, Song S, Chen Q, Mo L, Wang C, et al. Downregulation of α-l-fucosidase 1 suppresses glioma progression by enhancing autophagy and inhibiting macrophage infiltration. Cancer Sci (2020) 111(7):2284–96. doi: 10.1111/cas.14427
32. Kim KH, Choi BK, Kim YH, Han C, Oh HS, Lee DG, et al. Extracellular stimulation of VSIG4/complement receptor ig suppresses intracellular bacterial infection by inducing autophagy. Autophagy (2016) 12(9):1647–59. doi: 10.1080/15548627.2016.1196314
33. van Swelm RPL, Wetzels JFM, Swinkels DW. The multifaceted role of iron in renal health and disease. Nat Rev Nephrol (2020) 16(2):77–98. doi: 10.1038/s41581-019-0197-5
34. Wilkinson HN, Roberts ER, Stafford AR, Banyard KL, Matteucci P, Mace KA, et al. Tissue iron promotes wound repair via M2 macrophage polarization and the chemokine (C-c motif) ligands 17 and 22. Am J Pathol (2019) 189(11):2196–208. doi: 10.1016/j.ajpath.2019.07.015
35. Gerloff D, Lützkendorf J, Moritz RKC, Wersig T, Mäder K, Müller LP, et al. Melanoma-derived exosomal miR-125b-5p educates tumor associated macrophages (TAMs) by targeting lysosomal acid lipase a (LIPA). Cancers (Basel) (2020) 12(2):464–81. doi: 10.3390/cancers12020464
36. Yan C, Lian X, Li Y, Dai Y, White A, Qin Y, et al. Macrophage-specific expression of human lysosomal acid lipase corrects inflammation and pathogenic phenotypes in lal-/- mice. Am J Pathol (2006) 169(3):916–26. doi: 10.2353/ajpath.2006.051327
37. Leopold C, Duta-Mare M, Sachdev V, Goeritzer M, Maresch LK, Kolb D, et al. Hepatocyte-specific lysosomal acid lipase deficiency protects mice from diet-induced obesity but promotes hepatic inflammation. Biochim Biophys Acta Mol Cell Biol Lipids (2019) 1864(4):500–11. doi: 10.1016/j.bbalip.2019.01.007
Keywords: M2 macrophages, renal clear cell carcinoma, tumor immune microenvironment, tumor-associated macrophages, M2 macrophage-related genes
Citation: Zhang X, Sun Y, Ma Y, Gao C, Zhang Y, Yang X, Zhao X, Wang W and Wang L (2023) Tumor-associated M2 macrophages in the immune microenvironment influence the progression of renal clear cell carcinoma by regulating M2 macrophage-associated genes. Front. Oncol. 13:1157861. doi: 10.3389/fonc.2023.1157861
Received: 03 February 2023; Accepted: 22 May 2023;
Published: 08 June 2023.
Edited by:
Jun Pang, Sun Yat-sen University, ChinaReviewed by:
Mimma Rizzo, Azienda Ospedaliero Universitaria Consorziale Policlinico di Bari, ItalyCopyright © 2023 Zhang, Sun, Ma, Gao, Zhang, Yang, Zhao, Wang and Wang. This is an open-access article distributed under the terms of the Creative Commons Attribution License (CC BY). The use, distribution or reproduction in other forums is permitted, provided the original author(s) and the copyright owner(s) are credited and that the original publication in this journal is cited, in accordance with accepted academic practice. No use, distribution or reproduction is permitted which does not comply with these terms.
*Correspondence: Xia Zhao, emhhb3hpYUBxZHUuZWR1LmNu; Wei Wang, MTg2NjE4MDczOTJAMTYzLmNvbQ==; Lisheng Wang, bGlzaGVuZ3dhbmdAcWR1LmVkdS5jbg==
Disclaimer: All claims expressed in this article are solely those of the authors and do not necessarily represent those of their affiliated organizations, or those of the publisher, the editors and the reviewers. Any product that may be evaluated in this article or claim that may be made by its manufacturer is not guaranteed or endorsed by the publisher.
Research integrity at Frontiers
Learn more about the work of our research integrity team to safeguard the quality of each article we publish.