 Monika Gooz
 Eduardo N. Maldonado
- 1Department of Drug Discovery & Biomedical Sciences, Medical University of South Carolina, Charleston, SC, United States
- 2Hollings Cancer Center, Medical University of South Carolina, Charleston, SC, United States
Mitochondrial metabolism is an important contributor to cancer cell survival and proliferation that coexists with enhanced glycolytic activity. Measuring mitochondrial activity is useful to characterize cancer metabolism patterns, to identify metabolic vulnerabilities and to identify new drug targets. Optical imaging, especially fluorescent microscopy, is one of the most valuable tools for studying mitochondrial bioenergetics because it provides semiquantitative and quantitative readouts as well as spatiotemporal resolution of mitochondrial metabolism. This review aims to acquaint the reader with microscopy imaging techniques currently used to determine mitochondrial membrane potential (ΔΨm), nicotinamide adenine dinucleotide (NADH), ATP and reactive oxygen species (ROS) that are major readouts of mitochondrial metabolism. We describe features, advantages, and limitations of the most used fluorescence imaging modalities: widefield, confocal and multiphoton microscopy, and fluorescent lifetime imaging (FLIM). We also discus relevant aspects of image processing. We briefly describe the role and production of NADH, NADHP, flavins and various ROS including superoxide and hydrogen peroxide and discuss how these parameters can be analyzed by fluorescent microscopy. We also explain the importance, value, and limitations of label-free autofluorescence imaging of NAD(P)H and FAD. Practical hints for the use of fluorescent probes and newly developed sensors for imaging ΔΨm, ATP and ROS are described. Overall, we provide updated information about the use of microscopy to study cancer metabolism that will be of interest to all investigators regardless of their level of expertise in the field.
1 Introduction
Mitochondria and cytosolic glycolysis are both major drivers for survival and proliferation of cancer cells. The first link between mitochondrial function and cancer originated from the studies of Warburg in the early 1920’s who found that tumors produce more lactic acid than non-tumor cells. Warburg even proposed that damaged mitochondria caused cancer (1, 2). Although his theory was proven wrong, the findings about enhanced cytosolic glycolysis in cancer cells remained a central concept in cancer metabolism until present. Regardless of the relevance of glycolysis for proliferation, mitochondria are also essential for cancer cell homeostasis and to sustain tumor growth (3–5). Both enhanced glycolysis and partially suppressed mitochondrial metabolism characterize what today we call the Warburg phenotype (1, 2, 5–8).
Research in the last 20 years has shown that the Warburg effect is not restricted to cancer cells (9–11). Fibroblasts provide not only structural integrity but are involved in intercellular signaling and tissue homeostasis (12, 13). Skin fibroblasts activated in response to wound healing and inflammation, also referred to as myofibroblasts, consume more glucose and secrete more lactate than normal fibroblasts (11, 14). Like myofibroblasts, cancer associated fibroblasts found in almost all solid tumors display enhanced glycolysis, high levels of pyruvate, ketone bodies and lactate that are released and utilized as fuels to sustain mitochondrial metabolism in tumor cells. This phenomenon has been described as a Reverse Warburg Effect, in which epithelial cancer cells induce the normal stroma to become a wound-healing type that provides an energy rich environment that facilitates tumor growth (9, 10, 15). Thus, a comprehensive approach to the study of mitochondrial metabolism in cancer would greatly benefit from considering the role of mitochondria both in tumor cells and the supporting microenvironment (16).
Mitochondrial metabolism is sustained by the oxidation of substrates that leads to the generation of ATP, reactive oxygen species (ROS), and biosynthetic precursors. Voltage dependent anion channels (VDAC) are the only gateway in the outer mitochondrial membrane for substrates, ADP and inorganic phosphate to enter mitochondria and for mitochondrial ATP to be released to the cytosol. Oxidation of pyruvate, fatty acyl CoAs, and certain amino acids in the Krebs cycle generates NADH and FADH2 in the mitochondrial matrix. NADH is the main electron donor to the electron transport chain (ETC). The flow of electrons through the ETC is associated with H+ pumping to the intermembrane space (IMS, orange in Figure 1) and ROS formation. Accumulation of H+ in the IMS generates a negative voltage in the mitochondrial matrix and a proton motive force used to synthesize ATP. The activity of the ETC coupled to ATP synthesis is called oxidative phosphorylation (Oxphos). The negative voltage in the matrix is the mitochondrial membrane potential (ΔΨm) (Figure 1). Oxidative metabolism refers to a state of mitochondria oxidizing substrates and producing ATP at full capacity.
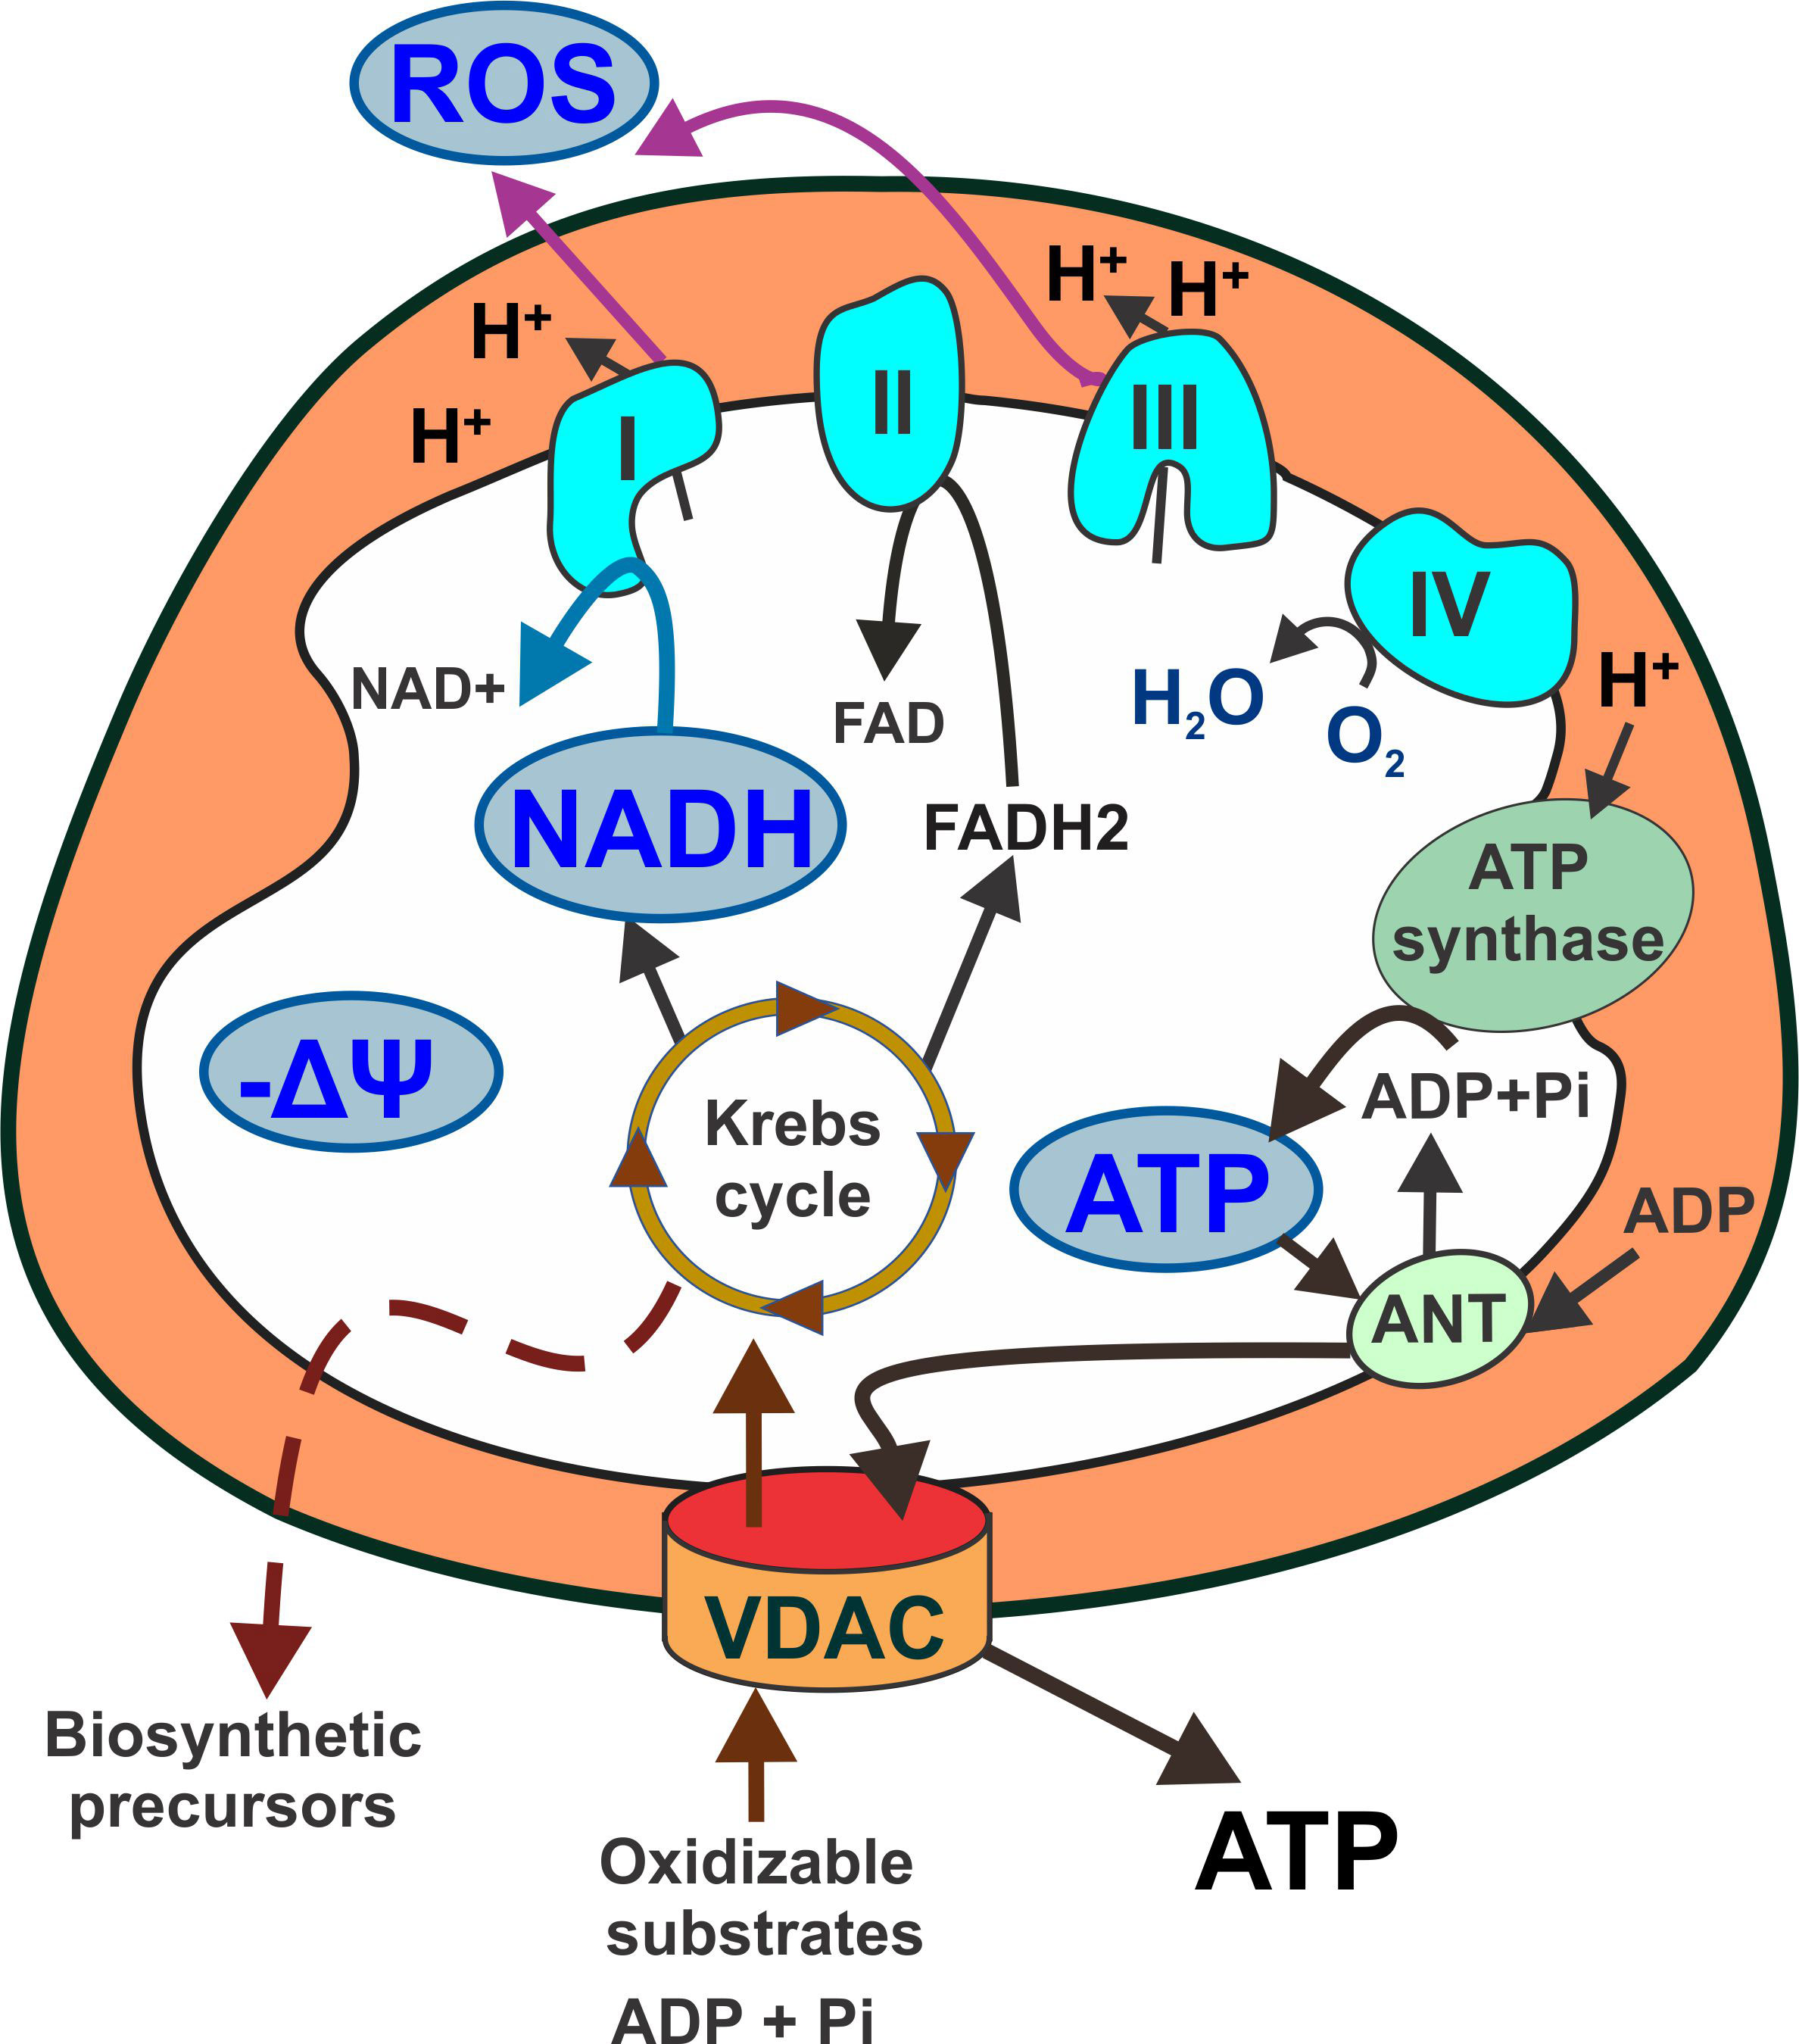
Figure 1 Schematic representation of mitochondrial metabolism highlighting main readouts used in fluorescence microscopy. Respiratory substrates (pyruvate, fatty acylCoA and certain amino acids) enter mitochondria through VDAC and fuel the Krebs cycle. NADH is the main electron donor for complex I. Electron flow through complexes II, III and IV is associated with proton pumping to the intermembrane space that generates a proton motive force used by the ATP synthase to produce ATP. ATP exchanges ADP for ATP. Proton accumulation in the intermembrane space creates a negative voltage (mitochondrial membrane potential) across the mitochondrial inner membrane. Respiratory complexes I and III are also major production sites of mitochondrial reactive oxygen species. Light blue shapes: major mitochondrial metabolic indicators. Orange: intermembrane space. ANT: adenine nucleotide translocator; ATP: adenosine triphosphate; FAD: Flavin adenine dinucleotide; NADH: nicotinamide adenine dinucleotide; ROS: reactive oxygen species; VDAC: voltage dependent anion channel; ΔΨ: mitochondrial membrane potential.
The relative contribution of glycolysis and oxidative phosphorylation to cancer metabolism is commonly determined by measuring ATP generation. Ten to 90% of total cellular ATP in tumor cells is contributed by cytosolic glycolysis, the rest being generated through Oxphos. This fact points outs the critical role of mitochondrial oxidative metabolism in cancer (17, 18). Although for a long time enhanced aerobic glycolysis has been associated with tumor aggressiveness, evidence from in vitro, in vivo, and epidemiological studies showed a very heterogenous contribution of glycolysis and Oxphos to cancer metabolism. Moreover, in some aggressive tumors oxidative metabolism prevails over glycolysis (19–24).
Access to oxygen and nutrients, among other factors, influences the balance between glycolysis and Oxphos. Inadequate perfusion in areas of rapid cell proliferation creates hypoxia and decreases the supply of nutrients including glucose. However, the influence of hypoxia on oxidative metabolism depends on the duration and cell type. Prolonged hypoxia increases glycolysis in MCF-7 cells but not in HeLa cells although in both cell lines, OxPhos is the predominant source of ATP (25). Noticeably, in solid tumors the respiratory chain is still fully functional at oxygen levels as low as 0.5%, indicating that hypoxic tumor cells exposed to <2% oxygen still produce ATP by OxPhos (26–28). If pyruvate oxidation in the Krebs cycle decreases, tumor cells adapt to oxidize more glutamine as an energy source to sustain tumor growth both through glycolysis and OxPhos (29). A reciprocal dependence of mitochondrial metabolism and enhanced glycolysis has been shown in several cancer cell types under hypoxia and limitations in the availability of nutrients (3, 22, 23, 30–32). Nutrient availability induces a switch from aerobic glycolysis to OxPhos in lymphoma cells and breast cancer cell lines cultured in glucose-free media (33, 34). Under glucose and glutamine limiting conditions, tumor cells adapt to utilize other sources including lactate, methionine, arginine, cysteine, asparagine, leucine, acetate, and even lipids and proteins from the microenvironment (3, 33–37).
In recent years, the study of mitochondrial metabolism in cancer became a hot research topic both for basic biology and for translational studies involving drug development and response to other forms of cancer treatment (38–45). In this review, we will focus on the use of advanced confocal and widefield microscopy for research on cancer metabolism in live cells. We will provide a detailed analysis of the use, advantages, and disadvantages of different imaging modalities to image ΔΨm, NADH, FAD, ROS, and ATP as major indicators of mitochondrial metabolism. These mitochondrial metabolic indicators provide valuable addition to the current markers used in advanced imaging technologies for cancer diagnostics (46–49).
2 Imaging modalities for mitochondrial metabolism
The most used microscopy imaging modalities for analyzing mitochondrial metabolism in live cells rely on the use of fluorescent dyes or the fluorescence of naturally occurring molecules. In recent years, a growing number of fluorescent molecules, probes and biosensors available, together with the lowering costs of widefield and confocal microscopes favored a widespread use of this technology. Simultaneously, the very fast developments in optical engineering and computational capabilities resulted in newer and sophisticated imaging approaches and advanced image processing. Thus, it is now possible to quantify and analyze different types of images, difficult to image molecules and to handle large datasets. Imaging mitochondrial metabolism has become essential to study cancer biology and cancer bioenergetics. Moreover, quantitative imaging of mitochondrial metabolism could be a potential exciting approach to identify novel biomarkers that could help to distinguish between normal, precancerous or cancer tissue, to predict effectiveness of chemotherapy or even to predict the metastatic potential of certain types of cancer (50, 51)
2.1 Epifluorescence widefield microscopy
It is one of the oldest fluorescent imaging modalities in which the specimen is illuminated using xenon and mercury arc lamps with wide wavelength spectrum. The development of image deconvolution algorithms and light-emitting diodes (LED) opened a new field in modern widefield microscopy. LED lights emit photons over a narrower bandwidth, do not produce heat, can be turned on/off quickly, and stay stable for longer periods of time compared to arc lamps. The incoming light in epifluorescence microscopy illuminates a large volume of the specimen (Figure 2). After passing through an emission/barrier filter, the signal is collected by a CCD camera or photomultiplier (PMT). The advantage of epifluorescence microscopy is the cost-effectiveness, and that LED illumination is less damaging to the sample than laser light. A major disadvantage in widefield microscopy is that increased intensity of the excitation light increases both the specific signal and the background due to light scattering, resulting in decreased contrast and resolution, and photobleaching. To overcome this problem, z-stacks (series of focal planes on the z axis) collected during image acquisition are then processed using image deconvolution software. Deconvolution is a computational method that allows restoration of the image based on the point spread function of the imaging system. The resulting image has increased contrast and resolution. Widefield microscopy is utilized successfully for both 2D (xy) and 3D (xyz) fluorescence microscopy of mitochondrial metabolic indicators including NAD(P)H and FAD (52) and ΔΨm (38). This technique can be especially suitable during drug discovery to measure ΔΨm, cellular ROS and ATP when subcellular resolution is not necessary.
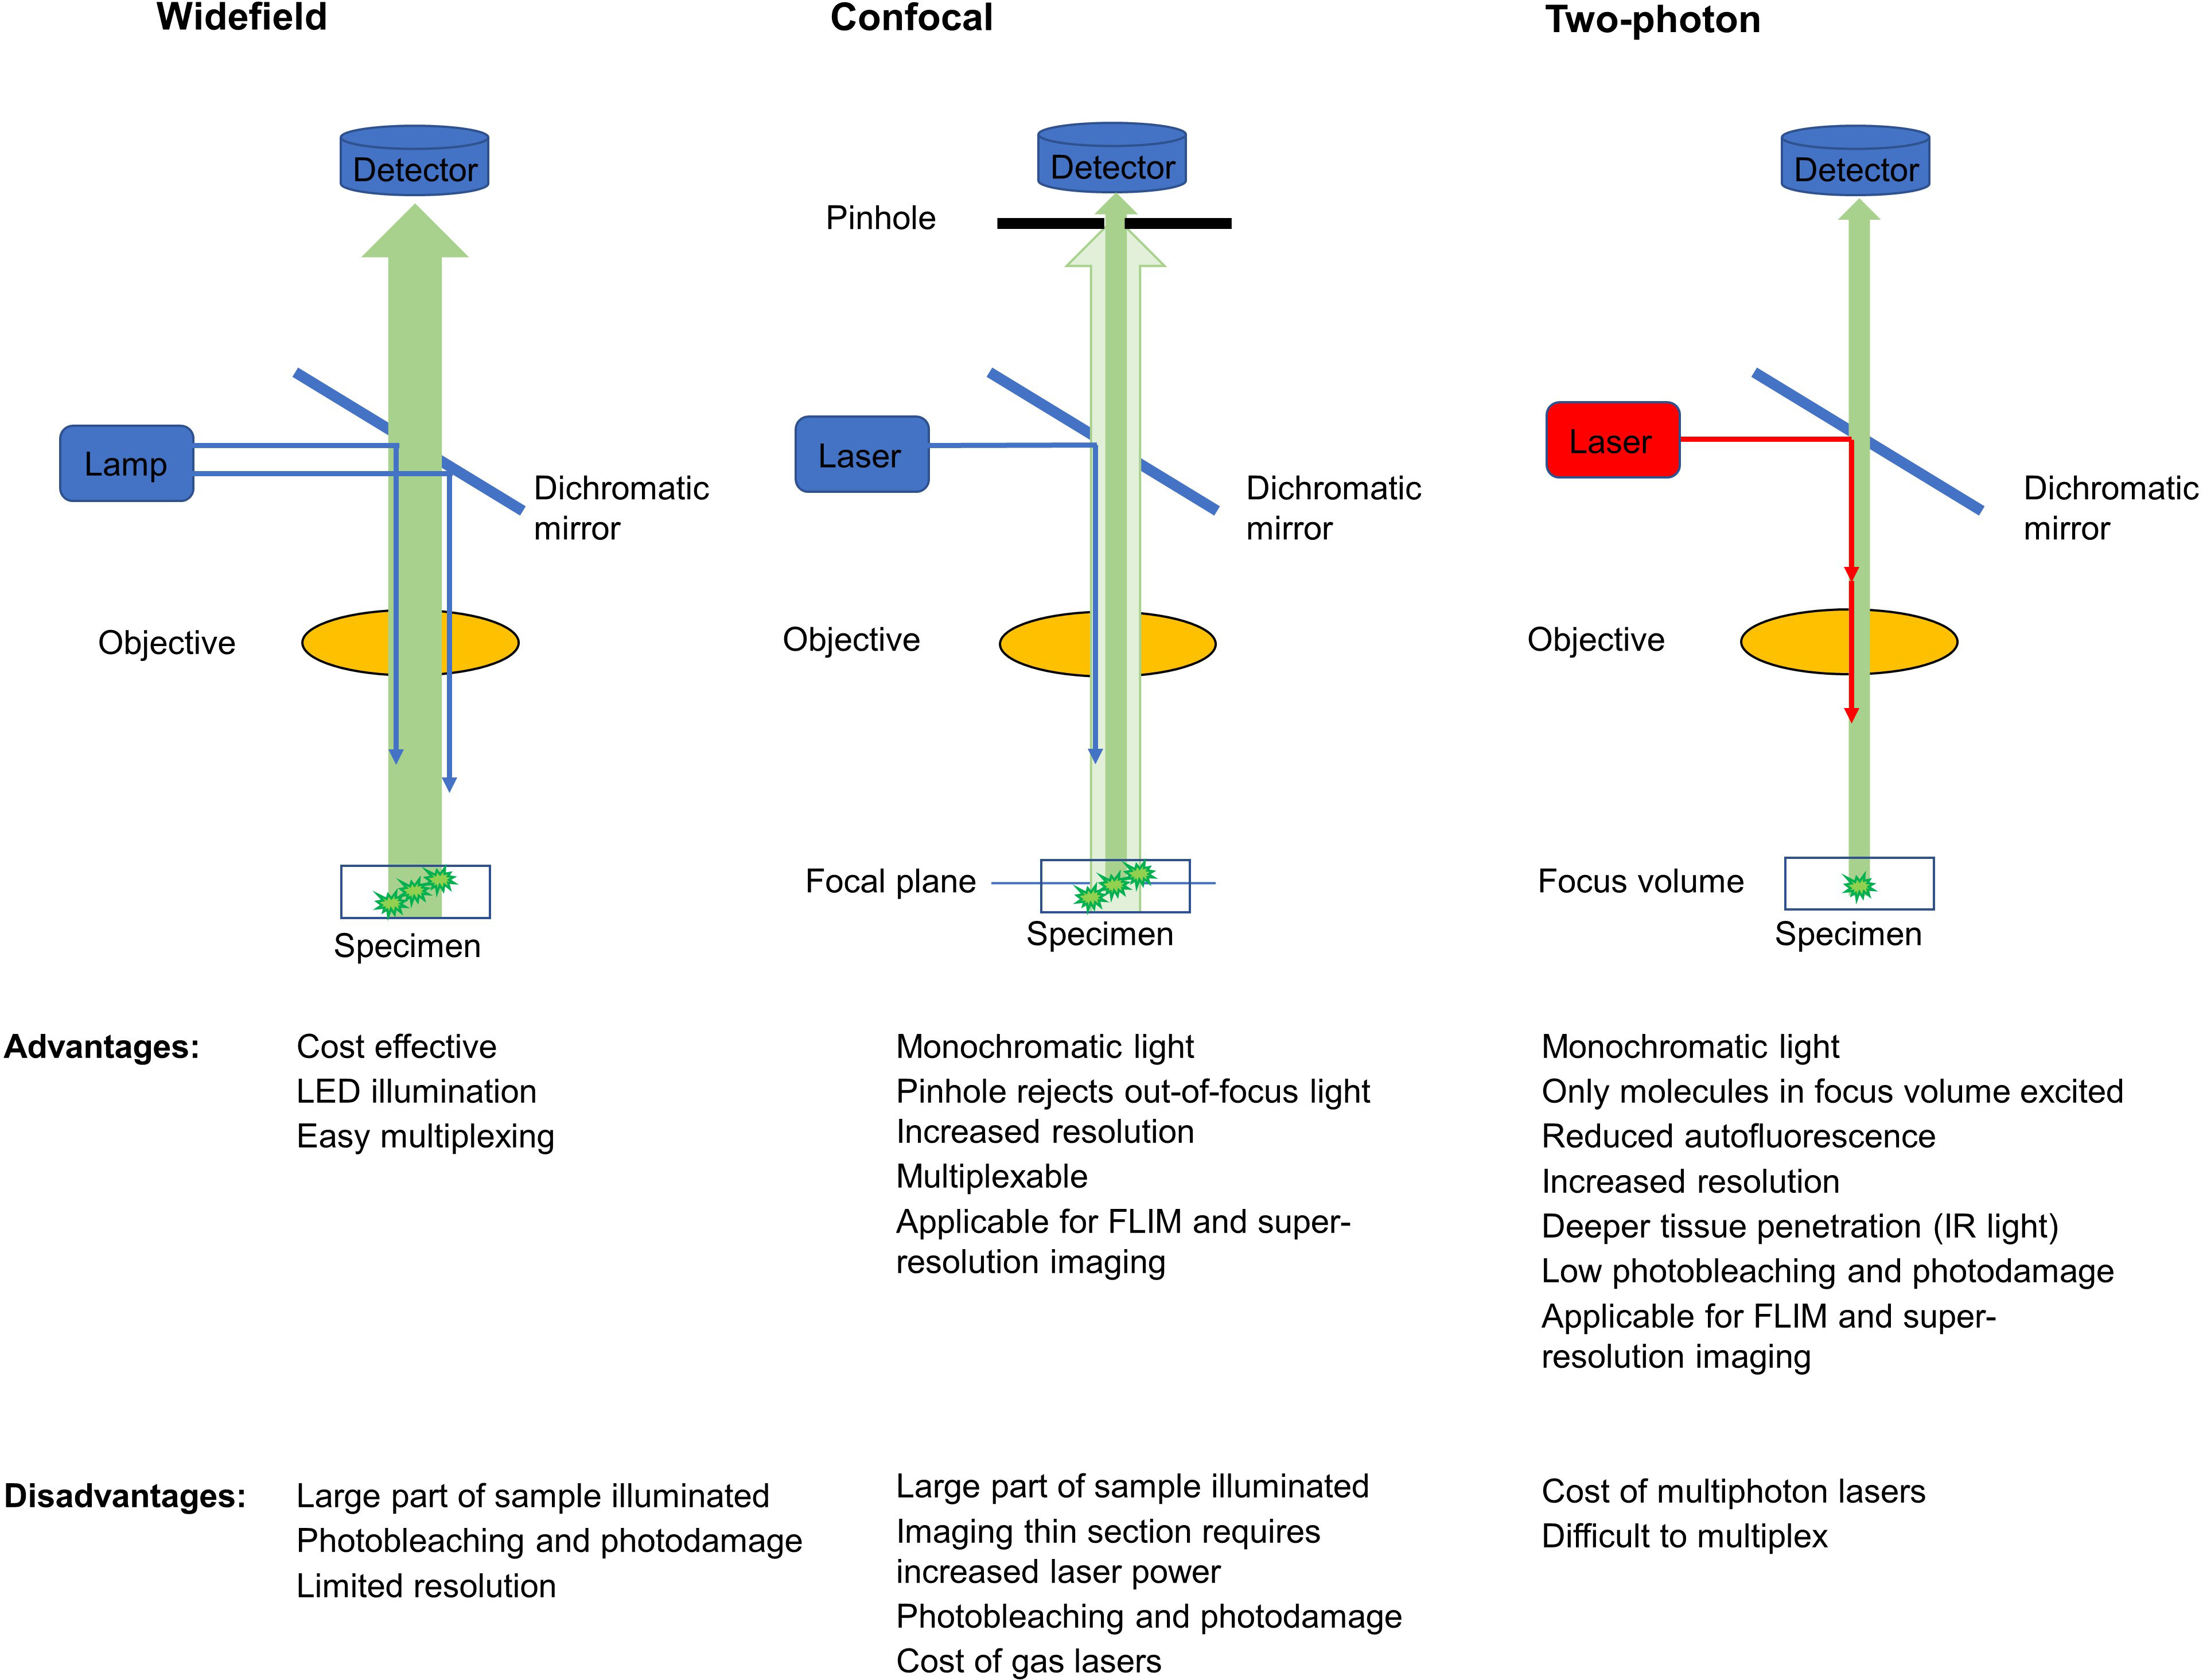
Figure 2 Comparison of signal detection methods in widefield, confocal and multiphoton microscopy (simplified schematics). Blue arrows show incoming single photon light and red show infrared multiphoton laser excitation. Green arrows show fluorescent light originating from the sample with darker green signal reaching the respective detectors. Excitation and emission filters are omitted.
2.2 Confocal microscopy
Laser-scanning confocal microscopy (LSM), use lasers (recently, the most used are diode lasers) to generate bright and monochromatic light. Both in widefield and LSM the energy of a single photon is utilized to excite endogenous or exogenous fluorophores in specimens ranging from 10 to 50 µm of thickness. Recently, it has been possible to reach about 200 µm depth during 3D imaging. Similar to widefield microscopy, incoming light illuminates a large volume of the specimen which is a disadvantage of the technique. However, in confocal microscopy a variable aperture called pinhole positioned in front of the detector rejects the out-of-focus light coming from below or above the focal plane. The smaller the pinhole, the less emitted light collected and the thinner the slice from which the fluorescent signal is collected. The correct choice of the pinhole size allows to decrease the background signal and to increase the signal-to-noise ratio. However, pinhole size must be carefully selected based on the objective used and signal intensity. Closing the pinhole too much decreases the specific signal and imaging requires higher laser power to excite the fluorophores which can eventually lead to photobleaching. To increase contrast and resolution, it is advisable to take z-stacks of the sample that are later processed by image deconvolution. The main advantages of confocal microscopy compared to epifluorescence widefield microscopy are the increased signal-to-noise ratio, higher resolution, and the capability of selecting a specific focal plane of the specimen to be imaged.
Widefield and LSM evolved over the years from microscopes used to image one or few specimens to newer high content imaging systems. High content imaging allows the simultaneous screening of mitochondrial metabolism in a large number of samples using 96 well-plates or 384 well-plates. This approach is very useful for screening chemical libraries or to identify pathway inhibitors/activators among other uses. The goal in these studies is to analyze signals at the cellular or subcellular level for which resolution of 20x-40x objectives are usually suitable (38). Metabolic parameters are usually expressed as relative fluorescence intensity per cell with or without deconvolution after background subtraction. Cell number is determined after segmentation using non-fluorescent cell counting (brightfield techniques), nuclei labeling with a fluorescent live nuclear dye like Hoechst, or by fluorescent plasma membrane staining (e.g., CellTracker Green) (38). Quantitative results can also be expressed normalizing fluorescence intensity per total mitochondrial mass, as described below.
Overall, single-photon fluorescence is extensively used to measure fluorescent dyes and sensors to determine mitochondrial membrane potential, ATP and ROS production among others. However, imaging NAD(P)H and FAD autofluorescence that are sensitive to photobleaching requires a gentler approach (see below and Table 1).
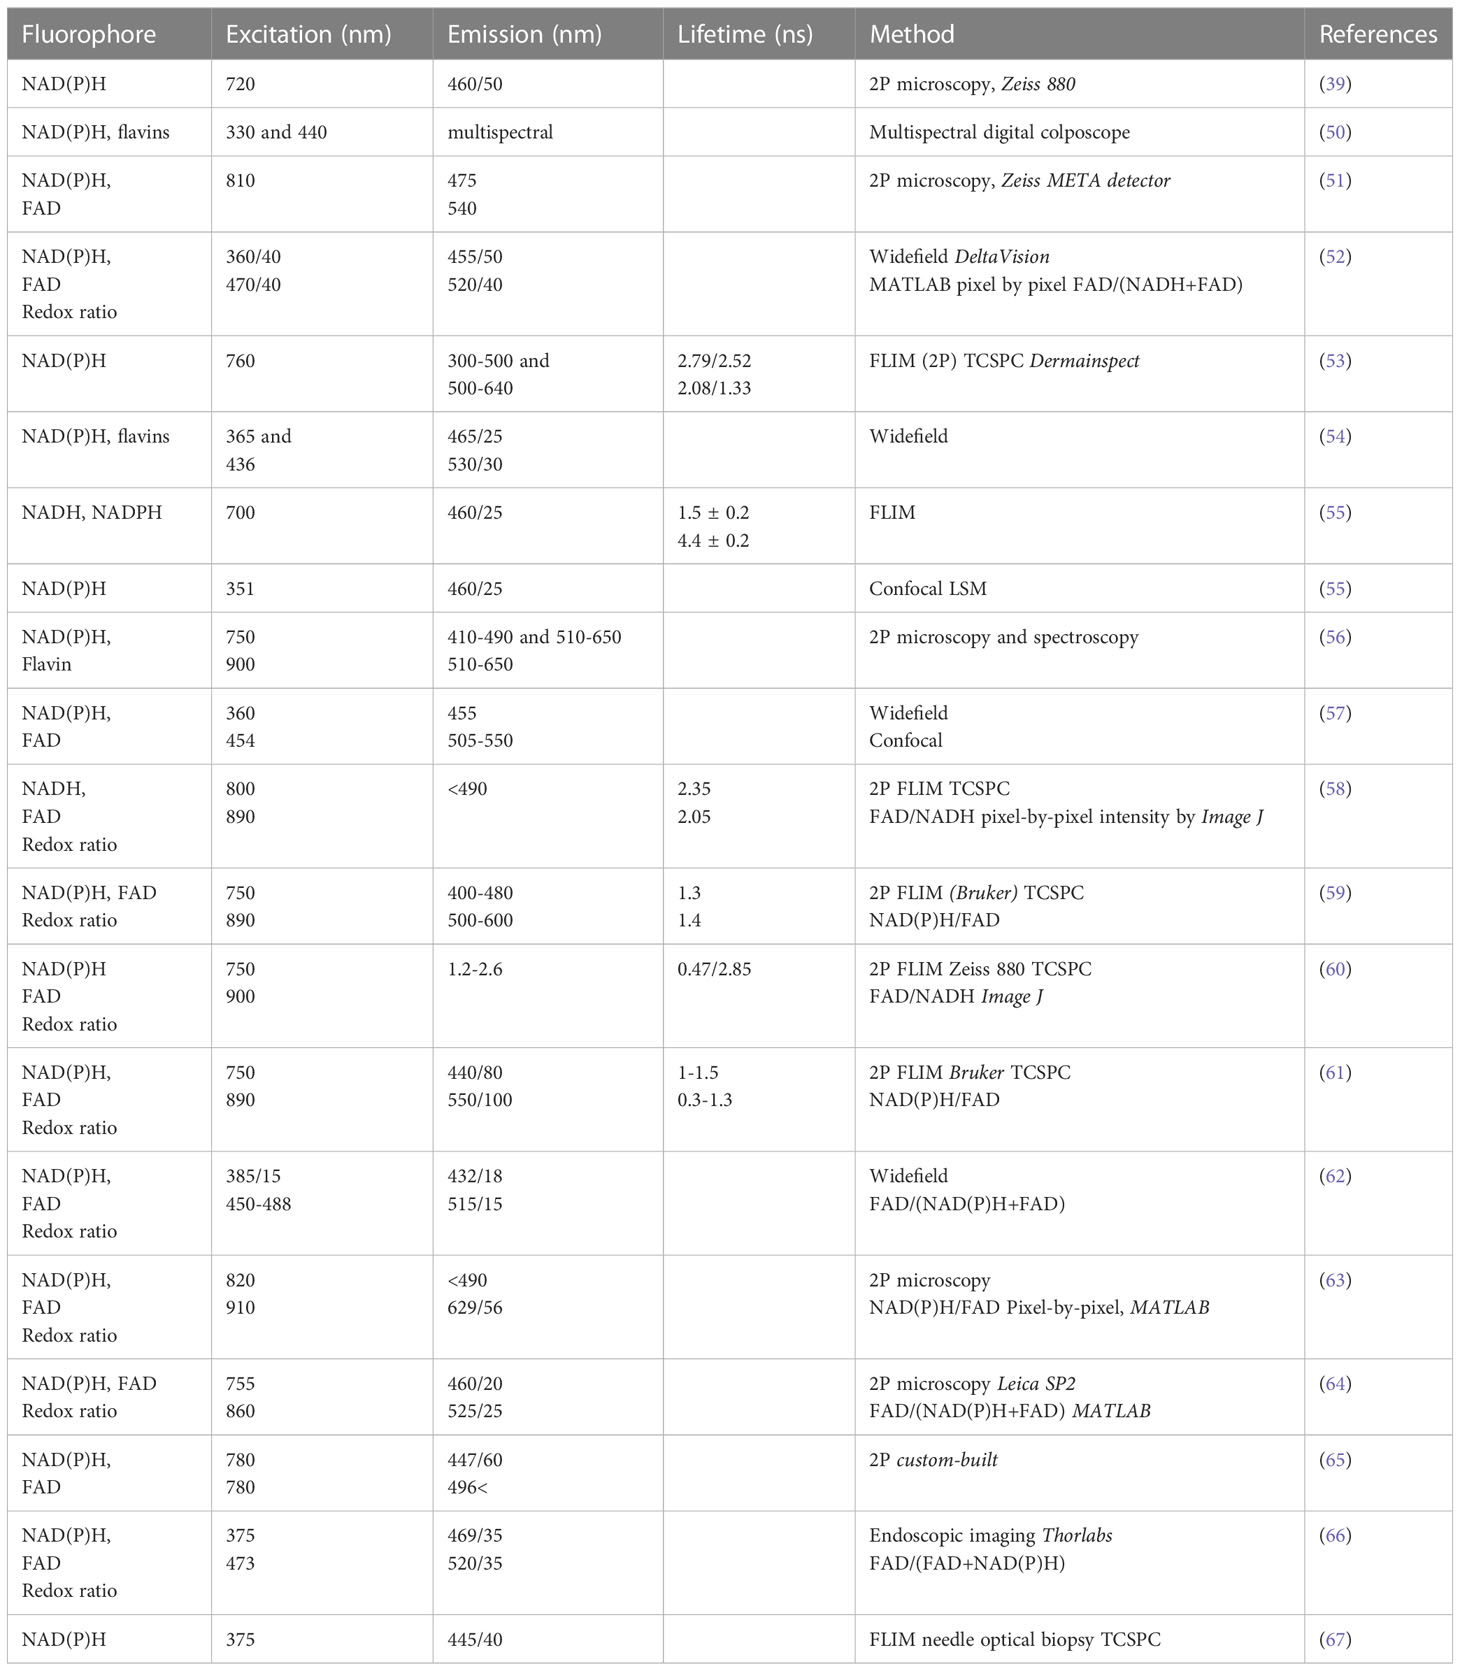
Table 1 Imaging conditions for autofluorescent molecules.
2.3 Multiphoton excitation microscopy
In multiphoton microscopy, endogenous or exogenous fluorophores are excited by two (or three) photons (68). In two-photon microscopy, pulsed lasers are usually employed where in high photon flux molecules absorb two photons of twice the wavelength of one-photon excitation (i.e., half the photon energy) simultaneously (68). Pulsed excitation in two-photon (infrared) microscopy allows the fluorophores to “relax” between pulses and therefore reduces potential photo-induced stress or damage (e.g., ROS production) as compared with one-photon UV illumination, which may trigger cytotoxicity (69, 70). Since two photons needed to be absorbed simultaneously by the fluorophore, only molecules localized in the single focal point of the laser will be excited (Figure 2.). Because fluorescence is only generated in the focal point, the emitted light can be then collected without the need of a pinhole aperture (68, 71).
While the disadvantage of multiphoton systems compared to single photon systems is the higher costs, the main advantages are: a) Reduced autofluorescence because less light is absorbed by cells and tissues; b) Reduced light scattering; c) Reduced photodamage; and d) Deeper tissue penetration by infrared (IR) light. Since this technique shifts stimulation of endogenous NAD(P)H fluorescence from the UV wavelength (~340-360 nm) to IR (~720-800 nm), less DNA damage occurs in the nucleus and mitochondria (72). Because of these advantages multiphoton microscopy is a better approach to image endogenous fluorescence of NAD(P)H and FAD compared with single-photon microscopy.
2.4 Fluorescence lifetime imaging microscopy
Fluorescence-lifetime is the time a molecule spends on average in the first excited electronic state before returning to the ground electronic state. The fluorescence-lifetime decay of the fluorophore population in the sample can be spatially recorded as an image and used to discriminate between target molecules. The advantage of FLIM is that it is usually not affected by the concentration of the fluorophore and by photobleaching (73). FLIM is also used to image Förster resonance energy transfer (FRET), a process in which the emission spectrum of the so-called “donor” fluorophore overlaps with the excitation spectrum of the “acceptor” fluorophore. If these fluorophores are in close proximity, during stimulation of the donor molecule, (λExDonor) energy transfer occurs to the acceptor molecule with concomitant decrease in the donor’s emitted fluorescence (λEmDonor) and increase in the acceptor’s emitted fluorescence (λEmAcceptor)). Intermolecular FRET is used to study protein-protein interactions (74), whereas intramolecular FRET is widely used in fluorescent probes to follow changes in the conformation of biosensors upon binding of the molecule of interest. FRET-based sensors are utilized for example for real- time measurement of mitochondrial and cytosolic ATP levels, both important determinants of mitochondrial activity and cellular energy production (75, 76) (see 3.4. for details). The disadvantage of FLIM is that the special microscopes and complex image analysis makes this technology more expensive and difficult to handle compared to regular confocal microscopes (77). In addition, FLIM imaging is slower than regular confocal microscopy. Nonetheless, FLIM is being increasingly used to image free and protein bound forms of NAD(P)H or FAD and to calculate redox state in live cells (for references see Table 1).
There is currently a high interest in establishing if there is a relationship between cancer heterogeneity, cancer progression and NAD(P)H/FAD signal intensity, and to validate these autofluorescent metabolites as cancer metabolic biomarkers (53). Since FLIM can allow us to better identify molecules and interaction with other molecules than traditional confocal techniques, this imaging modality can provide valuable additional data in the hand of expert users.
3 Applications of imaging to the study of cancer metabolism
3.1 Endogenous fluorophores and natural biomarkers
Fluorescence imaging depends on the stimulation of a fluorogenic signal by light. Naturally occurring fluorescent (autofluorescent) molecules in cells and tissues can be imaged without the addition of engineered fluorescent probes or dyes. These include the structural proteins collagen and elastin; amino acids with aromatic rings like tryptophan, tyrosine and phenylalanine; and the pigments melanin, keratin, and lipofuscin (78–80). Most importantly, metabolic co-factors like nicotinamide adenine dinucleotide (NADH) and flavins are utilized in autofluorescence imaging to study cellular redox state (Table 1).
Previously, autofluorescence was regarded as nothing more than a background signal (81). The fluorescence signal originating from reduced pyridine nucleotide was discovered by Warburg (82) and its cellular presence was investigated using near UV spectrofluorometry by Duysens (83). Seminal studies on localization of blue autofluorescence to mitochondria was conducted by Chance and Baltscheffsky (84). An exciting publication of Chance in 1962 described the emission spectra and energy state of cells and mitochondria, and also the first fluorescence microscopy recordings of redox state and mitochondrial autofluorescence in cells (85). In the same work, the author also speculated how fluorescence microscopy could be used to study “dynamics of metabolism within the cell”.
3.1.1 NAD+/NADH
Nicotinamide adenine dinucleotide (NAD+) and its reduced form NADH, are made up of an adenine nucleobase and nicotinamide connected through phosphate groups. They are co-factors of numerous enzymes, mostly dehydrogenases or reductases. The primary role of NADH is to deliver electrons from one reaction to another. The concentration of NADH is highest in the mitochondria, compared to the cytosolic content and NADH concentrations in other organelles (86, 87). Glycolytic NADH is “transported” into the mitochondria through the malate-aspartate shuttle to reduce mitochondrial NAD+ to NADH. However, most of the mitochondrial NADH originates from beta oxidation of fatty acids and pyruvate by enzymes of the Krebs cycle in the mitochondrial matrix. Mitochondrial NADH is oxidized by Complex I (NADH:ubiquinone oxireductase) of the respiratory chain (Figure 1) for which NADH is the main electron donor.
Intracellular free NAD+/NADH ratio is an important readout of cellular metabolism. The balance between NAD+ and NADH regulates several enzymes including glyceraldehyde 3-phosphate dehydrogenase involved in glycolysis and the pyruvate dehydrogenase complex, which converts pyruvate to acetyl-CoA in the mitochondrial matrix. Recently, an NADH-binding pocket in voltage dependent anion channels (VDAC) has been proposed as a target to develop small molecules to regulate mitochondrial metabolism (39). NAD+ also participates in post-translational modification of proteins through ADP-ribosylation reaction (88) and protein deacetylation via sirtuins (89, 90). In addition to experimental techniques, computational models were also developed to study the role of cytosolic NADH/NAD+ ratio on the mitochondrial NADH/NAD+ ratio in various disease states, including ischemia reperfusion and in cancer (91).
Spectroscopy analysis shows that both NAD+ and NADH have peak absorptions at 260 nm UV light. NADH has a second absorbance peak at ~340 nm which allows a ratiometric spectroscopic comparison of the oxidized and reduced forms (NAD+/NADH). NADH also fluoresces if excited at ~340 nm with maximal emission detected at ~440-465 nm depending on the solution and/or cell type utilized (54) and Figure 3. Interestingly, protein-bound NADH has blue-shifted emission spectra and higher fluorescence quantum yield than unbound NADH (92). This effect is caused by the unfolding of NADH after binding to proteins that prevents the adenine to quench the fluorescence of the nicotinamide ring. Accordingly, the fluorescence of NADH is lost when it is oxidized to NAD+ on complex I, allowing to follow the fate of the molecule and measure activity of complex I.
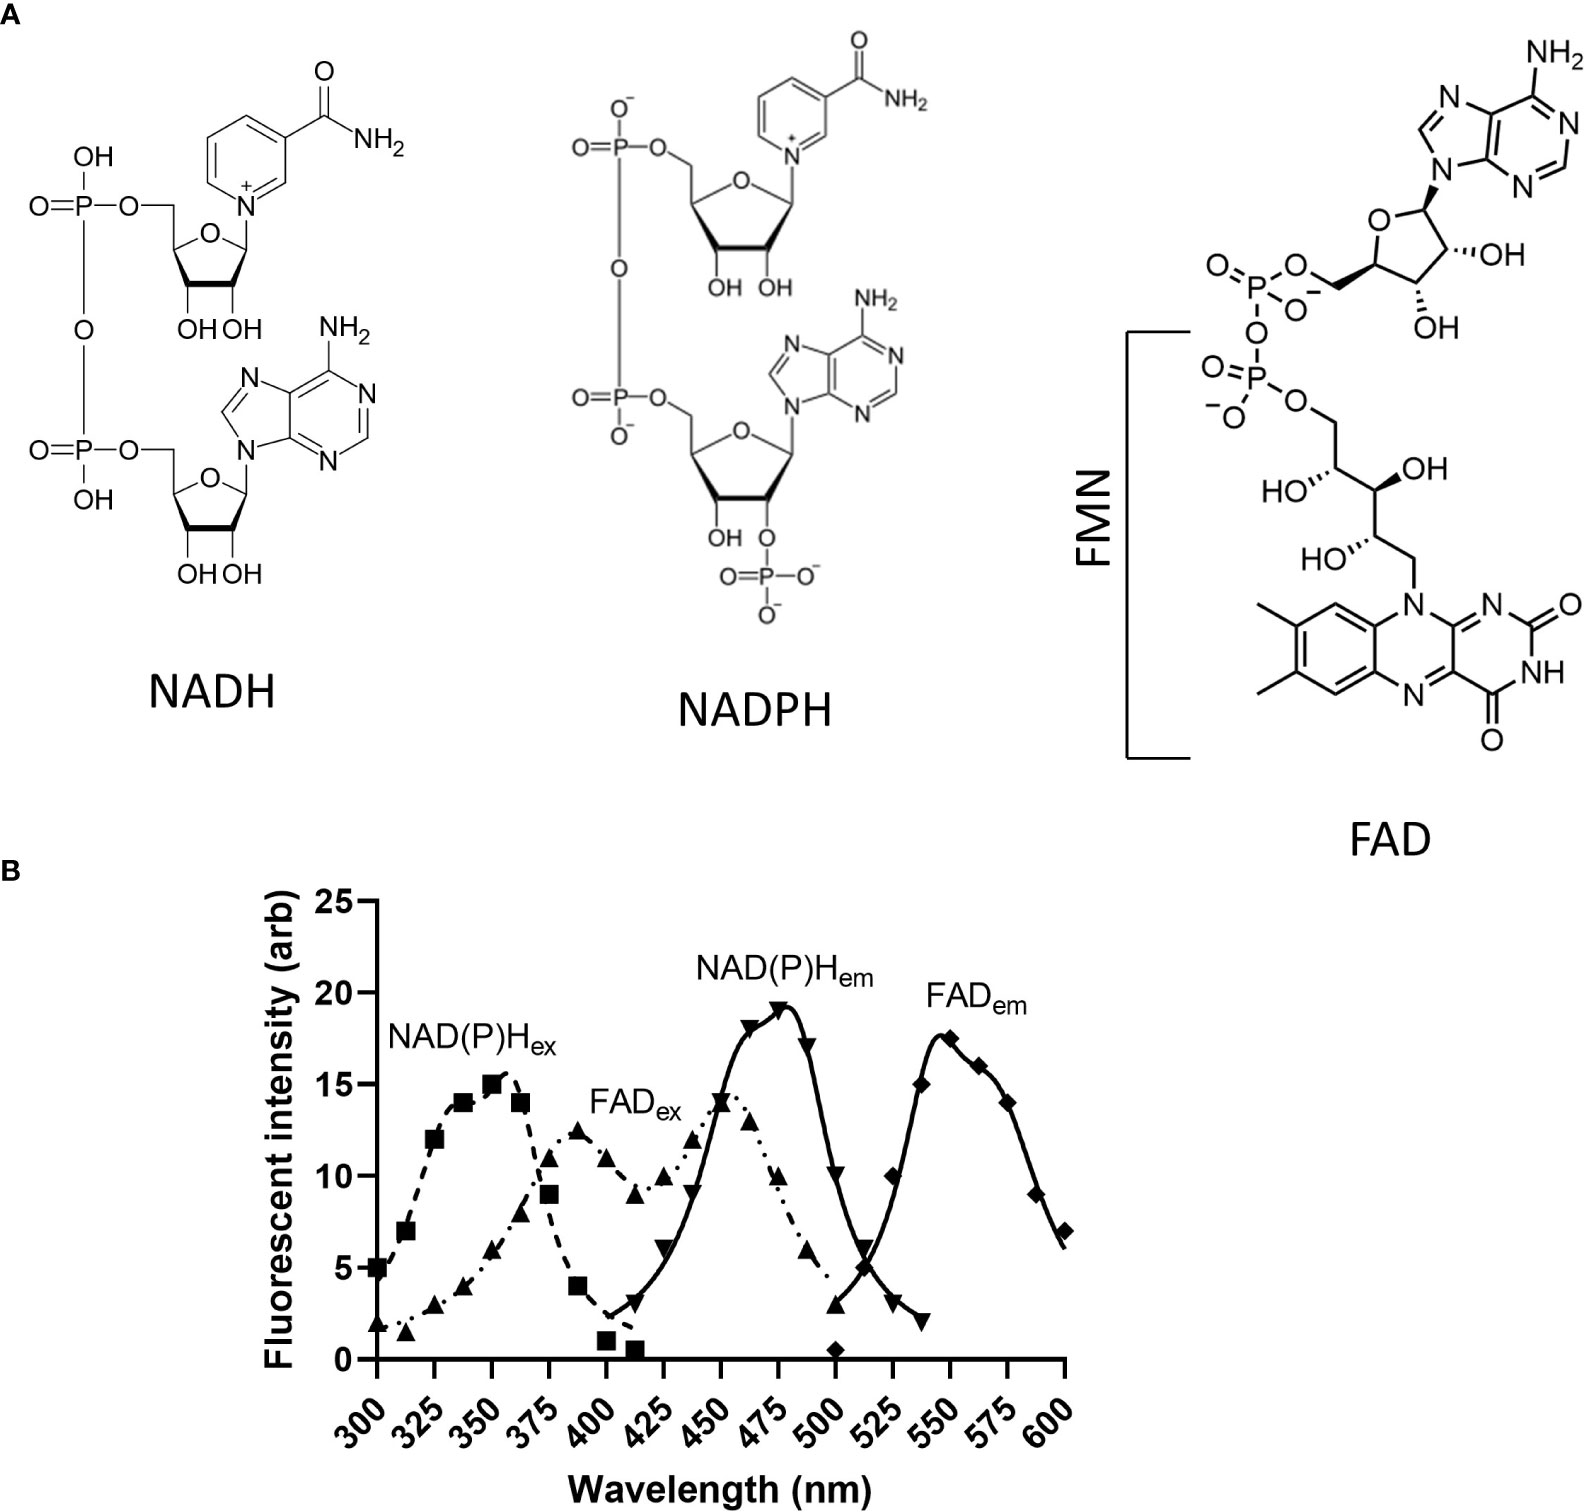
Figure 3 Structure and excitation/emission spectra of endogenous fluorophores discussed in this review. (A) Structures of NADH, NADPH, FMN and FAD; (B) NAD(P)Hex and FADex show excitation spectra of NAD(P)H and FAD, and NADP(H)em and FADem depict emission spectra of NAD(P)H and FAD, respectively. NAD(P)H, Nicotinamide adenine dinucleotide (phosphate); FMN, Flavin mononucleotide; FAD, Flavin dinucleotide.
To determine if autofluorescence originates from mitochondria, fluorescent non-potentiometric dyes (see below) are useful tools to label the mitochondrial network. Thus, NADH autofluorescence assessed by multiphoton microscopy can be imaged in parallel with single photon or multiphoton microscopy (Figure 4) to excite mitochondrial-targeted dyes. Subsequent colocalization analysis can determine if the autofluorescent signal originates in mitochondria. Another important consideration when imaging NADH autofluorescence is the use of positive and negative controls. Uncouplers like CCCP that create a futile cycle of oxidation in the respiratory chain together with oligomycin that inhibits the ATP synthase and Oxphos, results in an exhaustion of mitochondrial NADH with barely minimal production of ATP. By contrast, inhibition of the ETC leads to an accumulation of NADH. Specific inhibitors of complexes I and II lead to increased mitochondrial NADH. However, rotenone which is the most commonly used complex I inhibitor also disrupts microtubules (93–95). Microtubule destabilization creates an artifact that could influence NADH production by mechanisms unrelated to the inhibition of the ETC. We prefer to use the complex III inhibitor myxothiazol that prevent the flow of electrons to complex IV and maximizes the accumulation of NADH coming from the Krebs cycle (96) (Figure 1).
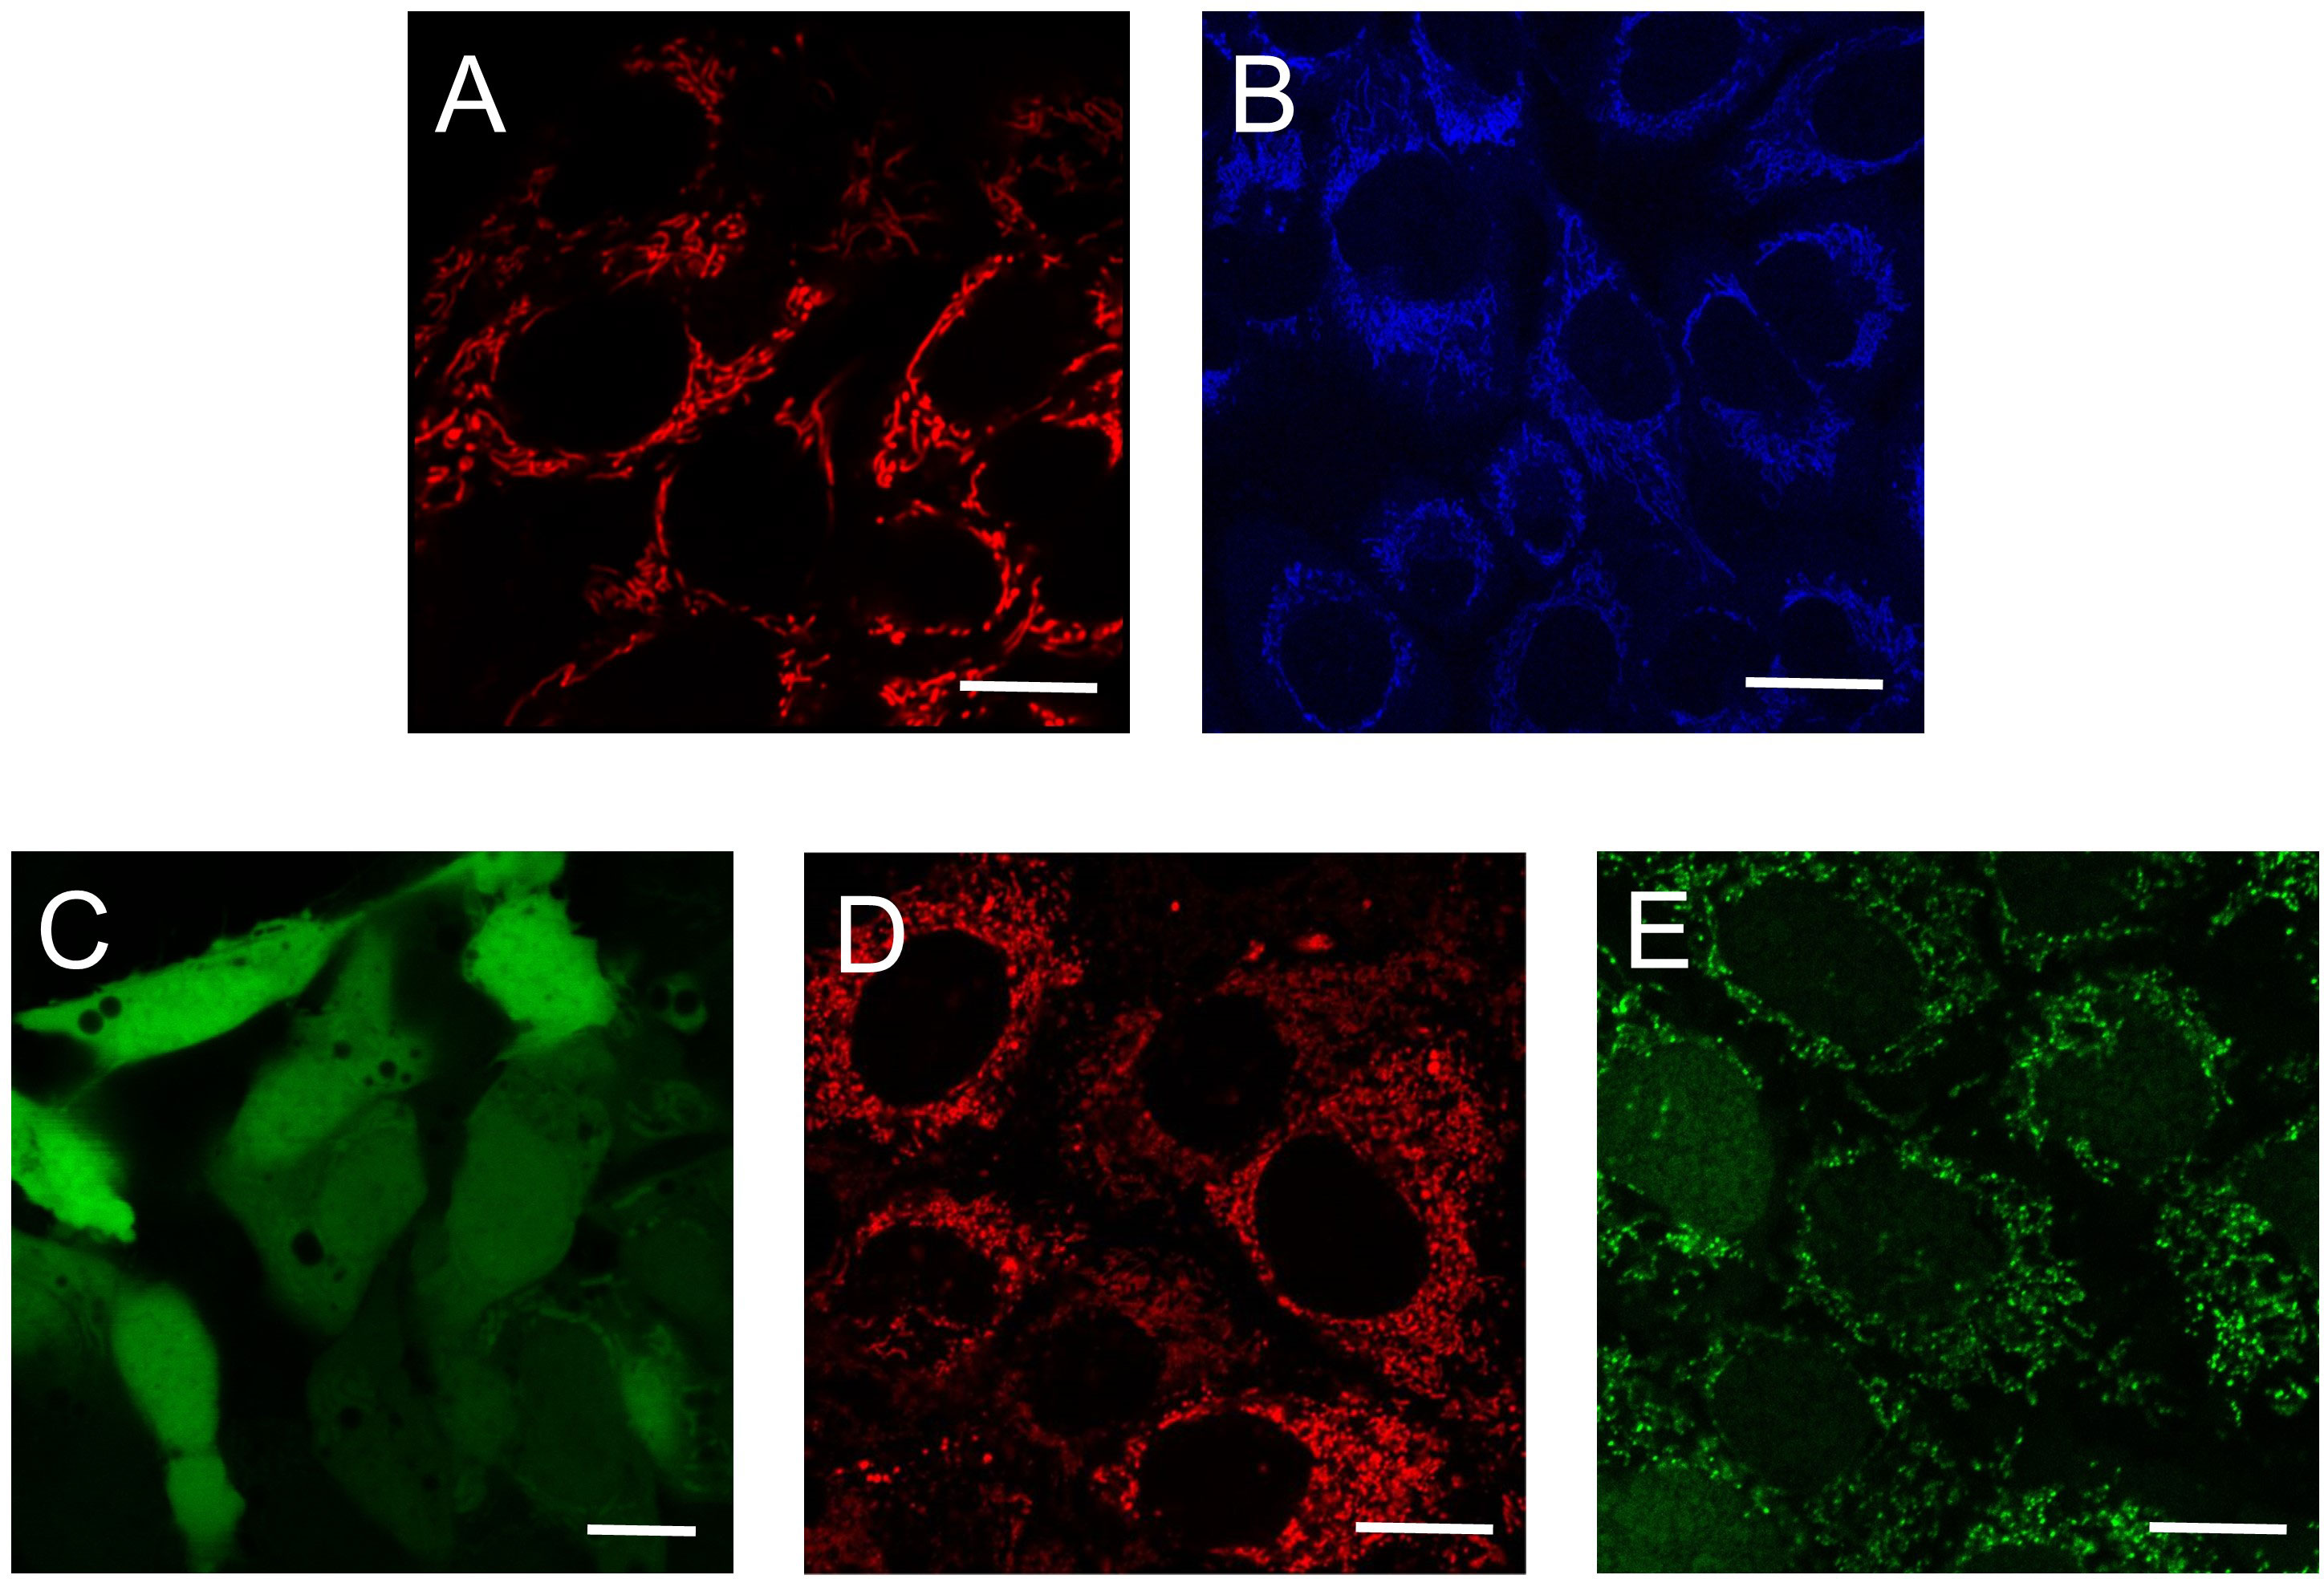
Figure 4 Use of autofluorescence and fluorescence dyes to determine mitochondrial metabolic activity. Single (A, C, D, E) and multiphoton confocal images (B) of human hepatocarcinoma cells. (A) TMRM-loaded mitochondria assess mitochondrial membrane potential; (B) Mitochondrial NADH autofluorescence; (C) CM-H2DCFDA fluorescence indicate cellular ROS; (D) MitoSox Red fluorescence is an indicator of mitochondrial superoxide; (E) CellRox Green fluorescence correlates with ROS formation. Scale bars: 10 μm. TMRM: tetramethylrhodamine methyl ester; CM-H2DCFDA: carboxymethyl 2’,7’-dichlorodihydrofluorescein diacetate.
3.1.2 NADP+/NADPH
Like NADH, reduced NADH phosphate (NADPH) is an electron carrier participating in cellular metabolism. In the cytosol, NADP is synthesized de novo from NAD+ by the cytosolic nicotinamide adenine dinucleotide kinase (cNADK) (97) and in the mitochondria by the mitochondrial NADK. NADP+ is reduced to NADPH in the pentose phosphate pathway, in the folate-mediated one carbon metabolism, by isocitrate dehydrogenase 1 and malic enzyme 1 in the cytosol. Mitochondrial NADPH is generated primarily from NADP and NADH by the nicotinamide nucleotide transhydrogenase (NNT) located in the inner mitochondrial membrane, and to less extent, by the citrate - α-ketoglutarate shuttle which reduces NADP to NADPH during the conversion of isocitrate to α-ketoglutarate and in the one-carbon and glutamate metabolism, and by malic enzyme 2/3. NADPH plays important roles in anabolic processes including fatty acid, amino acid and nucleotide synthesis (98). Importantly, NADPH serves as cofactor for the enzymes glutathione and thioredoxin reductase to maintain the glutathione peroxidase and the peroxiredoxin antioxidant system in the mitochondria. Maintenance of reduced glutathione levels (GSH) is essential to protect cells from aging and cell death induced by oxidative stress (99, 100). Further, in certain cancer cells, NADPH can promote generation of the oncometabolite D-2 hydroxyglutarate that favors cell survival (101). NADPH, therefore, is critical for proliferating cells. Interference of NADPH-dependent mechanisms is considered an important therapeutic target (102, 103).
An interesting bioinformatics analysis found that there are 352 enzymes in the liver (“hepatic NAD(P)ome”) which produce, consume NAD(P)H or depend on them as co-factors (104). There is increasing evidence showing that alteration in the concentration and subcellular distribution of NAD(P)H affects disease development and progression in aging, diabetes, Alzheimer’s disease and cancer. Although modulation of the biosynthesis of NAD(P) may seem a promising therapeutic area, the role of NAD(P) in various diseases still is not well characterized (105).
Since the absorption and emission spectra of NADH and NADPH are almost the same due to the nicotinamide moieties, it is appropriate to refer to the ~350 nm-excited autofluorescence as NAD(P)H (Figure 3). There is evidence that in mouse brain the level of mitochondrial NADPH autofluorescence is only 20% of NADH autofluorescence, and in some cases it appears insignificant compared to NADH fluorescence as confirmed by spectroscopy analysis (106). To distinguish between the contribution of the individual molecular species (NADH versus NADPH) to autofluorescence in cells of the cochlea, fluorescence lifetime imaging (FLIM) technique (see below) has been recently utilized (55, 107). As this method is not widely available, distinguishing between NADPH and NADH by autofluorescence imaging approaches is not practical. Commercially available colorimetric assays and HPLC (106) can be used to confirm NADH/NADPH ratio although these techniques lack the spatiotemporal resolution of the autofluorescence that allows the study of intracellular distribution of NADH and NADPH.
3.1.3 NADH and NADPH biosensors
Genetically encoded NAD/NADH biosensors to quantitatively measure mitochondrial metabolic function are being developed to overcome the technical limitations to distinguish between NADH and NADPH autofluorescence (108–111). Biosensors reported are based on circularly permuted fluorescent proteins (cpFPs) fused to the NADH-binding domains of the bacterial Rex protein. Detection mode, dynamic changes, Kd, pH sensitivity, emission and excitation wavelengths, brightness and type (intensiometric or ratiometric) of the biosensors Frex, FrexH, Peredox-mCherry, RexYFP, C3L194K and SoNar have been extensively reviewed (Table 1 in (112)). Biosensors RexYFP, C3L194K and FREX have already been validated for mitochondrial application with dynamic changes of 50%, 300% and 800%, respectively (112). The utilization of the mitochondrial-targeted Frex sensor have allowed to measure cytoplasmic and mitochondrial free NADH levels (120 nM versus 30 μM) confirming data obtained from measuring intrinsic autofluorescence (87). The newest sensor, SoNar used in a high-throughput metabolic screening assay of anti-tumor compounds was able to determine that cytosolic NAD+/NADH ratio was between 100 and 900 in different cells. SoNar was also utilized for in vivo imaging of tumor xenograft in mice (113, 114).
NADP(H) biosensors recently developed include the Förster/fluorescent resonance energy transfer (FRET)- based Apollo-NADP+ (115). These sensors rely on the homodimerization of glucose-6-phosphate dehydrogenase in the presence of high levels of NADP+. Maintenance or depletion of cytoplasmic NADPH is an important tool to assess fitness of the cellular redox system during oxidative stress. Decreased NADPH level precedes the accumulation of hydrogen peroxide (H2O2), measured by the H2O2 sensor HyPer (115). Another group refurbished the NAD(H) sensor SoNar described above to the NADPH selective iNap to measure in vivo concentration of NADPH in HeLa cells and in a zebrafish wounding assay (116). Investigators showed similar NADPH levels in the cytosol as in the nucleus. Using the mitochondrial matrix-targeted iNap1 versus the cytosol targeted iNap3 sensor, mitochondrial NADPH level was ~37 μM compared to ~ 3 μM in the cytosol (116). Concomitant measurement of NADH and NADPH together with thiol and H2O2 sensor was also performed to image redox state in single cells opening an exciting possibility for high content multiparametric studies (117).
3.1.4 Flavins and the redox ratio
Flavins are cofactors containing a tricyclic isoalloxazine ring that serve as a catalytic site. Mammalian cells use vitamin B2 (riboflavin) from food as a precursor to produce two important enzyme cofactors: flavin mononucleotide (FMN) and flavin adenine dinucleotide (FAD). Fully reduced (FMNH2, FADH2), fully oxidized (FMN, FAD), and an intermediate semiquinone state (FMNH-, FADH-) flavins accept or donate electrons in numerous redox reactions. Reduced flavins are nonfluorescent whereas fully oxidized flavins have absorption maxima at 370 and 440 nm with peak fluorescence at 520-530 nm (54) and Figure 3. Flavin autofluorescence is significantly quenched by binding to proteins. In certain cell types it is estimated that lipoamide dehydrogenase (LipDH) -bound FAD contributes up to 50% of the total flavoprotein-derived autofluorescence (117). Other flavoproteins in the mitochondria include NADH dehydrogenase in Complex I of the electron transport chain which contains FMN. This flavin is reduced when the mitochondrial electron carrier NADH is oxidized to NAD+. Other FAD-containing ubiquinone-reducing enzymes which feed electrons into the ETC include succinate dehydrogenase in Complex II, the electron transport flavoprotein-ubiquinone oxidoreductase (ETF dehydrogenase) and mitochondrial glycerol-3-phosphate dehydrogenase (118–120). Flavoproteins in the electron transport chain may contribute up to 25% of cellular autofluorescence (120).
The pool of mitochondrial NAD+/NADH influences the redox state of the flavin cofactors in LipDH and in the ETC-linked enzymes. Since only oxidized flavins (FMN, FAD) and reduced NADH are autofluorescent and they respond oppositely to changes in mitochondrial metabolic states, the ratio is also called “metabolic ratio”, which is an important indicator of cellular metabolism. A semantic issue should be considered when comparing publications because the same ratio is expressed differently, as NADH/FAD, FAD/NADH or as normalized optical redox ration of [FAD]/[FAD]+[NADH] or Fp/(NADH+Fp) (see reference examples below).
There is an increasing interest in label-free metabolic imaging including FAD. A PubMed search using “FAD autofluorescence imaging” yielded 2-4 publications per year between 2002 and 2006. However, this number increased to 32 in 2021. These metabolic parameters have been validated in vitro, for metabolic activity ex vivo, for in vivo experiments and also for non-invasive diagnostics studying metabolic activity of normal, precancerous and tumor cells (56–58).
NADH/FAD ratio can be used to distinguish between proliferating, quiescent or apoptotic cells by correlating the metabolic state with cell cycle status and cell proliferation. This approach could be particularly useful to study cancer heterogeneity, to differentiate cancer versus non-cancerous cell in situ and to evaluate the response to chemotherapy (59). Several recent publications have reported the use of combined imaging modalities to assess the NADH/FAD ratio. A detailed protocol to image NAD(P)H by epifluorescence microscopy and FAD by single photon confocal microscopy in live cells and tissue slices has been described (57). Multiphoton microscopy combined with FLIM was used to measure NADH and FAD lifetime (protein bound versus free) and the redox ratio to monitor metabolic changes during carcinogenesis in vivo in a model of oral cancer (58). A similar technique was used to correlate redox ratio (FAD/NAD(P)H) and ROS level with apoptosis using a FRET-based sensor of caspase-3 activity, mKate2-DEVD-iRFP in colorectal cancer cells (60). Multiphoton FLIM of autofluorescence was performed on patient-derived neuroendocrine cancer organoids and 2D cultures to follow treatment response. Optical metabolic imaging identified high cancer heterogeneity and confirmed that treatment response correlated with the redox ratio (61). Widefield (epifluorescence) imaging of optical redox ratio was used as a readout in a study that investigated the effect of combinational therapy on triple negative breast cancer cells (HCC1806 and MDA-MB-231). The decreased NADH and increased normalized optical redox ratio Fp/Fp+NADH after treatment correlated with cell growth inhibition indicating that optical redox imaging can be used as a biomarker of treatment efficiency (62). Label-free metabolic intravital imaging was used recently to study the redox ratio (in this publication NAD(P)H/FAD) in a triple-negative breast cancer model. It was shown that the ratio increased with tumor growth and decreased with anti-cancer treatment after anti-CD47 immunotherapy. The same technique was used to assess the metabolic activity of immune cells in the tumor environment (63).
Based on the advantages and disadvantages described in 2.3., 2.4. and above the authors recommend two-photon microscopy and FLIM for imaging NAD(P)H and FAD autofluorescence and the redox ratio (see also Table 1 for details on excitation/emission wavelengths).
3.2 Mitochondrial membrane potential
Fluorescent dyes to determine ΔΨm, which is a relevant readout of mitochondrial function, also allow to visualize mitochondrial morphology and the mitochondrial network. Fluorescent dyes used to measure ΔΨm are lipophilic, cationic compounds that cross the mitochondrial outer and inner membranes and accumulate in the matrix based on its negative charge (121). ΔΨm results from a balance between the proton motive force, the mitochondrial pH gradient, and the proton leak from the intermembrane space to the matrix (Figure 1). Thus, increases or decreases in ΔΨm are good indicators of a functional integration between the activity of the ETC, the coupling of respiration to ATP synthesis and the proton leak. It is also a relevant parameter to measure together with production of ROS since the ETC is the main source of cellular ROS.
Maintenance of ΔΨm is a critical and highly dynamic process essential for mitochondrial function and cellular homeostasis (40, 122–125). ΔΨm is regulated at multiple levels, from the entry of respiratory substrates into the organelle, to the regulation of multiple transporters in the inner mitochondrial membrane or the modulation of the ETC and ATP synthase activities. Opening of the voltage dependent anion channel (VDAC) in the outer mitochondrial membrane, increased cytosolic Ca2+ or inhibition of the ATP synthase cause mitochondrial hyperpolarization (38, 39, 126) (127). VDAC closing by free tubulin that limit substrates entry into mitochondria of cancer cells or increased activity of uncoupling proteins are examples of decreased ΔΨm. Robust mitochondrial depolarization usually indicates mitochondrial dysfunction. Prolonged mitochondrial dysfunction eventually leads to cytochrome C release and cell death (128). Measurement of ΔΨm has been used as a readout to assess the effects of experimental drugs targeting mitochondria that induce metabolic stress through ROS production and to kill cancer cells (38, 127, 129).
A detailed review focused on discussing that potentiometric dyes can measure charge gradient ΔΨm between the intermembrane space and the mitochondrial matrix but not the proton motive force (130), also highlights many technical challenges. The amount of cationic dye accumulating in mitochondria is mostly determined by the negative voltage of the mitochondrial matrix. Because potentiometric dyes behave in a Nernstian fashion and plasma membrane potential (ΔΨp) is also negative, the accumulation of cationic dyes in mitochondria is influenced by both membrane potentials. Parallel measurements of ΔΨm and ΔΨp should be performed to determine if changes in the fluorescence of cationic dyes are caused by actual changes in ΔΨm and not to changes in ΔΨp (131–134).
An important factor to consider when analyzing ΔΨm is the intercellular and intracellular heterogeneity of ΔΨm. This phenomenon has been described in cancer cells using qualitative or semi-quantitatively methods (123, 130, 135, 136). However, a quantitative analysis of mitochondrial heterogeneity has only recently been published (22). Although it is a long-term known phenomenon, the molecular mechanisms underlying the differences in physiological and pathophysiological conditions remain undetermined. The high variability of ΔΨm poses a challenge for the metabolic characterization and should be taken into account in particular for the identification and analysis of cell subpopulations that are, very likely, metabolically heterogeneous. This should be considered not only for intratumoral differences but also between tumors of the same type, between primary and metastatic tumors and also for the same tumor at different times. Moreover, metabolically distinct cell populations are present even in cancer cell lines with the same genetic background. Thus, heterogeneity of ΔΨm should be included in the context of tumor heterogeneity and considered a factor to analyze when interpreting changes induced for genetic modifications or anticancer therapies that directly target or influence mitochondrial metabolism (22).
Because of the above-described considerations, it is of high importance to standardize dye loading concentration, loading time, temperature and utilize comparable methods to quantitatively analyze ΔΨm (22, 132, 137). While proper loading time is relatively easily to establish and loading temperature is mostly the temperature used for cell culture (for example 37 °C and 39 °C for human and mouse cells and cell lines, respectively), additional fine-tuning is needed to establish proper loading concentration of the fluorescent dyes to avoid mitochondrial toxicity, non-specific binding to other cellular structures, photodamage and dye aggregate artifacts.
3.2.1 Fluorophores commonly used to determine mitochondrial membrane potential
Available mitochondrial membrane potentiometric dyes for fluorescent imaging include tetramethyl rhodamine methyl ester (TMRM, Figure 3) and ethyl ester (TMRE), Rhodamine 123 (Rho123), and the ratiometric dye 5,5′,6,6′-tetrachloro-1,1′,3,3′-tetraethylbenzimidazolyl-carbocyanine iodide (JC-1) (Table 2). TMRM is the most widely utilized. At low concentration (0.5 - 30 nM) or non-quenching mode for most cells, TMRM does not affect mitochondrial respiration (147) and easily loads various cell types. TMRM exhibits low photo-bleaching and can be imaged by confocal microscopy. For detecting rapid changes in ΔΨm, rhodamine 123 can be used at high, quenching concentration (130). A couple of excellent recent reviews discuss features and recommended utilization (including concentrations) of these dyes in cell culture (130, 132). Other mitochondrial dyes include MitoTracker probes that contain a thiol-reactive chloro-methyl group. These probes diffuse passively across membranes and accumulate in mitochondria. Some of the probes are selective to changes in ΔΨm like MitoTracker Red CMXRos but this dye is mostly utilized to image mitochondrial morphology (138, 139) rather than measure ΔΨm (148).
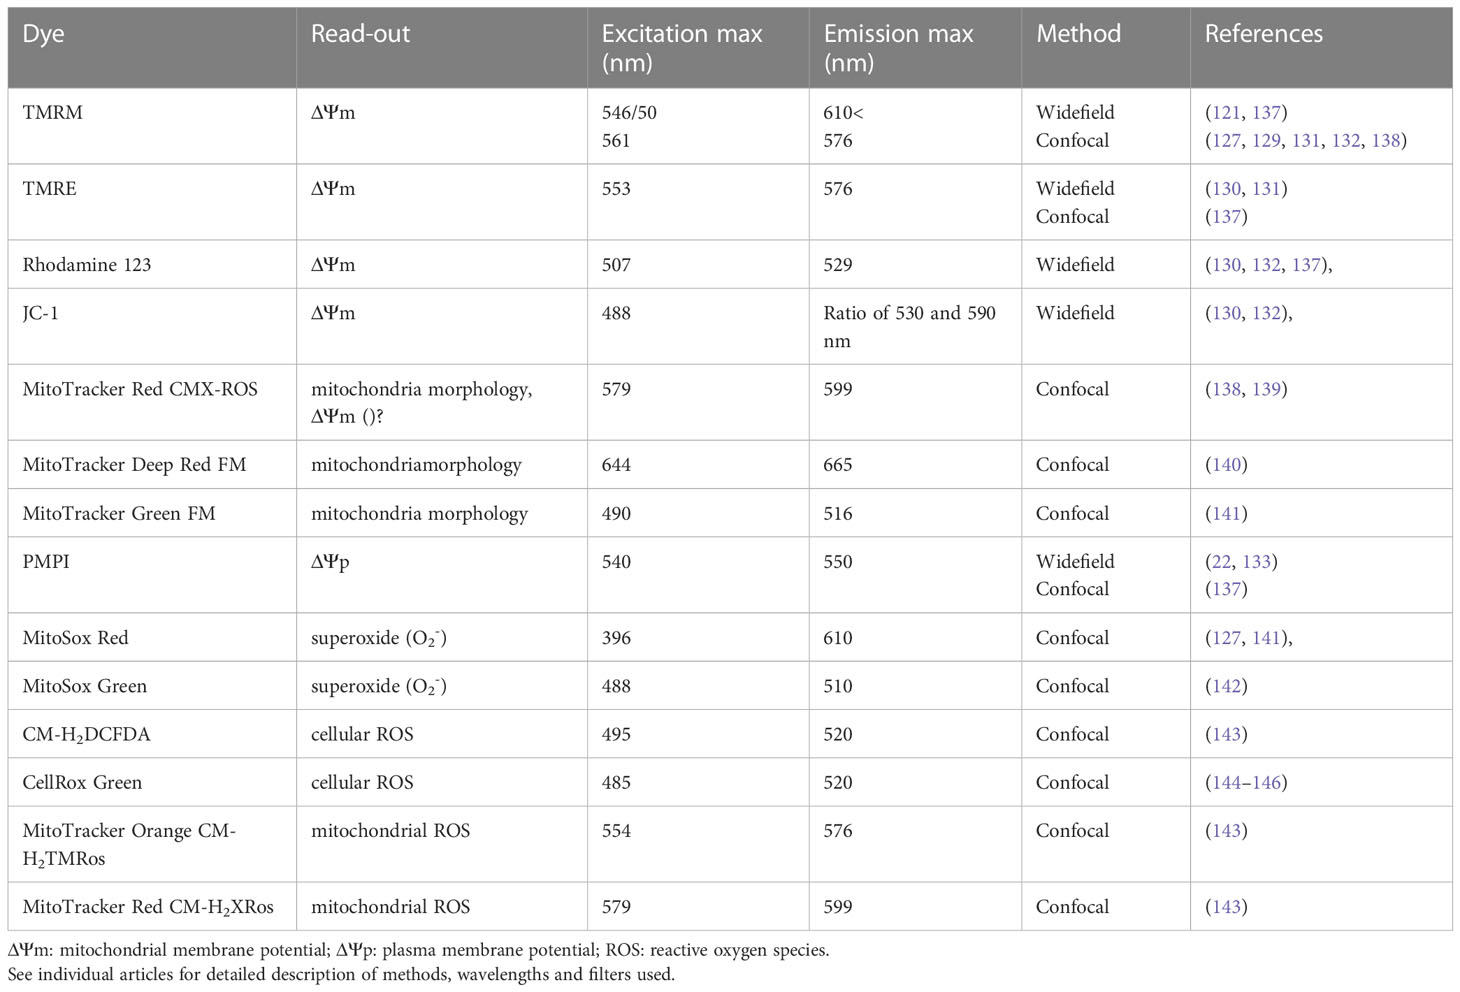
Table 2 Single photon excitation and emission wavelengths for fluorescent dyes to determine mitochondrial membrane potential, plasma membrane potential and reactive oxygen species.
3.2.2 Advantages of imaging mitochondrial membrane potential compared to flow cytometry and plate reader assays
ΔΨm can be determined not only by fluorescent microscopy but also by flow cytometry and plate reader assays. As mentioned above, loading potentiometric dyes into live cells requires optimization and careful consideration of loading conditions. Fluorescence microscopes with environmental control chambers (37 °C, 5% CO2 – or special buffered medium) are well suited for this task. However, even brief temperature changes (from an incubator to room temperature) during measurements can contribute to artifactual changes in ΔΨm. Therefore, although they are widely used, plate readers lacking environmental control or flow cytometry protocols when cells need to be stored on ice before measurement (149), do not provide an accurate measurement of ΔΨm. In addition, the surface to volume ratio (S/V) significantly influences dye loading. Trypsinization of attached cells to resuspend before measurement significantly changes their cellular structure and metabolic activity (for a recent review see (150)). Among the potentiometric dyes, JC-1 is one of the most commonly used for flow cytometry. JC-1 is a ratiometric dye that forms monomers or aggregates with different emission spectra (Table 2). Because aggregation is concentration-dependent and therefore, loading time dependent, any change in loading can lead to changes in intramitochondrial dye concentration making measurements inaccurate. JC-1 requires long loading times (~1.5 h). It has been shown that this dye is more suitable for detecting large changes if ΔΨm collapses (“yes/no” experiments) rather than more subtle modulations of ΔΨm. The carbocyanine DiOC6(3) is another ΔΨm indicator widely used in flow cytometry studies. The dye can only be employed at very low concentrations (<1 nm) due to its respiratory toxicity (151) and proved to be less reliable than JC-1 (152). Another important observation is that depending on the fluorescent dye and concentration, non-mitochondrial cellular structures can be labelled. This greatly influences data interpretation. Therefore, it would be useful to validate specific dye loading concentrations in fluorescence microscopy before flow cytometry and plate reader assays are performed.
In addition to the forementioned influence of uncontrolled temperature, flow cytometry and plate reader assays do not allow to study mitochondrial heterogeneity or to follow changes in mitochondrial metabolism over time. For example, this is a critical parameter to evaluate changes of mitochondrial metabolism induced to different drugs during drug development, to determine treatment efficiency and eventually to find mechanisms that cancer cells use to develop resistance to chemotherapy (136). Further, spatiotemporal distribution of signals cannot be studied due to lack of resolution. Due to the “yes/no” response of the dyes and cellular heterogeneity, fluorescence microscopy is more suited for quantitative analysis of drug responses.
3.2.3 Newest developments: dyes with aggregation-induced emission and near infrared emission
Several dyes recently developed are not yet commercially available. The latest among them are dyes with aggregation-induced emission. In 2021, several new ΔΨm indicator dyes that do not accumulate in the mitochondria based on ΔΨm and do not require dye in the extracellular medium to image reversible ΔΨm dynamics, have been reported. SPIRIT RhoVR 1 is a mitochondrial targeted acetoxylmethyl ester originating from the Rhodamine Voltage Reporter, that freely penetrates into mitochondria (153). Once esterases remove the acetoxylmethyl group, it is trapped in the matrix, incorporates into the inner membrane, and serves as a reversible ΔΨm reporter. TPE-NT ([1-methyl-2-(4-(1,2,2-triphenylvinyl)styryl)-β-naphthothiazol-1-ium trifluorome-thanesulfonate), is a cationic fluorescence probe that accumulates in the mitochondrial inner membrane and its fluorescence is aggregation-induced (154). The dye loaded into LoVo human colon cancer cells was imaged by confocal microscopy using a 405 nm laser and emission at 625-725 nm (near infrared) which makes it easy to multiplex with other dyes. Interestingly, the dye’s response to CCCP seemed somewhat slow. Some of the aggregation induced dyes move out of mitochondria towards other organelles (lysosomes) after ΔΨm drops, and back to mitochondria again when ΔΨm increases again (154). This capability could potentially allow time-resolved quantitative imaging of ΔΨm but would make multiparametric imaging difficult. The development of new dyes underscores the importance of studying ΔΨm in vivo.
Since there are several fluorescent probes that were designed and characterized for single photon application, for imaging ΔΨm in live cells the authors recommend the use of widefield and confocal microscopy.
3.3 Reactive oxygen species
Reactive oxygen species are metabolic by-products implicated in cell signaling in physiological and pathological conditions (143, 155, 156). All mammalian cells have antioxidant systems to prevent excessive accumulation of ROS that cause oxidative stress leading to disruption of the cellular homeostasis and, eventually, to cell death.
Mitochondrial complexes I and III are the major cellular source of reactive oxygen species. Complex II also produces ROS in both forward and reverse electron flow (157, 158). Superoxide anion (O2-) is generated during oxidative phosphorylation when leaky electrons partially reduce molecular oxygen. Superoxide is dismutated to hydrogen peroxide (H2O2) in mitochondria by superoxide dismutase 2. H2O2 then diffuses to the cytosol or is reduced to water by the thioredoxin-dependent peroxyredoxin system and the glutathione-dependent glutathion peroxidase in the mitochondria (159). In the cytosol, several enzymes also produce H2O2, including NAD(P)H oxidase (NOX) and cyclooxygenase (COX). Elegant studies from Martin Brand that have identified the contribution of specific mitochondrial sites to ROS production (160), also showed that the mitochondrial site of H2O2 production depends on which type of respiratory substrates are available (143, 161, 162).
3.3.1 Fluorophores commonly used to determine mitochondrial ROS
There are fluorescent probes available to image both O2- and H2O2 in live cells and mitochondria (143). CellRox Green dye binds to DNA after being oxidized by ROS and therefore shows mostly mitochondrial localization (144, 145, 163) (Figure 3). Mitochondrial O2- can be imaged using MitoSox Red (Figure 3) which is a derivative of hydroethidine, or MitoSox Green mitochondrial superoxide indicator. Although these dyes specifically accumulate in the mitochondria, at high concentrations they also accumulate in the nucleus (146, 164). Thus, MitoSox dyes should be titrated for each cell type. Also, because the accumulation of MitoSox dyes in mitochondria is membrane potential driven, MitoSox fluorescence should be measured together with ΔΨm indicators as additional controls (142).
For imaging H2O2 in living cells, one of the most widely used fluorescent probe is carboxymethyl 2’,7’-dichlorodihydrofluorescein diacetate (CM-H2DCFDA) (Figure 3). This probe is not mitochondria specific and can detect more than one type of ROS (Molecular Probes Handbook Table 18.1). Since H2O2 diffuses from mitochondria to the cytosol and cytosolic NOX is also a significant contributor to its production, it can be challenging to show how much H2O2 originates from mitochondria. Some investigators use a co-localization approach and overlay ROS signals with membrane potential independent mitochondrial staining (MitoTracker Green FM for example) (142). MitoTracker Deep Red FM can also be used to localize mitochondria (141). To overcome this problem, inhibitors of specific sites of mitochondrial ROS production and mitochondrially targeted antioxidants have been developed. However, compounds used for this purpose should not interfere with mitochondrial function including the activity of the ETC (140, 165). Mitochondria-targeted antioxidants include Mito-Q (ubiquinone attached to a triphenylphosphonium cation) (166), MitoVit-E (vitamin E attached to a triphenylphosphonium cation) and Mito-Tempo (nitroxide conjugated to a triphenylphosphonium cation) (167). The specific proton leak suppressors S1QELs and S1QEL3s have been developed to specifically inhibit the site of production of O2-/H2O2 production (168). However, similarly to MitoSox, mitochondria targeted antioxidants have a lipophilic triphenylphosphonium cation (TPP+) as delivery conjugate and their accumulation in mitochondria also depends on ΔΨm. Currently, there is no ideal method to quantitatively determine ROS (164).
MitoTracker Orange CM-H2TMRos and MitoTracker Red CM-H2XRos are derivatives of dihydrotetramethyl rosamine and dihydro-X-rosamine, respectively, that are also utilized for measuring mitochondrial ROS in general. These dyes are not specific for O2- and accumulation in the mitochondria is ΔΨm dependent. Because of these limitations, data obtained with these dyes may be difficult to interpret (169).
3.3.2 Genetically encoded ROS sensors
In addition to the above described dyes to measure H2O2, there are genetically encoded sensors available including the various Hyper sensors (Hyper1-3, HyperRed) (170–172), Ro-gfp (173), Rogfp2-Orp1 and Grx1-Rogfp2 (117). MitoHyPer, a ratiometric sensor developed to specifically determine mitochondrial H2O2, can be utilized with its cytosolic counterpart to image cell compartment specific H2O2 distribution (174). Further, there are also mitochondrial inter- membrane space and mitochondrial matrix-targeted Hyper sensors available (175).
Similar to ΔΨm probes, fluorescent probes and sensors detecting ROS were designed and characterized for single photon application therefore, the authors recommend the use of widefield and confocal microscopy.
3.4 ATP
ATP is produced in mitochondria through oxidative phosphorylation and in the cytosol by glycolysis. Imaging ATP using light microscopy is quite challenging. If properly excited with a wavelength of ~259 nm, the emission maxima of ~370 nm is easily masked by autofluorescent tryptophan-containing proteins. Therefore, imaging endogenous ATP or ADP/ATP ratio is not feasible in living cells without the help of sensors.
3.4.1 Genetically encoded ATP sensors and dyes
Genetically targeted luciferase-based probes have been used successfully to measure ATP in live cells and whole animals (176–178). The disadvantage of these probes is that substrate addition is needed during experiments. For fluorescent imaging several sensors have been developed. FRET-based sensors are mostly used for microplate assays (179–181), but there are FRET-based sensor, including ATeam measure ATP levels in the mitochondrial matrix (75). The rhodamine-based sensor RSL+ has been used to measure mitochondrial ATP in fibroblasts (182). A different technology, a mitochondria-targeted fluorescence DNA aptamer sensor was also introduced recently to measure mitochondrial ATP in live cells (183). The activity of this sensor is photo-regulated, it only fluoresces after a photo-cleavable linker is removed from the molecule (at 365 nm), and mitochondria targeting is achieved by using DQAsomes, which are highly positive charged liposome-like vesicles. This sensor has fast response time and high signal intensity. Similarly, a ratiometric (FRET-based) fluorescent DNA nanostructure was also reported for imaging of mitochondrial ATP in live cells (76). Near-infrared mitochondria-targeted ATP-binding probe (NIR-A) can provide opportunity for multiplexing and simultaneously measure several mitochondrial parameters (184).
Dyes sensing ATP/ADP ratios include Perceval (185) and PercevalHR (186)), which can be used for single and two-photon microscopy. These probes are not mitochondria targeted, therefore additional subcellular labeling is necessary to localize the signal into the mitochondria. Since some of the ATP sensors are pH sensitive, imaging media and buffers need to be tightly controlled. Also, the use of pH sensitive probes concomitantly with ATP sensors are required to validate the data obtained with ATP sensors.
The above-described fluorescent mitochondrial ATP sensors were developed and validated for single photon imaging. Further, the ADP/ATP sensing non-mitochondria specific dyes need multiplexing with mitochondria-specific dyes to confirm ROS localization which is more feasible using single photon microscopy. Therefore, the authors recommend the use of widefield and confocal microscopy for the detection of mitochondrial ATP.
4 Authors perspective and concluding remarks
Overall, there is a growing interest in imaging mitochondrial metabolism and to validate metabolic imaging as a tool to follow carcinogenesis, evaluate tumor therapy and to distinguish between cancerous and healthy tissue (64). The capability of applying these techniques to intraoperative histopathology at subcellular resolution (65) may revolutionize cancer therapy in the future (66, 67). Light microscopy in the different imaging modalities described here became an essential tool to study mitochondrial metabolism in cancer. Widefield, and single photon/multiphoton confocal microscopy have been proved extensively to be excellent and, sometimes, irreplaceable tools to study mitochondrial metabolism in live cells. The capability of determining NADH, NAD, FAD, ΔΨm, ROS and ATP in real time allows to study the progression of changes in mitochondrial metabolism under physiological, pathological or pharmacologically induced conditions. At present, any research on cancer metabolism that, directly or indirectly, may relate to modifications of mitochondrial function, should include some or all the image applications described in this review. Here, we introduced several tools, microscope modalities, use of autofluorescence, fluorescence sensors and dyes to study mitochondrial metabolism highlighting their advantages and disadvantages.
Important problems that still need to be addressed to improve metabolic imaging and probe development include specificity, toxicity, and molecular targeting. Loading of a dye or overexpression of a molecule, can disturb cellular metabolism. Therefore, it is of high relevance to develop highly specific mitochondrial dyes and sensors that can be used at low concentration. Examples of these are: a) Fluorescent dyes that could distinguish between NADH and NADPH; b) Mitochondria targeted non-potentiometric dyes that could be used to colocalize metabolic signals to the organelle. Currently this selection is very limited; c) Low toxicity potentiometric dyes which can be used for multiplexing; d) Specific, ΔΨm insensitive ROS dyes labelling only one specific ROS molecule; and e) Multiphoton probes for multiplexing metabolic imaging with autofluorescence. Another limiting factor for the use of state-of-the art microscopy techniques like multiphoton microscopy, FLIM and several super-resolution modalities are the high price and lack of technical expertise. However, studies to determine relationships between metabolic activity and mitochondrial dynamics (out of the scope of our review), assembly of molecular complexes of the respiratory chain and the ATP synthase, as well as colocalization and potential interaction of signaling molecules in mitochondria could greatly benefit of super-resolution capability.
In general, education in imaging and available technologies together with decreased pricing could increase the use of microscopy for future cancer metabolism studies and ultimately cancer diagnostics.
Author contributions
MG and EM retrieved concerned literature, wrote and edited manuscript, designed and prepared figures. Both authors contributed to the article and approved the submitted version.
Funding
This work was supported partially by funding from the Chan Zuckerberg Initiative and the Silicon Valley Community Foundation to MG (IS1R-0000000014); (NIH/NCI) R01 CA184456, South Carolina Translational Research: Pilot Project UL1 TR001450-SCTR and High-Innovation High Risk-Award (SC 2223) to EM; the MUSC Cancer Center Support Grant (P30 CA138313), the SC COBRE in Digestive and Liver Diseases (P20 GM130457), and the MUSC Digestive Disease Research Cores Center (P30 DK123704).
Conflict of interest
The authors declare that the research was conducted in the absence of any commercial or financial relationships that could be construed as a potential conflict of interest.
Publisher’s note
All claims expressed in this article are solely those of the authors and do not necessarily represent those of their affiliated organizations, or those of the publisher, the editors and the reviewers. Any product that may be evaluated in this article, or claim that may be made by its manufacturer, is not guaranteed or endorsed by the publisher.
Abbreviations
FLIM, Fluorescent lifetime imaging; FRET, Förster resonance energy transfer; LSM, laser scanning microscopy; ΔΨm, mitochondrial membrane potential; ΔΨp, plasma membrane potential; CCD camera, charged-coupled device camera.
References
1. Warburg O, Wind F, Negelein E. THE METABOLISM OF TUMORS IN THE BODY. J Gen Physiol (1927) 8(6):519–30. doi: 10.1085/jgp.8.6.519
2. Warburg O. On the origin of cancer cells. Science (1956) 123(3191):309–14. doi: 10.1126/science.123.3191.309
3. Fang D, Maldonado EN. VDAC regulation: a mitochondrial target to stop cell proliferation. Adv Cancer Res (2018) 138:41–69. doi: 10.1016/bs.acr.2018.02.002
4. Martins Pinto M, Paumard P, Bouchez C, Ransac S, Duvezin-Caubet S, Mazat JP, et al. The warburg effect and mitochondrial oxidative phosphorylation: friends or foes? Biochim Biophys Acta Bioenerg (2023) 1864(1):148931. doi: 10.1016/j.bbabio.2022.148931
5. Porporato PE, Filigheddu N, Pedro JMB, Kroemer G, Galluzzi L. Mitochondrial metabolism and cancer. Cell Res (2018) 28(3):265–80. doi: 10.1038/cr.2017.155
6. DeBerardinis RJ, Chandel NS. We need to talk about the warburg effect. Nat Metab (2020) 2(2):127–9. doi: 10.1038/s42255-020-0172-2
7. Duraj T, Garcia-Romero N, Carrion-Navarro J, Madurga R, Mendivil AO, Prat-Acin R, et al. Beyond the warburg effect: oxidative and glycolytic phenotypes coexist within the metabolic heterogeneity of glioblastoma. Cells (2021) 10(2):202. doi: 10.3390/cells10020202
8. Maldonado EN. VDAC-tubulin, an anti-warburg pro-oxidant switch. Front Oncol (2017) 7:4. doi: 10.3389/fonc.2017.00004
9. Chhabra Y, Weeraratna AT. Fibroblasts in cancer: unity in heterogeneity. Cell (2023) 186(8):1580–609. doi: 10.1016/j.cell.2023.03.016
10. Pavlides S, Whitaker-Menezes D, Castello-Cros R, Flomenberg N, Witkiewicz AK, Frank PG, et al. The reverse warburg effect: aerobic glycolysis in cancer associated fibroblasts and the tumor stroma. Cell Cycle (2009) 8(23):3984–4001. doi: 10.4161/cc.8.23.10238
11. Vincent AS, Phan TT, Mukhopadhyay A, Lim HY, Halliwell B, Wong KP. Human skin keloid fibroblasts display bioenergetics of cancer cells. J Invest Dermatol (2008) 128(3):702–9. doi: 10.1038/sj.jid.5701107
12. Marsh T, Pietras K, McAllister SS. Fibroblasts as architects of cancer pathogenesis. Biochim Biophys Acta (2013) 1832(7):1070–8. doi: 10.1016/j.bbadis.2012.10.013
13. Sorrell JM, Caplan AI. Fibroblast heterogeneity: more than skin deep. J Cell Sci (2004) 117(Pt 5):667–75. doi: 10.1242/jcs.01005
14. Tomasek JJ, Gabbiani G, Hinz B, Chaponnier C, Brown RA. Myofibroblasts and mechano-regulation of connective tissue remodelling. Nat Rev Mol Cell Biol (2002) 3(5):349–63. doi: 10.1038/nrm809
15. Fu Y, Liu S, Yin S, Niu W, Xiong W, Tan M, et al. The reverse warburg effect is likely to be an achilles' heel of cancer that can be exploited for cancer therapy. Oncotarget (2017) 8(34):57813–25. doi: 10.18632/oncotarget.18175
16. Liu Y, Sun Y, Guo Y, Shi X, Chen X, Feng W, et al. An overview: the diversified role of mitochondria in cancer metabolism. Int J Biol Sci (2023) 19(3):897–915. doi: 10.7150/ijbs.81609
17. Guppy M, Leedman P, Zu X, Russell V. Contribution by different fuels and metabolic pathways to the total ATP turnover of proliferating MCF-7 breast cancer cells. Biochem J (2002) 364(Pt 1):309–15. doi: 10.1042/bj3640309
18. Moreno-Sanchez R, Rodriguez-Enriquez S, Saavedra E, Marin-Hernandez A, Gallardo-Perez JC. The bioenergetics of cancer: is glycolysis the main ATP supplier in all tumor cells? Biofactors (2009) 35(2):209–25. doi: 10.1002/biof.31
19. Barcena-Varela M, Lujambio A. The endless sources of hepatocellular carcinoma heterogeneity. Cancers (Basel) (2021) 13(11):2621. doi: 10.3390/cancers13112621
20. Gerlinger M, Rowan AJ, Horswell S, Math M, Larkin J, Endesfelder D, et al. Intratumor heterogeneity and branched evolution revealed by multiregion sequencing. N Engl J Med (2012) 366(10):883–92. doi: 10.1056/NEJMoa1113205
21. Grasso D, Zampieri LX, Capeloa T, Van de Velde JA, Sonveaux P. Mitochondria in cancer. Cell Stress (2020) 4(6):114–46. doi: 10.15698/cst2020.06.221
22. Rovini A, Heslop K, Hunt EG, Morris ME, Fang D, Gooz M, et al. Quantitative analysis of mitochondrial membrane potential heterogeneity in unsynchronized and synchronized cancer cells. FASEB J (2021) 35(1):e21148. doi: 10.1096/fj.202001693R
23. Seth S, Li CY, Ho IL, Corti D, Loponte S, Sapio L, et al. Pre-existing functional heterogeneity of tumorigenic compartment as the origin of chemoresistance in pancreatic tumors. Cell Rep (2019) 26(6):1518–32.e9. doi: 10.1016/j.celrep.2019.01.048
24. Zhang X, Tai Z, Miao F, Huang H, Zhu Q, Bao L, et al. Metabolism heterogeneity in melanoma fuels deactivation of immunotherapy: predict before protect. Front Oncol (2022) 12:1046102. doi: 10.3389/fonc.2022.1046102
25. Rodriguez-Enriquez S, Carreno-Fuentes L, Gallardo-Perez JC, Saavedra E, Quezada H, Vega A, et al. Oxidative phosphorylation is impaired by prolonged hypoxia in breast and possibly in cervix carcinoma. Int J Biochem Cell Biol (2010) 42(10):1744–51. doi: 10.1016/j.biocel.2010.07.010
26. Hockel M, Vaupel P. Tumor hypoxia: definitions and current clinical, biologic, and molecular aspects. J Natl Cancer Inst (2001) 93(4):266–76. doi: 10.1093/jnci/93.4.266
27. McKeown SR. Defining normoxia, physoxia and hypoxia in tumours-implications for treatment response. Br J Radiol (2014) 87(1035):20130676. doi: 10.1259/bjr.20130676
28. Vaupel P, Kelleher DK, Hockel M. Oxygen status of malignant tumors: pathogenesis of hypoxia and significance for tumor therapy. Semin Oncol (2001) 28(2 Suppl 8):29–35. doi: 10.1016/S0093-7754(01)90210-6
29. Mullen AR, Wheaton WW, Jin ES, Chen PH, Sullivan LB, Cheng T, et al. Reductive carboxylation supports growth in tumour cells with defective mitochondria. Nature (2012) 481(7381):385–8. doi: 10.1038/nature10642
30. Cannino G, Ciscato F, Masgras I, Sanchez-Martin C, Rasola A. Metabolic plasticity of tumor cell mitochondria. Front Oncol (2018) 8:333. doi: 10.3389/fonc.2018.00333
31. Collins TJ, Berridge MJ, Lipp P, Bootman MD. Mitochondria are morphologically and functionally heterogeneous within cells. EMBO J (2002) 21(7):1616–27. doi: 10.1093/emboj/21.7.1616
32. Lo YC, Liu Y, Kammersgaard M, Koladiya A, Keyes TJ, Davis KL. Single-cell technologies uncover intra-tumor heterogeneity in childhood cancers. Semin Immunopathol (2023) 45(1):61–9. doi: 10.1007/s00281-022-00981-1
33. Robinson GL, Dinsdale D, Macfarlane M, Cain K. Switching from aerobic glycolysis to oxidative phosphorylation modulates the sensitivity of mantle cell lymphoma cells to TRAIL. Oncogene (2012) 31(48):4996–5006. doi: 10.1038/onc.2012.13
34. Smolkova K, Bellance N, Scandurra F, Genot E, Gnaiger E, Plecita-Hlavata L, et al. Mitochondrial bioenergetic adaptations of breast cancer cells to aglycemia and hypoxia. J Bioenerg Biomembr (2010) 42(1):55–67. doi: 10.1007/s10863-009-9267-x
35. Chung WJ, Lyons SA, Nelson GM, Hamza H, Gladson CL, Gillespie GY, et al. Inhibition of cystine uptake disrupts the growth of primary brain tumors. J Neurosci (2005) 25(31):7101–10. doi: 10.1523/JNEUROSCI.5258-04.2005
36. Clavell LA, Gelber RD, Cohen HJ, Hitchcock-Bryan S, Cassady JR, Tarbell NJ, et al. Four-agent induction and intensive asparaginase therapy for treatment of childhood acute lymphoblastic leukemia. N Engl J Med (1986) 315(11):657–63. doi: 10.1056/NEJM198609113151101
37. Sonveaux P, Vegran F, Schroeder T, Wergin MC, Verrax J, Rabbani ZN, et al. Targeting lactate-fueled respiration selectively kills hypoxic tumor cells in mice. J Clin Invest (2008) 118(12):3930–42. doi: 10.1172/JCI36843
38. DeHart DN, Lemasters JJ, Maldonado EN. Erastin-like anti-warburg agents prevent mitochondrial depolarization induced by free tubulin and decrease lactate formation in cancer cells. SLAS Discovery (2018) 23(1):23–33. doi: 10.1177/2472555217731556
39. Heslop KA, Burger P, Kappler C, Solanki AK, Gooz M, Peterson YK, et al. Small molecules targeting the NADH-binding pocket of VDAC modulate mitochondrial metabolism in hepatocarcinoma cells. BioMed Pharmacother (2022) 150:112928. doi: 10.1016/j.biopha.2022.112928
40. Heslop KA, Milesi V, Maldonado EN. VDAC modulation of cancer metabolism: advances and therapeutic challenges. Front Physiol (2021) 12:742839. doi: 10.3389/fphys.2021.742839
41. Passaniti A, Kim MS, Polster BM, Shapiro P. Targeting mitochondrial metabolism for metastatic cancer therapy. Mol Carcinog (2022) 61(9):827–38. doi: 10.1002/mc.23436
42. Rovini A, Heslop KA, Maldonado EN. Mitochondria and tumor metabolic flexibility: mechanisms and therapeutic perspectives. In: Kenakin T, editor. Comprehensive pharmacology. United States: Elsevier (2022). p. 493–510.
43. Zhang M, Lei Q, Huang X, Wang Y. Molecular mechanisms of ferroptosis and the potential therapeutic targets of ferroptosis signaling pathways for glioblastoma. Front Pharmacol (2022) 13:1071897. doi: 10.3389/fphar.2022.1071897
44. Zhao Z, Mei Y, Wang Z, He W. The effect of oxidative phosphorylation on cancer drug resistance. Cancers (Basel) (2022) 15(1):62. doi: 10.3390/cancers15010062
45. Bedi M, Ray M, Ghosh A. Active mitochondrial respiration in cancer: a target for the drug. Mol Cell Biochem (2022) 477(2):345–61. doi: 10.1007/s11010-021-04281-4
46. Georgescu SR, Tampa M, Mitran CI, Mitran MI, Caruntu C, Caruntu A, et al. Tumour microenvironment in skin carcinogenesis. Adv Exp Med Biol 2020 (1226) p:123–42. doi: 10.1007/978-3-030-36214-0_10
47. Nevarez AJ, Hao N. Quantitative cell imaging approaches to metastatic state profiling. Front Cell Dev Biol (2022) 10:1048630. doi: 10.3389/fcell.2022.1048630
48. van Ineveld RL, Collot R, Roman MB, Pagliaro A, Bessler N, Ariese HCR, et al. Multispectral confocal 3D imaging of intact healthy and tumor tissue using mLSR-3D. Nat Protoc (2022) 17(12):3028–55. doi: 10.1038/s41596-022-00739-x
49. Locke D, Hoyt CC. Companion diagnostic requirements for spatial biology using multiplex immunofluorescence and multispectral imaging. Front Mol Biosci (2023) 10:1051491. doi: 10.3389/fmolb.2023.1051491
50. Thekkek N, Richards-Kortum R. Optical imaging for cervical cancer detection: solutions for a continuing global problem. Nat Rev Cancer (2008) 8(9):725–31. doi: 10.1038/nrc2462
51. Wu S, Huang Y, Tang Q, Li Z, Horng H, Li J, et al. Quantitative evaluation of redox ratio and collagen characteristics during breast cancer chemotherapy using two-photon intrinsic imaging. BioMed Opt Express (2018) 9(3):1375–88. doi: 10.1364/BOE.9.001375
52. Jiang J, Feng M, Jacob A, Li LZ, Xu HN. Optical redox imaging differentiates triple-negative breast cancer subtypes. Adv Exp Med Biol (2021) 1269:253–8. doi: 10.1007/978-3-030-48238-1_40
53. Patalay R, Talbot C, Alexandrov Y, Munro I, Neil MA, Konig K, et al. Quantification of cellular autofluorescence of human skin using multiphoton tomography and fluorescence lifetime imaging in two spectral detection channels. BioMed Opt Express (2011) 2(12):3295–308. doi: 10.1364/BOE.2.003295
54. Monici M. Cell and tissue autofluorescence research and diagnostic applications. Biotechnol Annu Rev (2005) 11:227–56. doi: 10.1016/S1387-2656(05)11007-2
55. Blacker TS, Mann ZF, Gale JE, Ziegler M, Bain AJ, Szabadkai G, et al. Separating NADH and NADPH fluorescence in live cells and tissues using FLIM. Nat Commun (2014) 5:3936. doi: 10.1038/ncomms4936
56. Huang S, Heikal AA, Webb WW. Two-photon fluorescence spectroscopy and microscopy of NAD(P)H and flavoprotein. Biophys J (2002) 82(5):2811–25. doi: 10.1016/S0006-3495(02)75621-X
57. Bartolome F, Abramov AY. Measurement of mitochondrial NADH and FAD autofluorescence in live cells. Methods Mol Biol (2015) 1264:263–70. doi: 10.1007/978-1-4939-2257-4_23
58. Skala MC, Riching KM, Gendron-Fitzpatrick A, Eickhoff J, Eliceiri KW, White JG, et al. In vivo multiphoton microscopy of NADH and FAD redox states, fluorescence lifetimes, and cellular morphology in precancerous epithelia. Proc Natl Acad Sci U.S.A. (2007) 104(49):19494–9. doi: 10.1073/pnas.0708425104
59. Heaster TM, Walsh AJ, Zhao Y, Hiebert SW, Skala MC. Autofluorescence imaging identifies tumor cell-cycle status on a single-cell level. J Biophotonics (2018) 11(1):e201600276. doi: 10.1002/jbio.201600276
60. Shirmanova MV, Gavrina AI, Kovaleva TF, Dudenkova VV, Zelenova EE, Shcheslavskiy VI, et al. Insight into redox regulation of apoptosis in cancer cells with multiparametric live-cell microscopy. Sci Rep (2022) 12(1):4476. doi: 10.1038/s41598-022-08509-1
61. Gillette AA, Babiarz CP, VanDommelen AR, Pasch CA, Clipson L, Matkowskyj KA, et al. Autofluorescence imaging of treatment response in neuroendocrine tumor organoids. Cancers (Basel) (2021) 13(8):1873. doi: 10.3390/cancers13081873
62. Podsednik A, Jiang J, Jacob A, Li LZ, Xu HN. Optical redox imaging of treatment responses to nampt inhibition and combination therapy in triple-negative breast cancer cells. Int J Mol Sci (2021) 22(11):5563. doi: 10.3390/ijms22115563
63. Yang M, Mahanty A, Jin C, Wong ANN, Yoo JS. Label-free metabolic imaging for sensitive and robust monitoring of anti-CD47 immunotherapy response in triple-negative breast cancer. J Immunother Cancer (2022) 10(9):e005199. doi: 10.1136/jitc-2022-005199
64. Pouli D, Thieu HT, Genega EM, Baecher-Lind L, House M, Bond B, et al. Label-free, high-resolution optical metabolic imaging of human cervical precancers reveals potential for intraepithelial neoplasia diagnosis. Cell Rep Med (2020) 1(2):100017. doi: 10.1016/j.xcrm.2020.100017
65. Chen D, Nauen DW, Park HC, Li D, Yuan W, Li A, et al. Label-free imaging of human brain tissue at subcellular resolution for potential rapid intra-operative assessment of glioma surgery. Theranostics (2021) 11(15):7222–34. doi: 10.7150/thno.59244
66. Gaitan B, Inglut C, Kanniyappan U, Xu HN, Conant EF, Frankle L, et al. Development of an endoscopic auto-fluorescent sensing device to aid in the detection of breast cancer and inform photodynamic therapy. Metabolites (2022) 12(11):1097. doi: 10.3390/metabo12111097
67. Zherebtsov EA, Potapova EV, Mamoshin AV, Shupletsov VV, Kandurova KY, Dremin VV, et al. Fluorescence lifetime needle optical biopsy discriminates hepatocellular carcinoma. BioMed Opt Express (2022) 13(2):633–46. doi: 10.1364/BOE.447687
68. Denk W, Strickler JH, Webb WW. Two-photon laser scanning fluorescence microscopy. Science (1990) 248(4951):73–6. doi: 10.1126/science.2321027
69. Squirrell JM, Wokosin DL, White JG, Bavister BD. Long-term two-photon fluorescence imaging of mammalian embryos without compromising viability. Nat Biotechnol (1999) 17(8):763–7. doi: 10.1038/11698
70. Periasamy A, Skoglund P, Noakes C, Keller R. An evaluation of two-photon excitation versus confocal and digital deconvolution fluorescence microscopy imaging in xenopus morphogenesis. Microsc Res Tech (1999) 47(3):172–81. doi: 10.1002/(SICI)1097-0029(19991101)47:3<172::AID-JEMT3>3.0.CO;2-A
71. Williams RM, Piston DW, Webb WW. Two-photon molecular excitation provides intrinsic 3-dimensional resolution for laser-based microscopy and microphotochemistry. FASEB J (1994) 8(11):804–13. doi: 10.1096/fasebj.8.11.8070629
72. Youn HY, Bantseev V, Bols NC, Cullen AP, Sivak JG. In vitro assays for evaluating the ultraviolet b-induced damage in cultured human retinal pigment epithelial cells. J Photochem Photobiol B (2007) 88(1):21–8. doi: 10.1016/j.jphotobiol.2007.04.012
73. Oida T, Sako Y, Kusumi A. Fluorescence lifetime imaging microscopy (flimscopy). methodology development and application to studies of endosome fusion in single cells. Biophys J (1993) 64(3):676–85. doi: 10.1016/S0006-3495(93)81427-9
74. Elangovan M, Day RN, Periasamy A. Nanosecond fluorescence resonance energy transfer-fluorescence lifetime imaging microscopy to localize the protein interactions in a single living cell. J Microsc (2002) 205(Pt 1):3–14. doi: 10.1046/j.0022-2720.2001.00984.x
75. Yoshida T, Alfaqaan S, Sasaoka N, Imamura H. Application of FRET-based biosensor "ATeam" for visualization of ATP levels in the mitochondrial matrix of living mammalian cells. Methods Mol Biol (2017) 1567:231–43. doi: 10.1007/978-1-4939-6824-4_14
76. Luo L, Wang M, Zhou Y, Xiang D, Wang Q, Huang J, et al. Ratiometric fluorescent DNA nanostructure for mitochondrial ATP imaging in living cells based on hybridization chain reaction. Anal Chem (2021) 93(17):6715–22. doi: 10.1021/acs.analchem.1c00176
77. Tadrous PJ. Methods for imaging the structure and function of living tissues and cells: 2. fluorescence lifetime imaging. J Pathol (2000) 191(3):229–34. doi: 10.1002/1096-9896(200007)191:3<229::AID-PATH623>3.0.CO;2-B
78. Konig K, Riemann I. High-resolution multiphoton tomography of human skin with subcellular spatial resolution and picosecond time resolution. J BioMed Opt (2003) 8(3):432–9. doi: 10.1117/1.1577349
79. Laiho LH, Pelet S, Hancewicz TM, Kaplan PD, So PT. Two-photon 3-d mapping of ex vivo human skin endogenous fluorescence species based on fluorescence emission spectra. J BioMed Opt (2005) 10(2):024016. doi: 10.1117/1.1891370
80. Feeney EJ, Austin S, Chien YH, Mandel H, Schoser B, Prater S, et al. The value of muscle biopsies in pompe disease: identifying lipofuscin inclusions in juvenile- and adult-onset patients. Acta Neuropathol Commun (2014) 2:2. doi: 10.1186/2051-5960-2-2
81. Steinkamp JA, Stewart CC. Dual-laser, differential fluorescence correction method for reducing cellular background autofluorescence. Cytometry (1986) 7(6):566–74. doi: 10.1002/cyto.990070611
83. Duysens LN, Amesz J. Fluorescence spectrophotometry of reduced phosphopyridine nucleotide in intact cells in the near-ultraviolet and visible region. Biochim Biophys Acta (1957) 24(1):19–26. doi: 10.1016/0006-3002(57)90141-5
84. Chance B, Baltscheffsky H. Respiratory enzymes in oxidative phosphorylation. VII. binding of intramitochondrial reduced pyridine nucleotide. J Biol Chem (1958) 233(3):736–9. doi: 10.1016/S0021-9258(18)64738-6
85. Chance B. Kinetics of enzyme reactions within single cells. Ann N Y Acad Sci (1962) 97:431–48. doi: 10.1111/j.1749-6632.1962.tb34655.x
86. Hopp AK, Gruter P, Hottiger MO. Regulation of glucose metabolism by NAD(+) and ADP-ribosylation. Cells (2019) 8(8):890. doi: 10.3390/cells8080890
87. Mayevsky A, Rogatsky GG. Mitochondrial function in vivo evaluated by NADH fluorescence: from animal models to human studies. Am J Physiol Cell Physiol (2007) 292(2):C615–40. doi: 10.1152/ajpcell.00249.2006
88. Walker J, Pearson CK. NAD+, ADP-ribosylation and transcription in permeabilized mammalian cells. Biochem J (1981) 199(3):813–7. doi: 10.1042/bj1990813
89. Anderson KA, Madsen AS, Olsen CA, Hirschey MD. Metabolic control by sirtuins and other enzymes that sense NAD(+), NADH, or their ratio. Biochim Biophys Acta Bioenerg (2017) 1858(12):991–8. doi: 10.1016/j.bbabio.2017.09.005
90. Neugebauer RC, Sippl W, Jung M. Inhibitors of NAD+ dependent histone deacetylases (sirtuins). Curr Pharm Des (2008) 14(6):562–73. doi: 10.2174/138161208783885380
91. Zhou L, Stanley WC, Saidel GM, Yu X, Cabrera ME. Regulation of lactate production at the onset of ischaemia is independent of mitochondrial NADH/NAD+: insights from in silico studies. J Physiol (2005) 569(Pt 3):925–37. doi: 10.1113/jphysiol.2005.093146
92. Duysens LN, Kroneberg GH. The fluorescence spectrum of the complex of reduced phosphopyridine nucleotide and alcohol dehydrogenase from yeast. Biochim Biophys Acta (1957) 26(2):437–8. doi: 10.1016/0006-3002(57)90034-3
93. Neely MD, Davison CA, Aschner M, Bowman AB. From the cover: manganese and rotenone-induced oxidative stress signatures differ in iPSC-derived human dopamine neurons. Toxicol Sci (2017) 159(2):366–79. doi: 10.1093/toxsci/kfx145
94. Passmore JB, Pinho S, Gomez-Lazaro M, Schrader M. The respiratory chain inhibitor rotenone affects peroxisomal dynamics via its microtubule-destabilising activity. Histochem Cell Biol (2017) 148(3):331–41. doi: 10.1007/s00418-017-1577-1
95. Srivastava P, Panda D. Rotenone inhibits mammalian cell proliferation by inhibiting microtubule assembly through tubulin binding. FEBS J (2007) 274(18):4788–801. doi: 10.1111/j.1742-4658.2007.06004.x
96. Christie CF, Fang D, Hunt EG, Morris ME, Rovini A, Heslop KA, et al. Statin-dependent modulation of mitochondrial metabolism in cancer cells is independent of cholesterol content. FASEB J (2019) 33(7):8186–201. doi: 10.1096/fj.201802723R
97. Zhang R. MNADK, a novel liver-enriched mitochondrion-localized NAD kinase. Biol Open (2013) 2(4):432–8. doi: 10.1242/bio.20134259
98. Katiyar SS, Briedis AV, Porter JW. Synthesis of fatty acids from malonyl-CoA and NADPH by pigeon liver fatty acid synthetase. Arch Biochem Biophys (1974) 162(2):412–20. doi: 10.1016/0003-9861(74)90199-4
99. Bradshaw PC. Cytoplasmic and mitochondrial NADPH-coupled redox systems in the regulation of aging. Nutrients (2019) 11(3):504. doi: 10.3390/nu11030504
100. Ying W. NAD+/NADH and NADP+/NADPH in cellular functions and cell death: regulation and biological consequences. Antioxid Redox Signal (2008) 10(2):179–206. doi: 10.1089/ars.2007.1672
101. Smolkova K, Jezek P. The role of mitochondrial NADPH-dependent isocitrate dehydrogenase in cancer cells. Int J Cell Biol (2012) 2012:273947. doi: 10.1155/2012/273947
102. Rather GM, Pramono AA, Szekely Z, Bertino JR, Tedeschi PM. In cancer, all roads lead to NADPH. Pharmacol Ther (2021) 226:107864. doi: 10.1016/j.pharmthera.2021.107864
103. Ju HQ, Lin JF, Tian T, Xie D, Xu RH. NADPH homeostasis in cancer: functions, mechanisms and therapeutic implications. Signal Transduct Target Ther (2020) 5(1):231. doi: 10.1038/s41392-020-00326-0
104. Goodman RP, Calvo SE, Mootha VK. Spatiotemporal compartmentalization of hepatic NADH and NADPH metabolism. J Biol Chem (2018) 293(20):7508–16. doi: 10.1074/jbc.TM117.000258
105. Koju N, Qin ZH, Sheng R. Reduced nicotinamide adenine dinucleotide phosphate in redox balance and diseases: a friend or foe? Acta Pharmacol Sin (2022) 43(8):1889–904. doi: 10.1038/s41401-021-00838-7
106. Klaidman LK, Leung AC, Adams JD Jr. High-performance liquid chromatography analysis of oxidized and reduced pyridine dinucleotides in specific brain regions. Anal Biochem (1995) 228(2):312–7. doi: 10.1006/abio.1995.1356
107. Blacker TS, Duchen MR. Investigating mitochondrial redox state using NADH and NADPH autofluorescence. Free Radic Biol Med (2016) 100:53–65. doi: 10.1016/j.freeradbiomed.2016.08.010
108. Hung YP, Albeck JG, Tantama M, Yellen G. Imaging cytosolic NADH-NAD(+) redox state with a genetically encoded fluorescent biosensor. Cell Metab (2011) 14(4):545–54. doi: 10.1016/j.cmet.2011.08.012
109. Zhao Y, Jin J, Hu Q, Zhou HM, Yi J, Yu Z, et al. Genetically encoded fluorescent sensors for intracellular NADH detection. Cell Metab (2011) 14(4):555–66. doi: 10.1016/j.cmet.2011.09.004
110. Bilan DS, Matlashov ME, Gorokhovatsky AY, Schultz C, Enikolopov G, Belousov VV. Genetically encoded fluorescent indicator for imaging NAD(+)/NADH ratio changes in different cellular compartments. Biochim Biophys Acta (2014) 1840(3):951–7. doi: 10.1016/j.bbagen.2013.11.018
111. Cambronne XA, Stewart ML, Kim D, Jones-Brunette AM, Morgan RK, Farrens DL, et al. Biosensor reveals multiple sources for mitochondrial NAD(+). Science (2016) 352(6292):1474–7. doi: 10.1126/science.aad5168
112. Zhao Y, Yang Y. Real-time and high-throughput analysis of mitochondrial metabolic states in living cells using genetically encoded NAD(+)/NADH sensors. Free Radic Biol Med (2016) 100:43–52. doi: 10.1016/j.freeradbiomed.2016.05.027
113. Zhao Y, Wang A, Zou Y, Su N, Loscalzo J, Yang Y. In vivo monitoring of cellular energy metabolism using SoNar, a highly responsive sensor for NAD(+)/NADH redox state. Nat Protoc (2016) 11(8):1345–59. doi: 10.1038/nprot.2016.074
114. Zhao Y, Hu Q, Cheng F, Su N, Wang A, Zou Y, et al. SoNar, a highly responsive NAD+/NADH sensor, allows high-throughput metabolic screening of anti-tumor agents. Cell Metab (2015) 21(5):777–89. doi: 10.1016/j.cmet.2015.04.009
115. Cameron WD, Bui CV, Hutchinson A, Loppnau P, Graslund S, Rocheleau JV. Apollo-NADP(+): a spectrally tunable family of genetically encoded sensors for NADP(+). Nat Methods (2016) 13(4):352–8. doi: 10.1038/nmeth.3764
116. Tao R, Zhao Y, Chu H, Wang A, Zhu J, Chen X, et al. Genetically encoded fluorescent sensors reveal dynamic regulation of NADPH metabolism. Nat Methods (2017) 14(7):720–8. doi: 10.1038/nmeth.4306
117. Zou Y, Wang A, Shi M, Chen X, Liu R, Li T, et al. Analysis of redox landscapes and dynamics in living cells and in vivo using genetically encoded fluorescent sensors. Nat Protoc (2018) 13(10):2362–86. doi: 10.1038/s41596-018-0042-5
118. Hassinen I, Chance B. Oxidation-reduction properties of the mitochondrial flavoprotein chain. Biochem Biophys Res Commun (1968) 31(6):895–900. doi: 10.1016/0006-291X(68)90536-6
119. Voltti H, Hassinen IE. Oxidation-reduction midpoint potentials of mitochondrial flavoproteins and their intramitochondrial localization. J Bioenerg Biomembr (1978) 10(1-2):45–58. doi: 10.1007/BF00743226
120. Kunz WS, Kunz W. Contribution of different enzymes to flavoprotein fluorescence of isolated rat liver mitochondria. Biochim Biophys Acta (1985) 841(3):237–46. doi: 10.1016/0304-4165(85)90064-9
121. Ehrenberg B, Montana V, Wei MD, Wuskell JP, Loew LM. Membrane potential can be determined in individual cells from the nernstian distribution of cationic dyes. Biophys J (1988) 53(5):785–94. doi: 10.1016/S0006-3495(88)83158-8
122. Brand MD, Nicholls DG. Assessing mitochondrial dysfunction in cells. Biochem J (2011) 435(2):297–312. doi: 10.1042/BJ20110162
123. Kuznetsov AV, Margreiter R. Heterogeneity of mitochondria and mitochondrial function within cells as another level of mitochondrial complexity. Int J Mol Sci (2009) 10(4):1911–29. doi: 10.3390/ijms10041911
124. Ward MW, Rego AC, Frenguelli BG, Nicholls DG. Mitochondrial membrane potential and glutamate excitotoxicity in cultured cerebellar granule cells. J Neurosci (2000) 20(19):7208–19. doi: 10.1523/JNEUROSCI.20-19-07208.2000
125. Zorova LD, Popkov VA, Plotnikov EY, Silachev DN, Pevzner IB, Jankauskas SS, et al. Mitochondrial membrane potential. Anal Biochem (2018) 552:50–9. doi: 10.1016/j.ab.2017.07.009
126. Norman JP, Perry SW, Reynolds HM, Kiebala M, De Mesy Bentley KL, Trejo M, et al. HIV-1 tat activates neuronal ryanodine receptors with rapid induction of the unfolded protein response and mitochondrial hyperpolarization. PloS One (2008) 3(11):e3731. doi: 10.1371/journal.pone.0003731
127. Heslop KA, Rovini A, Hunt EG, Fang D, Morris ME, Christie CF, et al. JNK activation and translocation to mitochondria mediates mitochondrial dysfunction and cell death induced by VDAC opening and sorafenib in hepatocarcinoma cells. Biochem Pharmacol (2020) 171:113728. doi: 10.1016/j.bcp.2019.113728
128. Gottlieb E, Armour SM, Harris MH, Thompson CB. Mitochondrial membrane potential regulates matrix configuration and cytochrome c release during apoptosis. Cell Death Differ (2003) 10(6):709–17. doi: 10.1038/sj.cdd.4401231
129. DeHart DN, Fang D, Heslop K, Li L, Lemasters JJ, Maldonado EN. Opening of voltage dependent anion channels promotes reactive oxygen species generation, mitochondrial dysfunction and cell death in cancer cells. Biochem Pharmacol (2018) 148:155–62. doi: 10.1016/j.bcp.2017.12.022
130. Perry SW, Norman JP, Barbieri J, Brown EB, Gelbard HA. Mitochondrial membrane potential probes and the proton gradient: a practical usage guide. Biotechniques (2011) 50(2):98–115. doi: 10.2144/000113610
131. Farkas DL, Wei MD, Febbroriello P, Carson JH, Loew LM, et al. Simultaneous imaging of cell and mitochondrial membrane potentials. Biophys J (1989) 56(6):1053–69. doi: 10.1016/S0006-3495(89)82754-7
132. Nicholls DG, Ward MW. Mitochondrial membrane potential and neuronal glutamate excitotoxicity: mortality and millivolts. Trends Neurosci (2000) 23(4):166–74. doi: 10.1016/S0166-2236(99)01534-9
133. Nicholls DG. Simultaneous monitoring of ionophore- and inhibitor-mediated plasma and mitochondrial membrane potential changes in cultured neurons. J Biol Chem (2006) 281(21):14864–74. doi: 10.1074/jbc.M510916200
134. Freedman JC, Novak TS. Optical measurement of membrane potential in cells, organelles, and vesicles. Methods Enzymol (1989) 172:102–22. doi: 10.1016/S0076-6879(89)72011-5
135. Reers M, Smiley ST, Mottola-Hartshorn C, Chen A, Lin M, Chen LB. Mitochondrial membrane potential monitored by JC-1 dye. Methods Enzymol (1995) 260:406–17. doi: 10.1016/0076-6879(95)60154-6
136. Salvioli S, Dobrucki J, Moretti L, Troiano L, Fernandez MG, Pinti M, et al. Mitochondrial heterogeneity during staurosporine-induced apoptosis in HL60 cells: analysis at the single cell and single organelle level. Cytometry (2000) 40(3):189–97. doi: 10.1002/1097-0320(20000701)40:3<189::AID-CYTO3>3.0.CO;2-6
137. Ward MW. Quantitative analysis of membrane potentials. Methods Mol Biol (2010) 591:335–51. doi: 10.1007/978-1-60761-404-3_20
138. Gai C, Feng WD, Qiang TY, Ma HJ, Chai Y, Zhang SJ, et al. Da-Bu-Yin-Wan and qian-Zheng-San ameliorate mitochondrial dynamics in the parkinson's disease cell model induced by MPP(). Front Pharmacol (2019) 10:372. doi: 10.3389/fphar.2019.00372
139. Wilson CL, Natarajan V, Hayward SL, Khalimonchuk O, Kidambi S. Mitochondrial dysfunction and loss of glutamate uptake in primary astrocytes exposed to titanium dioxide nanoparticles. Nanoscale (2015) 7(44):18477–88. doi: 10.1039/C5NR03646A
140. Wong HS, Monternier PA, Brand MD. S1QELs suppress mitochondrial superoxide/hydrogen peroxide production from site I(Q) without inhibiting reverse electron flow through complex I. Free Radic Biol Med (2019) 143:545–59. doi: 10.1016/j.freeradbiomed.2019.09.006
141. Chakraborty P, Parikh RY, Choi S, Tran D, Gooz M, Hedley ZT, et al. Carbon monoxide activates PERK-regulated autophagy to induce immunometabolic reprogramming and boost antitumor T-cell function. Cancer Res (2022) 82(10):1969–90. doi: 10.1158/0008-5472.CAN-21-3155
142. Polster BM, Nicholls DG, Ge SX, Roelofs BA. Use of potentiometric fluorophores in the measurement of mitochondrial reactive oxygen species. Methods Enzymol (2014) 547:225–50. doi: 10.1016/B978-0-12-801415-8.00013-8
143. Deshwal S, Antonucci S, Kaludercic N, Di Lisa F. Measurement of mitochondrial ROS formation. Methods Mol Biol (2018) 1782:403–18. doi: 10.1007/978-1-4939-7831-1_24
144. Rao VR, Lautz JD, Kaja S, Foecking EM, Lukacs E, Stubbs EB Jr., et al. Mitochondrial-targeted antioxidants attenuate TGF-beta2 signaling in human trabecular meshwork cells. Invest Ophthalmol Vis Sci (2019) 60(10):3613–24. doi: 10.1167/iovs.19-27542
145. Schattauer SS, Bedini A, Summers F, Reilly-Treat A, Andrews MM, Land BB, et al. Reactive oxygen species (ROS) generation is stimulated by kappa opioid receptor activation through phosphorylated c-jun n-terminal kinase and inhibited by p38 mitogen-activated protein kinase (MAPK) activation. J Biol Chem (2019) 294(45):16884–96. doi: 10.1074/jbc.RA119.009592
146. Robinson KM, Janes MS, Pehar M, Monette JS, Ross MF, Hagen TM, et al. Selective fluorescent imaging of superoxide in vivo using ethidium-based probes. Proc Natl Acad Sci U.S.A. (2006) 103(41):15038–43. doi: 10.1073/pnas.0601945103
147. Scaduto RC Jr., Grotyohann LW. Measurement of mitochondrial membrane potential using fluorescent rhodamine derivatives. Biophys J (1999) 76(1 Pt 1):469–77. doi: 10.1016/S0006-3495(99)77214-0
148. Isenberg JS, Klaunig JE. Role of the mitochondrial membrane permeability transition (MPT) in rotenone-induced apoptosis in liver cells. Toxicol Sci (2000) 53(2):340–51. doi: 10.1093/toxsci/53.2.340
149. Chen G, Yang Y, Xu C, Gao S. A flow cytometry-based assay for measuring mitochondrial membrane potential in cardiac myocytes after Hypoxia/Reoxygenation. J Vis Exp (2018) 137):57725. doi: 10.3791/57725
150. Glazier DS. How metabolic rate relates to cell size. Biol (Basel) (2022) 11(8):1106. doi: 10.3390/biology11081106
151. Rottenberg H, Wu S. Quantitative assay by flow cytometry of the mitochondrial membrane potential in intact cells. Biochim Biophys Acta (1998) 1404(3):393–404. doi: 10.1016/S0167-4889(98)00088-3
152. Salvioli S, Ardizzoni A, Franceschi C, Cossarizza A. JC-1, but not DiOC6(3) or rhodamine 123, is a reliable fluorescent probe to assess delta psi changes in intact cells: implications for studies on mitochondrial functionality during apoptosis. FEBS Lett (1997) 411(1):77–82. doi: 10.1016/S0014-5793(97)00669-8
153. Klier PEZ, Martin JG, Miller EW. Imaging reversible mitochondrial membrane potential dynamics with a masked rhodamine voltage reporter. J Am Chem Soc (2021) 143(11):4095–9. doi: 10.1021/jacs.0c13110
154. Lin B, Liu Y, Zhang X, Fan L, Shu Y, Wang J. Membrane-activated fluorescent probe for high-fidelity imaging of mitochondrial membrane potential. ACS Sens (2021) 6(11):4009–18. doi: 10.1021/acssensors.1c01390
155. Giorgio M, Trinei M, Migliaccio E, Pelicci PG. Hydrogen peroxide: a metabolic by-product or a common mediator of ageing signals? Nat Rev Mol Cell Biol (2007) 8(9):722–8. doi: 10.1038/nrm2240
156. Brand MD. Riding the tiger - physiological and pathological effects of superoxide and hydrogen peroxide generated in the mitochondrial matrix. Crit Rev Biochem Mol Biol (2020) 55(6):592–661. doi: 10.1080/10409238.2020.1828258
157. Muller FL, Liu Y, Abdul-Ghani MA, Lustgarten MS, Bhattacharya A, Jang YC, et al. High rates of superoxide production in skeletal-muscle mitochondria respiring on both complex I- and complex II-linked substrates. Biochem J (2008) 409(2):491–9. doi: 10.1042/BJ20071162
158. Mailloux RJ. An update on mitochondrial reactive oxygen species production. Antioxidants (Basel) (2020) 9(6):472. doi: 10.3390/antiox9060472
159. Andreyev AY, Kushnareva YE, Murphy AN, Starkov AA. Mitochondrial ROS metabolism: 10 years later. Biochem (Mosc) (2015) 80(5):517–31. doi: 10.1134/S0006297915050028
160. Wong HS, Dighe PA, Mezera V, Monternier PA, Brand MD. Production of superoxide and hydrogen peroxide from specific mitochondrial sites under different bioenergetic conditions. J Biol Chem (2017) 292(41):16804–9. doi: 10.1074/jbc.R117.789271
161. Perevoshchikova IV, Quinlan CL, Orr AL, Gerencser AA, Brand MD. Sites of superoxide and hydrogen peroxide production during fatty acid oxidation in rat skeletal muscle mitochondria. Free Radic Biol Med (2013) 61:298–309. doi: 10.1016/j.freeradbiomed.2013.04.006
162. Fang J, Zhang Y, Gerencser AA, Brand MD. Effects of sugars, fatty acids and amino acids on cytosolic and mitochondrial hydrogen peroxide release from liver cells. Free Radic Biol Med (2022) 188:92–102. doi: 10.1016/j.freeradbiomed.2022.06.225
163. Kalyanaraman B. NAC, NAC, knockin' on heaven's door: interpreting the mechanism of action of n-acetylcysteine in tumor and immune cells. Redox Biol (2022) 57:102497. doi: 10.1016/j.redox.2022.102497
164. Budd SL, Castilho RF, Nicholls DG. Mitochondrial membrane potential and hydroethidine-monitored superoxide generation in cultured cerebellar granule cells. FEBS Lett (1997) 415(1):21–4. doi: 10.1016/S0014-5793(97)01088-0
165. Brand MD. Mitochondrial generation of superoxide and hydrogen peroxide as the source of mitochondrial redox signaling. Free Radic Biol Med (2016) 100:14–31. doi: 10.1016/j.freeradbiomed.2016.04.001
166. Kelso GF, Porteous CM, Coulter CV, Hughes G, Porteous WK, Ledgerwood EC, et al. Selective targeting of a redox-active ubiquinone to mitochondria within cells: antioxidant and antiapoptotic properties. J Biol Chem (2001) 276(7):4588–96. doi: 10.1074/jbc.M009093200
167. Trnka J, Blaikie FH, Logan A, Smith RA, Murphy MP. Antioxidant properties of MitoTEMPOL and its hydroxylamine. Free Radic Res (2009) 43(1):4–12. doi: 10.1080/10715760802582183
168. Watson MA, Wong HS, Brand MD. Use of S1QELs and S3QELs to link mitochondrial sites of superoxide and hydrogen peroxide generation to physiological and pathological outcomes. Biochem Soc Trans (2019) 47(5):1461–9. doi: 10.1042/BST20190305
169. Zielonka J, Kalyanaraman B. Hydroethidine- and MitoSOX-derived red fluorescence is not a reliable indicator of intracellular superoxide formation: another inconvenient truth. Free Radic Biol Med (2010) 48(8):983–1001. doi: 10.1016/j.freeradbiomed.2010.01.028
170. Markvicheva KN, Bogdanova EA, Staroverov DB, Lukyanov S, Belousov VV. Imaging of intracellular hydrogen peroxide production with HyPer upon stimulation of HeLa cells with epidermal growth factor. Methods Mol Biol (2008) 476:79–86. doi: 10.1007/978-1-59745-129-1_6
171. Bilan DS, Belousov VV. HyPer family probes: state of the art. Antioxid Redox Signal (2016) 24(13):731–51. doi: 10.1089/ars.2015.6586
172. Ermakova YG, Bilan DS, Matlashov ME, Mishina NM, Markvicheva KN, Subach OM, et al. Red fluorescent genetically encoded indicator for intracellular hydrogen peroxide. Nat Commun (2014) 5:5222. doi: 10.1038/ncomms6222
173. Dooley CT, Dore TM, Hanson GT, Jackson WC, Remington SJ, Tsien RY. Imaging dynamic redox changes in mammalian cells with green fluorescent protein indicators. J Biol Chem (2004) 279(21):22284–93. doi: 10.1074/jbc.M312847200
174. Belousov VV, Fradkov AF, Lukyanov KA, Staroverov DB, Shakhbazov KS, Terskikh AV, et al. Genetically encoded fluorescent indicator for intracellular hydrogen peroxide. Nat Methods (2006) 3(4):281–6. doi: 10.1038/nmeth866
175. Malinouski M, Zhou Y, Belousov VV, Hatfield DL, Gladyshev VN. Hydrogen peroxide probes directed to different cellular compartments. PloS One (2011) 6(1):e14564. doi: 10.1371/journal.pone.0014564
176. Pellegatti P, Raffaghello L, Bianchi G, Piccardi F, Pistoia V, Di Virgilio F. Increased level of extracellular ATP at tumor sites: in vivo imaging with plasma membrane luciferase. PloS One (2008) 3(7):e2599. doi: 10.1371/journal.pone.0002599
177. Pellegatti P, Falzoni S, Pinton P, Rizzuto R, Di Virgilio F. A novel recombinant plasma membrane-targeted luciferase reveals a new pathway for ATP secretion. Mol Biol Cell (2005) 16(8):3659–65. doi: 10.1091/mbc.e05-03-0222
178. Morciano G, Sarti AC, Marchi S, Missiroli S, Falzoni S, Raffaghello L, et al. Use of luciferase probes to measure ATP in living cells and animals. Nat Protoc (2017) 12(8):1542–62. doi: 10.1038/nprot.2017.052
179. Botman D, van Heerden JH, Teusink B. An improved ATP FRET sensor for yeast shows heterogeneity during nutrient transitions. ACS Sens (2020) 5(3):814–22. doi: 10.1021/acssensors.9b02475
180. Shih WM, Gryczynski Z, Lakowicz JR, Spudich JA. A FRET-based sensor reveals large ATP hydrolysis-induced conformational changes and three distinct states of the molecular motor myosin. Cell (2000) 102(5):683–94. doi: 10.1016/S0092-8674(00)00090-8
181. Zhao Z, Rajagopalan R, Zweifach A. A novel multiple-read screen for metabolically active compounds based on a genetically encoded FRET sensor for ATP. SLAS Discovery (2018) 23(9):907–18. doi: 10.1177/2472555218780636
182. de la Fuente-Herreruela D, Gonzalez-Charro V, Almendro-Vedia VG, Moran M, Martin MA, Lillo MP, et al. Rhodamine-based sensor for real-time imaging of mitochondrial ATP in living fibroblasts. Biochim Biophys Acta Bioenerg (2017) 1858(12):999–1006. doi: 10.1016/j.bbabio.2017.09.004
183. Hong S, Zhang X, Lake RJ, Pawel GT, Guo Z, Pei R, et al. A photo-regulated aptamer sensor for spatiotemporally controlled monitoring of ATP in the mitochondria of living cells. Chem Sci (2019) 11(3):713–20. doi: 10.1039/c9sc04773e
184. Peng W, Hu M, Zhang J. Mitochondrial-targeted deep-red fluorescent probe for ATP and its application in living cells and zebrafish. Anal Methods (2020) 12(26):3333–6. doi: 10.1039/D0AY00942C
185. Berg J, Hung YP, Yellen G. A genetically encoded fluorescent reporter of ATP:ADP ratio. Nat Methods (2009) 6(2):161–6. doi: 10.1038/nmeth.1288
Keywords: fluorescence microscopy, mitochondrial metabolism, NAD(P)H, FAD, mitochondrial membrane potential, ROS
Citation: Gooz M and Maldonado EN (2023) Fluorescence microscopy imaging of mitochondrial metabolism in cancer cells. Front. Oncol. 13:1152553. doi: 10.3389/fonc.2023.1152553
Received: 27 January 2023; Accepted: 06 June 2023;
Published: 22 June 2023.
Edited by:
Tuuli Käämbre, National Institute of Chemical Physics and Biophysics, EstoniaReviewed by:
Katerina Rohlenova, Institute of Biotechnology (ASCR), CzechiaHuiying Yan, Nanjing Drum Tower Hospital, China
Ahmed A. Heikal, University of Minnesota Duluth, United States
Copyright © 2023 Gooz and Maldonado. This is an open-access article distributed under the terms of the Creative Commons Attribution License (CC BY). The use, distribution or reproduction in other forums is permitted, provided the original author(s) and the copyright owner(s) are credited and that the original publication in this journal is cited, in accordance with accepted academic practice. No use, distribution or reproduction is permitted which does not comply with these terms.
*Correspondence: Monika Gooz, YmVja21AbXVzYy5lZHU=