 Saba Zarean Shahraki1Mehdi Azizmohammad Looha2Pooya Mohammadi kazaj3Mehrad Aria4Atieh Akbari5Hassan Emami1Farkhondeh Asadi1*Mohammad Esmaeil Akbari5*
- 1Department of Health Information Technology and Management, School of Allied Medical Sciences, Shahid Beheshti University of Medical Sciences, Tehran, Iran
- 2Basic and Molecular Epidemiology of Gastrointestinal Disorders Research Center, Research Institute for Gastroenterology and Liver Diseases, Shahid Beheshti University of Medical Sciences, Tehran, Iran
- 3Geographic Information Systems Department, Faculty of Geodesy and Geomatics Engineering, K. N. Toosi University of Technology, Tehran, Iran
- 4Faculty of Information Technology and Computer Engineering, Azarbaijan Shahid Madani University, Tehran, Iran
- 5Cancer Research Center, Shahid Beheshti University of Medical Sciences, Tehran, Iran
Background: Breast cancer (BC) survival prediction can be a helpful tool for identifying important factors selecting the effective treatment reducing mortality rates. This study aims to predict the time-related survival probability of BC patients in different molecular subtypes over 30 years of follow-up.
Materials and methods: This study retrospectively analyzed 3580 patients diagnosed with invasive breast cancer (BC) from 1991 to 2021 in the Cancer Research Center of Shahid Beheshti University of Medical Science. The dataset contained 18 predictor variables and two dependent variables, which referred to the survival status of patients and the time patients survived from diagnosis. Feature importance was performed using the random forest algorithm to identify significant prognostic factors. Time-to-event deep-learning-based models, including Nnet-survival, DeepHit, DeepSurve, NMLTR and Cox-time, were developed using a grid search approach with all variables initially and then with only the most important variables selected from feature importance. The performance metrics used to determine the best-performing model were C-index and IBS. Additionally, the dataset was clustered based on molecular receptor status (i.e., luminal A, luminal B, HER2-enriched, and triple-negative), and the best-performing prediction model was used to estimate survival probability for each molecular subtype.
Results: The random forest method identified tumor state, age at diagnosis, and lymph node status as the best subset of variables for predicting breast cancer (BC) survival probabilities. All models yielded very close performance, with Nnet-survival (C-index=0.77, IBS=0.13) slightly higher using all 18 variables or the three most important variables. The results showed that the Luminal A had the highest predicted BC survival probabilities, while triple-negative and HER2-enriched had the lowest predicted survival probabilities over time. Additionally, the luminal B subtype followed a similar trend as luminal A for the first five years, after which the predicted survival probability decreased steadily in 10- and 15-year intervals.
Conclusion: This study provides valuable insight into the survival probability of patients based on their molecular receptor status, particularly for HER2-positive patients. This information can be used by healthcare providers to make informed decisions regarding the appropriateness of medical interventions for high-risk patients. Future clinical trials should further explore the response of different molecular subtypes to treatment in order to optimize the efficacy of breast cancer treatments.
1 Introduction
Breast cancer (BC) is the most prevalent cancer in women worldwide, with 2.3 million new BC cases and 685,000 deaths in 2020 (1). Accurate survival prediction of BC can help healthcare providers to better understand patients’ prognosis and prevent unnecessary medical interventions (2).
Traditionally, BC is defined based on different clinical and histological characteristics, including tumor grade, stage of tumor, and hormone receptor status (3, 4). Immunohistochemistry (IHC) receptors, i.e., estrogen receptor (ER), progesterone receptor (PR), and human epidermal growth factor receptor 2 (HER2), are used to categorize BC tumors into four subtypes: luminal A (ER-positive/or PR-positive/HER2-negative), luminal B (ER-positive/or PR-positive/HER-positive), triple negative (ER-negative/PR-negative/HER-negative), and HER2-enriched (ER-negative/PR-negative/HER2-positive) (5). Recent research has used IHC subtypes to characterize BC survival, and has assessed BC survival in both long- and short-term examinations, as each IHC subtype was found to respond differently to adjuvant therapies. Characterizing these markers is likely critical to improving BC patients’ survival and treatments in clinical practice (6, 7).
The Cox regression model has been widely used to analyze time-to-event data for the survival of BC molecular subtypes (8–10). As a result of the rapid development in machine learning and, in particularly neural networks, and its applications in healthcare and medical purposes (11–13), a number of new methods for time-to-event predictions have been developed in recent years (14). To the best of our knowledge DeepHit (15), DeepSurv (16), Neural multi-task logistic regression (NMTLR) (17), Cox-Time (18), and Nnet-survival (19) models have shown high performances in predicting survival probabilities using various clinical datasets.
This study aimed to develop time-to-event survival prediction models using a large-scale Iranian institutional BC dataset to identify the best-performing model for BC patients. The objective of this study was to use this model to predict survival probabilities of four molecular subtypes over a 30-year follow-up period, in order to evaluate BC survival outcomes in both short- and long-term intervals. Additionally, feature importance was utilized to obtain an optimized model.
2 Materials and methods
2.1 Study design
This retrospective cohort study included 5,362 patients diagnosed with invasive BC between 1991 and 2021 at the Cancer Research Center (CRC) affiliated with Shahid Beheshti University of Medical Science (SBMU) in Tehran. Data from patients who underwent surgery followed by adjuvant treatments were extracted from the electronic health records registered in the Breast Cancer Registry System at the CRC. The study was approved by the CRC and the Ethics Committee of SBMU (IR.SBMU.RETECH.REC.1395.750).
2.2 Study population
For each patient, demographic and clinical factors related to BC were collected. Demographic factors included age at diagnosis (Mean ± SD = 48.83 ± 11.59), education level (higher education/high school diploma/middle school/elementary school/illiterate), marital status (married/not married), gravidity (the number of times a patient has been pregnant), breastfeeding duration (0/less than 2 years/between 2-4 years/between 4-6 years/more than 6 years), abortion history (yes/no), and BC family history (none/1st degree/2nd degree). Clinical and pathological factors included morphology (invasive ductal carcinoma/invasive lobular carcinoma), lymph vascular invasion (yes/no), tumor size (T1/T2/T3), lymph node status (N0/N1/N2/N3), tumor histological grade (low/intermediate/high), tumor stage (I/II/III/IV) and molecular subtypes (subgroup 1 - ER+ or PR+/HER2+, subgroup 2 - ER+ or PR+/HER2-, subgroup 3 - ER- and PR-/HER2+, and subgroup 4 - ER- and PR-/HER2-), type of surgery performed (breast conserving surgery/modified radical mastectomy), chemotherapy received (none/adjuvant/nonadjuvanted), radiotherapy administered (none/external/intraoperative) and hormonotherapy prescribed (yes/no) were also used in the analysis. In total, 18 time-independent variables were collected for each patient.
The pathological stage of BC was obtained according to the criteria of the 7th edition of the American Cancer Committee (20). All ER, PR, and HER2 results were identified by the IHC testing. HER2 amplification for patients with equivocal IHC results (2+ grade) was assessed by Fluorescence in Situ Hybridization (FISH) or Chromogenic in Situ Hybridization (CISH) analysis (21, 22). Cases were classified as HER2 negative if their FISH or CISH test were negative or they had an IHC score of 0 or 1+ and were classified as HER2 positive with positive FISH or CISH test or with an IHC score of 3+. For each patient, 1) time-independent variables, 2) the time between the patient’s first diagnosis and the time of the patient’s death or last visit, and 3) a label indicating the survival status of the patient (censored or dead) were calculated.
2.3 Data quality
Prior to analysis, the dataset was assessed for quality issues. These included multiple recorded data for some patients, undetermined IHC status, and outdated survival status. Additionally, some breast cancer diagnoses were incorrectly recorded, patient ages and dates of birth were mismatched, and the small number of male patients could lead to potential biases in the results. To address these issues, the data was cleaned up in several steps. First, the accuracy of patient birthdays and cancer diagnosis age were verified and any incorrect information was modified or removed. Cases with missing IHC status, unknown pathology, non-invasive and non-popular BC, and patients who developed second primary BC were excluded. Duplicate cases were identified by checking their first name and surname, sex, and father’s name. Patients with exactly matched records were assigned to duplicate records and were removed automatically. The status of patients’ survival was updated by contacting their families. Patients who could not be reached, those who died through non-cancer causes, and those who were alive were considered censored, while those who died due to BC were considered dead.
2.4 Feature importance
To determine the most important prognostic variables that affected BC survival time, the Breiman-Cutler permutation method was used with the random forest algorithm (23–25). The dataset was divided into a training set of 80% (n=2864) and a test set of 20% (n=716). The training dataset was analyzed using the random forest algorithm, and parameters such as mtry (number of variables to be split at each node) and node size (minimum size of the terminal node) were adjusted based on analyzing out-of-bag errors. The variables were then selected using the tuned random forest with test data based on the mean decrease in accuracy. Higher values of mean decrease in accuracy indicate greater importance of a variable in predicting survival time. If a variable is associated with the survival probability, this permutation will lead to a decrease in prediction accuracy (26). All analyses were conducted using R (4.2.1) and SPSS (version 26). P-values less than 0.05 were considered statistically significant.
2.5 Model training and performance
Time-to-event models (i.e., DeepHit, NMTLR, Nnet-survival, and DeepSurve and Cox-Time) available in the Pycox1 package were used to analyze the survival data. All models were constructed using all variables and the variables obtained from the feature importance section.
DeepHit: this model utilizes a neural network to estimate the joint distribution of survival time and event, while accounting for the inherent right-censored nature of survival data. The model utilizes a fully parametric approach to predict failure times over a discrete set of fixed size, incorporating both survival times and relative risks in its loss function.
Neural Multi-Task Logistic Regression (N-MTLR): this model is an extension of the Linear Multi-Task Logistic Regression (MTLR) technique that utilizes a deep learning architecture to address the linearity problem in modeling nonlinear dependencies in the dataset. The MTLR model is used to jointly model binary labels representing event indicators at different time intervals, allowing for the assessment of the probability of an event occurring within each interval (27).
Nnet-survival: this model is a discrete-time survival model for neural networks that incorporates non-proportional hazards and can be trained with mini-batch gradient descent. The model is theoretically justified as it uses the likelihood function as the loss function, enabling fast training and avoiding local minimums of the loss function.
DeepSurv: this model is an integration of the Cox proportional hazards model with neural networks that can learn complex relationships between an individual’s covariates and the effect of a treatment. The model utilizes a core hierarchical structure composed of fully connected feed-forward neural networks with a single output node and uses the negative log partial likelihood function to assess patients’ survival hazards.
Cox-Time: this model is an extension of the Cox proportional hazards model that uses neural networks to parameterize the relative risk function and employs a batch-computable loss function, enabling scalability to large datasets. This model incorporates time as an additional input feature to capture its interactions with other input features, allowing for the modeling of complex relationships between covariates and event times, as well as interactions between covariates and time, without being limited by the proportionality assumption.
2.5.1 Data preprocessing
Entity embedding were implemented to one-encode the categorical variables by using the half size of the number of categories (28). The entire dataset was randomly divided into 80 and 20 percent exclusive sets for training and testing the models respectively. This was achieved using the train_test_split method from the scikit-learn2 module, with the stratified argument assigned to molecular subtypes to ensure equal proportions were retained for each breast cancer subtype.
2.5.2 Model design and hyperparameter tuning
With a focus on achieving the best-performing model, we tried to develop the neural network for each model. All models used a standard multilayer perceptron neural network as the model architecture to learn relationships between linear and nonlinear data. In order to develop discrete-time models, it was necessary to categorize survival time into optimal intervals (17, 18). We employed previous research methods (19) that were used to determine the optimal width of time intervals for discrete-time models (DeepHit, MLTR, Nnet-survival). Accordingly, the value of 10, which equated in approximately 36 months, was selected as the width of time intervals.
In order to determine the optimal hyperparameters for the neural network, a grid search was conducted using the Scikit-Learn library. The resulting values are presented in Table 1. Each training setup was trained with a batch size of 256 and utilized the Adam algorithm as an optimizer function due to its efficient runtime. To compensate for the small number of samples and having general models, 5-fold cross-validation was used for training each setup derived from the grid search (29). Specifically, four folds were used for training and one fold was reserved for testing in each iteration, resulting in five fully trained models for every combination of grid search and training dataset. Early stopping with a patience number of 10 was implemented to expedite the training process; if a model’s loss score did not improve after 10 consecutive epochs, the training process ceased and the best evaluation score was recorded for that fold. Additionally, in each training setup, 10 percent of the four folds were randomly selected and utilized as a validation set. Altogether, 450 distinct trainings consisting of 5-fold cross-validation for 90 grid search combinations were performed. The neural network structures were implemented in Python using the Pytorch library (Python 3.6, Pytorch 1.12.1).
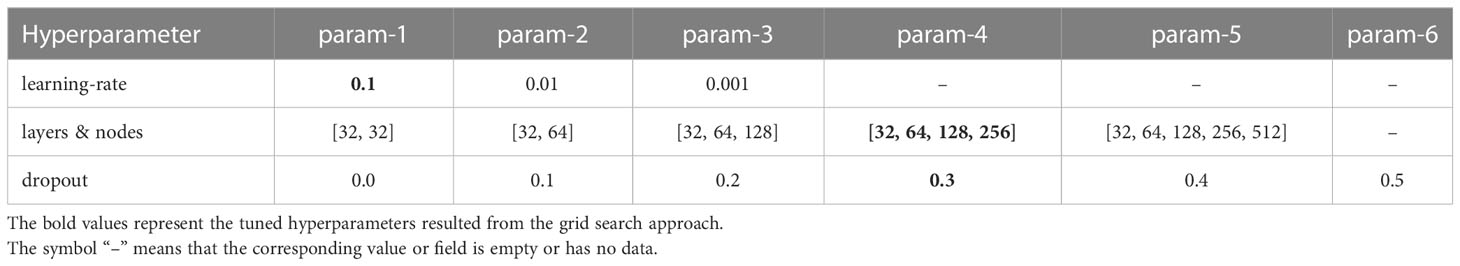
Table 1 Grid search hyperparameters.
The output of each model was a 10-dimensional vector, where each element represented the predicted survival probability over each time interval (36 months). To visualize the Kaplan-Meier curves and compare the survival probabilities of each subtype across different time intervals, the 5-, 10- and 15-year mean survival probabilities for all patients in each specific time interval were calculated.
2.5.3 Performance evaluation
The performance of the five models was evaluated using the concordance index (C-index) (30) as an evaluation metric. The C-index is a correlation coefficient that measures the degree of agreement between predicted survival risks and observed survival times. A C-index value of 0.5 indicates random prediction, while a value of 1.0 indicates excellent prediction. Additionally, the Integrated Brier score (31) (IBS) was used to assess the models’ calibrations by indicating the mean square difference between observed patient status and predicted survival probability, with scores ranging from 0 to 1 and lower scores indicating better performance. A Brier score below 0.25 is considered useful in practice. The model with the highest C-index and IBS scores among the five training folds of the grid search setups was selected as the best-performing model for predicting survival probability.
3 Results
3.1 Baseline characteristics and overall survival rate
A total of 3580 women were included in the study, with a mean ( ± SD) age of 48.83 ± 11.59 years. 434 cases (12.1%) died during the study period due to the BC, while 3146 cases were censored. Table 2 presents the demographic and clinical characteristics of BC patients. The overall survival rate (95% confidence interval [CI]) was 0.47 (0.29, 0.77) with a 5-years survival rate (95% CI) of 0.89 (0.88, 0.91). The mean survival time (95% CI) was 20.78 (19.78, 21.79) years, as illustrated in Figure 1.
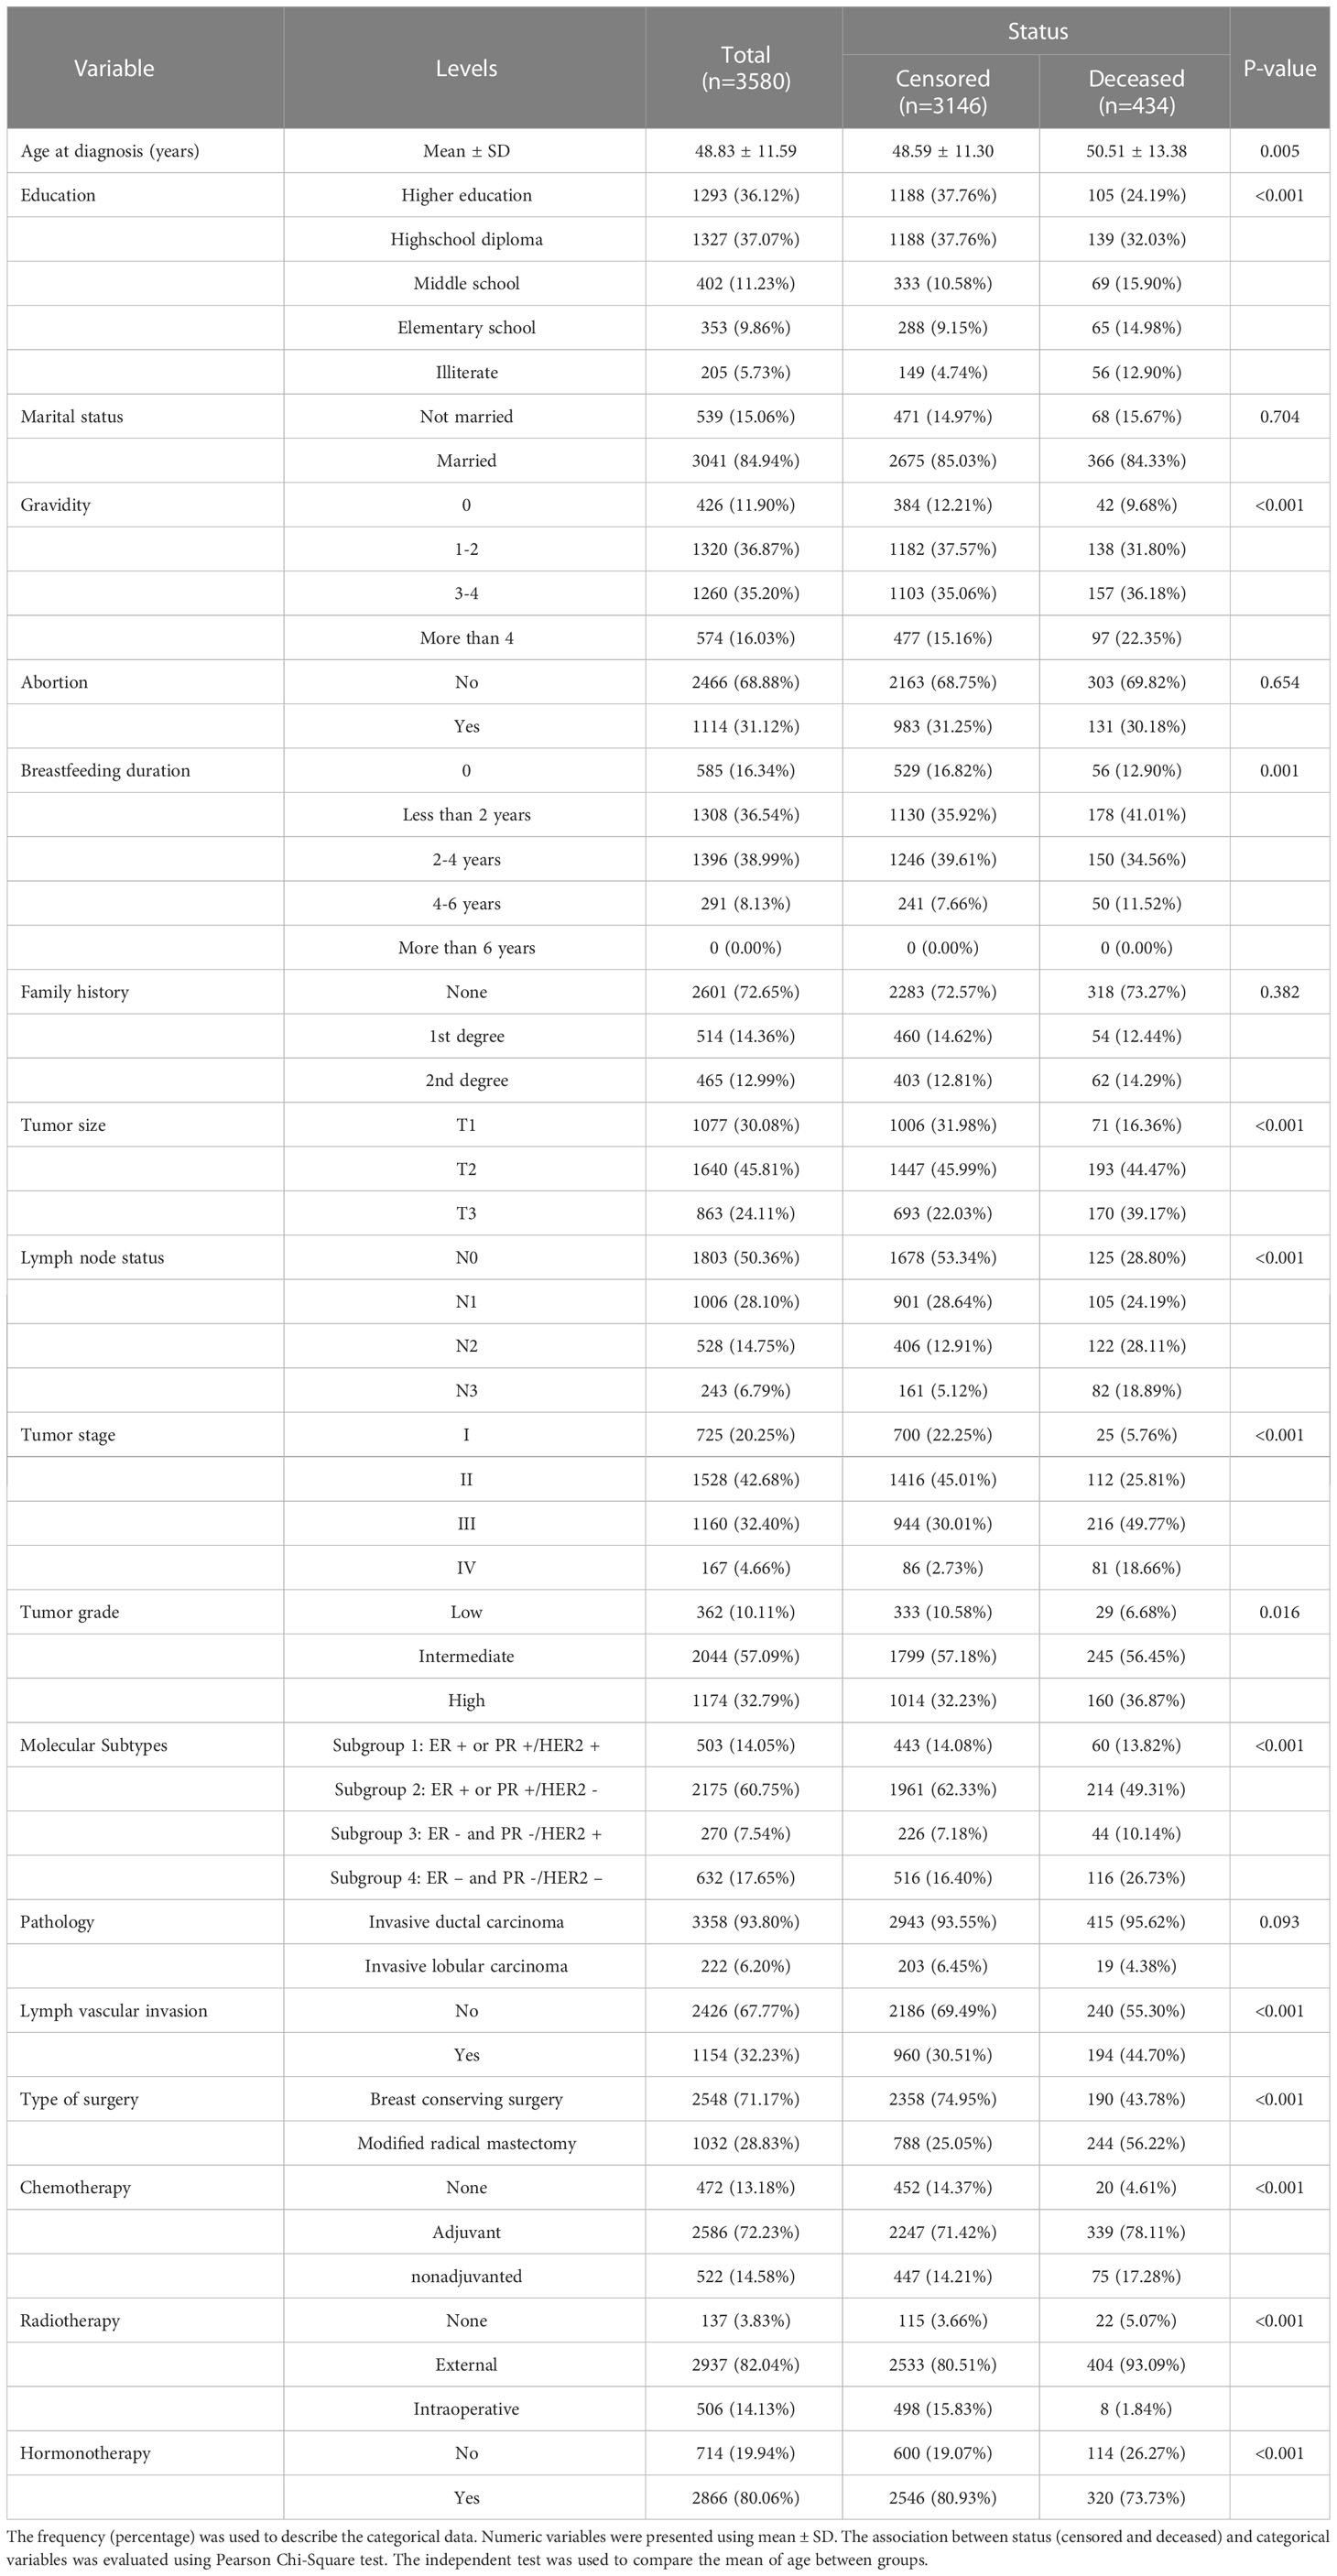
Table 2 Description of variables in the dataset.
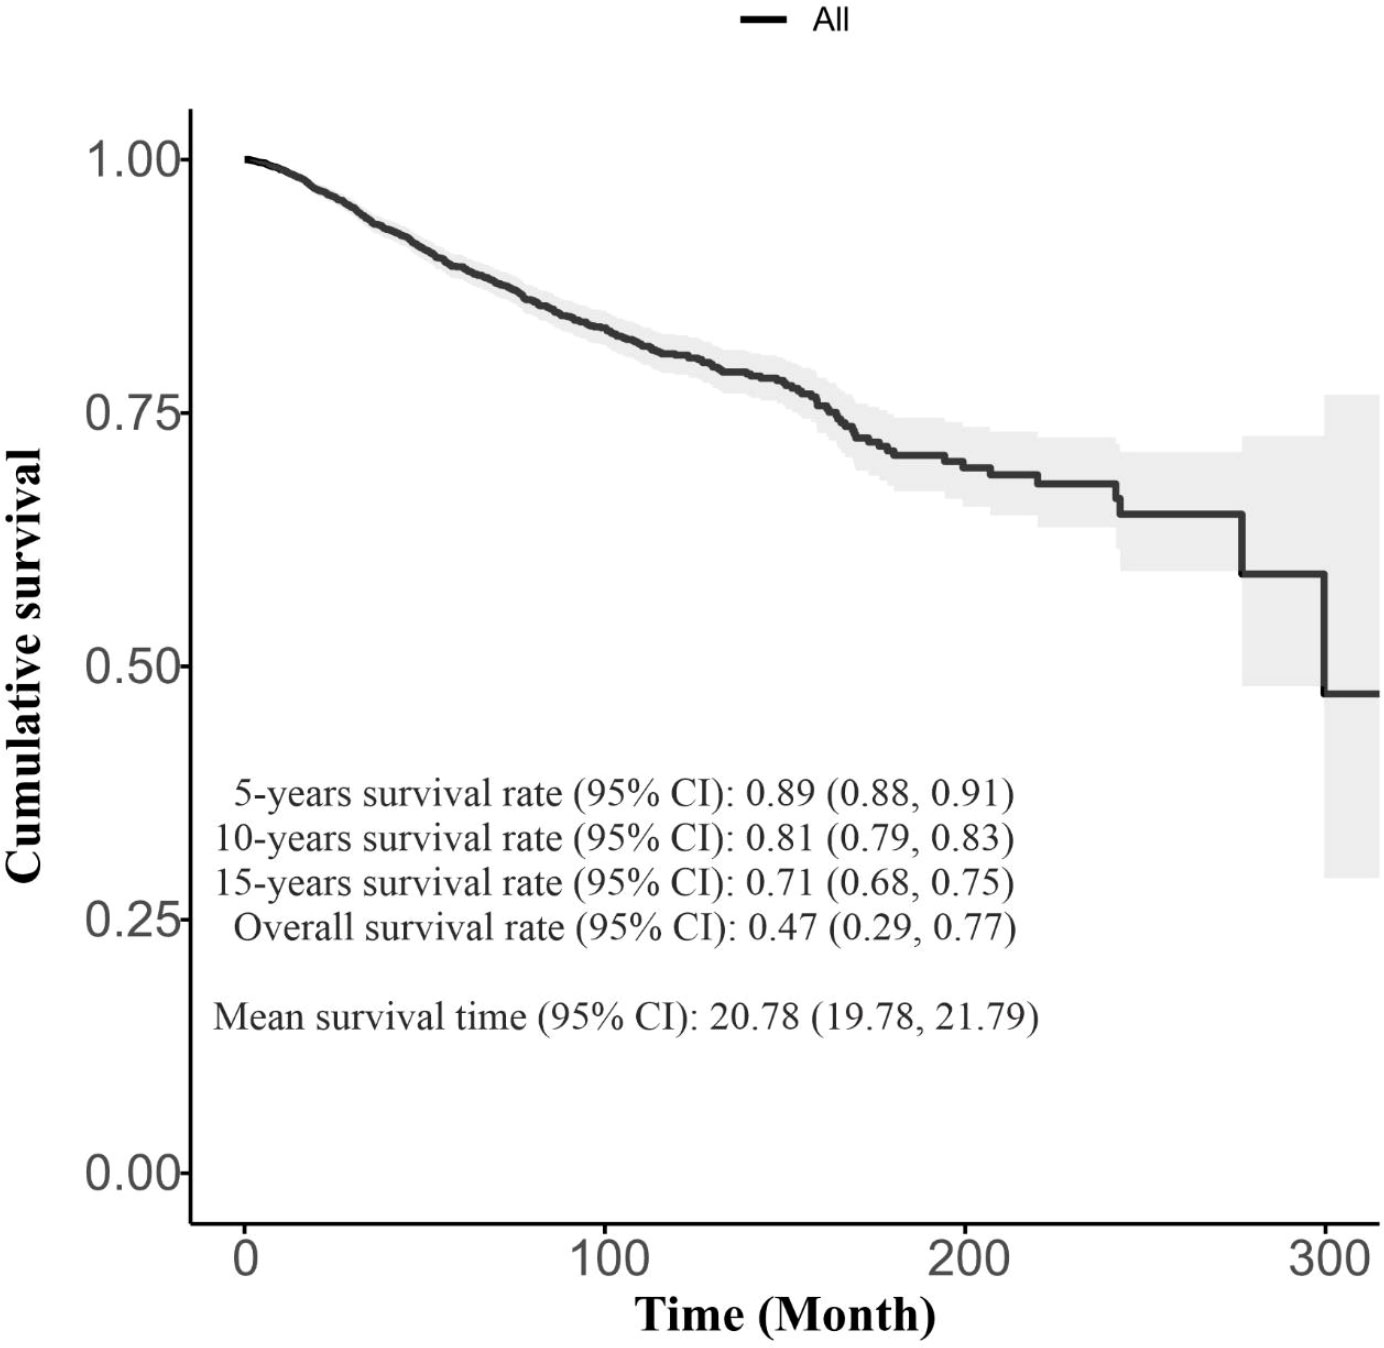
Figure 1 The Overall Kaplan-Meier survival Curve with summarization of survival times.
3.2 Prognosis feature importance
The most significant factors affecting survival probability were identified by selecting the variables with the highest mean decrease in accuracy, as shown in Figure 2. The results revealed that six variables, including lymph vascular invasion, type of surgery, tumor stage, lymph node status, breastfeeding duration, and age at diagnosis (plus molecular subtypes), had the highest mean decreases in accuracy and were therefore considered to be the most important factors. Moreover, tumor stage, age at diagnosis, and lymph node status (plus molecular subtypes) were identified as the top three important variables with larger mean decreases in accuracy compared to other variables. To categorize variables into different molecular subtypes, the molecular subtype status was taken into account to perform modelling along with the obtained important factors from the random forest algorithm.
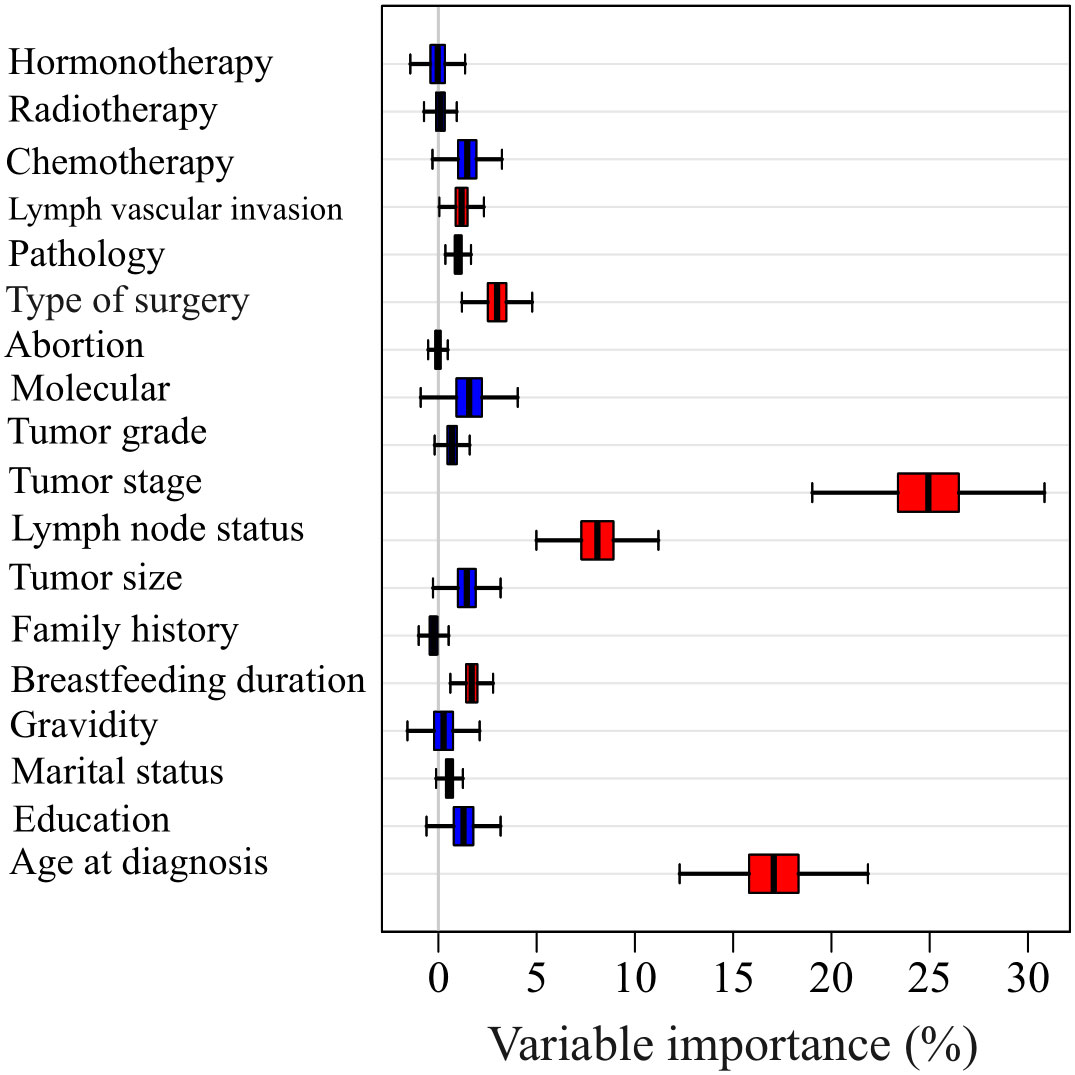
Figure 2 The Mean decrease accuracy of each variable in predicting the survival time using random forest method.
3.3 The prediction performance using all variables
Table 3 presents the outcomes of models’ performances that were developed using all variables. These results show the optimal C-index and IBS metrics of the trained models. According to the C-index, Nnet-survival and NMTLR models with a score of 0.77 had the highest scores; nevertheless, the Nnet-survival had the best overall performance in terms of IBS with a score of 0.14. Ultimately, the Nnet-survival model was selected as the best-performing model for predicting survival data using all variables.
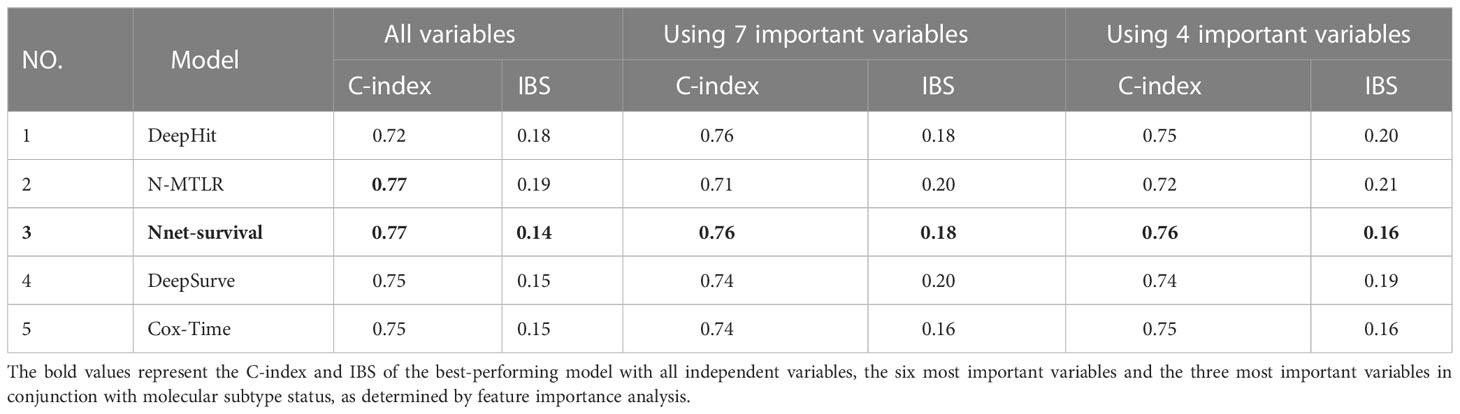
Table 3 Performance of five models on Breast Cancer test set.
Figure 3 shows the Kaplan-Meier curves of mean survival probability in 10-time intervals for each molecular subtype predicted by the Nnet-survival model, which was developed by all variables. Table 4 displays the 5-, 10-, and 15-year predicted survival probabilities for each molecular subtype.

Figure 3 The Kaplan-Meyer curves of mean survival probabilities for each molecular subtype predicted by the Nnet-survival model, using all variables, during 30 years of follow-up (Red graph: Luminal B, Blue graph: Luminal A, Green graph: HER2-Enriched, Aqua graph: Triple-Negative).
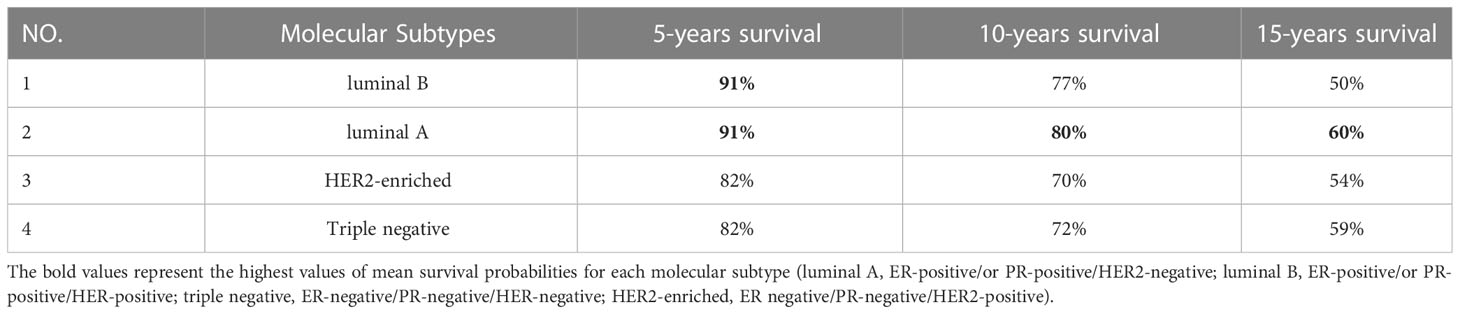
Table 4 Mean survival probability of each molecular subtype in different time periods predicted by the Nnet-survival model developed with all timeindependentvariables.
3.4 The prediction performance using important variables
With a C-index of 0.76 and an IBS of 0.18, the Nnet-survival model demonstrated the highest performance when utilizing seven significant variables in its development, while also achieving a C-index and IBS score of 0.76 and 0.18 respectively when using only the four primary variables (Table 3). Figure 4 and Table 5 display the 5-, 10- and 15-year mean survival probabilities predicted by the Nnet-survival model developed with the three most important variables along with molecular subtype status.
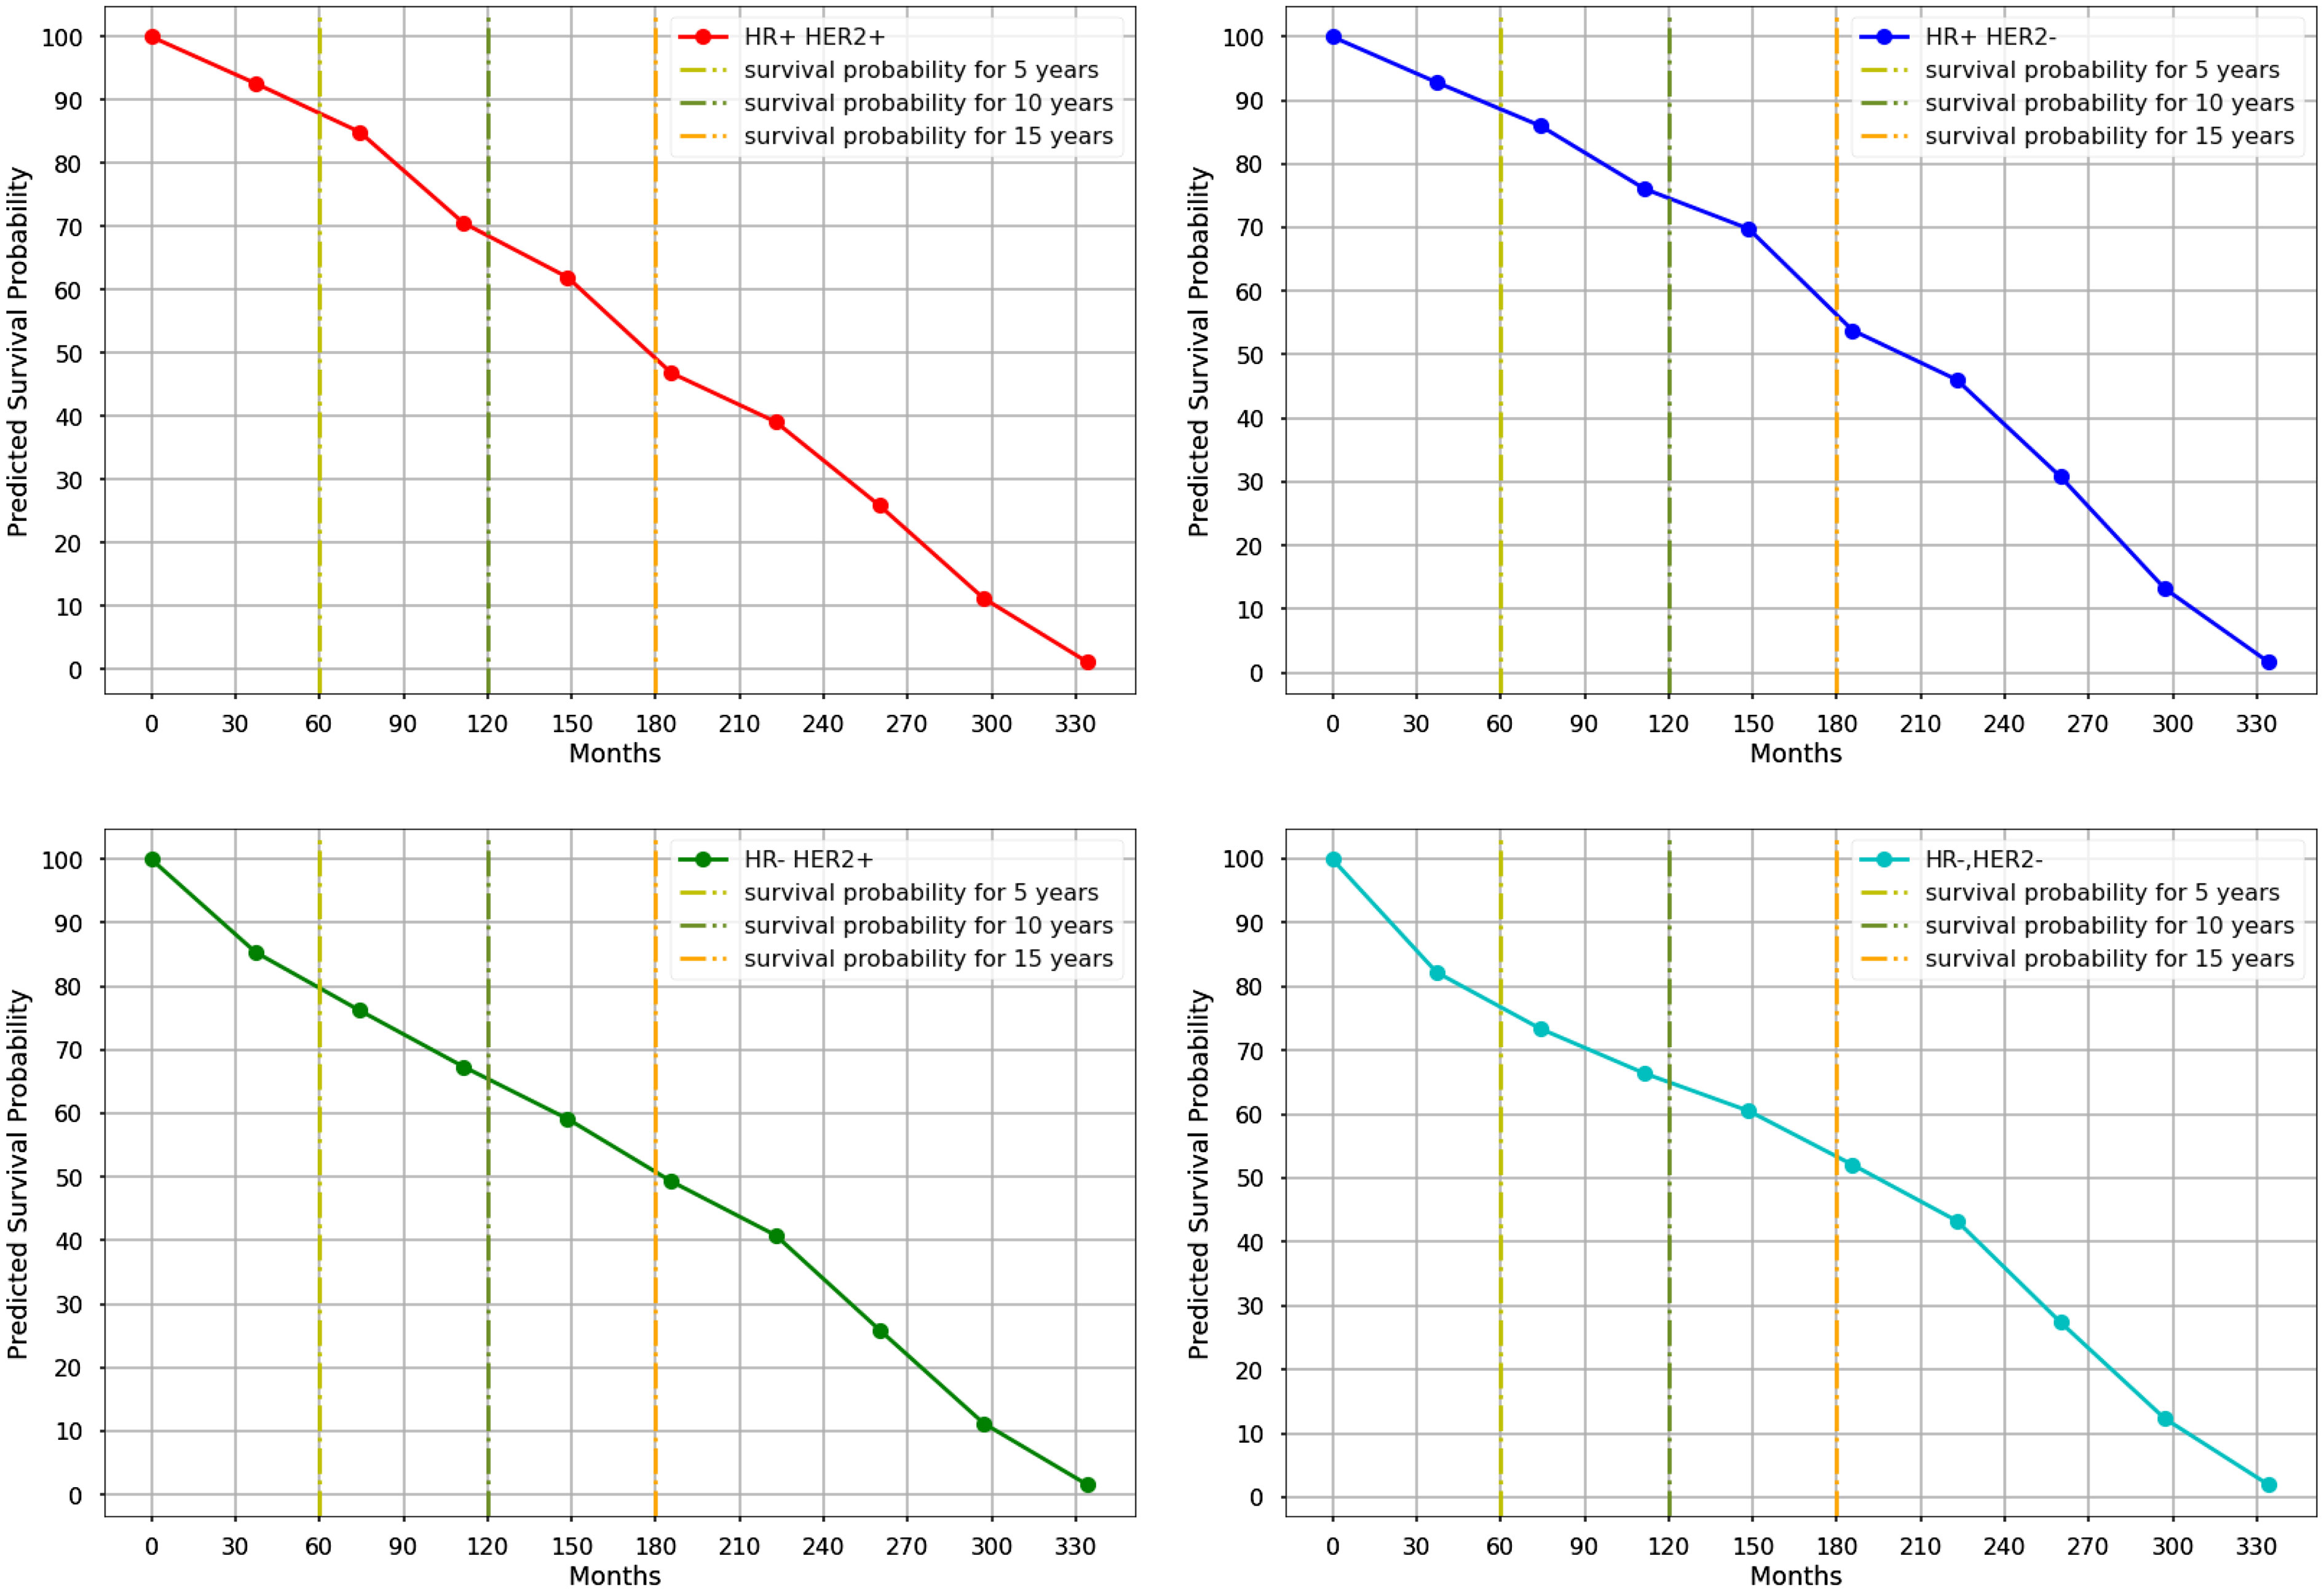
Figure 4 The Kaplan-Meyer curves of mean survival probabilities for each molecular subtype predicted by the Nnet-survival model, using three important variables, during 30 years of follow-up. (Red graph: Luminal B, Blue graph: Luminal A, Green graph: HER2-Enriched, Aqua graph: Triple-Negative).
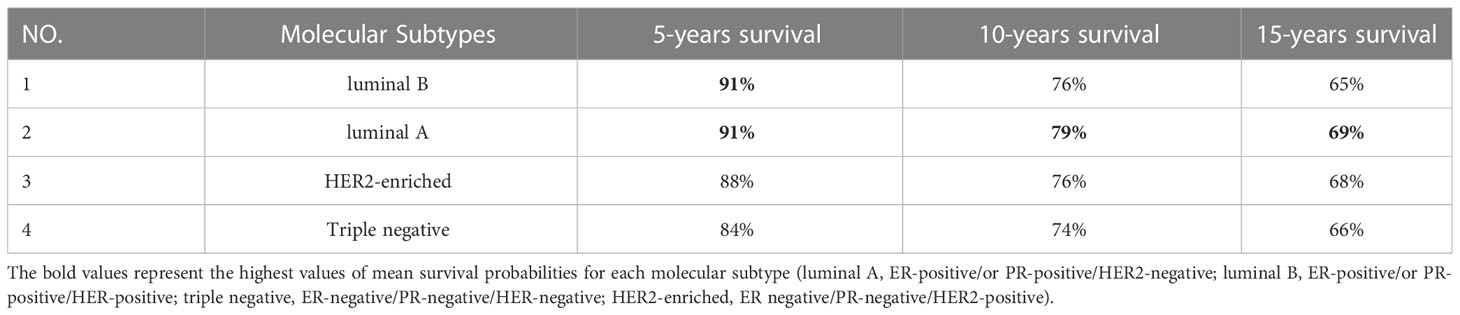
Table 5 Mean survival probability of each molecular subtype in different time periods predicted by Nnet-survival model developed with three most important variables.
4 Discussion
This is the largest study so far in Iran, predicting survival probabilities of BC patients in four molecular subtypes, defined by ER, PR, and HER2 status. All models (DeepHit, NMTLR, Nnet-survival, DeepSurve and Cox-Time) yielded very close C-index and IBS, with Nnet-survival slightly higher using both total and the most important variables.
The purpose of this study was to use machine learning methods to predict the survival probability of BC patients. Previous studies have relied on traditional models, such as the Cox regression model (32), to analyze time-to-event data. However, the Cox model and other parametric survival distributions are limited in their linear and inflexible form. The linearity of the risk function in survival applications, such as treatment recommendations for patients with different conditions, may be very simplistic and does not provide an accurate estimate of survival prediction due to the presence of complex patterns and non-linear relationships between different variables (16).
Recent studies have employed machine learning techniques to develop classification models that predict survivability (33–36). These models have mainly focused on interpretability to improve accuracy, and the outcome measure is often evaluated at a single time point. Furthermore, dealing with censored data in survival models based on machine learning classification models is frequently not discussed, and the flexibility associated with modeling the event probabilities as a function of time have been mostly neglected (34, 37–44). Additionally, previous studies on BC survival prediction did not consider some important issues such as feature importance, competent pre-processing steps, and using adequate sample size when developing their models (45, 46). In contrast, this study conducted comprehensive data pre-processing and variable selection procedure to develop an optimal and reliable model. Moreover, a grid search method was used to tune the hyperparameters of the neural network.
In this study, we utilized Random Forest feature importance to identify the most influential variables on survival time. Random Forest has been used for feature importance applications in many BC surveillance studies (47–50), due to its capacity to effectively process highly non-linear data (51, 52). We found that the six most important variables were age at diagnosis, tumor stage, axillary lymph node metastasis, type of surgery, lymph vascular invasion, and breast-feeding duration. These same variables were also defined as the most important variables in previous studies related to BC (35, 53). Furthermore, our findings suggested that the top three critical variables affecting survival probabilities were age at diagnosis, stage, and axillary lymph node metastasis. This is consistent with other studies which have demonstrated stage and axillary lymph node metastasis as the most significant predictors of BC prognosis (54, 55).
Subsequent studies have indicated that the chance of survival for BC patients decreased with increasing age at the diagnosis (56). Previous studies have demonstrated that age is an important risk factor in BC prognosis (57–60).However, due to the lack of consensus on different thresholds for age and the use of broad age groups, the role of this predictor remains controversial. Some studies have focused only on young or older women rather than all age groups (61, 62). In this study, we avoided categorizing the patients’ age and included all age groups. Additionally, tumor stage is also an important prognostic factor affecting BC survival time (63, 64). A study conducted in the Netherlands, found that tumor stage can affect overall survival in the current era of effective systemic therapy (65). Furthermore, metastasis to axillary lymph nodes is another chief factor affecting BC prognosis (66, 67). It has been noted that nearly 8% to 30% newly diagnosed BC are at an advanced stage, with extensive axillary lymph node metastasis (68). Results from a study in China found that BC patients with lower lymph node metastasis had more prolonged overall survival, disease-free survival, and distant metastasis-free survival compared to patients with more involvement of lymph node metastasis (69).
The models generated very close C-index and IBS scores trained with all 18, seven, and four variables. Furthermore, the survival probabilities of molecular subtypes acquired from the Nnet-survival model trained with the three most important variables showed similar patterns to results from the model trained with all variables (Supplementary Figure S1, S2). This suggests that using only the three most important variables instead of a large number of variables could result in a more robust and accurate model with less complexity.
Our results showed that the luminal A subtype had the highest predicted survival probabilities across the four molecular subtypes, with 91%, 80%, and 60% in 5-, 10-, and 15-year follow-ups, respectively. Our results (Supplementary Figure S1) also showed that the luminal B subtype followed a similar trend as luminal A for the first five years, after which the predicted survival probability decreased steadily and reached 77% and 50% in 10- and 15 years, respectively. This is consistent with Christine Inwald et al.’s study, which found that overall survival rates of luminal B (80.3%) and luminal A (87.5%) subtypes declined over 7-year where luminal A showed the best overall survival (70). Additionally, we found that the survival probabilities for triple-negative and HER2-enriched subtypes had a similar pattern with 82% in 5-year follow-up. The decreasing trend continued in both HER2-enriched and triple-negative subtypes; however, it was more pronounced in the HER2-enriched subtype with 70% and 54% predicted survival probabilities in 10- and 15-year follow-up, respectively. These findings confirm previous studies’ findings which indicated that the HER2-enriched subtype had a worse prognosis than the Luminal A subtype, although they were based on much shorter follow-up times (10, 71, 72). Moreover, the triple-negative subtype had a slight decrease with 72% predicted survival probability in 10-year and had the least decline compared to other subtypes between 10 and 15 years of follow-up. We observed higher survival probabilities in patients with luminal A and triple-negative subtypes after 12 years of follow-up, which suggests that successful therapeutic management is possible when considering all prognostic factors. Other related studies have reported that the mortality rate for the triple-negative subtype is initially high but gradually decreases over time, while the mortality rate for the luminal A subtype remains almost constant (8, 9).
Many studies have indicated that HER2-positive subtypes, regardless of ER and PR status, are associated with a poorer prognosis than other subtypes (7, 73, 74). Our findings showed that HER2 is a time-relevant factor and the survival probabilities for HER2-positive subtypes depend on both the time and ER/PR status. It is possible that hormonal therapy (tamoxifen or aromatase inhibitor) may have improved survival probabilities for the luminal B subtype in the first 12 years of follow-up. Additionally, it is conceivable that the earlier deaths of HER2-positive patients could be attributed to the unavailability of Trastuzumab between 1991 to 2009; this drug was approved by the US FDA in 2005 and became available in Iran in 2009 (75). Despite the advantages of Trastuzumab and other anti-HER2 therapies, a reduction in survival probabilities for luminal B subtype compared with HER2-enriched after 12 years suggests that these treatments, along with hormonal therapy, may not be reliable treatment strategies for luminal B patients. Therefore, it is recommended that HER2 status should be taken into greater consideration during BC treatment periods. For example, the cases whose life expectancy is restricted to less than five or ten years should not be evaluated by HER2 and its common treatments.
The current study was limited by potential biases of registry-based retrospective analyses (76). The major limitation, like any long-term retrospective analyses, was data censorship, which was addressed by using time-to-event survival models to model the relationships between covariates and individual survival time distributions. Furthermore, due to the varying coring and staining methods used in laboratories conducting IHC tests, some misclassification of cancer subtypes is unavoidable. Moreover, the relatively small number of patients in late time intervals posed a limitation to this study. As HER2 oncogene is positive in about 20% of primary BCs (74), the number of patients with HER2-positive subtypes decreased over time due to the decrease in total amount of data. Additionally, the number of events in the dataset decreased dramatically after 15 years of (Supplementary Figure S3), making it difficult to train a reliable survival model for data in late intervals (more than 15 years of follow-up). Despite all limitations, this study was able to assess BC patient survival over a long-term follow-up period and reveal differences across BC subtypes with greater precision.
5 Conclusions
In conclusion, we developed time-to-event deep learning models using data from a large institutional BC dataset in Iran to evaluate the survival prediction models. The best-performing model was used to predict survival probability in four BC molecular subtypes, in order to compare survival patterns over different time intervals since diagnosis. Our findings provide healthcare providers with the ability to determine patients’ survivability, better understand the effect of each treatment on different molecular subtypes and prevent unnecessary interventions for high-risk, particularly those with HER2 positive status, based on their molecular receptor status.
6 Recommendations for future studies
More broadly, our research is also needed to determine the survival probabilities for each subtype in different age and stage categories, in order to enable clinicians to make individualized treatment decisions that could influence clinical outcomes in patients’ short- and long-term survival. Moreover, the data used in this study was collected from an academic center in Iran’s capital, and therefore does not reflect the entire Iranian population. Considerably, further research will need to be conducted to compare outcome between patients with different backgrounds in Iran. However, the ultimate goal is to focus on other Asian countries where such research has barely been carried out. Additionally, existing survival models should be translated into new prediction tools for healthcare organizations, such as PREDICT (77), which enables the incorporation of BC molecular status into predictions of BC survival. Furthermore, more trials should be conducted to estimate the benefits and risks of hormonal therapy, anti-HER2 therapy, and chemotherapy for patients with different molecular profiles.
Data availability statement
The raw data supporting the conclusions of this article will be made available by the authors, without undue reservation. The python (v3.6) source codes used to develop time-to-event models are deposited in GitHub (https://github.com/sabazarean/Breast-Cancer-Survival-Prediction).
Ethics statement
Written informed consent was obtained from the individual(s) for the publication of any potentially identifiable images or data included in this article.
Author contributions
MEA and SZ conceived and planned the experiments. SZ, MAL, PM and MA carried out the analyses and experiments. SZ and AA contributed to the collection of the samples and clinical data. SZ, MA, and MEA contributed to the interpretation of the results. SZ, and MAL and PM took the lead in writing the manuscript. MEA and HE revised the manuscript. MEA and FA supervised the project. All authors reviewed and confirmed the manuscript.
Acknowledgments
This was part of the MSc thesis in Medical-Informatics. We would like to appreciate the staff and managers of Cancer Research Center of Shahid Beheshti University of Medical Sciences for their collaboration in this study. No financial support was received for this study.
Conflict of interest
The authors declare that the research was conducted in the absence of any commercial or financial relationships that could be construed as a potential conflict of interest.
Publisher’s note
All claims expressed in this article are solely those of the authors and do not necessarily represent those of their affiliated organizations, or those of the publisher, the editors and the reviewers. Any product that may be evaluated in this article, or claim that may be made by its manufacturer, is not guaranteed or endorsed by the publisher.
Supplementary material
The Supplementary Material for this article can be found online at: https://www.frontiersin.org/articles/10.3389/fonc.2023.1147604/full#supplementary-material
Supplementary Figure 1 | The comparison of Kaplan-Meyer curves of mean survival probabilities for each molecular subtype predicted by the Nnet-survival model, using all variables, during 30 years of follow-up. (Red graph: Luminal B, Blue graph: Luminal A, Green graph: HER2-Enriched, Aqua graph: Triple-Negative)
Supplementary Figure 2 | The comparison of Kaplan-Meyer curves of mean survival probabilities for each molecular subtype predicted by the Nnet-survival model, using the three important variables, during 30 years of follow-up. (Red graph: Luminal B, Blue graph: Luminal A, Green graph: HER2-Enriched, Aqua graph: Triple-Negative)
Supplementary Figure 3 | The distribution of the number of patients for each molecular subtype during the 30 years of follow-up.
Abbreviations
BC, Breast Cancer; ER, Estrogen receptor; PR, Progesterone receptor; HER2, Human epidermal growth factor receptor 2; IHC, Immunohistochemistry; MTLR, Multi-Task Logistic Regression; NMTLR, Neural Multi-Task Logistic Regression; SD, Standard deviation; C-index, Concordance index; IBS, Integrated Brier Score; CI, Confidence Interval; CRC, Cancer Research Center; SBMU, Shahid Beheshti University of Medical Science.
Footnotes
References
1. Sung H, Ferlay J, Siegel RL, Laversanne M, Soerjomataram I, Jemal A, et al. Global cancer statistics 2020: GLOBOCAN estimates of incidence and mortality worldwide for 36 cancers in 185 countries. CA Cancer J Clin (2021) 71(3):209–49. doi: 10.3322/caac.21660
2. Henderson IC, Patek AJ. The relationship between prognostic and predictive factors in the management of breast cancer. Breast Cancer Res Treat (1998) 52(1):261–88. doi: 10.1023/A:1006141703224
3. Perou CM, Sørlie T, Eisen MB, van de Rijn M, Jeffrey SS, Rees CA, et al. Molecular portraits of human breast tumours. Nature (2000) 406(6797):747–52. doi: 10.1038/35021093
4. Sørlie T, Perou CM, Tibshirani R, Aas T, Geisler S, Johnsen H, et al. Gene expression patterns of breast carcinomas distinguish tumor subclasses with clinical implications. Proc Natl Acad Sci U S A (2001) 98(19):10869–74. doi: 10.1073/pnas.191367098
5. Henson DE, Ries L, Freedman LS, Carriaga M. Relationship among outcome, stage of disease, and histologic grade for 22,616 cases of breast cancer. basis prognostic index Cancer (1991) 68(10):2142–9. doi: 10.1002/1097-0142(19911115)68:10<2142::aid-cncr2820681010>3.0.co;2-d
6. Bardou V-J, Arpino G, Elledge RM, Osborne CK, Clark GM. Progesterone receptor status significantly improves outcome prediction over estrogen receptor status alone for adjuvant endocrine therapy in two Large breast cancer databases. J Clin Oncol (2003) 21(10):1973–9. doi: 10.1200/JCO.2003.09.099
7. Buzdar AU, Ibrahim NK, Francis D, Booser DJ, Thomas ES, Theriault RL, et al. Significantly higher pathologic complete remission rate after neoadjuvant therapy with trastuzumab, paclitaxel, and epirubicin chemotherapy: results of a randomized trial in human epidermal growth factor receptor 2-positive operable breast cancer. J Clin Oncol Off J Am Soc Clin Oncol (2005) 23(16):3676–85. doi: 10.1200/JCO.2005.07.032
8. Haque R, Ahmed SA, Inzhakova G, Shi J, Avila C, Polikoff J, et al. Impact of breast cancer subtypes and treatment on survival: an analysis spanning two decades. Cancer Epidemiol Biomarkers Prev Publ Am Assoc Cancer Res cosponsored by Am Soc Prev Oncol (2012) 21(10):1848–55. doi: 10.1158/1055-9965.EPI-12-0474
9. Blows FM, Driver KE, Schmidt MK, Broeks A, van Leeuwen FE, Wesseling J, et al. Subtyping of breast cancer by immunohistochemistry to investigate a relationship between subtype and short and long term survival: a collaborative analysis of data for 10,159 cases from 12 studies. PloS Med (2010) 7(5):e1000279. doi: 10.1371/journal.pmed.1000279
10. Poorolajal J, Nafissi N, Akbari ME, Mahjub H, Esmailnasab N, Babaee E. Breast cancer survival analysis based on immunohistochemistry subtypes (ER/PR/HER2): a retrospective cohort study. Arch Iran Med (2016) 19(10):680–6.
11. Aria M, Nourani E, Golzari Oskouei A. ADA-COVID: adversarial deep domain adaptation-based diagnosis of COVID-19 from lung CT scans using triplet embeddings. Liu J Ed Comput Intell Neurosci (2022) 2022:2564022. doi: 10.1155/2022/2564022
12. Ghaderzadeh M, Aria M. Management of covid-19 detection using artificial intelligence in 2020 pandemic. In Proceedings of the 5th International Conference on Medical and Health Informatics (ICMHI '21). New York, NY, USA:Association for Computing Machinery (2021). pp. 32–8. doi: 10.1145/3472813.3472820
13. Bayani A, Asadi F, Hosseini A, Hatami B, Kavousi K, Aria M, et al. Performance of machine learning techniques on prediction of esophageal varices grades among patients with cirrhosis. Clin Chem Lab Med (2022) 60(12):1955–62. doi: 10.1515/cclm-2022-0623
14. Kvamme H, Borgan Ø, Scheel I. Time-to-Event prediction with neural networks and cox regression. J Mach Learn Res (2019) 20(129):1–30. doi: 10.48550/arXiv.1907.00825
15. Lee C, Zame WR, Yoon J, van der Schaar M. DeepHit: a deep learning approach to survival analysis with competing risks. 32nd AAAI Conf Artif Intell AAAI 2018 (2018) 32(1):2314–21. doi: 10.1609/aaai.v32i1.11842
16. Katzman JL, Shaham U, Cloninger A, Bates J, Jiang T, Kluger Y. DeepSurv: personalized treatment recommender system using a cox proportional hazards deep neural network. BMC Med Res Methodol (2018) 18(1):1–12. doi: 10.1186/s12874-018-0482-1
17. Fotso S. Deep neural networks for survival analysis based on a multi-task framework. arXiv preprint arXiv (2018). 1801.05512. doi: 10.48550/arxiv.1801.05512
18. Kvamme H, Borgan Ø. Continuous and discrete-time survival prediction with neural networks. Lifetime Data Anal (2021) 27(4):710–36. doi: 10.1007/s10985-021-09532-6
19. Gensheimer MF, Narasimhan B. A scalable discrete-time survival model for neural networks. PeerJ (2019) 7:e6257. doi: 10.7717/peerj.6257
20. Edge SB, Byrd DR, Compton CC, Fritz AG, Greene FL, Trotti A. editors. AJCC cancer staging manual. (7th Edition). New York, NY: Springer (2010). Available at: http://www.springer.com/medicine/surgery/book/978-0-387-88440-0.
21. Pauletti G, Godolphin W, Press MF, Slamon DJ. Detection and quantitation of HER-2/neu gene amplification in human breast cancer archival material using fluorescence in situ hybridization. Oncogene (1996) 13(1):63–72.
22. Tanner M, Gancberg D, Di Leo A, Larsimont D, Rouas G, Piccart MJ, et al. Chromogenic in situ hybridization: a practical alternative for fluorescence in situ hybridization to detect HER-2/neu oncogene amplification in archival breast cancer samples. Am J Pathol (2000) 157(5):1467–72. doi: 10.1016/S0002-9440(10)64785-2
23. Breiman L, Friedman JH, Stone CJ, Olshen RA. Classification and regression trees. 1 st. Taylor & Francis (1984) Available from: https://books.google.com/books?id=JwQx-WOmSyQ.
25. Ishwaran H, Lu M. Standard errors and confidence intervals for variable importance in random forest regression, classification, and survival. Stat Med (2019) 38(4):558–82. doi: 10.1002/sim.7803
26. Strobl C, Malley J, Tutz G. An introduction to recursive partitioning: rationale, application, and characteristics of classification and regression trees, bagging, and random forests. Psychol Methods (2009) 14(4):323–48. doi: 10.1037/a0016973
27. Yu C-N, Greiner R, Lin H-C, Baracos V. Learning patient-specific cancer survival distributions as a sequence of dependent regressors. In: Advances in Neural Information Processing Systems 24: 25th Annual Conference on Neural Information Processing Systems 2011; 12-14 December 2011; Granada, Spain. pp. 1845-53. Available at: http://papers.nips.cc/paper/4210-learning-patient-specific-cancer-survival-distributions-as-a-sequence-of-dependent-regressors.
28. Guo C, Berkhahn F. Entity embeddings of categorical variables. CoRR (2016) abs/1604.0. doi: 10.48550/arXiv.1604.06737
29. Aria M, Hashemzadeh M, Farajzadeh N. QDL-CMFD: a quality-independent and deep learning-based copy-move image forgery detection method. Neurocomputing (2022) 511:213–36. doi: 10.1016/j.neucom.2022.09.017
30. Antolini L, Boracchi P, Biganzoli E. A time-dependent discrimination index for survival data. Stat Med (2005) 24(24):3927–44. doi: 10.1002/sim.2427
31. Graf E, Schmoor C, Sauerbrei W, Schumacher M. Assessment and comparison of prognostic classification schemes for survival data. Stat Med (1999) 18 17-18:2529–45. doi: 10.1002/(SICI)1097-0258(19990915/30)18:17/18<2529::AID-SIM274>3.0.CO;2-5
32. Cox DR. Regression models and life-tables. J R Stat Soc Ser B (1972) 34(2):187–220. doi: 10.1111/j.2517-6161.1972.tb00899.x
33. Kate RJ, Nadig R. Stage-specific predictive models for breast cancer survivability. Int J Med Inform (2017) 97:304–11. doi: 10.1016/j.ijmedinf.2016.11.001
34. Montazeri M, Montazeri M, Montazeri M, Beigzadeh A. Machine learning models in breast cancer survival prediction. Technol Heal Care Off J Eur Soc Eng Med (2016) 24(1):31–42. doi: 10.3233/THC-151071
35. Ganggayah MD, Taib NA, Har YC, Lio P, Dhillon SK. Predicting factors for survival of breast cancer patients using machine learning techniques. BMC Med Inform Decis Mak (2019) 19(1):48. doi: 10.1186/s12911-019-0801-4
36. Ferroni P, Zanzotto FM, Riondino S, Scarpato N, Guadagni F, Roselli M. Breast cancer prognosis using a machine learning approach. Cancers (Basel) (2019) 11(3):328. doi: 10.3390/cancers11030328
37. Sarvestani AS, Safavi AA, Parandeh NM, Salehi M. Predicting breast cancer survivability using data mining techniques. 2010 2nd Int Conf Softw Technol Eng (2010) 2:V2–227-V2-231. doi: 10.1109/ICSTE.2010.5608818
38. Kalafi EY, Nor NAM, Taib NA, Ganggayah MD, Town C, Dhillon SK. Machine learning and deep learning approaches in breast cancer survival prediction using clinical data. Folia Biol (Praha) (2019) 65(5-6):212–20.
39. Lotfnezhad Afshar H, Jabbari N, Khalkhali HR, Esnaashari O. Prediction of breast cancer survival by machine learning methods: an application of multiple imputation. Iran J Public Health (2021) 50(3):598–605. doi: 10.18502/ijph.v50i3.5606
40. Endo A, Shibata T, Tanaka H. Comparison of seven algorithms to predict breast cancer Survival(Contribution to 21 century intelligent technologies and bioinformatics). BioMed fuzzy Hum Sci Off J BioMed Fuzzy Syst Assoc (2008) 13:11–6.
41. Khan MU, Choi JP, Shin H, Kim M. Predicting breast cancer survivability using fuzzy decision trees for personalized healthcare. Annu Int Conf IEEE Eng Med Biol Soc (2008) 2008:5148–51. doi: 10.1109/IEMBS.2008.4650373
42. Choi JP, Han TH, Park RW. A hybrid Bayesian network model for predicting breast cancer prognosis. J Korean Soc Med Inf (2009) 15(1):49–57. doi: 10.4258/jksmi.2009.15.1.49
43. Hussain O. Predicting breast cancer survivability a comparison of three data mining methods. Cihan Univ J Humanit Soc Sci (2020) 4(1):17–30. doi: 10.24086/cuejhss.v4n1y2020.pp17-30
44. Haque MN, Tazin T, Khan MM, Faisal S, Ibraheem SM, Algethami H, et al. Predicting characteristics associated with breast cancer survival using multiple machine learning approaches. Comput Math Methods Med (2022) 2022:1249692. doi: 10.1155/2022/1249692
45. Wetstein SC, de Jong VMT, Stathonikos N, Opdam M, Dackus GMHE, Pluim JPW, et al. Deep learning-based breast cancer grading and survival analysis on whole-slide histopathology images. Sci Rep (2022) 12(1):15102. doi: 10.1038/s41598-022-19112-9
46. Gupta S, Tran T, Luo W, Phung D, Kennedy RL, Broad A, et al. Machine-learning prediction of cancer survival: a retrospective study using electronic administrative records and a cancer registry. BMJ Open (2014) 4(3):e004007. doi: 10.1136/bmjopen-2013-004007
47. Najafi-Vosough R, Faradmal J, Tapak L, Alafchi B, Najafi-Ghobadi K, Mohammadi T. Prediction the survival of patients with breast cancer using random survival forests for competing risks. J Prev Med Hyg (2022) 63(2):E298–303. doi: 10.15167/2421-4248/jpmh2022.63.2.2405
48. Kim DW, Lee S, Kwon S, Nam W, Cha I-H, Kim HJ. Deep learning-based survival prediction of oral cancer patients. Sci Rep (2019) 9(1):6994. doi: 10.1038/s41598-019-43372-7
49. Omurlu IK, Ture M, Tokatli F. The comparisons of random survival forests and cox regression analysis with simulation and an application related to breast cancer. Expert Syst Appl Int J (2009) 36(4):8582–8. doi: 10.1016/j.eswa.2008.10.023
50. Nicolò C, Périer C, Prague M, Bellera C, MacGrogan G, Saut O, et al. Machine learning and mechanistic modeling for prediction of metastatic relapse in early-stage breast cancer. JCO Clin Cancer Inf (2020) 4:259–74. doi: 10.1200/CCI.19.00133
51. Mosca E, Alfieri R, Merelli I, Viti F, Calabria A, Milanesi L. A multilevel data integration resource for breast cancer study. BMC Syst Biol (2010) 4(1):76. doi: 10.1186/1752-0509-4-76
52. Lebedev AV, Westman E, Van Westen GJP, Kramberger MG, Lundervold A, Aarsland D, et al. Random forest ensembles for detection and prediction of alzheimer’s disease with a good between-cohort robustness. NeuroImage Clin (2014) 6:115–25. doi: 10.1016/j.nicl.2014.08.023
53. Baghestani AR, Shahmirzalou P, Zayeri F, Akbari ME, Hadizadeh M. Prognostic factors for survival in patients with breast cancer referred to cancer research center in Iran. Asian Pac J Cancer Prev (2015) 16(12):5081–4. doi: 10.7314/apjcp.2015.16.12.5081
54. Fisher B, Bauer M, Wickerham DL, Redmond CK, Fisher ER, Cruz AB, et al. Relation of number of positive axillary nodes to the prognosis of patients with primary breast cancer. an NSABP update. Cancer (1983) 52(9):1551–7. doi: 10.1002/1097-0142(19831101)52:9<1551::aid-cncr2820520902>3.0.co;2-3
55. McCready DR, Chapman JA, Hanna WM, Kahn HJ, Murray D, Fish EB, et al. Factors affecting distant disease-free survival for primary invasive breast cancer: use of a log-normal survival model. Ann Surg Oncol (2000) 7(6):416–26. doi: 10.1007/s10434-000-0416-z
56. Fourquet A, Campana F, Zafrani B, Mosseri V, Vielh P, Durand J-C, et al. Prognostic factors of breast recurrence in the conservative management of early breast cancer: a 25-year follow-up. Int J Radiat Oncol Biol Phys (1989) 17(4):719–25. doi: 10.1016/0360-3016(89)90057-6
57. Sant M, Chirlaque Lopez MD, Agresti R, Pérez MJS, Holleczek B, Bielska-Lasota M, et al. Survival of women with cancers of breast and genital organs in Europe 1999-2007: results of the EUROCARE-5 study. Eur J Cancer (2015) 51(15):2191–205. doi: 10.1016/j.ejca.2015.07.022
58. Wong FY, Tham WY, Nei WL, Lim C, Miao H. Age exerts a continuous effect in the outcomes of Asian breast cancer patients treated with breast-conserving therapy. Cancer Commun (London England) (2018) 38(1):39. doi: 10.1186/s40880-018-0310-3
59. Meshkat M, Baghestani AR, Zayeri F, Khayamzadeh M, Akbari ME. Survival rate and prognostic factors among Iranian breast cancer patients. Iran J Public Health (2020) 49(2):341–50. doi: 10.18502/ijph.v49i2.3102
60. Akbari ME, Akbari A, Khayamzadeh M, Salmanian R, Akbari M. Ten-year survival of breast cancer in Iran: a national study (Retrospective cohort study). Breast Care (Basel) (2023) 18(1):12–21. doi: 10.1159/000526746
61. Parvizpour S, Razmara J, Omidi Y. Breast cancer vaccination comes to age: impacts of bioinformatics. Bioimpacts (2018) 8(3):223–35. doi: 10.15171/bi.2018.25
62. Vostakolaei FA, Broeders MJM, Rostami N, van Dijck JAAM, Feuth T, Kiemeney LALM, et al. Age at diagnosis and breast cancer survival in iran. Int J Breast Cancer (2012) 2012:517976. doi: 10.1155/2012/517976
63. Ho-Huynh A, Tran A, Bray G, Abbot S, Elston T, Gunnarsson R, et al. Factors influencing breast cancer outcomes in Australia: a systematic review. Eur J Cancer Care (Engl) (2019) 28(4):e13038. doi: 10.1111/ecc.13038
64. Joko-Fru WY, Miranda-Filho A, Soerjomataram I, Egue M, Akele-Akpo M-T, N'da G, et al. Breast cancer survival in sub-Saharan Africa by age, stage at diagnosis and human development index: a population-based registry study. Int J Cancer (2020) 146(5):1208–18. doi: 10.1002/ijc.32406
65. Saadatmand S, Bretveld R, Siesling S, Tilanus-Linthorst MMA. Influence of tumour stage at breast cancer detection on survival in modern times: population based study in 173,797 patients. BMJ (2015) 351:h4901. doi: 10.1136/bmj.h4901
66. Danko ME, Bennett KM, Zhai J, Marks JR, Olson JAJ. Improved staging in node-positive breast cancer patients using lymph node ratio: results in 1,788 patients with long-term follow-up. J Am Coll Surg (2010) 210(5):797–805.e1, 805-807. doi: 10.1016/j.jamcollsurg.2010.02.045
67. Kim J-M, Kim J-Y, Jung EJ, Kwag SJ, Park J-H, Park T, et al. The prognosis factors among breast cancer patients with extensive axillary lymph node metastasis. Korean J Clin Oncol (2018) 14(1):43–7. doi: 10.14216/kjco.18007
68. Newman LA. Epidemiology of locally advanced breast cancer. In: Seminars in radiation oncology, vol. 19. Elsevier (2009). p. 195–203.
69. Wu S-G, He Z-Y, Li Q, Sun JY, Li F-Y, Lin Q, et al. Prognostic value of metastatic axillary lymph node ratio for Chinese breast cancer patients. PloS One (2013) 8(4):e61410. doi: 10.1371/journal.pone.0061410
70. Inwald EC, Koller M, Klinkhammer-Schalke M, Zeman F, Hofstädter F, Gerstenhauer M, et al. 4-IHC classification of breast cancer subtypes in a large cohort of a clinical cancer registry: use in clinical routine for therapeutic decisions and its effect on survival. Breast Cancer Res Treat (2015) 153(3):647–58. doi: 10.1007/s10549-015-3572-3
71. Kongsiang A, Tangvoraphonkchai V, Jirapornkul C, Promthet S, Kamsa-Ard S, Suwanrungruang K. Survival time and molecular subtypes of breast cancer after radiotherapy in Thailand. Asian Pac J Cancer Prev (2014) 15(23):10505–8. doi: 10.7314/apjcp.2014.15.23.10505
72. Minicozzi P, Bella F, Toss A, Giacomin A, Fusco M, Zarcone M, et al. Relative and disease-free survival for breast cancer in relation to subtype: a population-based study. J Cancer Res Clin Oncol (2013) 139(9):1569–77. doi: 10.1007/s00432-013-1478-1
73. Slamon DJ, Clark GM, Wong SG, Levin WJ, Ullrich A, McGuire WL. Human breast cancer: correlation of relapse and survival with amplification of the HER-2/neu oncogene. Science (1987) 235(4785):177–82. doi: 10.1126/science.3798106
74. Shak S. Overview of the trastuzumab (Herceptin) anti-HER2 monoclonal antibody clinical program in HER2-overexpressing metastatic breast cancer. herceptin multinational investigator study group. Semin Oncol (1999) 26(4 Suppl 12):71–7.
75. Rajaeifard AR, Baneshi MR, Taleei AR, Mehrbani D. SURVIVAL MODELS IN BREAST CANCER PATIENTS. Iran RED CRESCENT Med J (2009) 11(3):295–300.
76. Izquierdo JN, Schoenbach VJ. The potential and limitations of data from population-based state cancer registries. Am J Public Health (2000) 90(5):695–8. doi: 10.2105/ajph.90.5.695
Keywords: breast cancer survival prediction, breast cancer molecular subtypes, survival prediction models, survival analysis, time-to-event machine learning models, deep learning survival models, feature importance, AI application in breast cancer
Citation: Zarean Shahraki S, Azizmohammad Looha M, Mohammadi kazaj P, Aria M, Akbari A, Emami H, Asadi F and Akbari ME (2023) Time-related survival prediction in molecular subtypes of breast cancer using time-to-event deep-learning-based models. Front. Oncol. 13:1147604. doi: 10.3389/fonc.2023.1147604
Received: 18 January 2023; Accepted: 19 May 2023;
Published: 05 June 2023.
Edited by:
Alessandro Bria, University of Cassino, ItalyReviewed by:
Ilze Strumfa, Riga Stradiņš University, LatviaXiuting Liu, Washington University in St. Louis, United States
Anca Maria Cimpean, Victor Babes University of Medicine and Pharmacy, Romania
Copyright © 2023 Zarean Shahraki, Azizmohammad Looha, Mohammadi kazaj, Aria, Akbari, Emami, Asadi and Akbari. This is an open-access article distributed under the terms of the Creative Commons Attribution License (CC BY). The use, distribution or reproduction in other forums is permitted, provided the original author(s) and the copyright owner(s) are credited and that the original publication in this journal is cited, in accordance with accepted academic practice. No use, distribution or reproduction is permitted which does not comply with these terms.
*Correspondence: Mohammad Esmaeil Akbari, profmeakbari@gmail.com; Farkhondeh Asadi, asadifar@sbmu.ac.ir