 Kaiying Yang
 Tong Qiu
 Xue Gong
 Jiangyuan Zhou
 Yuru Lan
 Siyuan Chen
 Yi Ji
Yi Ji- 1Division of Oncology, Department of Pediatric Surgery, West China Hospital of Sichuan University, Chengdu, Sichuan, China
- 2Department of Pediatric Surgery, Guangzhou Women and Children’s Medical Center, National Children’s Medical Center for South Central Region, Guangzhou Medical University, Guangzhou, China
- 3Pediatric Intensive Care Unit, Department of Critical Care Medicine, West China Hospital of Sichuan University, Chengdu, China
Infantile hemangioma (IH) is the most common benign tumor in children. However, the exact pathogenesis of IH remains unclear. Integrated nontargeted and targeted metabolic analyses were performed to obtain insight into the possible pathogenic mechanism of IH. The results of nontargeted metabolic analysis showed that 216 and 128 differential metabolites (DMs) were identified between hemangioma-derived endothelial cells (HemECs) and HUVECs in positive-ion and negative-ion models, respectively. In both models, these DMs were predominantly enriched in pathways related to amino acid metabolism, including aminoacyl-tRNA biosynthesis and arginine and proline metabolism. Then, targeted metabolic analysis of amino acids was further performed to further clarify HemEC metabolism. A total of 22 amino acid metabolites were identified, among which only 16 metabolites, including glutamine, arginine and asparagine, were significantly differentially expressed between HemECs and HUVECs. These significant amino acids were significantly enriched in 10 metabolic pathways, including ‘alanine, aspartate and glutamate metabolism’, ‘arginine biosynthesis’, ‘arginine and proline metabolism’, and ‘glycine, serine and threonine metabolism’. The results of our study revealed that amino acid metabolism is involved in IH. Key differential amino acid metabolites, including glutamine, asparagine and arginine, may play an important role in regulating HemEC metabolism.
1 Introduction
Infantile hemangioma (IH) is the most common benign tumor in children, with a prevalence of 4%-5% (1). The growth pattern that characterizes IH involves a proliferating phase for 1 year after birth, followed by spontaneous involution for several years. Most IHs are small and self-resolving; therefore, treatment is not necessary (2). However, approximately 10% of IHs are potentially problematic and can cause significant complications and morbidities, including ulceration, obstruction, functional impairment and disfigurement (3). Although β-adrenergic receptor antagonists, including propranolol, atenolol, and timolol, have exhibited remarkable efficacy in IH treatments, the exact pathogenesis of IH is not well understood (3–6).
In the proliferating phase of IH, hemangioma-derived endothelial cells (HemECs) are the predominant cell type. It is widely accepted that endothelial cell (EC) angiogenesis plays a vital role in the development of IH (7). ECs are stimulated by factors such as vascular endothelial growth factor (VEGF) and hypoxia; thus, ECs have the capability to rapidly switch their metabolic state from a quiescent state to an angiogenic state, resulting in the activation of EC angiogenesis (8). To date, EC metabolism has been recognized as a driving force of angiogenesis (9). Several metabolic pathways are involved in EC metabolism, including glucose metabolism (glycolysis), fatty acid oxidation, and amino acid metabolism. Our previous study revealed that glucose metabolism may play an important role in the pathogenesis of IH (10). However, little is known about the metabolic profiles and role of HemEC in the development of IH.
Metabolomics aims to measure a wide variety of small molecules (metabolome) in the context of physiological stimuli or disease states (11). With the development of mass spectrometry, metabolomics has become a valuable approach to identify biomarkers for diagnosis, prognosis, or treatment efficacy (12). Thus, the present study was performed to investigate the metabolic profiles of HemECs and to understand the complex mechanism underlying the development of IH using integrated nontargeted and targeted metabolomic analysis. Our results suggest that amino acid metabolism is involved in HemEC metabolism.
2 Material and methods
2.1 Cell culture and reagents
Endothelial basal medium (EBM-2, CC-3156) containing the EGM-2 growth factors (CC-4176) was obtained from Lonza (Walkersville, MD, USA). EC medium (ECM) was obtained from ScienCell (CA, USA). Fetal bovine serum (FBS), phosphate-buffered saline (PBS), penicillin and streptomycin were purchased from Gibco (Grand Island, NY, USA).
HemEC isolation was performed as described previously (13, 14). Totally, tissues from six proliferating IHs and four involuting IHs were collected. Detailed information on the six patients is presented in Table S1. The HemECs were cultured in EBM-2 containing 10% FBS, 100 U/ml penicillin and 10 µg/ml streptomycin at 37°C containing 5% CO2. Human umbilical vein ECs (HUVECs) were obtained from the Chinese Academy of Sciences and cultured in ECM (ScienceCell) plus 10% FBS and with EGM-2 growth factors (CC-4176). This study was approved by the Ethics Committee of the West China Hospital of Sichuan University. The design of our research in this text was approved by the West China Hospital of Sichuan University.
2.2 Nontargeted metabolomics analysis using ultrahigh-performance liquid chromatography
2.2.1 Sample collection and preparation
HemECs and HUVECs were cultured in EBM-2 and ECM medium, respectively. Then, after 24 hours in culture, the cells were collected and stored at -80°C before further processing for UHPLC analysis.
2.2.2 Metabolite extraction
After the samples were freeze-dried, two hundred microliters of water was added. After 30 s of vortexing, the samples were thawed with liquid nitrogen 3 times. The samples were sonicated for 10 min in an ice water bath. Fifty microliters of homogenate was used to measure the protein concentration. Different volume samples were transferred to an EP tube, and water was replenished to 150 μL. See the attached table for details. Then, 600 μL acetonitrile: methanol (1: 1) with an isotopically labeled internal standard mixture was added and transferred to a 2 mL EP tube. After 30 s of vortexing, the samples were incubated at -40°C for 1 h and centrifuged at 12000 (RCF=13800 g, R=8.6 cm) rpm for 15 min at 4°C. Then, 700 μL of supernatant was transferred to an EP tube and dried in a vacuum concentrator. Next, 80 μL acetonitrile: methanol: water = 2: 2: 1 was added to the sample. After 30 s of vortexing, the samples were sonicated for 10 min in an ice-water bath. Then, the samples were centrifuged at 12000 (RCF=1380 (×g), R= 8.6 cm) rpm for 15 min at 4 °C. The resulting supernatant was transferred to a fresh glass vial for analysis. A quality control (QC) sample was prepared by mixing an equal aliquot of the supernatants from all samples.
2.2.3 LC−MS/MS analysis
LC−MS/MS analyses were performed using an UHPLC system (Vanquish, Thermo Fisher Scientific) with a UPLC BEH Amide column (2.1 mm × 100 mm, 1.7 μm) coupled to a Q Exactive HFX mass spectrometer (Orbitrap MS, Thermo). The mobile phase consisted of 25 mmol/L ammonium acetate and 25 ammonia hydroxide in water (pH = 9.75) (A) and acetonitrile (B). The autosampler temperature was 4°C, and the injection volume was 4 μL.
The QE HFX mass spectrometer was used for its ability to acquire MS/MS spectra in information-dependent acquisition (IDA) mode under the control of acquisition software (Xcalibur, Thermo). In this mode, the acquisition software continuously evaluates the full scan MS spectrum. The ESI source conditions were set as follows: sheath gas flow rate, 30 Arb; Aux gas flow rate, 25 Arb; capillary temperature, 350 °C; full MS resolution, 120,000; MS/MS resolution, 7500; collision energy, 10/30/60 in NCE mode; and spray voltage, 3.6 kV (positive) or -3.2 kV (negative).
2.2.4 Data preprocessing and annotation
The raw data were converted to the mzXML format using ProteoWizard and processed with an in-house program, which was developed using R and based on XCMS, for peak detection, extraction, alignment, and integration. Then, an in-house MS2 database (BiotreeDB) was applied for metabolite annotation. The cutoff for annotation was set at 0.3.
2.3 Targeted metabolomics analysis of amino acids
2.3.1 Sample collection and preparation
HemECs and HUVECs were cultured in EBM-2 and ECM medium, respectively. Then, after 24 hours in culture, the cells were collected and stored at -80°C before being further processed for UHPLC−MS/MS analysis.
2.3.2 Metabolite extraction
The samples were centrifuged at 1500 rpm (RCF=216(×g), R= 8.6 cm) and 4°C for 5 min to remove PBS. After 300 μL of water was added, the samples were vortexed for 30 s. The samples were precooled in dry ice and subjected to repeated freeze−thaw cycles three times in liquid nitrogen. The samples were vortexed for 30 s and sonicated for 15 min in an ice-water bath. A 250 μL aliquot of clear supernatant was transferred to a new EP tube before a 1000 μL aliquot of extract solvent (1:1 acetonitrile-methanol containing isotopically labeled internal standard mixture, precooled at -40 °C) was added. The remaining sample supernatant was measured for protein content. After the samples were incubated at -40 °C for one hour and centrifuged at 12000 rpm (RCF=13800 (×g), R= 8.6 cm) and 4 °C for 15 min, an 80 μL aliquot of the clear supernatant was transferred to an autosampler vial for UHPLC−MS/MS analysis.
2.3.3 UHPLC-MRM-MS analysis
UHPLC separation was carried out using an Agilent 1290 Infinity II series UHPLC System (Agilent Technologies) equipped with a Waters ACQUITY UPLC BEH Amide column (100 × 2.1 mm, 1.7 μm). Mobile phase A was 1% formic acid in water, and mobile phase B was 1% formic acid in acetonitrile. The column temperature was set at 35°C. The autosampler temperature was set at 4°C, and the injection volume was 1 μL.
An Agilent 6460 triple quadrupole mass spectrometer (Agilent Technologies) equipped with an AJS electrospray ionization (AJS-ESI) interface was applied for assay development. The typical ion source parameters were capillary voltage = +4000/-3500 V, nozzle voltage = +500/-500 V, gas (N2) temperature = 300°C, gas (N2) flow rate = 5 L/min, sheath gas (N2) temperature = 250°C, sheath gas flow rate = 11 L/min, and nebulizer pressure = 45 psi.
The MRM parameters for each of the targeted analytes were optimized using flow injection analysis by injecting the standard solutions of the individual analytes into the API source of the mass spectrometer. Several of the most sensitive transitions were used in MRM scan mode to optimize the collision energy for each Q1/Q3 pair. Among the optimized MRM transitions per analyte, the Q1/Q3 pairs that showed the highest sensitivity and selectivity were selected as ‘quantifiers’ for quantitative monitoring. The additional transitions acted as ‘qualifiers’ to verify the identity of the target analytes.
Agilent MassHunter Work Station Software (B.08.00, Agilent Technologies) was employed for MRM data acquisition and processing.
2.4 Statistical analysis
Univariate analysis was conducted, including Student’s t test and fold change (FC) analysis. Multivariate analysis included unsupervised principal component analysis (PCA) and orthogonal partial least squares discriminant analysis (OPLS-DA). The variable importance in the projection (VIP) value (>1) in the OPLS-DA model and P value analyzed by Student’s t test were combined to confirm the significance of differential metabolites (DMs). DMs were considered significant when VIP > 1 and P value < 0.05. Kyoto Encyclopedia of Genes and Genomes (KEGG) pathway enrichment analysis for significant DMs was conducted by the MetaboAnalyst online tool (15, 16).
3 Results
3.1 Nontargeted metabolomics analysis between HUVECs and HemECs
3.1.1 Multivariate statistical analysis
To analyze the metabolic changes between HUVECs and HemECs, nontargeted metabolomics analysis was performed using LC−MS/MS. Plots for the unsupervised PCA score showed a clear separation between HUVECs and HemECs in both positive-ion and negative-ion modes (Figure 1A). Compared to PCA, supervised OPLS-DA is a more appropriate model to differentiate origins when many factors can affect metabolite profiles (17). Then, OPLS-DA was conducted to further differentiate the metabolic profiles of HUVECs and HemECs. The results showed that HUVECs were also separated clearly from HemECs by the OPLS-DA score plots in both modes (Figure 1B). Additionally, further permutation tests demonstrated that the model was not overfitted (positive-ion model: R2Y= (0.0, 0.87), Q2Y= (0.0, -0.79); negative-ion model: R2Y= (0.0, 0.86), Q2Y= (0.0, -0. 74); Figure 1C). Together, these data indicated that the metabolic change between HUVECs and HemECs was significant.
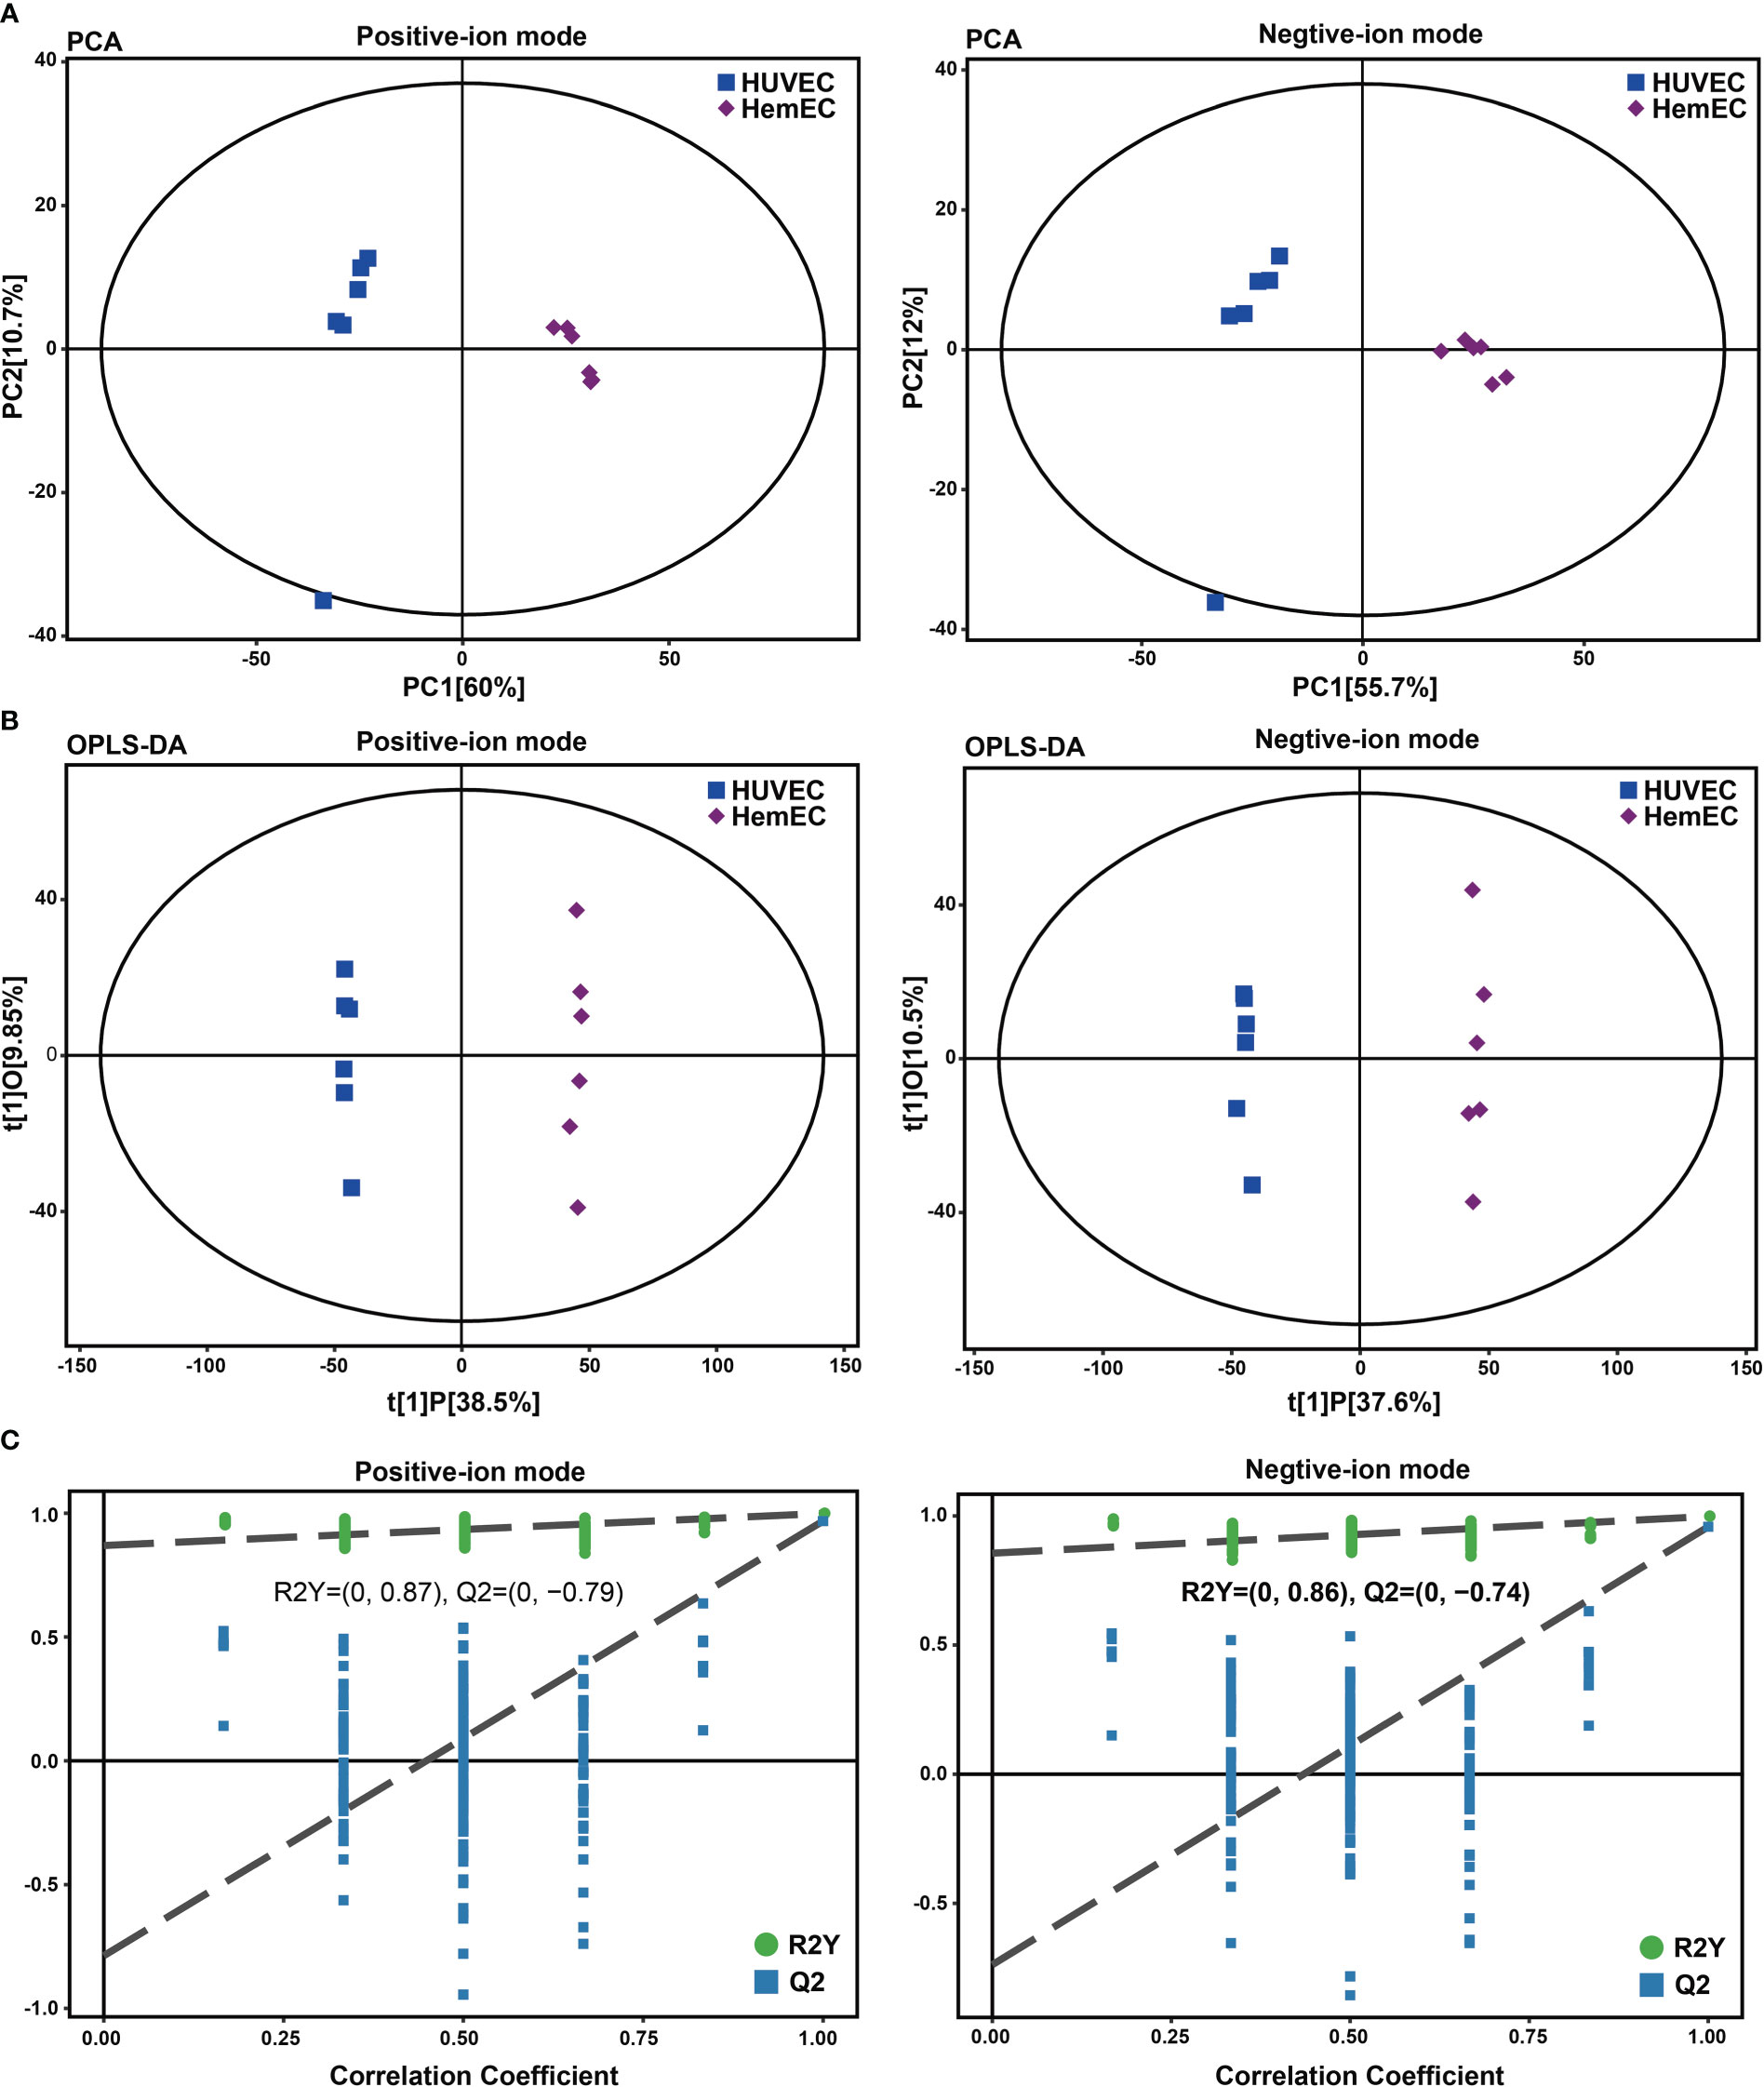
Figure 1 Score plots of principal component analysis (PCA), orthogonal partial least squares discriminant analysis (OPLS-DA) and single-dimensional statistical analysis between the HUVEC group and HemEC group by nontargeted metabolic analysis. (A) PCA score plots between HUVECs and HemECs in both positive-ion and negative-ion modes. (B) OPLS-DA score plots between HUVECs and HemECs in both modes. (C) Permutation tests consisting of 200 permutations demonstrated that the OPLS-DA model was not overfitted in either mode.
3.1.2 Analysis of differential metabolites between the HUVEC group and HemEC group
To compare differences in metabolites between HUVECs and HemECs, differential metabolites (DMs) were screened out in both positive-ion and negative-ion modes. As shown in Figure 2A, a total of 216 DMs, including 83 downregulated and 133 upregulated DMs, were identified in positive-ion mode (Table S2). These DMs were classified into eleven groups (Figure 2C), including lipids and lipid-like molecules (35.648%) and organic acids and derivatives (24.537%). Similarly, 128 DMs were identified between the two groups in negative-ion mode, including 54 downregulated and 74 upregulated DMs (Figure 2B, Table S3). Most of these DMs were organic acids and derivatives or lipids and lipid-like molecules, which accounted for 30.233% and 23.256% of the DMs, respectively (Figure 2D). Then, a heatmap was generated via hierarchical clustering analysis for the top 30 DMs, and upregulation and downregulation were observed in both modes (Figures 2E, F). The results showed that these DMs were predominantly classified into amino acids and their derivatives, suggesting that amino acid metabolism may be tightly associated with HemEC metabolism. In addition, we used chord plots to visualize the correlation between classifications and the content of metabolites (Figure S1). High correlations were observed between different metabolites in the same group of compounds, such as the correlations between beta-alanine and aspartyl-asparagine (Figure S1A). In addition, correlations were present between different metabolites from different groups of compounds (Figures S1A, B). These results indicated that different metabolites were tightly interconnected. In summary, these data confirmed that there were significant differences in the metabolites between HUVECs and HemECs.
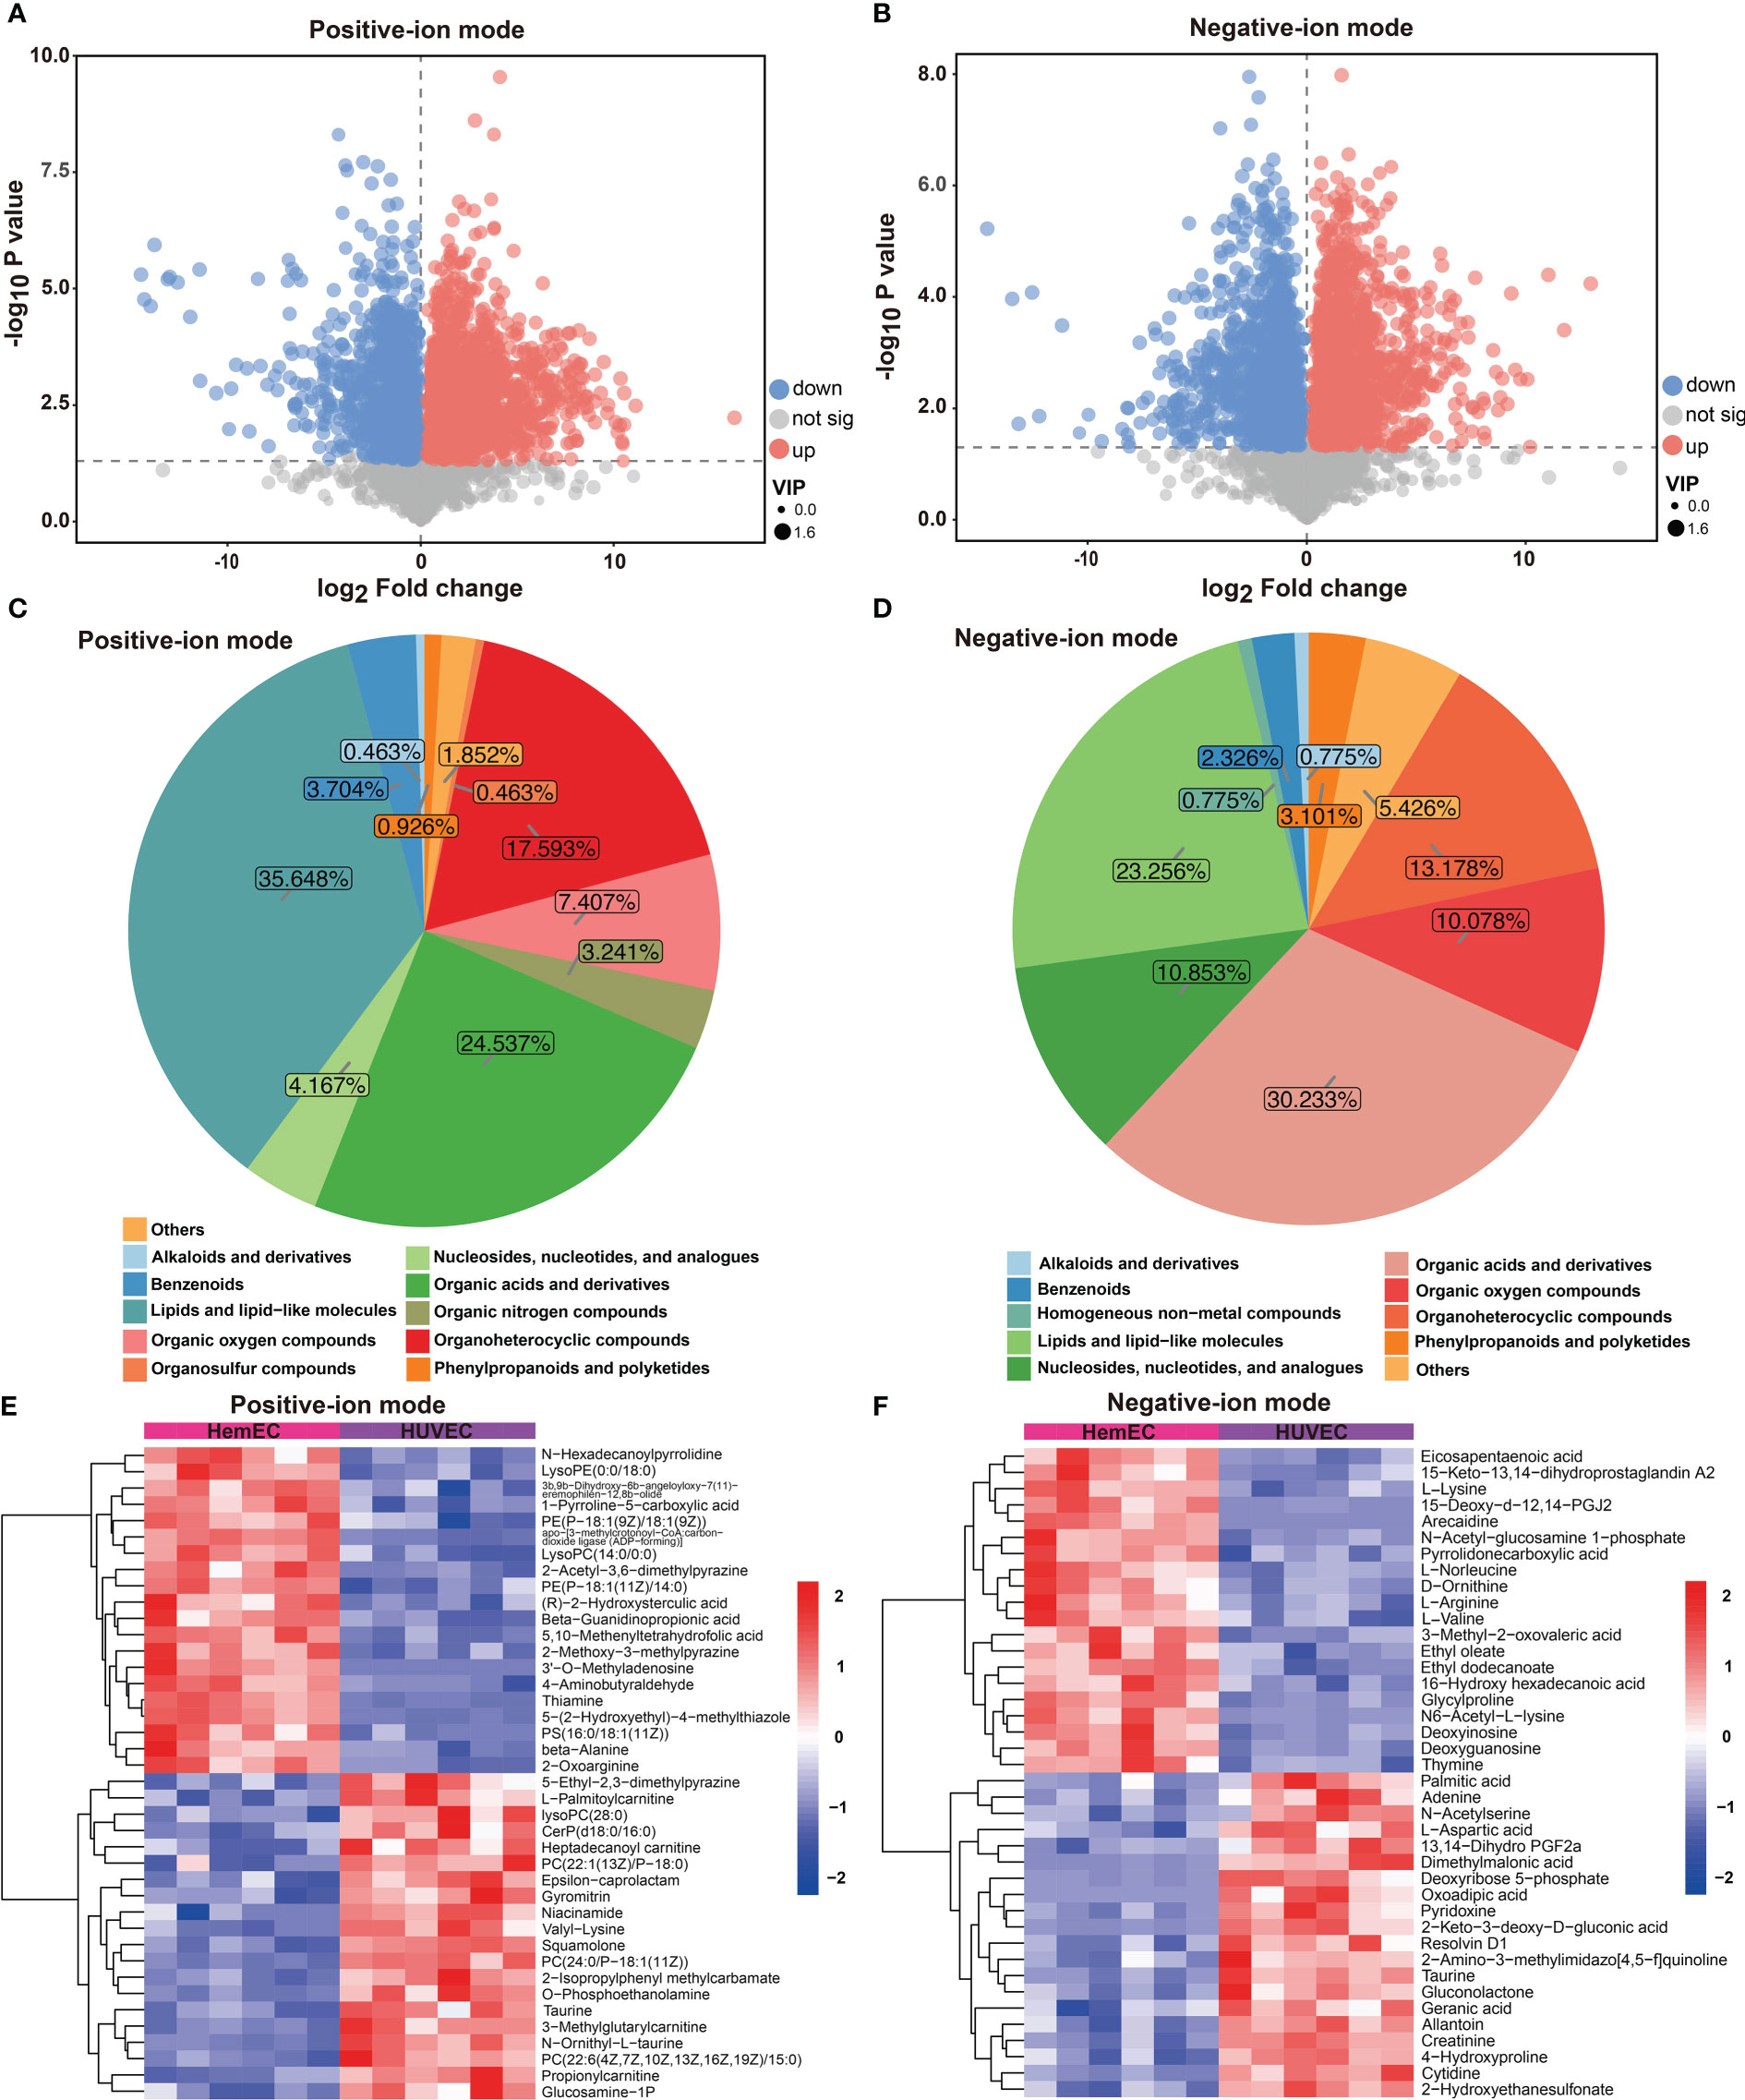
Figure 2 Differential metabolites (DMs) between HUVECs and HemECs by nontargeted metabolic analysis. (A, B) Volcano plot analysis of DMs with VIP value > 1 and P value <0.05 in both modes. (C, D) Distribution of all DMs in both modes. (E, F) Heatmap of hierarchical cluster analysis of the top 30 upregulated and downregulated DMs in both modes.
3.1.3 Metabolic enrichment analysis and pathway analysis
In positive-ion mode, pathway enrichment analysis was performed using the metabolic sets, and the results showed that these DMs were predominantly enriched in ABC transport (18.18%), followed by biosynthesis of amino acids (14.55%), protein digestion and absorption (14.55%) and arginine and proline metabolism (14.55%), as shown in Figure 3A. Then, differential abundance score analysis was further performed to determine the overall changes in all DMs enriched in the same pathway. The pathways, including glycerophospholipid metabolism and sphingolipid metabolism, tended to be significantly downregulated. However, the metabolism of various amino acids, including thiamine, pyrimidine, alanine, aspartate and glutamate, tended to be significantly upregulated (Figure 3B). Similarly, in the negative-ion model, these DMs were predominantly enriched in metabolic pathways (92.65%), ABC transport (27.94%) and biosynthesis of amino acids (20.59%) (Figure 3C). The differential abundance score analysis results showed that all pathways were significantly increased except for arginine and proline metabolism (Figure 3D).
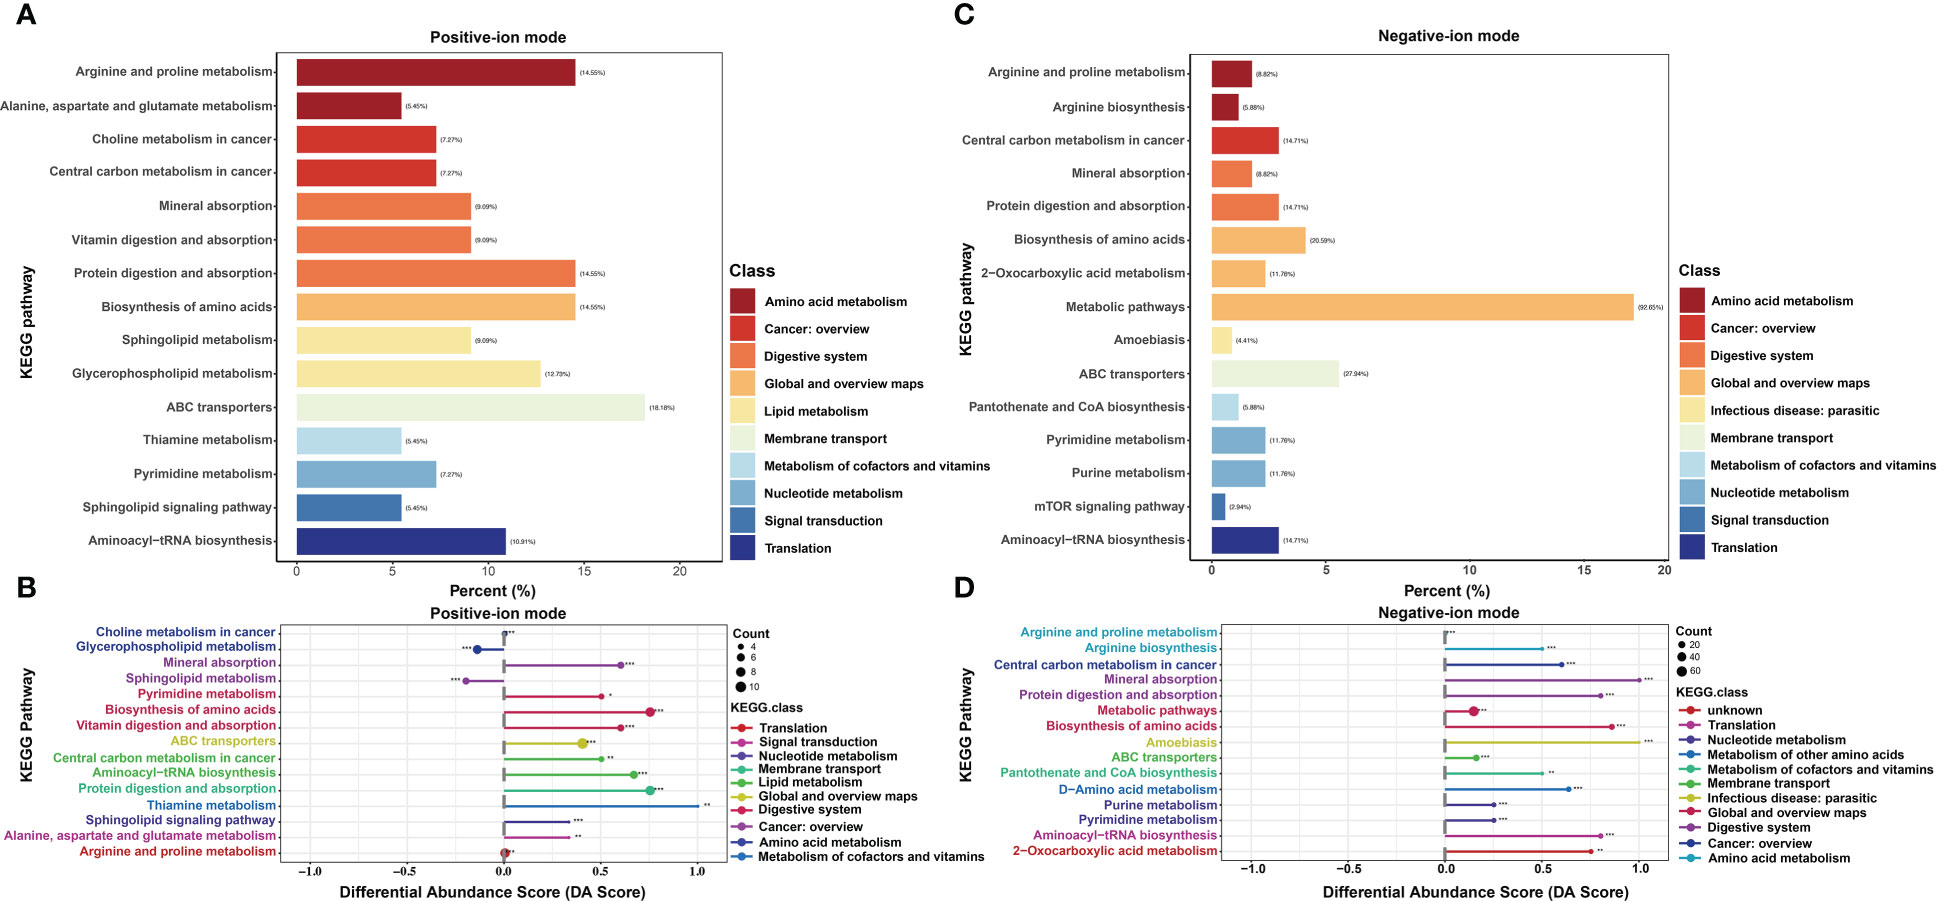
Figure 3 KEGG enrichment analysis of differential metabolites (DMs) between HUVECs and HemECs by nontargeted metabolic analysis. (A, C) Enrichment analysis of DMs. (B, D), Differential abundance score analysis of DMs. Each dot represents a metabolic pathway. The X-axis is the differential abundance (DA) score, and the Y-axis is the ID number of the KEGG metabolic pathway. * represents significance. * P < 0.05, ** P < 0.01, *** P < 0.001.
To investigate the metabolomic pathways involved in IH development, all DMs were enriched. A total of 39 metabolic pathways were identified, as shown in Figure 4A (Table S4). These metabolism pathways were mainly classified into amino acid metabolism (e.g., arginine and proline metabolism), lipid metabolism (e.g., riboflavin metabolism), fatty acid metabolism and glycerophospholipid metabolism. However, the amino acid metabolism-related pathway was the predominant pathway, including ‘arginine and proline metabolism’, ‘arginine and proline metabolism’, and ‘alanine, aspartate and glutamate metabolism’ (Figure 4B). Among the 39 metabolism pathways, only 5 pathways were significant with p < 0.05 and impact >0.1, including ‘arginine and proline metabolism’, ‘Sphingolipid metabolism’, ‘aminoacyl-tRNA biosynthesis’, ‘glycerophospholipid metabolism’ and ‘alanine, aspartate and glutamate metabolism’ (Table 1). Similarly, 52 metabolic pathways were identified (Table S5), among which 6 pathways were significantly enriched with p < 0.05 and impact >0.1 (Table 2). In addition, the amino acid metabolism-related pathway was the predominant pathway in the negative-ion mode (Figures 4C, D). Furthermore, two metabolic pathways, ‘aminoacyl-tRNA biosynthesis’ and ‘arginine and proline metabolism’, were significantly enriched in both the positive-ion model and negative-ion model. Notably, these pathways were mainly associated with amino acid metabolism.
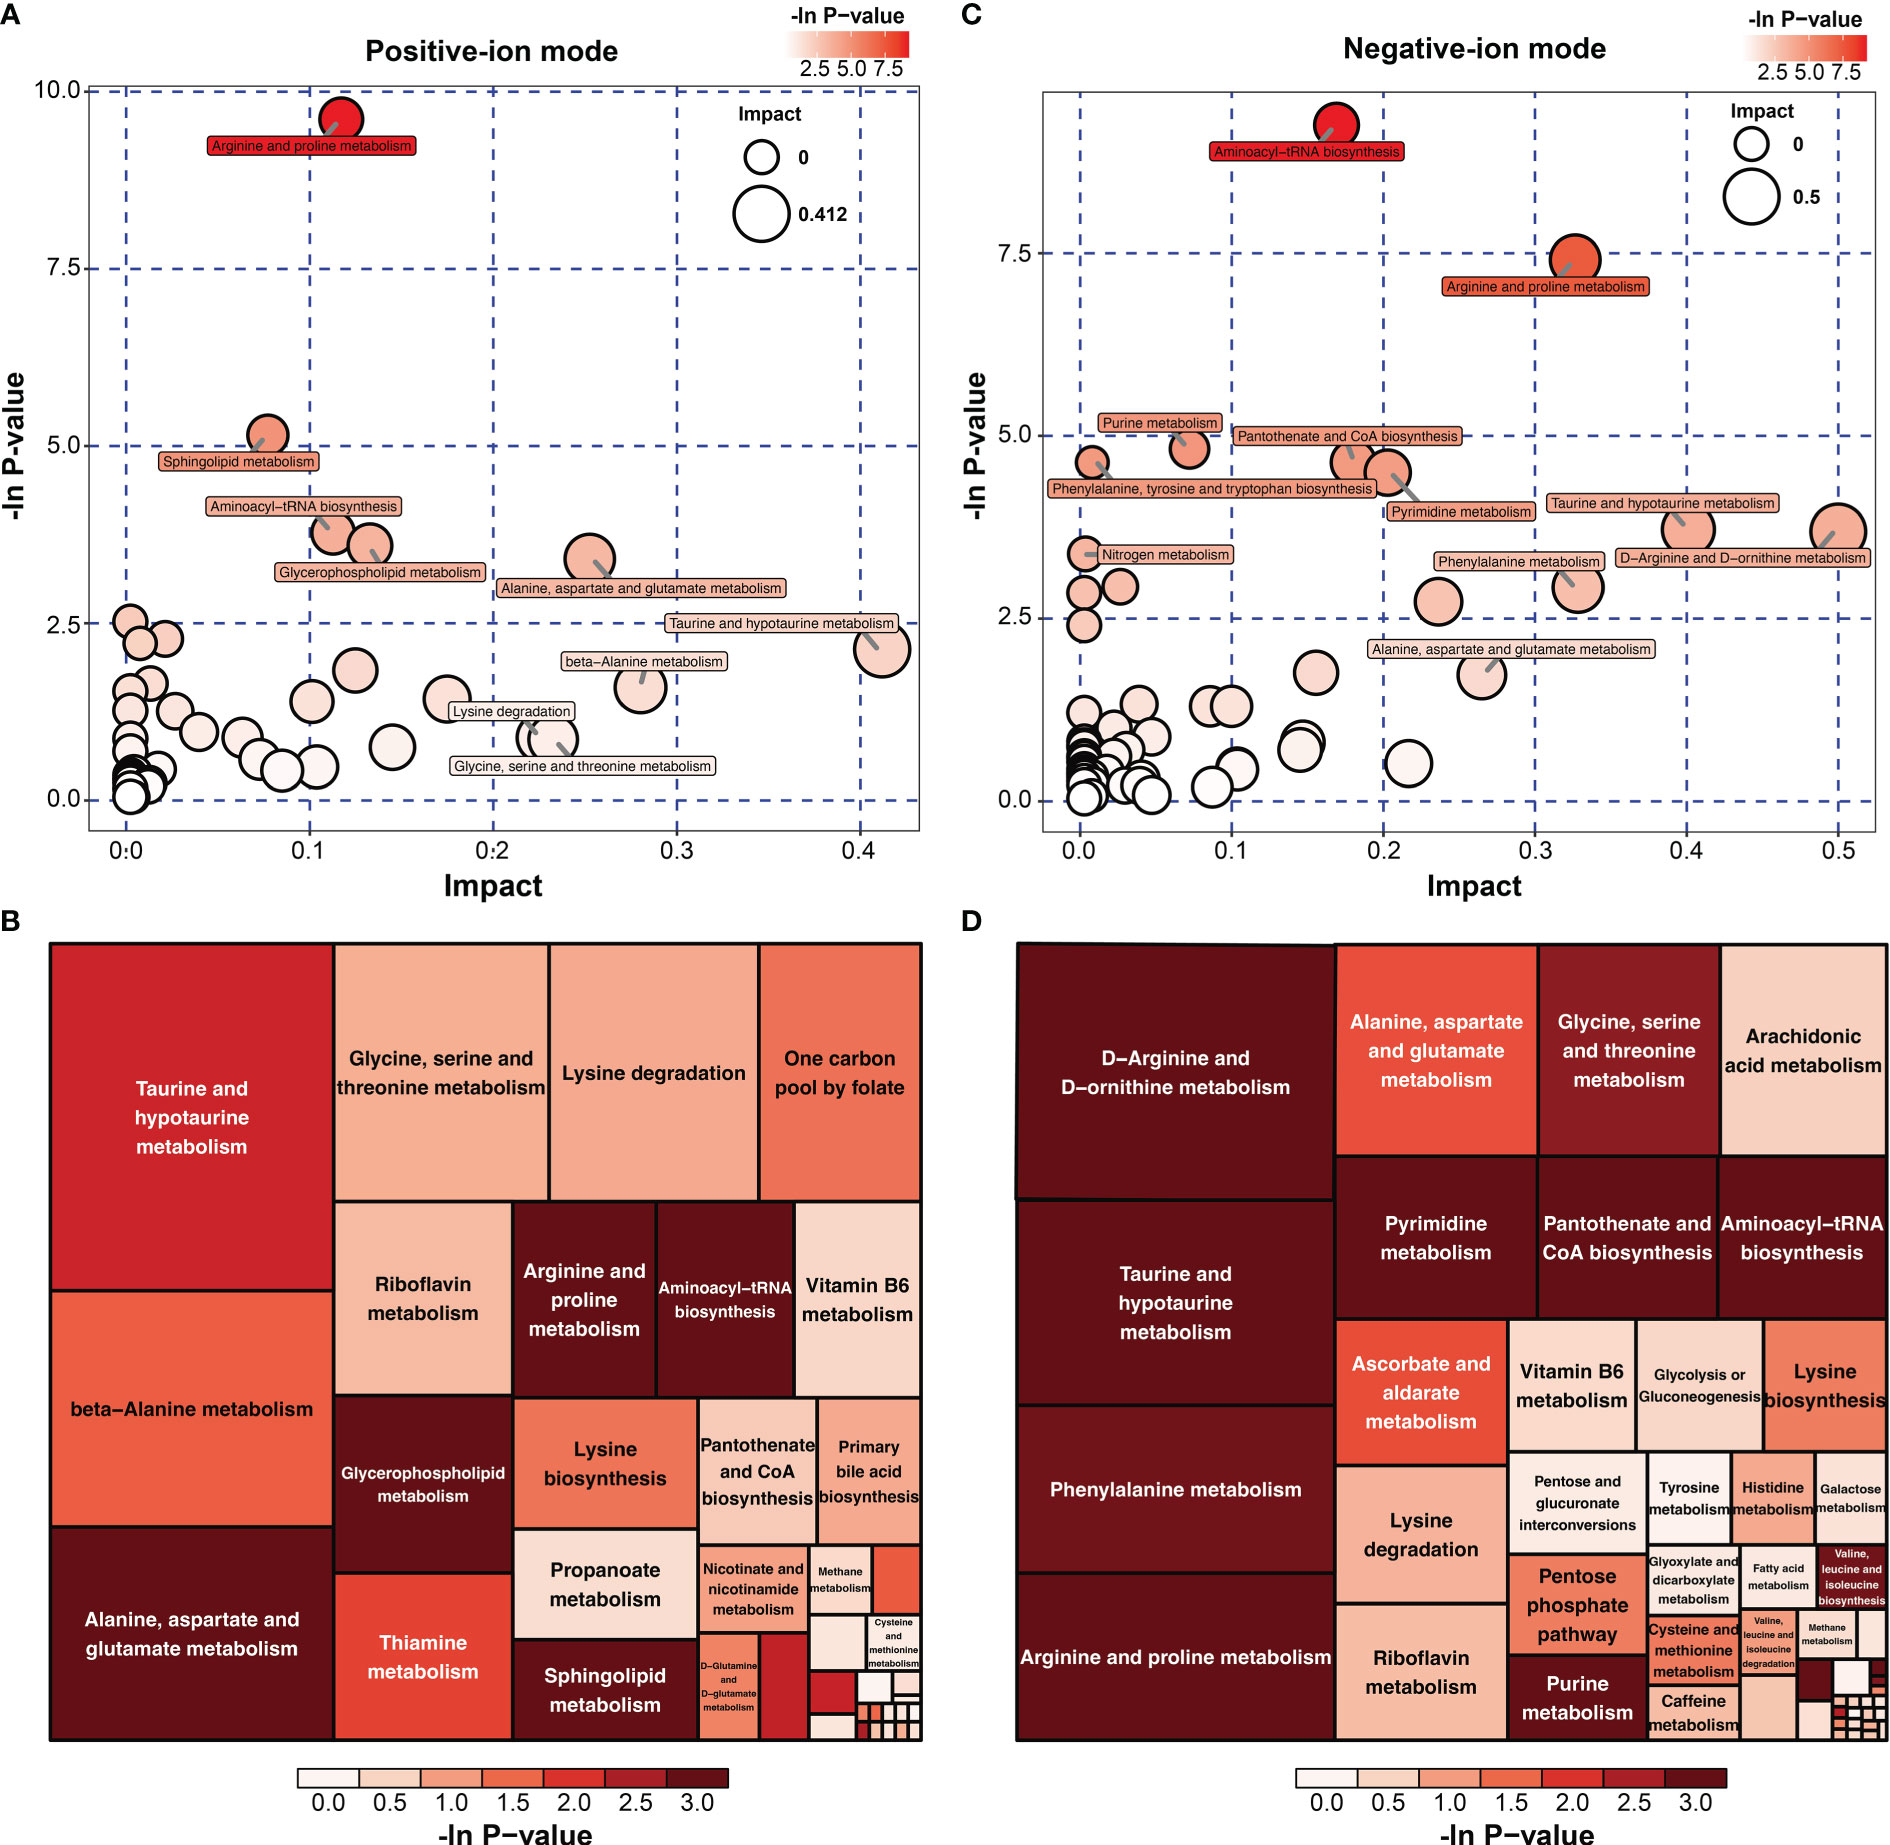
Figure 4 KEGG pathway analysis of differential metabolites (DMs) between HUVECs and HemECs by nontargeted metabolic analysis. (A, C) Bubble plot analysis of pathways. Each related metabolic pathway is shown as a circle, in which the size and color are based on the pathway impact value and the P value, respectively. (B, D) Treemap plot analysis of pathways. Each related metabolic pathway is shown as a rectangle, in which the size and color are based on the pathway impact value and the P value, respectively.
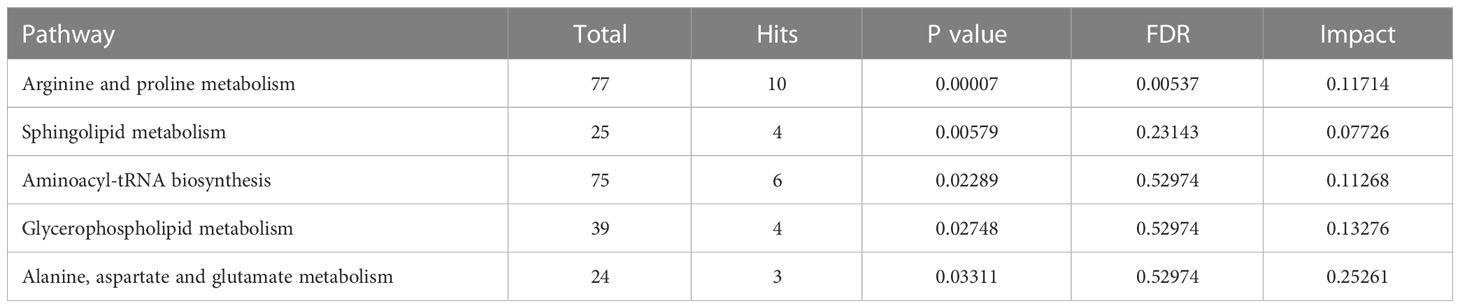
Table 1 Significant pathways in positive-ion model.
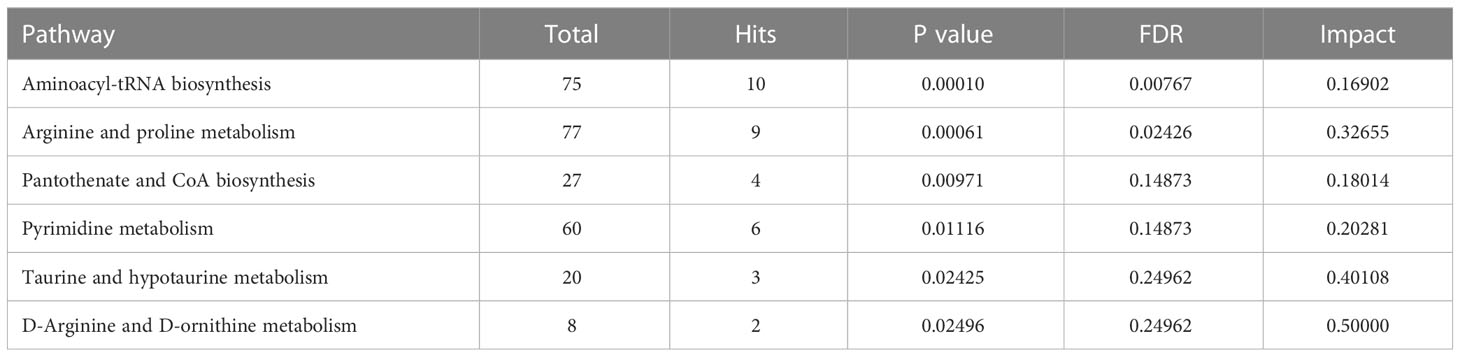
Table 2 Significant pathways in negative-ion model.
3.2 Targeted metabolomics analysis of amino acids
3.2.1 Multivariate statistical analysis
Previous results indicated that the altered metabolic pathways between HUVECs and HemECs were mainly involved in amino acid metabolism pathways. Then, a target amino acid metabolomics analysis was further conducted to gain more insight into HemEC metabolism. Based on the PCA results, a significant separation was observed between the HUVEC group and HemEC group (Figure 5A). Additionally, the OPLS-DA showed clearly distinguished profiles between the HUVEC group and HemEC group (Figure 5B). Permutation tests consisting of 200 permutations revealed that the model was not overfitted (R2Y= (0.0, -0.03), Q2= (0.0, -1.67) (Figure 5C).These data suggested that altered amino acid profiles could discriminate HemECs from HUVECs.
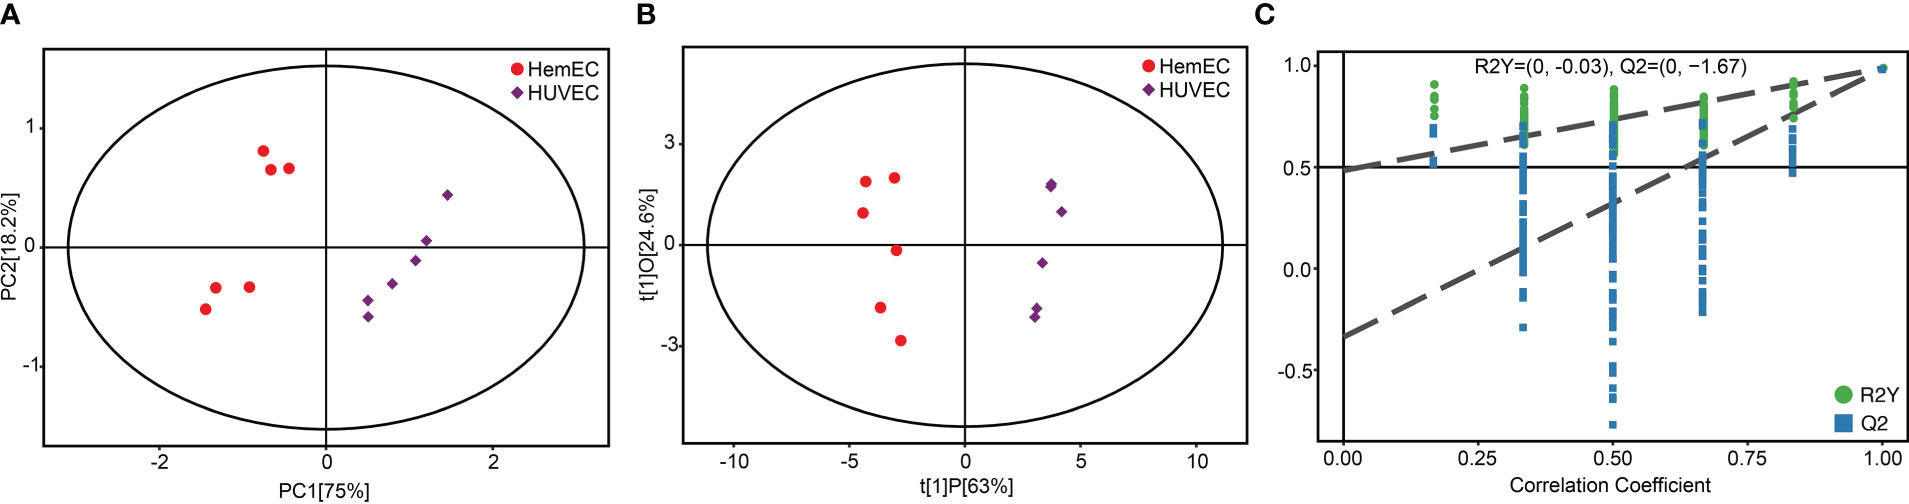
Figure 5 Score plots of principal component analysis (A), orthogonal partial least squares discriminant analysis (B) and single-dimensional statistical analysis (C) between the HUVEC group and HemEC group by targeted metabolic analysis.
3.2.2 Differential amino acid metabolites between HUVECs and HemECs
To compare the differences in metabolites between HUVECs and HemECs, a total of 22 amino acid metabolites were identified (Table 3), as presented in the volcano plot (Figure 6A). Then, a heatmap was generated via hierarchical clustering analysis for all metabolites (Figure 6B). In total, 16 amino acids were significantly differentially expressed, including L-glutamine, L-asparagine, L-serine and L-lysine, in the HemEC group compared to the HUVEC group (P < 0.05, Table 3). To further clarify the mutual regulatory relationship between metabolites, correlation analysis was performed to reveal the synergy of changes between metabolites (Figure 6C). It was obvious that L-glutamine, a vital amino acid in regulating angiogenesis (18), was only negatively correlated with L-citrulline but was significantly positively correlated with the remaining amino acids except for L-tryptophan. Based on these data, significant differences were observed in the metabolites between the propranolol group and the control group.
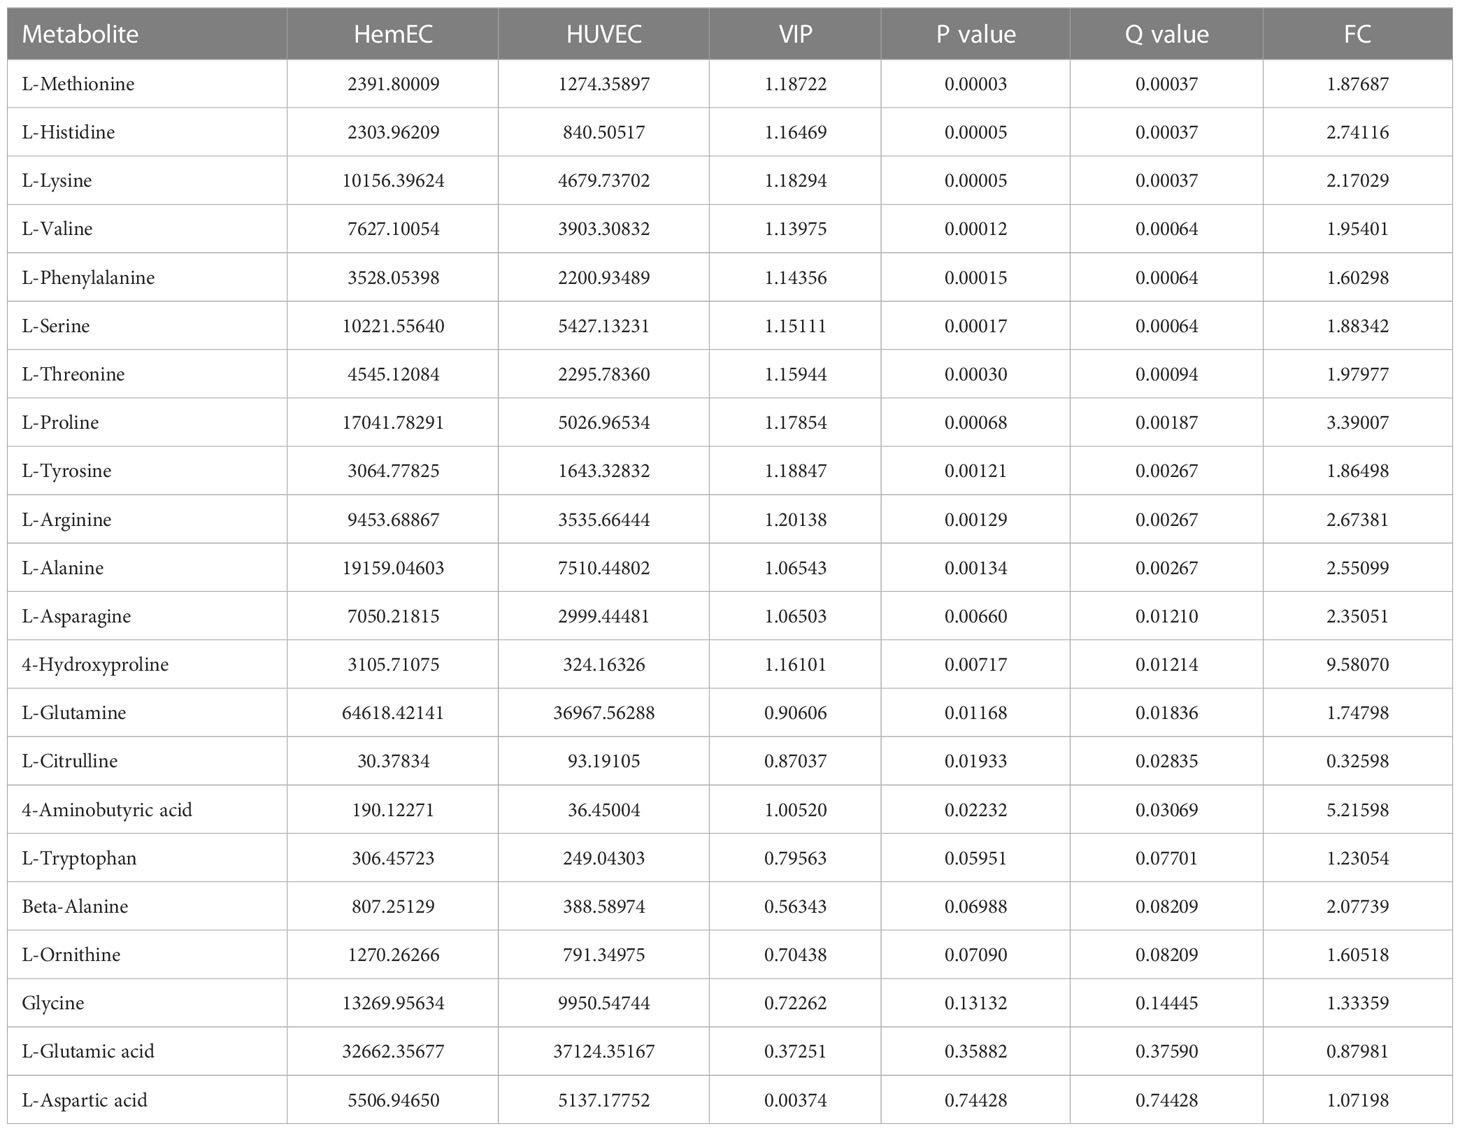
Table 3 Twenty two differential amino acid between HUVEC and HemEC by targeted metabolic analysis.
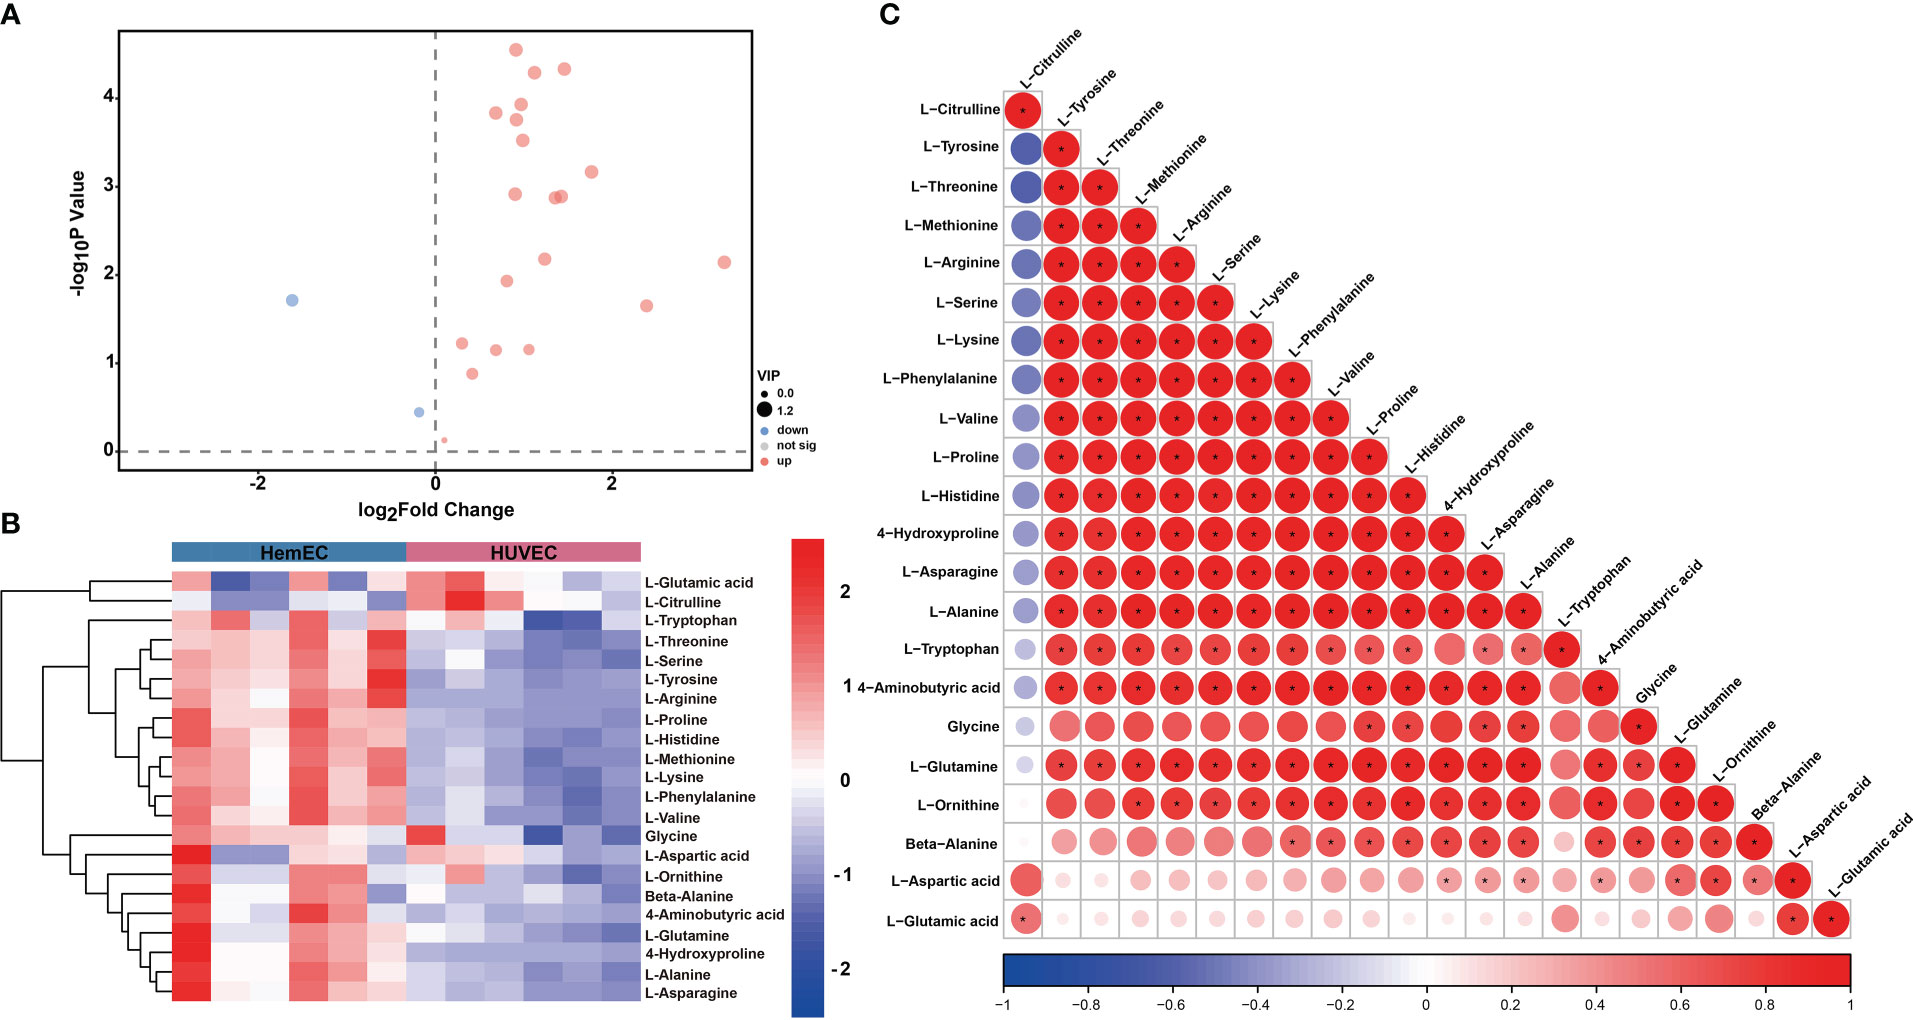
Figure 6 Differential metabolites (DMs) between HUVECs and HemECs by targeted metabolic analysis. (A) Volcano plot analysis of DMs with VIP value > 1 and P value <0.05. (B) Heatmap of hierarchical cluster analysis of 22 DMs. (C) Correlation analysis of 22 differential amino acids. The color of each line represents the Pearson correlation coefficient of two differential metabolites. Red indicates a positive correlation, and blue indicates a negative correlation. *represents significance. P < 0.05.
3.2.3 Metabolic pathway analysis and enrichment analysis
All 16 significant differential amino acid metabolites were enriched to further investigate the metabolomic pathways involved in IH. As presented in Figure 7A, these significant DMs were enriched in 25 metabolic pathways (Table S6), among which eight metabolic pathways were significant with p < 0.05 and impact >0.1 in HemECs compared with HUVECs. These pathways included ‘aminoacyl-tRNA biosynthesis’, ‘alanine, aspartate and glutamate metabolism’, ‘arginine biosynthesis’, ‘arginine and proline metabolism’, ‘phenylalanine, tyrosine and tryptophan biosynthesis’, ‘valine, leucine and isoleucine biosynthesis’, ‘phenylalanine metabolism’, ‘glyoxylate and dicarboxylate metabolism’, ‘cysteine and methionine metabolism’, and ‘glycine, serine and threonine metabolism’ (Table 4). Within these pathways, ‘aminoacyl-tRNA biosynthesis’, ‘alanine, aspartate and glutamate metabolism’, and ‘arginine biosynthesis’ were highlighted as targets to investigate the pathological mechanism underlying HemEC metabolism. Metabolite set enrichment analysis showed that the top three pathways associated with HemEC metabolism were aminoacyl-tRNA biosynthesis; alanine, aspartate and glutamate metabolism; and arginine biosynthesis (Figure 7B).
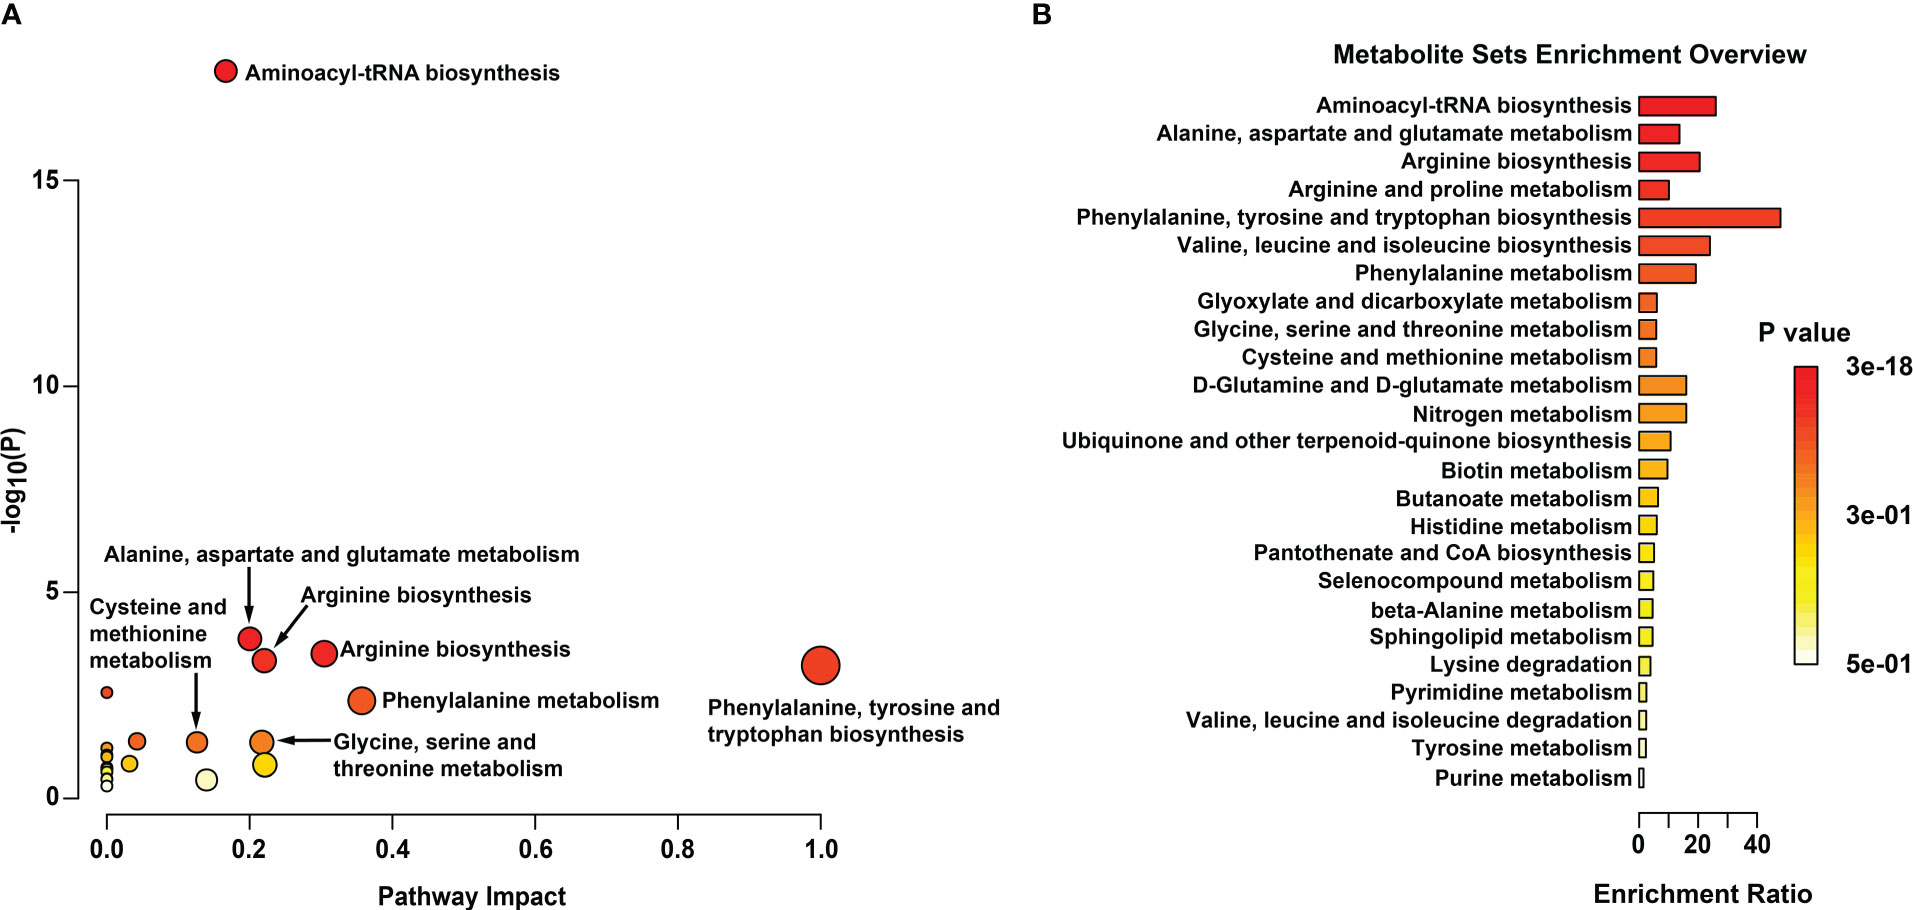
Figure 7 Metabolic pathway analysis (A) and enrichment analysis (B) of significant differential amino acids between HUVECs and HemECs by targeted metabolic analysis. In (A), each related metabolic pathway is shown as a circle, in which the size and color are based on the pathway impact value and the P value, respectively.
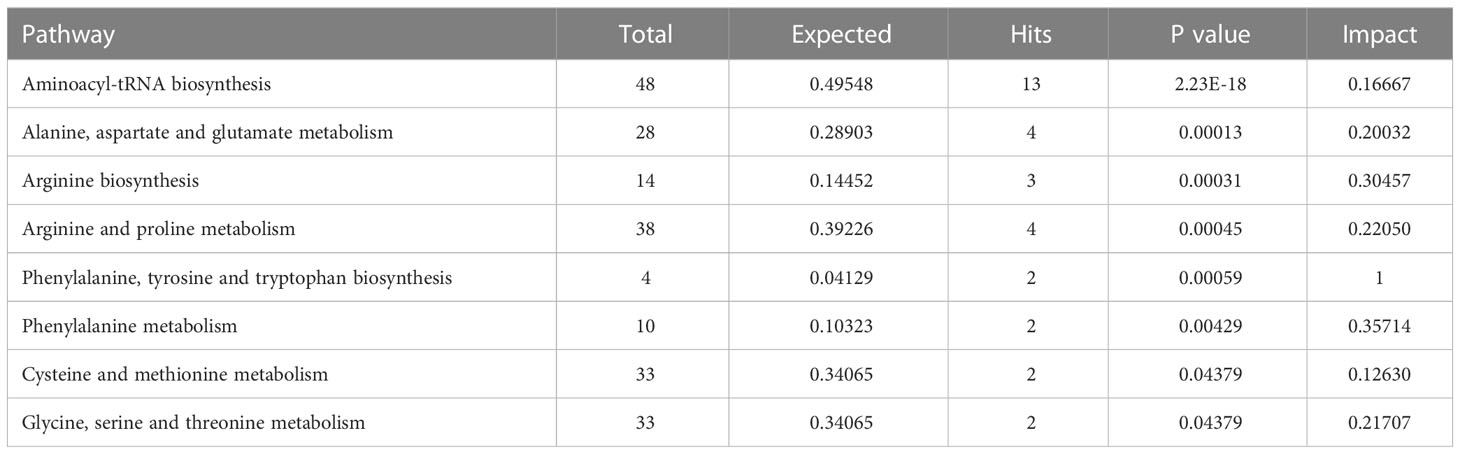
Table 4 Eight significant pathways between HUVEC and HemEC by targeted metabolic analysis.
4 Discussion
Several signaling pathways regulate angiogenesis during the development of IH, especially the VEGF/VEGF receptor (VEGFR) pathway and Notch pathway (7). During vessel sprouting, endothelial “tip” cell migration and endothelial “stalk” cell elongation are initiated under the control of VEGF and Notch signaling. Huge energy is then obtained to supply EC and maintain the process of sprouting angiogenesis. Several metabolic pathways, including glycolysis, fatty acid oxidation, and amino acid metabolism, participate in the regulation of angiogenesis (10). These metabolic pathways have different roles in the production of energy and biomass and the maintenance of redox homeostasis during EC angiogenesis (10). Recently, it was shown that inhibiting glucose metabolism in EC by targeting the key glycolytic enzyme PFKFB3 reduced pathological angiogenesis (19, 20). In addition, targeting glutamine metabolism inhibits EC migration during pathological angiogenesis (21), and fatty acid metabolism participates in regulating EC angiogenesis (22). Therefore, a better understanding of the metabolic changes in ECs will improve the beneficial effects of antiangiogenic therapy in IH.
Glucose is the most important metabolic substrate of EC metabolism. Targeting glucose metabolism by inhibiting glycolysis is a promising strategy to reverse EC dysfunction and inhibit pathological angiogenesis (23). Previous study has demonstrated that the genes expression of glycolytic enzymes including glucose transporter 1 (GLUT1), hexokinase 2 (HK2) and lactate dehydrogenase A (LDHA) are significant higher in human pulmonary artery endothelial cells (HPAEC) than in chronic thromboembolic pulmonary hypertension endothelial cells (CTEPH-EC) and pulmonary arterial hypertension endothelial cells (PAH-EC) (24). Recently, our previous study found that glucose metabolism pathways, including pyruvate metabolism and the citrate cycle, were significantly enriched between proliferating IH and involuting IH (14). In addition, inhibiting the key glycolytic enzyme phosphofructokinase 1 suppresses proliferation and migration and induces cell cycle arrest in HemEC (14). Furthermore, key glycolytic enzymes, including hexokinase 2,6-phosphofructo-2-kinase 3, pyruvate kinase M2 (PKM2) and lactate dehydrogenase A, are more highly expressed in HemECs than in HUVECs (25). PKM2 was demonstrated to play a critical role in regulating the progression of IH and the therapeutic resistance of propranolol treatment (26). Together, the results from these studies indicated that HemEC glucose metabolism participates in the development of IH (27). As mentioned previously, several metabolic pathways, including amino acid metabolism and fatty acid oxidation but not glycolysis, are involved in EC metabolism. However, no study has investigated the role of amino acid metabolism or fatty acid oxidation in IH until now. Therefore, a comprehensive understanding of the metabolic profiles of HemEC will improve our knowledge of the pathogenesis of IH.
The present study was performed with the aim of investigating the metabolic profiles of HemEC. Metabolomics is emerging as a powerful tool for studying metabolic processes, identifying crucial biomarkers responsible for metabolic characteristics and revealing metabolic mechanisms (28). In the present study, nontargeted metabolic analysis was first conducted to reveal the metabolic profiles of HemEC. The results showed a significant metabolic change between HUVECs and HemECs. In addition, these significant DMs were predominantly enriched in metabolic pathways related to amino acid metabolism, including ‘arginine and proline metabolism’ and ‘alanine, aspartate and glutamate metabolism’, consistent with a previous study (29). Therefore, it can be speculated that amino acid metabolism is involved in HemEC metabolism. Similar results are noted that amino acid pathways including D-glutamine/D-glutamate metabolism and arginine/proline metabolism were highly expressed in brain endothelial cell compared to primary astrocytes (30). In addition, amino acid pathways, such as arginine and proline metabolism, D-glutamine and D-glutamate metabolism and alanine, aspartate and glutamate metabolism, participated in the regulation of cardiovascular endothelial cells metabolism (31). Then, targeted metabolic analysis was further performed to compare the difference in amniotic acid between HUVECs and HemECs. The results of targeted metabolic analysis showed that most amino acid metabolites, including glutamine, asparagine, arginine and serine, were significantly upregulated in HemECs compared with HUVECs. These findings indicated that amino acid metabolism is much more active in HemEC. KEGG pathway enrichment indicated that these significant amino acids were ‘alanine, aspartate and glutamate metabolism’, ‘arginine and proline metabolism’ and ‘glycine, serine and threonine metabolism’. Recently, amino acid metabolism pathways, including ‘alanine, aspartate and glutamate metabolism’ and ‘arginine biosynthesis’, were significantly identified based on the differential metabolites in umbilical cord blood serum samples from IH (29). Our previous study found that ‘glycine, serine and threonine metabolism’ and ‘valine, leucine and isoleucine degradation’ were associated with the development of IH (14). In the present study, our targeted metabolic analysis results were consistent with those of previous studies (14, 29). In addition, amino acid metabolism pathways including ‘aminoacyl-tRNA biosynthesis’, ‘arginine and proline metabolism’, ‘alanine, aspartate and glutamate metabolism’ and ‘phenylalanine, tyrosine and tryptophan biosynthesis’ were identified simultaneously in both nontargeted metabolic analysis and targeted metabolic analysis. These findings indicated that these pathways play a more important role in HemEC metabolism. Taken together, these results suggest that amino acid metabolism participates in the regulation of HemEC metabolism.
Aminoacyl-tRNA synthetases can activate amino acids and cause them bind to tRNA and form the corresponding aminoyl-tRNA. Recently, emerging evidence has demonstrated that aminoacyl-tRNA synthetases participate in various functions, such as protein synthesis, gene regulation, intron splicing and angiogenesis (32). Thus, targeting aminoacyl-tRNA synthetases has been a promising treatment for infections, cancer and autoimmune diseases (33). Glutamine is the most abundant free amino acid in blood plasma. ECs from both venous and arterial vessels express glutaminase, a phosphate-dependent enzyme that converts glutamine into glutamate (14). When glutamine is converted into glutamate, glutamate is then used to produce a-ketoglutarate to refuel the TCA cycle. Glutamine deprivation or inhibition of glutaminase 1 can impair EC proliferation and migration and reduce pathological angiogenesis (34). In addition, glutamine is used to produce glutathione in ECs, which is used to maintain redox homeostasis. ECs are vulnerable to ROS-induced damage when glutamine is depleted (34, 35). In addition, glutamine can provide nitrogen for asparagine synthesis. When asparagine synthetase is silenced, EC proliferation is impaired because asparagine synthesis from glutamine-derived nitrogen and aspartate is inhibited (34).
Arginine, a semiessential amino acid, is an important substrate for endothelial nitric oxide synthase to generate the vasoprotective molecule nitric oxide (36). Nitric oxide can promote vessel growth through upregulating VEGF (37). Enhancing the basal production of nitric oxide by store-operated Ca2+ entry can accelerate HemEC proliferation, and propranolol treatment can decrease the level of nitric oxide to induce vasoconstriction (38, 39). In addition, arginine depletion inhibits angiogenesis in colon cancer, and dietary arginine supplementation suppresses the progression of colon cancer by increasing NO secretion (40). In the present study, the ‘valine, leucine and isoleucine biosynthesis’ pathway was identified as a significant metabolic pathway, indicating that branched-chain amino acids (BCAAs) are involved in HemEC metabolism. BCAAs are used for protein synthesis or are oxidized for energy purposes by tumors, and emerging evidence suggests that alterations in BCAA metabolism might be useful for therapy when considered in combination with genetic mutations38. These research results indicated that amino acid metabolism can regulate EC angiogenesis. However, the underlying mechanism of amino acid metabolism and its effect on the development of IH remains unknown. Therefore, additional studies are needed.
In conclusion, our results reveal that amino acid metabolism is involved in IH. Key differential amino acid metabolites, including glutamine, asparagine, arginine and serine, may play an important role in the regulation of angiogenesis in HemEC.
Data availability statement
The original contributions presented in the study are included in the article/Supplementary Material. Further inquiries can be directed to the corresponding author.
Ethics statement
The studies involving human participants were reviewed and approved by Ethics Committee of the West China Hospital of Sichuan University. The patients/participants provided their written informed consent to participate in this study.
Author contributions
Conception and design: KY, TQ, YJ. Collection and assembly of data: KY, TQ, JZ, XG, YJ. Manuscript preparation: KY, TQ. Manuscript editing: KY, TQ. Manuscript revision/review: SC, YJ. Manuscript final version approval: All authors. All authors contributed to the article and approved the submitted version.
Funding
This research was funded by the National Natural Science Foundation of China (grant number 82273556), the Key Project in the Science & Technology Program of Sichuan Province (grant number 2022YFS0233, 2022YFS0225 and 2022NSFSC1480), the Project of ‘0 to 1’ of Sichuan University (grant number 2022SCUH0033), Med-X Center for Informatics Funding Project (YGJC004), the 1·3·5 Project for Disciplines of Excellence Clinical Research Incubation Project, West China Hospital of Sichuan University (grant numbers ZYJC21060, 2020HXFH048 and 2019HXFH056), and the Guangdong Basic and Applied Basic Research Foundation (2023A1515012751).
Acknowledgments
We thank Shanghai Biotree Biotech Co Ltd. for metabolomics analysis.
Conflict of interest
The authors declare that the research was conducted in the absence of any commercial or financial relationships that could be construed as a potential conflict of interest.
Publisher’s note
All claims expressed in this article are solely those of the authors and do not necessarily represent those of their affiliated organizations, or those of the publisher, the editors and the reviewers. Any product that may be evaluated in this article, or claim that may be made by its manufacturer, is not guaranteed or endorsed by the publisher.
Supplementary material
The Supplementary Material for this article can be found online at: https://www.frontiersin.org/articles/10.3389/fonc.2023.1132344/full#supplementary-material
References
1. Leaute-Labreze C, Harper JI, Hoeger PH. Infantile haemangioma. Lancet (2017) 390(10089):85–94. doi: 10.1016/S0140-6736(16)00645-0
2. Rodriguez Bandera AI, Sebaratnam DF, Wargon O, Wong LF. Infantile hemangioma. part 1: Epidemiology, pathogenesis, clinical presentation and assessment. J Am Acad Dermatol (2021) 85(6):1379–92. doi: 10.1016/j.jaad.2021.08.019
3. Ji Y, Chen S, Yang K, Zhang X, Zhou J, Li L, et al. Efficacy and safety of propranolol vs atenolol in infants with problematic infantile hemangiomas: A randomized clinical trial. JAMA Otolaryngol Head Neck Surg (2021) 147(7):599–607. doi: 10.1001/jamaoto.2021.0454
4. Koh SP, Leadbitter P, Smithers F, Tan ST. Beta-blocker therapy for infantile hemangioma. Expert Rev Clin Pharmacol (2020) 13(8):899–915. doi: 10.1080/17512433.2020.1788938
5. Abarzua-Araya A, Navarrete-Dechent CP, Heusser F, Retamal J, Zegpi-Trueba MS. Atenolol versus propranolol for the treatment of infantile hemangiomas: A randomized controlled study. J Am Acad Dermatol (2014) 70(6):1045–9. doi: 10.1016/j.jaad.2014.01.905
6. Ji Y, Chen S, Xu C, Li L, Xiang B. The use of propranolol in the treatment of infantile haemangiomas: An update on potential mechanisms of action. Br J Dermatol (2015) 172(1):24–32. doi: 10.1111/bjd.13388
7. Ji Y, Chen S, Li K, Li L, Xu C, Xiang B. Signaling pathways in the development of infantile hemangioma. J Hematol Oncol (2014) 7:13. doi: 10.1186/1756-8722-7-13
8. Falkenberg KD, Rohlenova K, Luo Y, Carmeliet P. The metabolic engine of endothelial cells. Nat Metab (2019) 1(10):937–46. doi: 10.1038/s42255-019-0117-9
9. Rohlenova K, Veys K, Miranda-Santos I, De Bock K, Carmeliet P. Endothelial cell metabolism in health and disease. Trends Cell Biol (2018) 28(3):224–36. doi: 10.1016/j.tcb.2017.10.010
10. Li X, Kumar A, Carmeliet P. Metabolic pathways fueling the endothelial cell drive. Annu Rev Physiol (2019) 81:483–503. doi: 10.1146/annurev-physiol-020518-114731
11. Roberts LD, Souza AL, Gerszten RE, Clish CB. Targeted metabolomics. Curr Protoc Mol Biol (2012), 1–24. doi: 10.1002/0471142727.mb3002s98
12. Griffiths WJ, Koal T, Wang Y, Kohl M, Enot DP, Deigner HP. Targeted metabolomics for biomarker discovery. Angew Chem Int Ed Engl (2010) 49(32):5426–45. doi: 10.1002/anie.200905579
13. Ji Y, Li K, Xiao X, Zheng S, Xu T, Chen S. Effects of propranolol on the proliferation and apoptosis of hemangioma-derived endothelial cells. J Pediatr Surg (2012) 47(12):2216–23. doi: 10.1016/j.jpedsurg.2012.09.008
14. Yang K, Zhang X, Chen L, Chen S, Ji Y. Microarray expression profile of mRNAs and long noncoding RNAs and the potential role of PFK-1 in infantile hemangioma. Cell Div (2021) 16(1):1. doi: 10.1186/s13008-020-00069-y
15. Pang Z, Chong J, Zhou G, de Lima Morais DA, Chang L, Barrette M, et al. MetaboAnalyst 5.0: Narrowing the gap between raw spectra and functional insights. Nucleic Acids Res (2021) 49(W1):W388–W96.
16. Chong J, Xia J. Using MetaboAnalyst 4.0 for metabolomics data analysis, interpretation, and integration with other omics data. Methods Mol Biol (2020) 2104:337–60. doi: 10.1007/978-1-0716-0239-3_17
17. Le Gall G, Colquhoun IJ, Davis AL, Collins GJ, Verhoeyen ME. Metabolite profiling of tomato (Lycopersicon esculentum) using 1H NMR spectroscopy as a tool to detect potential unintended effects following a genetic modification. J Agric Food Chem (2003) 51(9):2447–56. doi: 10.1021/jf0259967
18. Polet F, Feron O. Endothelial cell metabolism and tumour angiogenesis: Glucose and glutamine as essential fuels and lactate as the driving force. J Intern Med (2013) 273(2):156–65. doi: 10.1111/joim.12016
19. Schoors S, De Bock K, Cantelmo AR, Georgiadou M, Ghesquiere B, Cauwenberghs S, et al. Partial and transient reduction of glycolysis by PFKFB3 blockade reduces pathological angiogenesis. Cell Metab (2014) 19(1):37–48. doi: 10.1016/j.cmet.2013.11.008
20. Cruys B, Wong BW, Kuchnio A, Verdegem D, Cantelmo AR, Conradi LC, et al. Glycolytic regulation of cell rearrangement in angiogenesis. Nat Commun (2016) 7:12240. doi: 10.1038/ncomms12240
21. Eelen G, Dubois C, Cantelmo AR, Goveia J, Bruning U, DeRan M, et al. Role of glutamine synthetase in angiogenesis beyond glutamine synthesis. Nature (2018) 561(7721):63–9. doi: 10.1038/s41586-018-0466-7
22. Harjes U, Kalucka J, Carmeliet P. Targeting fatty acid metabolism in cancer and endothelial cells. Crit Rev Oncol Hematol (2016) 97:15–21. doi: 10.1016/j.critrevonc.2015.10.011
23. Goveia J, Stapor P, Carmeliet P. Principles of targeting endothelial cell metabolism to treat angiogenesis and endothelial cell dysfunction in disease. EMBO Mol Med (2014) 6(9):1105–20. doi: 10.15252/emmm.201404156
24. Smolders V, Rodriguez C, Blanco I, Szulcek R, Timens W, Piccari L, et al. Metabolic profile in endothelial cells of chronic thromboembolic pulmonary hypertension and pulmonary arterial hypertension. Sci Rep (2022) 12(1):2283. doi: 10.1038/s41598-022-06238-z
25. Chen J, Wu D, Dong Z, Chen A, Liu S. The expression and role of glycolysis-associated molecules in infantile hemangioma. Life Sci (2020) 259:118215. doi: 10.1016/j.lfs.2020.118215
26. Yang E, Wang X, Huang S, Li M, Li Y, Geng Y, et al. Shikonin reverses PKM2-mediated propranolol resistance in infantile hemangioma through ROS-induced autophagic dysfunction. Cancer Sci (2022) 114(3):806–821. doi: 10.1111/cas.15649
27. Gong X, Li Y, Yang K, Chen S, Ji Y. Infantile hepatic hemangiomas: Looking backwards and forwards. Precis Clin Med (2022) 5(1):pbac006. doi: 10.1093/pcmedi/pbac006
28. Peng B, Li H, Peng XX. Functional metabolomics: From biomarker discovery to metabolome reprogramming. Protein Cell (2015) 6(9):628–37. doi: 10.1007/s13238-015-0185-x
29. Jiang CH, Lin PF, Chen FC, Chen JY, Xie WJ, Li M, et al. Metabolic profiling revealed prediction biomarkers for infantile hemangioma in umbilical cord blood sera: A prospective study. J Proteome Res (2022) 21(3):822–32. doi: 10.1021/acs.jproteome.1c00430
30. Huang SF, Fischer S, Koshkin A, Laczko E, Fischer D, Ogunshola OO. Cell-specific metabolomic responses to injury: Novel insights into blood-brain barrier modulation. Sci Rep (2020) 10(1):7760. doi: 10.1038/s41598-020-64722-w
31. Mao B, Yi Y, Mo Q, Yang C, Zhong Q. Metabolic profiling reveals the heterogeneity of vascular endothelial function phenotypes in individuals at extreme cardiovascular risk. RSC Adv (2019) 9(52):30033–44. doi: 10.1039/C9RA05526F
32. Rubio Gomez MA, Ibba M. Aminoacyl-tRNA synthetases. RNA (2020) 26(8):910–36. doi: 10.1261/rna.071720.119
33. Zhou Z, Sun B, Nie A, Yu D, Bian M. Roles of aminoacyl-tRNA synthetases in cancer. Front Cell Dev Biol (2020) 8:599765. doi: 10.3389/fcell.2020.599765
34. Huang H, Vandekeere S, Kalucka J, Bierhansl L, Zecchin A, Bruning U, et al. Role of glutamine and interlinked asparagine metabolism in vessel formation. EMBO J (2017) 36(16):2334–52. doi: 10.15252/embj.201695518
35. DeBerardinis RJ, Cheng T. Q's next: the diverse functions of glutamine in metabolism, cell biology and cancer. Oncogene (2010) 29(3):313–24. doi: 10.1038/onc.2009.358
36. Morris SM Jr. Recent advances in arginine metabolism: Roles and regulation of the arginases. Br J Pharmacol (2009) 157(6):922–30. doi: 10.1111/j.1476-5381.2009.00278.x
37. Oberkersch RE, Santoro MM. Role of amino acid metabolism in angiogenesis. Vascul Pharmacol (2019) 112:17–23. doi: 10.1016/j.vph.2018.11.001
38. Storch CH, Hoeger PH. Propranolol for infantile haemangiomas: Insights into the molecular mechanisms of action. Br J Dermatol (2010) 163(2):269–74. doi: 10.1111/j.1365-2133.2010.09848.x
39. Zuccolo E, Bottino C, Diofano F, Poletto V, Codazzi AC, Mannarino S, et al. Constitutive store-operated Ca(2+) entry leads to enhanced nitric oxide production and proliferation in infantile hemangioma-derived endothelial colony-forming cells. Stem Cells Dev (2016) 25(4):301–19. doi: 10.1089/scd.2015.0240
Keywords: infantile hemangioma, hemangioma-derived endothelial cell, amino acids, nontargeted metabolic, targeted metabolic
Citation: Yang K, Qiu T, Gong X, Zhou J, Lan Y, Chen S and Ji Y (2023) Integrated nontargeted and targeted metabolomics analyses amino acids metabolism in infantile hemangioma. Front. Oncol. 13:1132344. doi: 10.3389/fonc.2023.1132344
Received: 27 December 2022; Accepted: 13 March 2023;
Published: 21 March 2023.
Edited by:
Yong-mi Kim, Children’s Hospital of Los Angeles, United StatesReviewed by:
Lin Ma, Beijing Children’s Hospital, Capital Medical University, ChinaJia Wei Zheng, Shanghai Jiao Tong University, China
Copyright © 2023 Yang, Qiu, Gong, Zhou, Lan, Chen and Ji. This is an open-access article distributed under the terms of the Creative Commons Attribution License (CC BY). The use, distribution or reproduction in other forums is permitted, provided the original author(s) and the copyright owner(s) are credited and that the original publication in this journal is cited, in accordance with accepted academic practice. No use, distribution or reproduction is permitted which does not comply with these terms.
*Correspondence: Yi Ji, amlqaXl1YW55dWFuQDE2My5jb20=
†These authors have contributed equally to this work